Post Syndicated from Imtranur Rahman original https://aws.amazon.com/blogs/devops/enabling-devsecops-with-amazon-codecatalyst/
DevSecOps is the practice of integrating security testing at every stage of the software development process. Amazon CodeCatalyst includes tools that encourage collaboration between developers, security specialists, and operations teams to build software that is both efficient and secure. DevSecOps brings cultural transformation that makes security a shared responsibility for everyone who is building the software.
Introduction
In a prior post in this series, Maintaining Code Quality with Amazon CodeCatalyst Reports, I discussed how developers can quickly configure test cases, run unit tests, set up code coverage, and generate reports using CodeCatalyst’s workflow actions. This was done through the lens of Maxine, the main character of Gene Kim’s The Unicorn Project. In the story, Maxine meets Purna – the QA and Release Manager and Shannon – a Security Engineer. Everyone has the same common goal to integrate security into every stage of the Software Development Lifecycle (SDLC) to ensure secure code deployments. The issue Maxine faces is that security testing is not automated and the separation of responsibilities by role leads to project stagnation.
In this post, I will focus on how DevSecOps teams can use Amazon CodeCatalyst to easily integrate and automate security using CodeCatalyst workflows. I’ll start by checking for vulnerabilities using OWASP dependency checker and Mend SCA. Then, I’ll conduct Static Analysis (SA) of source code using Pylint. I will also outline how DevSecOps teams can influence the outcome of a build by defining success criteria for Software Composition Analysis (SCA) and Static Analysis actions in the workflow. Last, I’ll show you how to gain insights from CodeCatalyst reports and surface potential issues to development teams through CodeCatalyst Issues for faster remediation.
Prerequisites
If you would like to follow along with this walkthrough, you will need to:
- Have an AWS Builder ID for signing in to CodeCatalyst.
- Belong to a CodeCatalyst space and have the Space administrator role assigned to you in that space. For more information, see Creating a space in CodeCatalyst, Managing members of your space, and Space administrator role.
- Have an AWS account associated with your space and have the IAM role in that account. For more information about the role and role policy, see Creating a CodeCatalyst service role.
- Have a Mend Account (required for the optional Mend Section)
Walkthrough
To follow along, you can re-use a project you created previously, or you can refer to a previous post that walks through creating a project using the Modern Three-tier Web Application blueprint. Blueprints provide sample code and CI/CD workflows to help you get started easily across different combinations of programming languages and architectures. The back-end code for this project is written in Python and the front-end code is written in JavaScript.

Figure 1. Modern Three-tier Web Application architecture including a presentation, application and data layer
Once the project is deployed, CodeCatalyst opens the project overview. Select CI/CD → Workflows → ApplicationDeploymentPipeline to view the current workflow.

Figure 2. ApplicationDeploymentPipeline
Modern applications use a wide array of open-source dependencies to speed up feature development, but sometimes these dependencies have unknown exploits within them. As a DevSecOps engineer, I can easily edit this workflow to scan for those vulnerable dependencies to ensure I’m delivering secure code.
Software Composition Analysis (SCA)
Software composition analysis (SCA) is a practice in the fields of Information technology and software engineering for analyzing custom-built software applications to detect embedded open-source software and analyzes whether they are up-to-date, contain security flaws, or have licensing requirements. For this walkthrough, I’ll highlight two SCA methods:
- I’ll use the open-source OWASP Dependency-Check tool to scan for vulnerable dependencies in my application. It does this by determining if there is a Common Platform Enumeration (CPE) identifier for a given dependency. If found, it will generate a report linking to the associated Common Vulnerabilities and Exposures (CVE) entries.
- I’ll use CodeCatalyst’s Mend SCA Action to integrate Mend for SCA into my CI/CD workflow.
Note that developers can replace either of these with a tool of their choice so long as that tool outputs an SCA report format supported by CodeCatalyst.
Software Composition Analysis using OWASP Dependency Checker
To get started, I select Edit at the top-right of the workflows tab. By default, CodeCatalyst opens the YAML tab. I change to the Visual tab to visually edit the workflow and add a CodeCatalyst Action by selecting “+Actions” (1) and then “+” (2). Next select the Configuration (3) tab and edit the Action Name (4). Make sure to select the check mark after you’re done.

Figure 3. New Action Initial Configuration
Scroll down in the Configuration tab to Shell commands. Here, copy and paste the following command snippets that runs when action is invoked.
#Set Source Repo Directory to variable
- Run: sourceRepositoryDirectory=$(pwd)
#Install Node Dependencies
- Run: cd web && npm install
#Install known vulnerable dependency (This is for Demonstrative Purposes Only)
- Run: npm install [email protected]
#Go to parent directory and download OWASP dependency-check CLI tool
- Run: cd .. && wget https://github.com/jeremylong/DependencyCheck/releases/download/v8.1.2/dependency-check-8.1.2-release.zip
#Unzip file - Run: unzip dependency-check-8.1.2-release.zip
#Navigate to dependency-check script location
- Run: cd dependency-check/bin
#Execute dependency-check shell script. Outputs in SARIF format
- Run: ./dependency-check.sh --scan $sourceRepositoryDirectory/web -o $sourceRepositoryDirectory/web/vulnerabilities -f SARIF --disableYarnAudit
These commands will install the node dependencies, download the OWASP dependency-check tool, and run it to generate findings in a SARIF file. Note the third command, which installs a module with known vulnerabilities (This is for demonstrative purposes only).
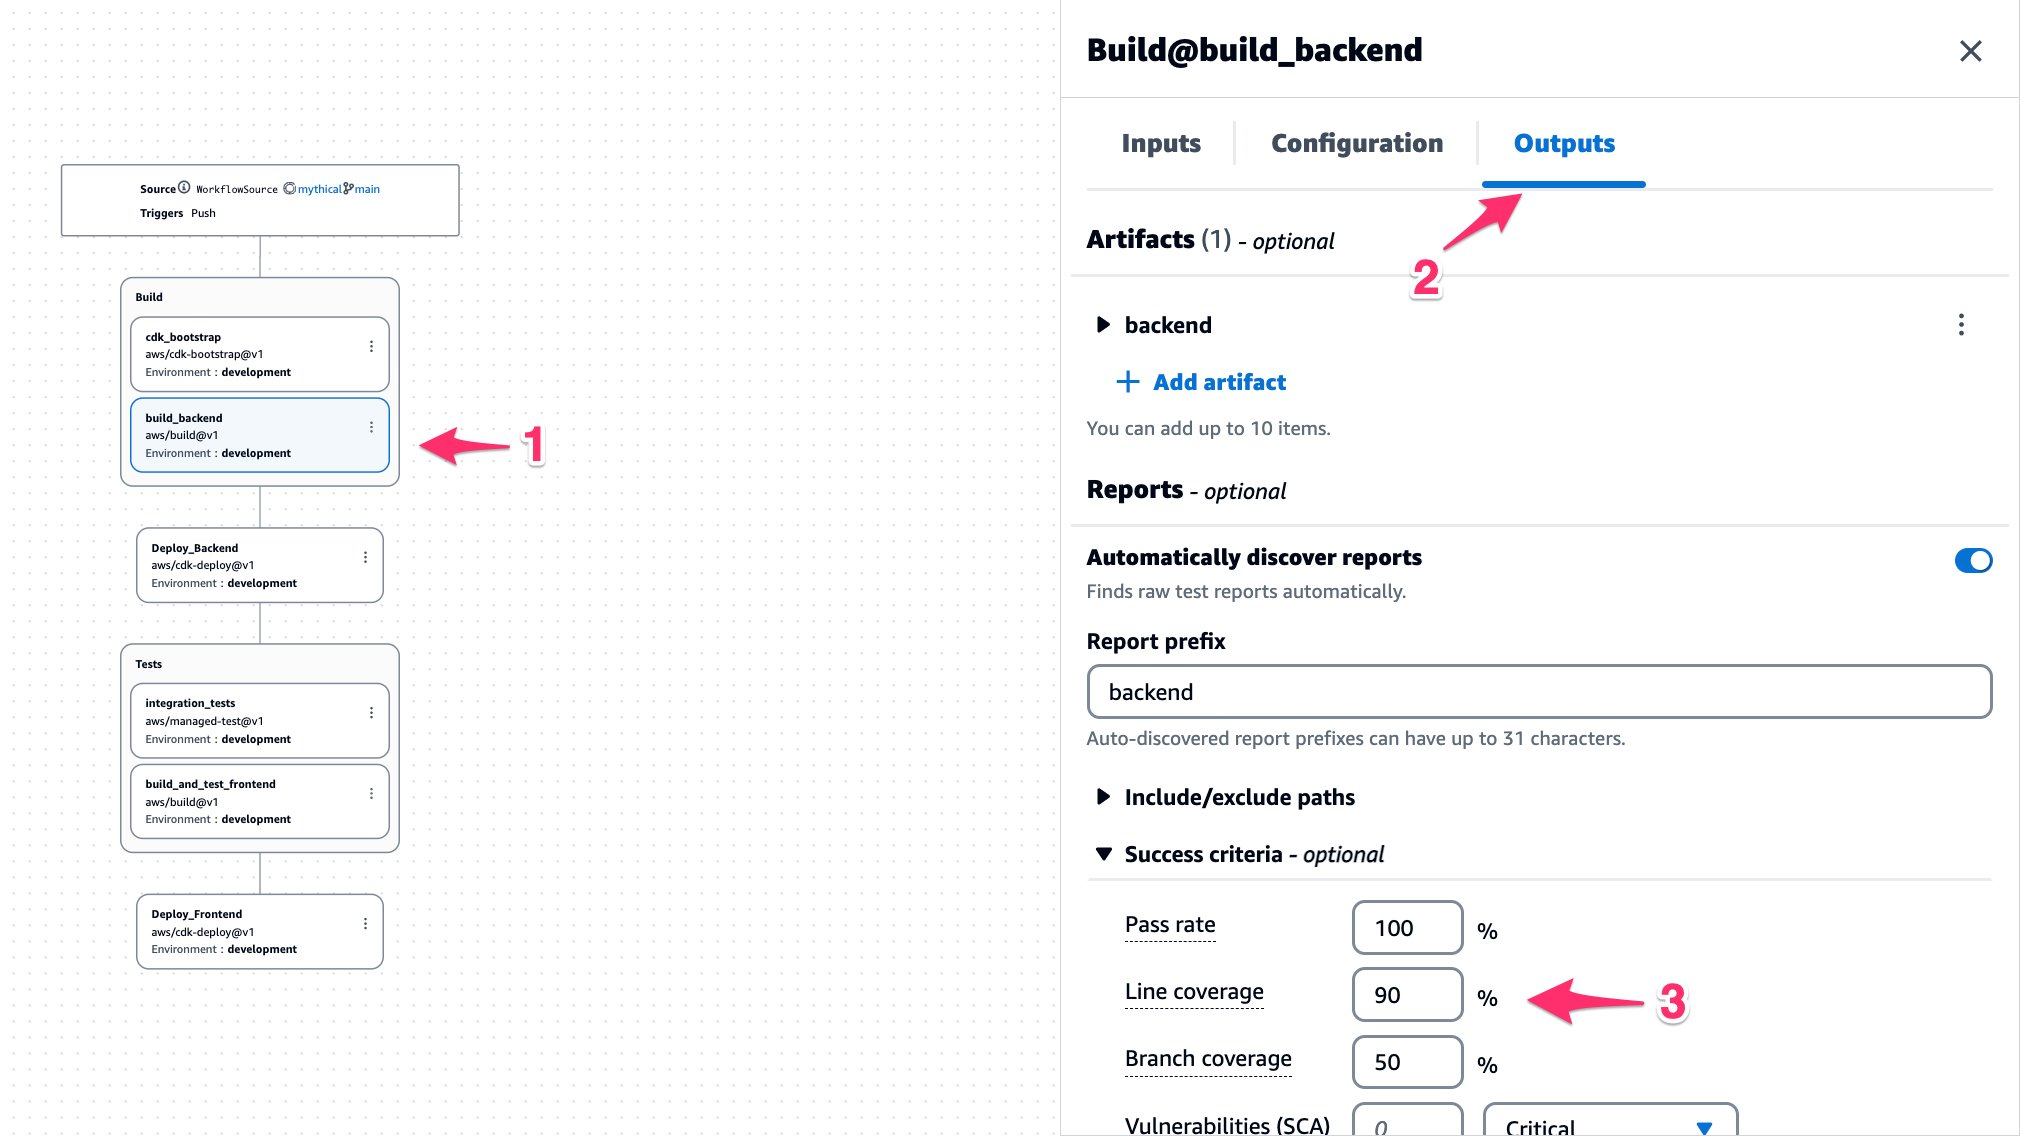
On the Outputs (1) tab, I change the Report prefix (2) to owasp-frontend. Then I set the Success criteria (3) for Vulnerabilities to 0 – Critical (4). This configuration will stop the workflow if any critical vulnerabilities are found.

Figure 4: owasp-dependecy-check-frontend
It is a best practice to scan for vulnerable dependencies before deploying resources so I’ll set my owasp-dependency-check-frontend action as the first step in the workflow. Otherwise, I might accidentally deploy vulnerable code. To do this, I select the Build (1) action group and set the Depends on (2) dropdown to my owasp-dependency-check-frontend action. Now, my action will run before any resources are built and deployed to my AWS environment. To save my changes and run the workflow, I select Commit (3) and provide a commit message.

Figure 5: Setting OWASP as the First Workflow Action
Amazon CodeCatalyst shows me the state of the workflow run in real-time. After the workflow completes, I see that the action has entered a failed state. If I were a QA Manager like Purna from the Unicorn Project, I would want to see why the action failed. On the lefthand navigation bar, I select the Reports → owasp-frontend-web/vulnerabilities/dependency-check-report.sarif for more details.

Figure 6: SCA Report Overview
This report view provides metadata such as the workflow name, run ID, action name, repository, and the commit ID. I can also see the report status, a bar graph of vulnerabilities grouped by severity, the number of libraries scanned, and a Findings panel. I had set the success criteria for this report to 0 – Critical so it failed because 1 Critical vulnerability was found. If I select a specific finding ID, I can learn more about that specific finding and even view it on the National Vulnerability Database website.

Figure 7: Critical Vulnerability CVE Finding
Now I can raise this issue with the development team through the Issues board on the left-hand navigation panel. See this previous post to learn more about how teams can collaborate in CodeCatalyst.
Note: Let’s remove [email protected] install from owasp-dependency-check-frontend action’s list of commands to allow the workflow to proceed and finish successfully.
Software Composition Analysis using Mend
Mend, formerly known as WhiteSource, is an application security company built to secure today’s digital world. Mend secures all aspects of software, providing automated remediation, prevention, and protection from problem to solution versus only detection and suggested fixes. Find more information about Mend here.
Mend Software Composition Analysis (SCA) can be run as an action within Amazon CodeCatalyst CI/CD workflows, making it easy for developers to perform open-source software vulnerability detection when building and deploying their software projects. This makes it easier for development teams to quickly build and deliver secure applications on AWS.
Getting started with CodeCatalyst and Mend is very easy. After logging in to my Mend Account, I need to create a new Mend Product named Amazon-CodeCatalyst and a Project named mythical-misfits.
Next, I navigate back to my existing workflow in CodeCatalyst and add a new action. However, this time I’ll select the Mend SCA action.

Figure 8: Mend Action
All I need to do now is go to the Configuration tab and set the following values:
- Mend Project Name: mythical-misfits
- Mend Product Name: Amazon-CodeCatalyst
- Mend License Key: You can get the License Key from your Mend account in the CI/CD Integration section. You can get more information from here.

Figure 9: Mend Action Configuration
Then I commit the changes and return to Mend.

Figure 10: Mend Console
After successful execution, Mend will automatically update and show a report similar to the screenshot above. It contains useful information about this project like vulnerabilities, licenses, policy violations, etc. To learn more about the various capabilities of Mend SCA, see the documentation here.
Static Analysis (SA)
Static analysis, also called static code analysis, is a method of debugging that is done by examining the code without executing the program. The process provides an understanding of the code structure and can help ensure that the code adheres to industry standards. Static analysis is used in software engineering by software development and quality assurance teams.
Currently, my workflow does not do static analysis. As a DevSecOps engineer, I can add this as a step to the workflow. For this walkthrough, I’ll create an action that uses Pylint to scan my Python source code for Static Analysis. Note that you can also use other static analysis tools or a GitHub Action like SuperLinter, as covered in this previous post.
Static Analysis using Pylint
After navigating back to CI/CD → Workflows → ApplicationDeploymentPipeline and selecting Edit, I create a new test action. I change the action name to pylint and set the Configuration tab to run the following shell commands:
- Run: pip install pylint
- Run: pylint $PWD --recursive=y --output-format=json:pylint-report.json --exit-zero
On the Outputs tab, I change the Report prefix to pylint. Then I set the Success criteria for Static analysis as shown in the figure below:

Figure 11: Static Analysis Report Configuration
Being that Static Analysis is typically run before any execution, the pylint or OWASP action should be the very first action in the workflow. For the sake of this blog we will use pylint. I select the OWASP or Mend actions I created before, set the Depends on dropdown to my pylint action, and commit the changes. Once the workflow finishes, I can go to Reports > pylint-pylint-report.json for more details.

Figure 12: Pylint Static Analysis Report
The Report status is Failed because more than 1 high-severity or above bug was detected. On the Results tab I can view each finding in greater detail, including the severity, type of finding, message from the linter, and which specific line the error originates from.
Cleanup
If you have been following along with this workflow, you should delete the resources you deployed so you do not continue to incur charges. First, delete the two stacks that AWS Cloud Development Kit (CDK) deployed using the AWS CloudFormation console in the AWS account you associated when you launched the blueprint. These stacks will have names like mysfitsXXXXXWebStack and mysfitsXXXXXAppStack. Second, delete the project from CodeCatalyst by navigating to Project settings and choosing Delete project.
Conclusion
In this post, I demonstrated how DevSecOps teams can easily integrate security into Amazon CodeCatalyst workflows to automate security testing by checking for vulnerabilities using OWASP dependency checker or Mend through Software Composition Analysis (SCA) of dependencies. I also outlined how DevSecOps teams can configure Static Analysis (SA) reports and use success criteria to influence the outcome of a workflow action.