Post Syndicated from Kishore Dhamodaran original https://aws.amazon.com/blogs/devops/proactive-insights-with-amazon-devops-guru-for-rds/
Today, we are pleased to announce a new Amazon DevOps Guru for RDS capability: Proactive Insights. DevOps Guru for RDS is a fully-managed service powered by machine learning (ML), that uses the data collected by RDS Performance Insights to detect and alert customers of anomalous behaviors within Amazon Aurora databases. Since its release, DevOps Guru for RDS has empowered customers with information to quickly react to performance problems and to take corrective actions. Now, Proactive Insights adds recommendations related to operational issues that may prevent potential issues in the future.
Proactive Insights requires no additional set up for customers already using DevOps Guru for RDS, for both Amazon Aurora MySQL-Compatible Edition and Amazon Aurora PostgreSQL-Compatible Edition.
The following are example use cases of operational issues available for Proactive Insights today, with more insights coming over time:
- Long InnoDB History for Aurora MySQL-Compatible engines – Triggered when the InnoDB history list length becomes very large.
- Temporary tables created on disk for Aurora MySQL-Compatible engines – Triggered when the ratio of temporary tables created versus all temporary tables breaches a threshold.
- Idle In Transaction for Aurora PostgreSQL-Compatible engines – Triggered when sessions connected to the database are not performing active work, but can keep database resources blocked.
To get started, navigate to the Amazon DevOps Guru Dashboard where you can see a summary of your system’s overall health, including ongoing proactive insights. In the following screen capture, the number three indicates that there are three ongoing proactive insights. Click on that number to see the listing of the corresponding Proactive Insights, which may include RDS or other Proactive Insights supported by Amazon DevOps Guru.

Figure 1. Amazon DevOps Guru Dashboard where you can see a summary of your system’s overall health, including ongoing proactive insights.
Ongoing problems (including reactive and proactive insights) are also highlighted against your database instance on the Database list page in the Amazon RDS console.

Figure 2. Proactive and Reactive Insights are highlighted against your database instance on the Database list page in the Amazon RDS console.
In the following sections, we will dive deep on these use cases of DevOps Guru for RDS Proactive Insights.
Long InnoDB History for Aurora MySQL-Compatible engines
The InnoDB history list is a global list of the undo logs for committed transactions. MySQL uses the history list to purge records and log pages when transactions no longer require the history. If the InnoDB history list length grows too large, indicating a large number of old row versions, queries and even the database shutdown process can become slower.
DevOps Guru for RDS now detects when the history list length exceeds 1 million records and alerts users to close (either by commit or by rollback) any unnecessary long-running transactions before triggering database changes that involve a shutdown (this includes reboots and database version upgrades).
From the DevOps Guru console, navigate to Insights, choose Proactive, then choose “RDS InnoDB History List Length Anomalous” Proactive Insight with an ongoing status. You will notice that Proactive Insights provides an “Insight overview”, “Metrics” and “Recommendations”.
Insight overview provides you basic information on this insight. In our case, the history list for row changes increased significantly, which affects query and shutdown performance.

Figure 3. Long InnoDB History for Aurora MySQL-Compatible engines Insight overview.
The Metrics panel gives you a graphical representation of the history list length and the timeline, allowing you to correlate it with any anomalous application activity that may have occurred during this window.
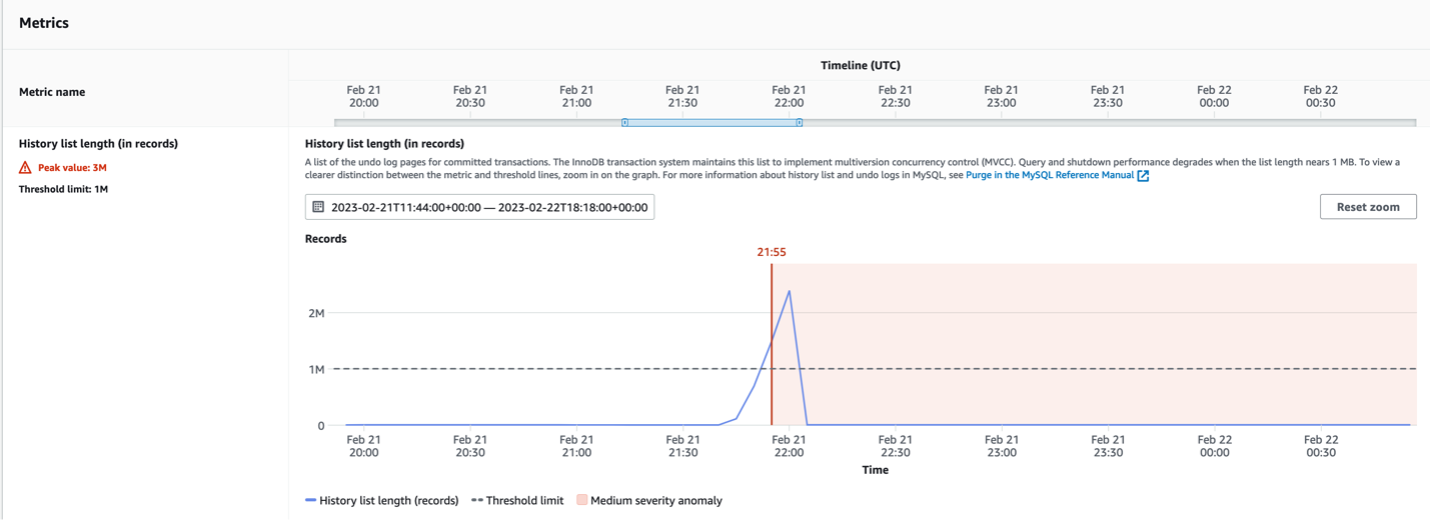
Figure 4. Long InnoDB History for Aurora MySQL-Compatible engines Metrics panel.
The Recommendations section suggests actions that you can take to mitigate this issue before it leads to a bigger problem. You will also notice the rationale behind the recommendation under the “Why is DevOps Guru recommending this?” column.
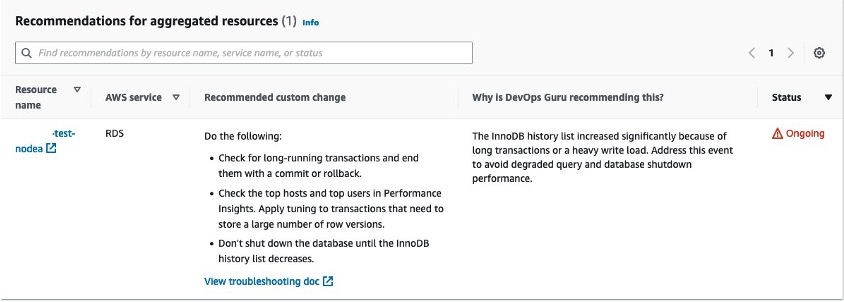
Figure 5. The Recommendations section suggests actions that you can take to mitigate this issue before it leads to a bigger problem.
Temporary tables created on disk for Aurora MySQL-Compatible engines
Sometimes it is necessary for the MySQL database to create an internal temporary table while processing a query. An internal temporary table can be held in memory and processed by the TempTable or MEMORY storage engine, or stored on disk by the InnoDB storage engine. An increase of temporary tables created on disk instead of in memory can impact the database performance.
DevOps Guru for RDS now monitors the rate at which the database creates temporary tables and the percentage of those temporary tables that use disk. When these values cross recommended levels over a given period of time, DevOps Guru for RDS creates an insight exposing this situation before it becomes critical.
From the DevOps Guru console, navigate to Insights, choose Proactive, then choose “RDS Temporary Tables On Disk Anomalous” Proactive Insight with an ongoing status. You will notice this Proactive Insight provides an “Insight overview”, “Metrics” and “Recommendations”.
Insight overview provides you basic information on this insight. In our case, more than 58% of the total temporary tables created per second were using disk, with a sustained rate of two temporary tables on disk created every second, which indicates that query performance is degrading.

Figure 6. Temporary tables created on disk insight overview.
The Metrics panel shows you a graphical representation of the information specific for this insight. You will be presented with the evolution of the amount of temporary tables created on disk per second, the percentage of temporary tables on disk (out of the total number of database-created temporary tables), and of the overall rate at which the temporary tables are created (per second).
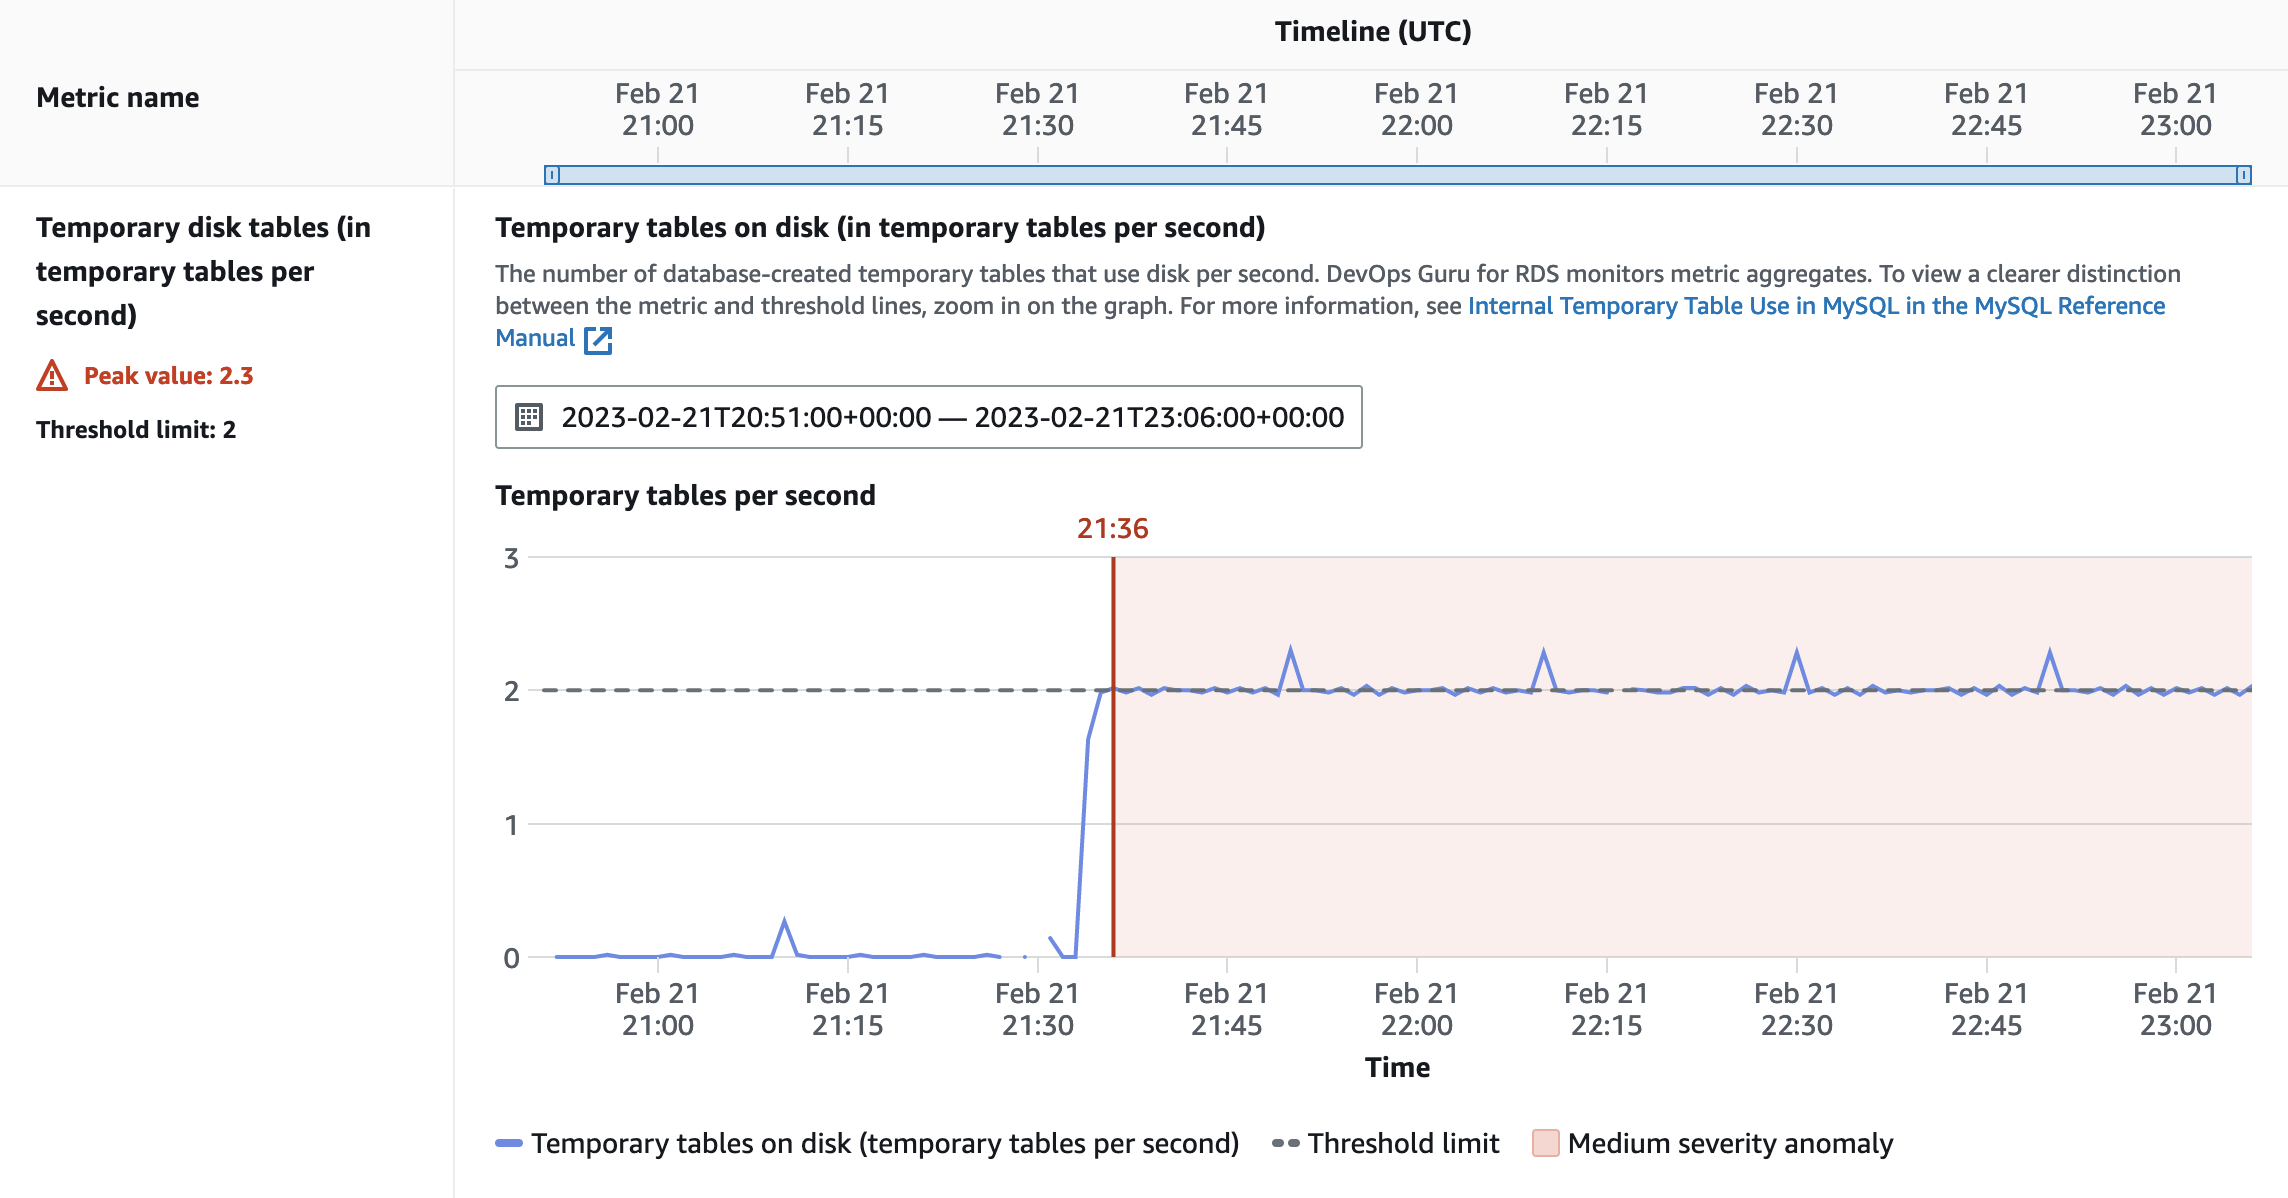
Figure 7. Temporary tables created on disk – evolution of the amount of temporary tables created on disk per second.

Figure 8. Temporary tables created on disk – the percentage of temporary tables on disk (out of the total number of database-created temporary tables).

Figure 9. Temporary tables created on disk – overall rate at which the temporary tables are created (per second).
The Recommendations section suggests actions to avoid this situation when possible, such as not using BLOB and TEXT data types, tuning tmp_table_size and max_heap_table_size database parameters, data set reduction, columns indexing and more.
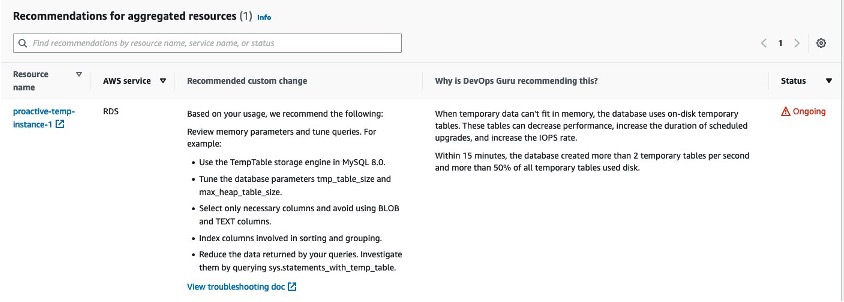
Figure 10. Temporary tables created on disk – actions to avoid this situation when possible, such as not using BLOB and TEXT data types, tuning tmp_table_size and max_heap_table_size database parameters, data set reduction, columns indexing and more.
Additional explanations on this use case can be found by clicking on the “View troubleshooting doc” link.
Idle In Transaction for Aurora PostgreSQL-Compatible engines
A connection that has been idle in transaction for too long can impact performance by holding locks, blocking other queries, or by preventing VACUUM (including autovacuum) from cleaning up dead rows.
PostgreSQL database requires periodic maintenance, which is known as vacuuming. Autovacuum in PostgreSQL automates the execution of VACUUM and ANALYZE commands. This process gathers the table statistics and deletes the dead rows. When vacuuming does not occur, this negatively impacts the database performance. It leads to an increase in table and index bloat (the disk space that was used by a table or index and is available for reuse by the database but has not been reclaimed), leads to stale statistics and can even end in transaction wraparound (when the number of unique transaction ids reaches its maximum of about two billion).
DevOps Guru for RDS monitors the time spent by sessions in an Aurora PostgreSQL database in idle in transaction state and raises initially a warning notification, followed by an alarm notification if the idle in transaction state continues (the current thresholds are 1800 seconds for the warning and 3600 seconds for the alarm).
From the DevOps Guru console, navigate to Insights, choose Proactive, then choose “RDS Idle In Transaction Max Time Anomalous” Proactive Insight with an ongoing status. You will notice this Proactive Insights provides an “Insight overview”, “Metrics” and “Recommendations”.
In our case, a connection has been in “idle in transaction” state for more than 1800 seconds, which could impact the database performance.

Figure 11. A connection has been in “idle in transaction” state for more than 1800 seconds, which could impact the database performance.
The Metrics panel shows you a graphical representation of when the long-running “idle in transaction” connections started.

Figure 12. The Metrics panel shows you a graphical representation of when the long-running “idle in transaction” connections started.
As with the other insights, recommended actions are listed and a troubleshooting doc is linked for even more details on this use case.
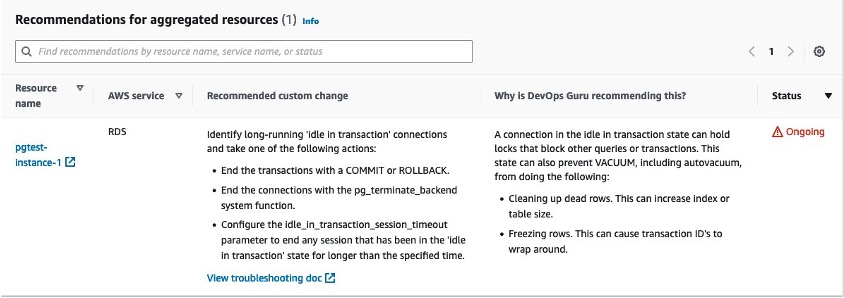
Figure 13. Recommended actions are listed and a troubleshooting doc is linked for even more details on this use case.
Conclusion
With Proactive Insights, DevOpsGuru for RDS enhances its abilities to help you monitor your databases by notifying you about potential operational issues, before they become bigger problems down the road. To get started, you need to ensure that you have enabled Performance Insights on the database instance(s) you want monitored, as well as ensure and confirm that DevOps Guru is enabled to monitor those instances (for example by enabling it at account level, by monitoring specific CloudFormation stacks or by using AWS tags for specific Aurora resources). Proactive Insights is available in all regions where DevOps Guru for RDS is supported. To learn more about Proactive Insights, join us for a free hands-on Immersion Day (available in three time zones) on March 15th or April 12th.
About the authors: