Post Syndicated from Kishore Dhamodaran original https://aws.amazon.com/blogs/big-data/interact-with-apache-iceberg-tables-using-amazon-athena-and-cross-account-fine-grained-permissions-using-aws-lake-formation/
We recently announced support for AWS Lake Formation fine-grained access control policies in Amazon Athena queries for data stored in any supported file format using table formats such as Apache Iceberg, Apache Hudi and Apache Hive. AWS Lake Formation allows you to define and enforce database, table, and column-level access policies to query Iceberg tables stored in Amazon S3. Lake Formation provides an authorization and governance layer on data stored in Amazon S3. This capability requires that you upgrade to Athena engine version 3.
Large organizations often have lines of businesses (LoBs) that operate with autonomy in managing their business data. It makes sharing data across LoBs non-trivial. These organizations have adopted a federated model, with each LoB having the autonomy to make decisions on their data. They use the publisher/consumer model with a centralized governance layer that is used to enforce access controls. If you are interested in learning more about data mesh architecture, visit Design a data mesh architecture using AWS Lake Formation and AWS Glue. With Athena engine version 3, customers can use the same fine-grained controls for open data frameworks such as Apache Iceberg, Apache Hudi, and Apache Hive.
In this post, we deep dive into a use-case where you have a producer/consumer model with data sharing enabled to give restricted access to an Apache Iceberg table that the consumer can query. We’ll discuss column filtering to restrict certain rows, filtering to restrict column level access, schema evolution, and time travel.
Solution overview
To illustrate the functionality of fine-grained permissions for Apache Iceberg tables with Athena and Lake Formation, we set up the following components:
- In the producer account:
- An AWS Glue Data Catalog to register the schema of a table in Apache Iceberg format
- Lake Formation to provide fine-grained access to the consumer account
- Athena to verify data from the producer account
- In the consumer account:
- AWS Resource Access Manager (AWS RAM) to create a handshake between the producer Data Catalog and consumer
- Lake Formation to provide fine-grained access to the consumer account
- Athena to verify data from producer account
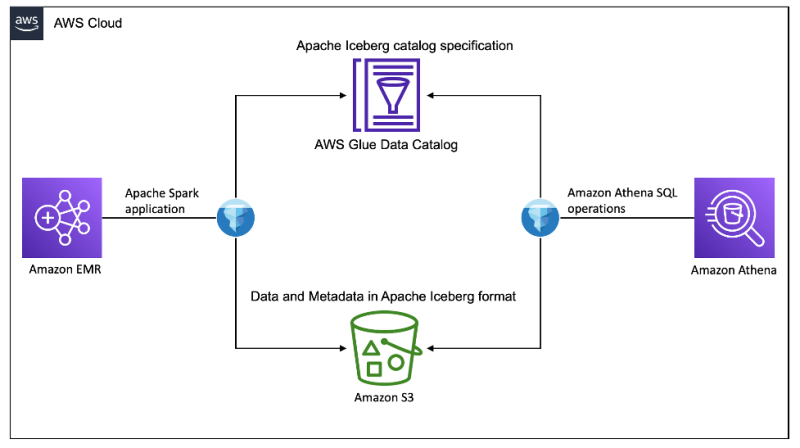
The following diagram illustrates the architecture.

Prerequisites
Before you get started, make sure you have the following:
- Two AWS accounts, one will act as a producer and other as a consumer
- An understanding of AWS LakeFormation and a user that can act as a Lake Formation admin
- An AWS Identity and Access Management (IAM) role with permissions to create S3 buckets, AWS Glue data catalog, AWS Resource Access Manager, and run SQL queries using Amazon Athena (see Adding and removing IAM identity permissions for reference)
- Any workgroup with Athena engine version 3. For this blog our “primary” workgroup is using Athena engine version 3.
Data producer setup
In this section, we present the steps to set up the data producer.
Create an S3 bucket to store the table data
We create a new S3 bucket to save the data for the table:
- On the Amazon S3 console, create an S3 bucket with unique name (for this post, we use
iceberg-athena-lakeformation-blog). - Create the producer folder inside the bucket to use for the table.

Register the S3 path storing the table using Lake Formation
We register the S3 full path in Lake Formation:
- Navigate to the Lake Formation console.
- If you’re logging in for the first time, you’re prompted to create an admin user.

- In the navigation pane, under Register and ingest, choose Data lake locations.
- Choose Register location, and provide the S3 bucket path that you created earlier.
- Choose
AWSServiceRoleForLakeFormationDataAccessfor IAM role.

For additional information about roles, refer to Requirements for roles used to register locations.
If you enabled encryption of your S3 bucket, you have to provide permissions for Lake Formation to perform encryption and decryption operations. Refer to Registering an encrypted Amazon S3 location for guidance.
- Choose Register location.

Create an Iceberg table using Athena
Now let’s create the table using Athena backed by Apache Iceberg format:
- On the Athena console, choose Query editor in the navigation pane.
- If you’re using Athena for the first time, under Settings, choose Manage and enter the S3 bucket location that you created earlier (
iceberg-athena-lakeformation-blog/producer). - Choose Save.
- In the query editor, enter the following query (replace the location with the S3 bucket that you registered with Lake Formation). Note that we use the default database, but you can use any other database.
- Choose Run.

Share the table with the consumer account
To illustrate functionality, we implement the following scenarios:
- Provide access to selected columns
- Provide access to selected rows based on a filter
Complete the following steps:
- On the Lake Formation console, in the navigation pane under Data catalog, choose Data filters.
- Choose Create new filter.
- For Data filter name, enter
blog_data_filter. - For Target database, enter
lf-demo-db. - For Target table, enter
consumer_iceberg. - For Column-level access, select Include columns.
- Choose the columns to share with the consumer:
country, address, contactfirstname, city, customerid,andcustomername. - For Row filter expression, enter the filter
country='France'. - Choose Create filter.

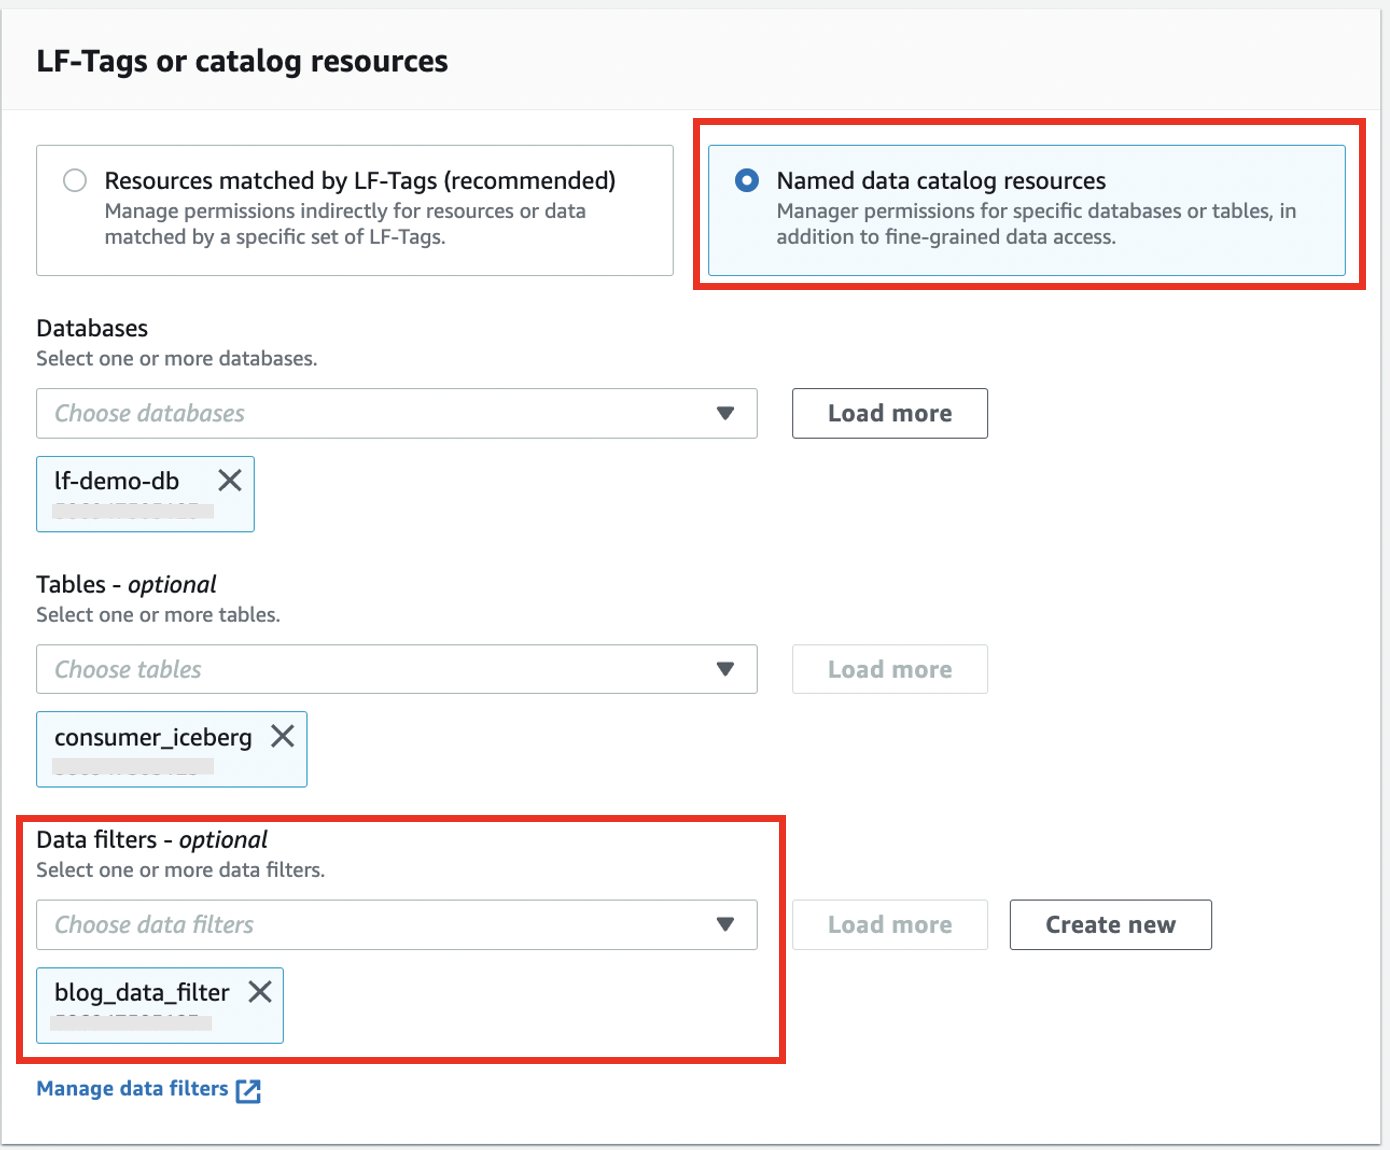
Now let’s grant access to the consumer account on the consumer_iceberg table.
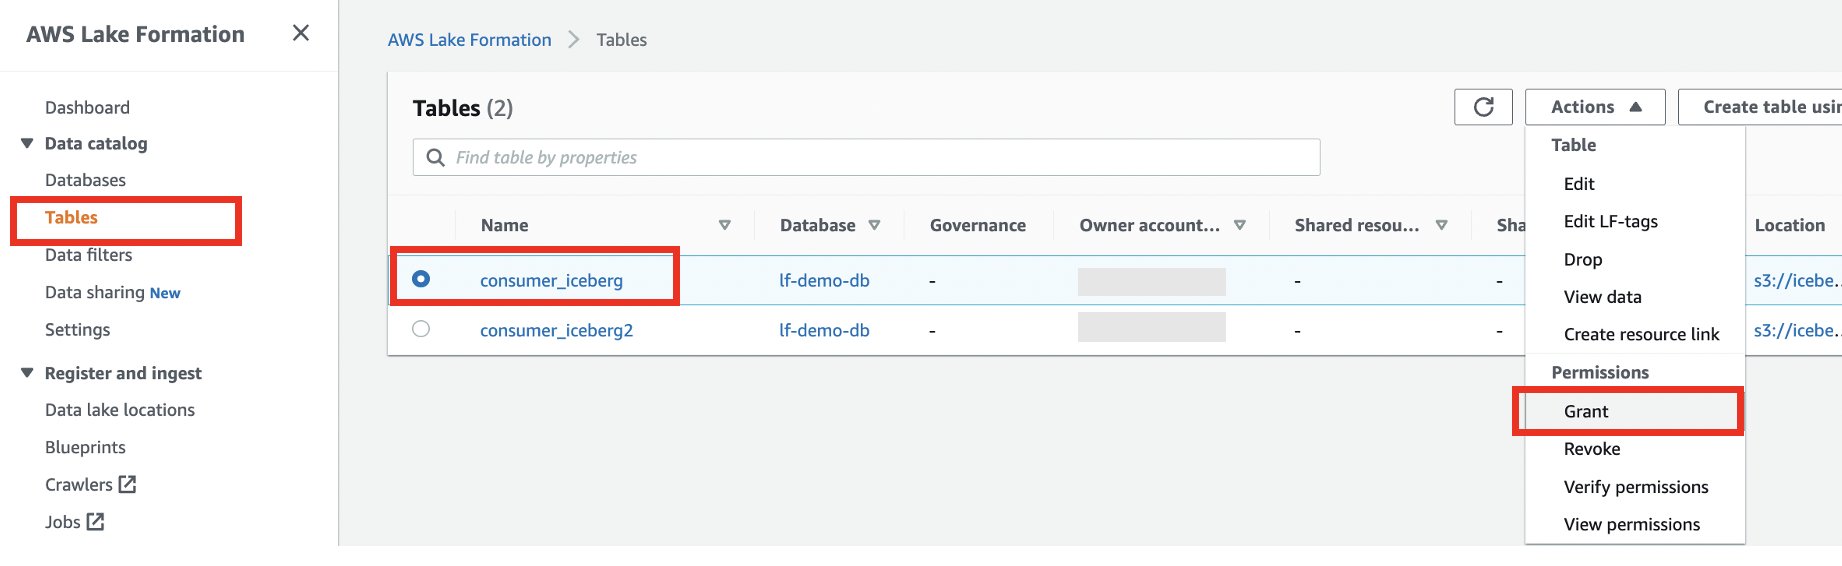
- In the navigation pane, choose Tables.
- Select the consumer_iceberg table, and choose Grant on the Actions menu.

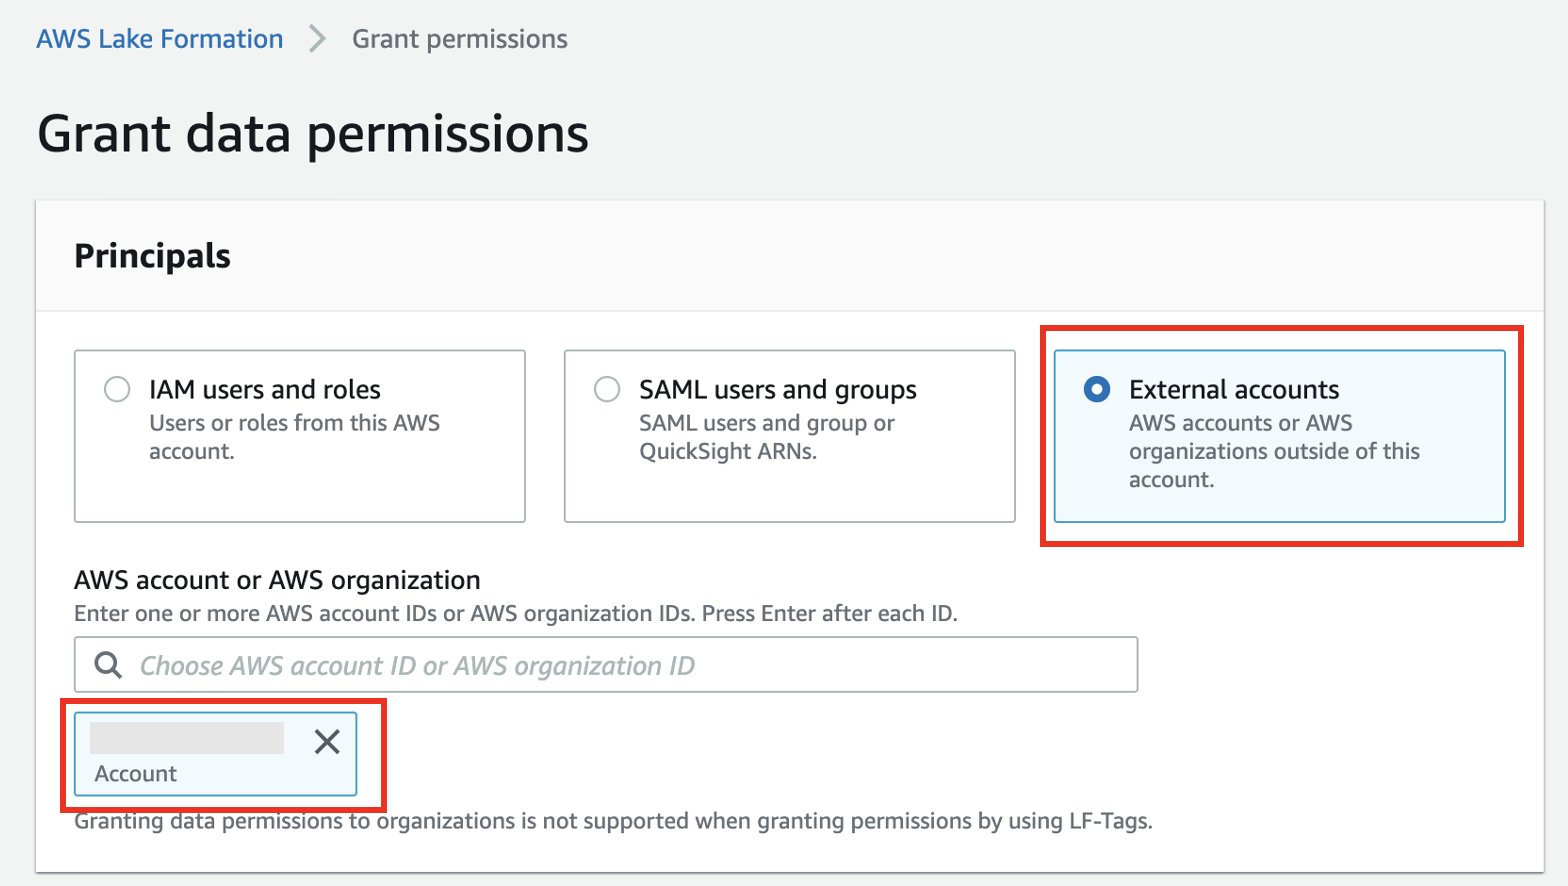
- Select External accounts.
- Enter the external account ID.

- Select Named data catalog resources.
- Choose your database and table.
- For Data filters, choose the data filter you created.

- For Data filter permissions and Grantable permissions, select Select.
- Choose Grant.

Data consumer setup
To set up the data consumer, we accept the resource share and create a table using AWS RAM and Lake Formation. Complete the following steps:
- Log in to the consumer account and navigate to the AWS RAM console.
- Under Shared with me in the navigation pane, choose Resource shares.
- Choose your resource share.

- Choose Accept resource share.
- Note the name of the resource share to use in the next steps.

- Navigate to the Lake Formation console.
- If you’re logging in for the first time, you’re prompted to create an admin user.
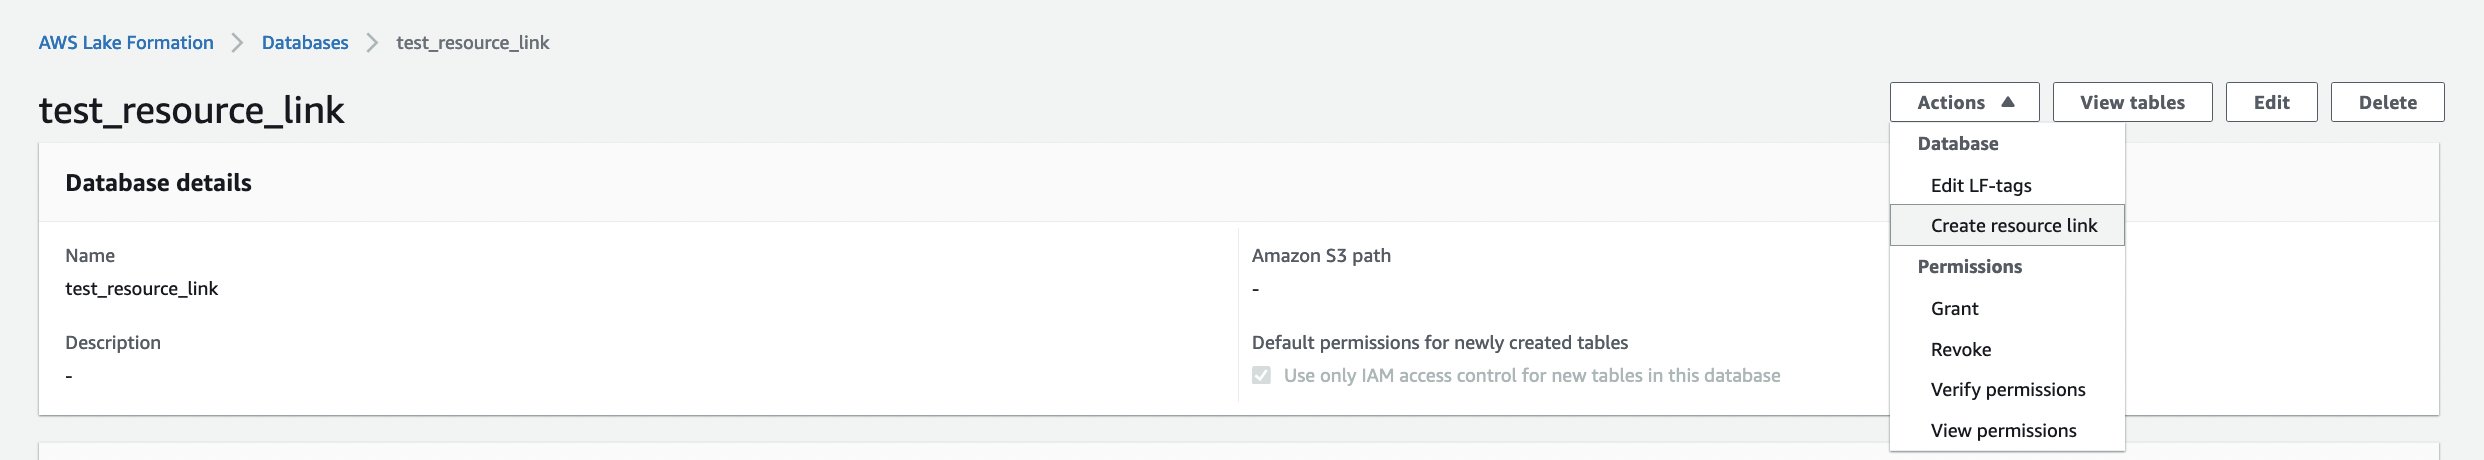
- Choose Databases in the navigation pane, then choose your database.
- On the Actions menu, choose Create resource link.

- For Resource link name, enter the name of your resource link (for example,
consumer_iceberg). - Choose your database and shared table.
- Choose Create.


Validate the solution
Now we can run different operations on the tables to validate the fine-grained access controls.
Insert operation
Let’s insert data into the consumer_iceberg table in the producer account, and validate the data filtering works as expected in the consumer account.
- Log in to the producer account.
- On the Athena console, choose Query editor in the navigation pane.
- Use the following SQL to write and insert data into the Iceberg table. Use the Query editor to run one query at a time. You can highlight/select one query at a time and click “Run”/“Run again:

- Use the following SQL to read and select data in the Iceberg table:
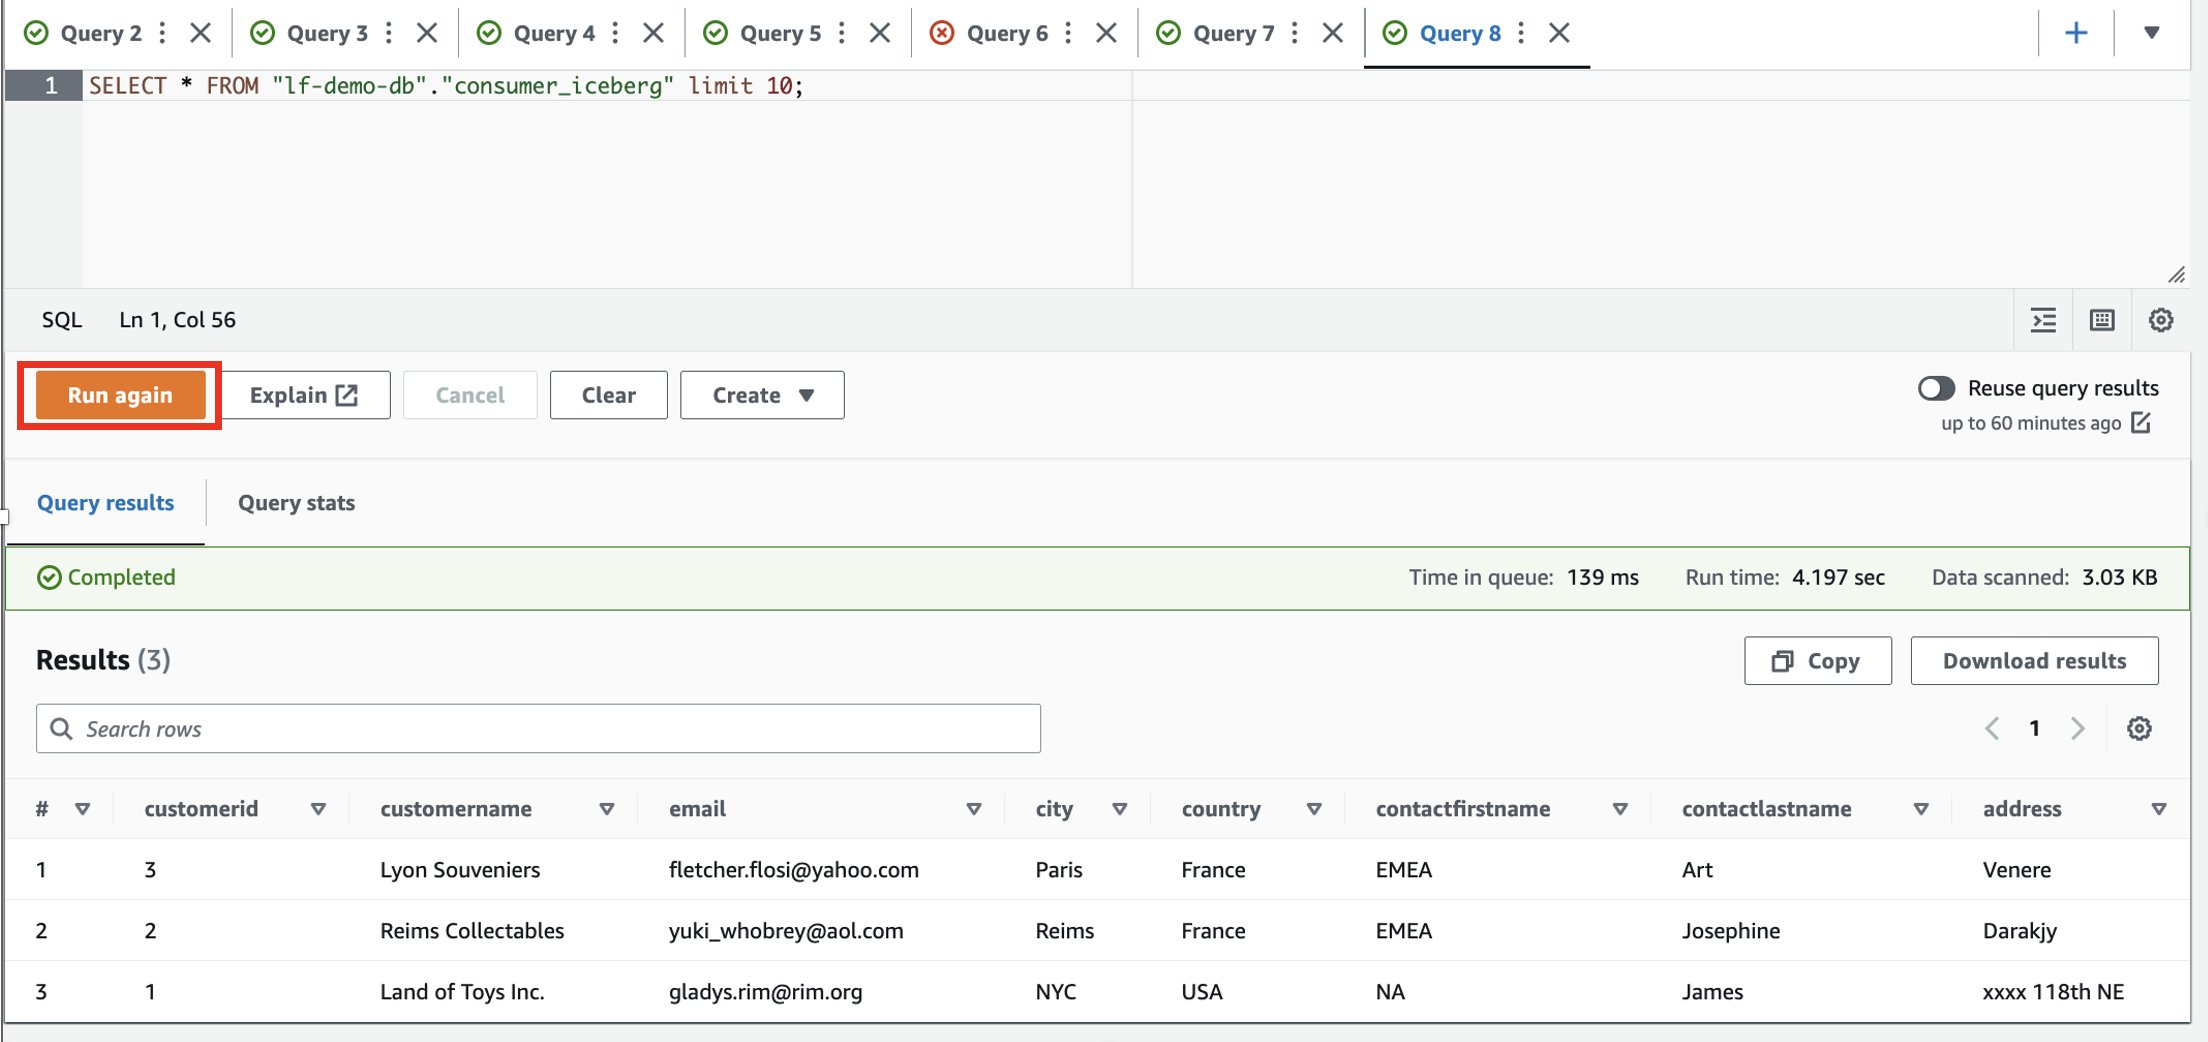
- Log in to the consumer account.
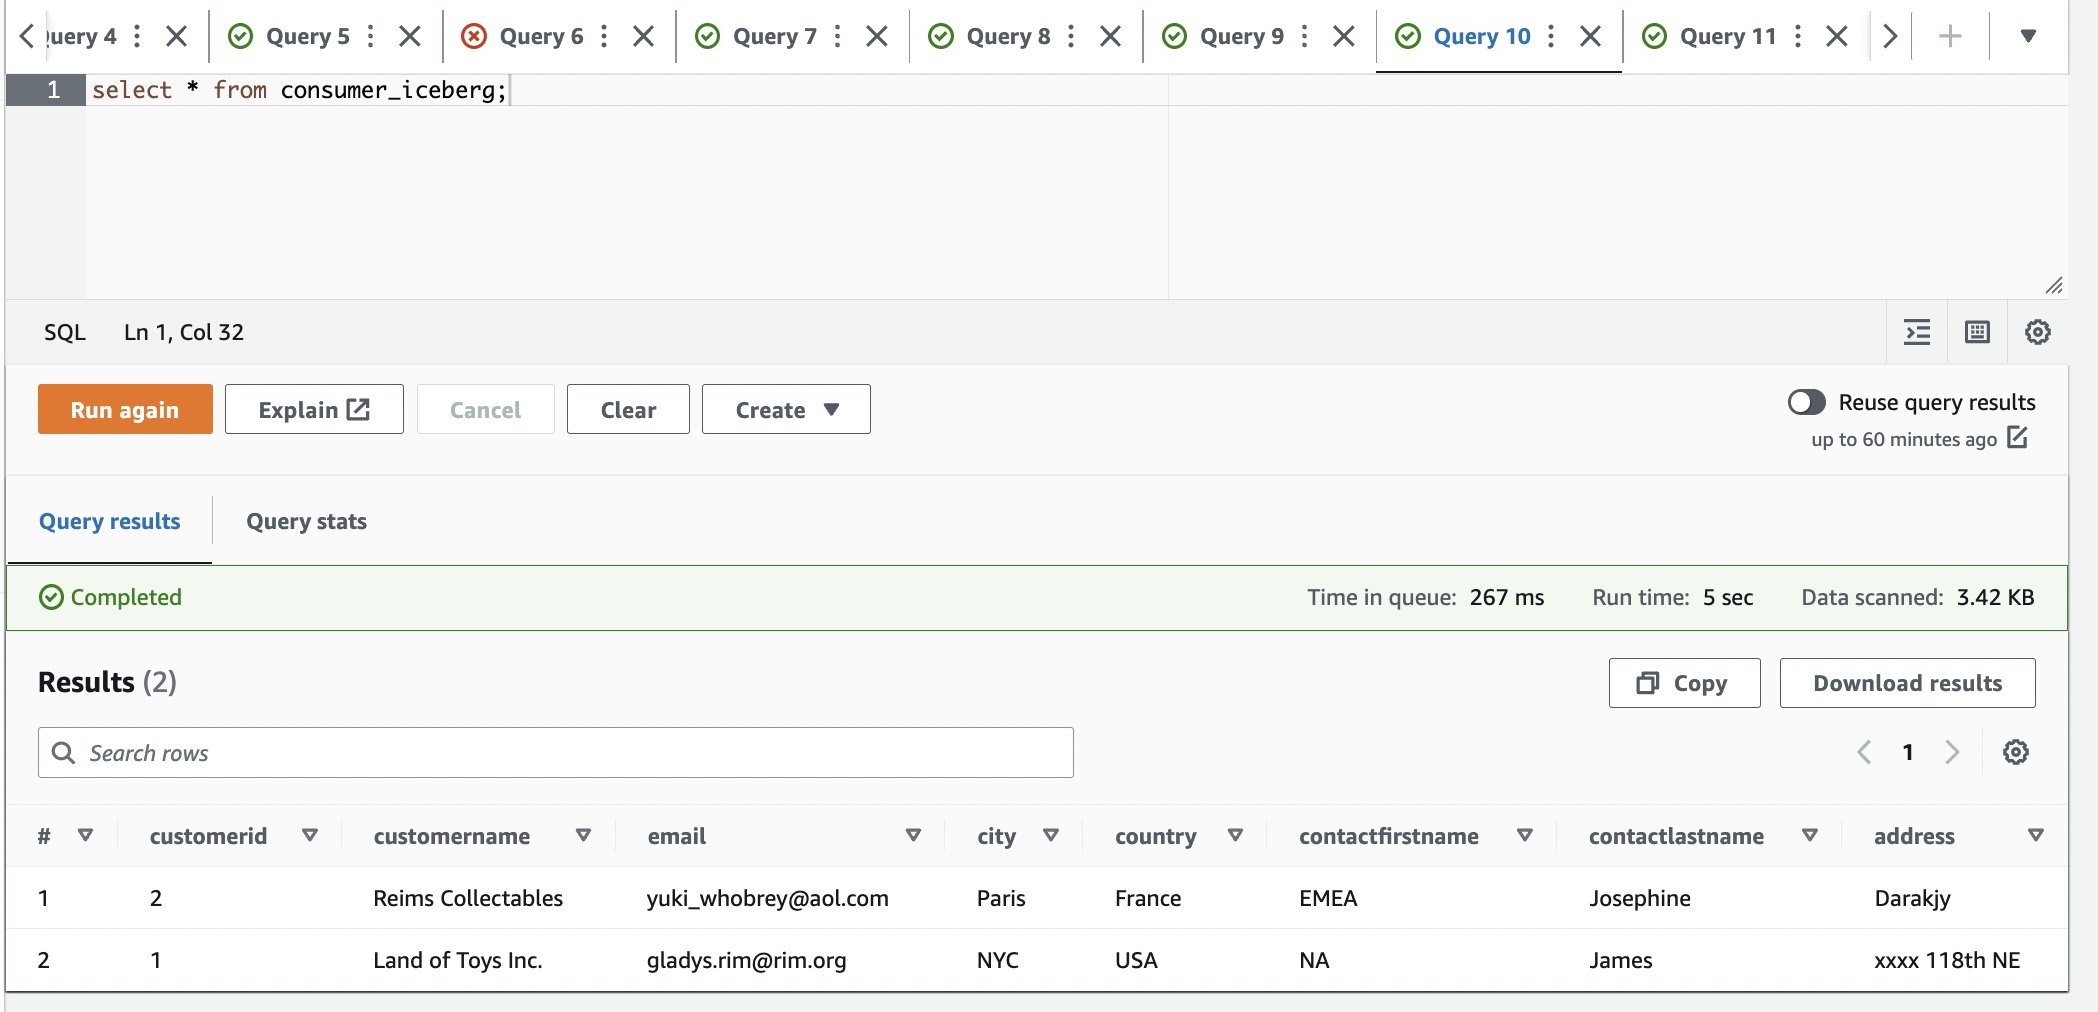
- In the Athena query editor, run the following SELECT query on the shared table:

Based on the filters, the consumer has visibility to a subset of columns, and rows where the country is France.
Update/Delete operations
Now let’s update one of the rows and delete one from the dataset shared with the consumer.
- Log in to the producer account.
- Update
city='Paris' WHERE city='Reims'and delete the rowcustomerid = 3;

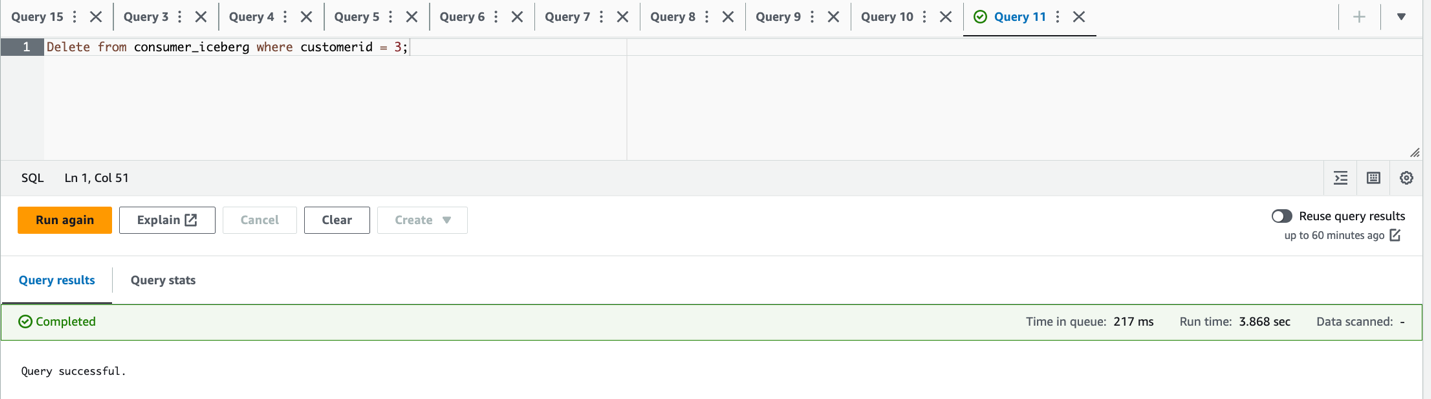
- Verify the updated and deleted dataset:
- Log in to the consumer account.
- In the Athena query editor, run the following SELECT query on the shared table:

We can observe that only one row is available and the city is updated to Paris.
Schema evolution: Add a new column
Let’s update one of the rows and delete one from the dataset shared with the consumer.
- Log in to the producer account.
- Add a new column called
geo_locin the Iceberg table. Use the Query editor to run one query at a time. You can highlight/select one query at a time and click “Run”/“Run again:

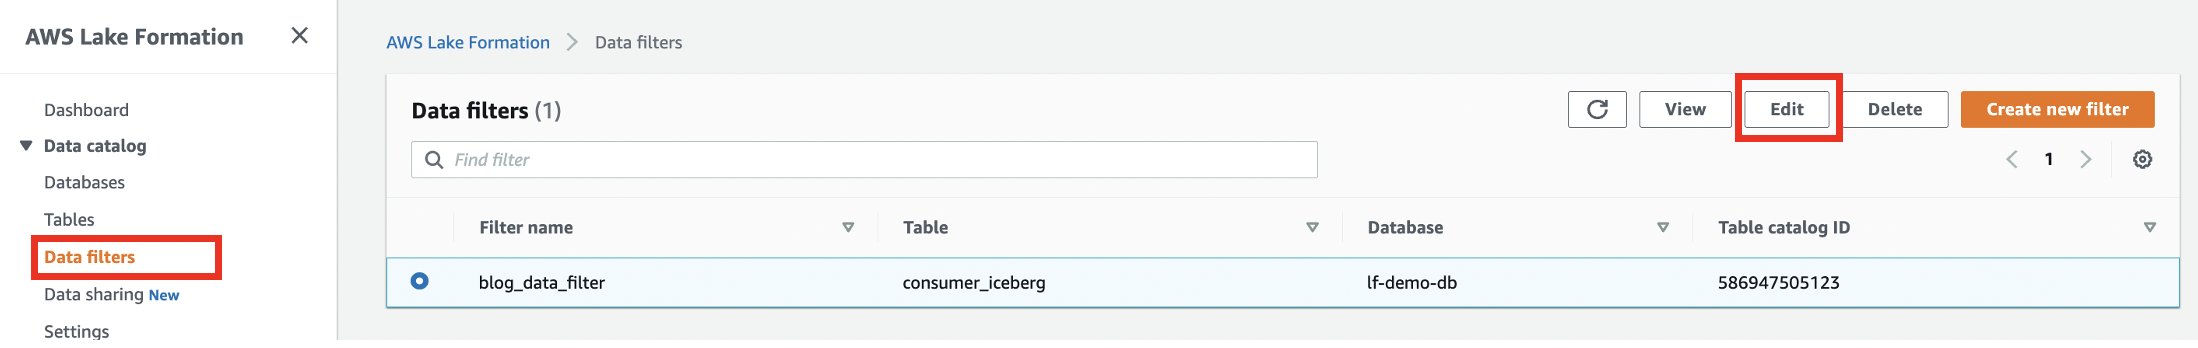
To provide visibility to the newly added geo_loc column, we need to update the Lake Formation data filter.
- On the Lake Formation console, choose Data filters in the navigation pane.
- Select your data filter and choose Edit.

- Under Column-level access, add the new column (
geo_loc). - Choose Save.

- Log in to the consumer account.
- In the Athena query editor, run the following
SELECTquery on the shared table:

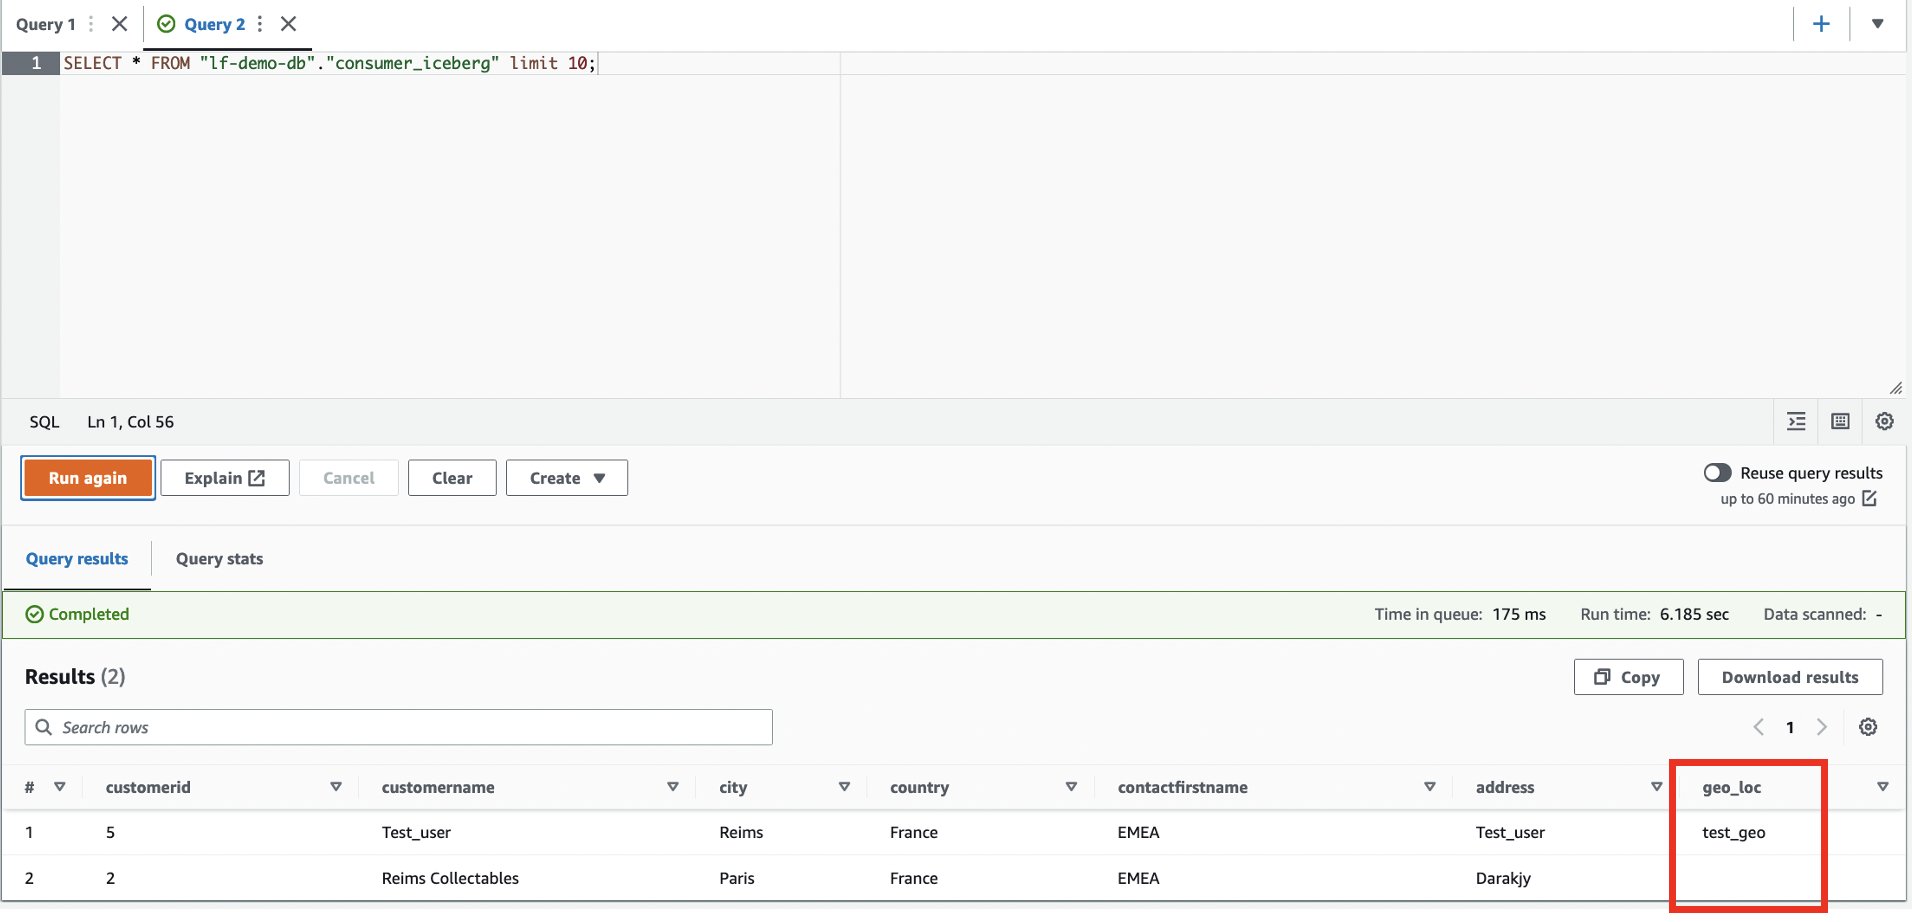
The new column geo_loc is visible and an additional row.
Schema evolution: Delete column
Let’s update one of the rows and delete one from the dataset shared with the consumer.
- Log in to the producer account.
- Alter the table to drop the address column from the Iceberg table. Use the Query editor to run one query at a time. You can highlight/select one query at a time and click “Run”/“Run again:

We can observe that the column address is not present in the table.
- Log in to the consumer account.
- In the Athena query editor, run the following SELECT query on the shared table:

The column address is not present in the table.
Time travel
We have now changed the Iceberg table multiple times. The Iceberg table keeps track of the snapshots. Complete the following steps to explore the time travel functionality:
- Log in to the producer account.
- Query the system table:
We can observe that we have generated multiple snapshots.
- Note down one of the
committed_atvalues to use in the next steps (for this example,2023-01-29 21:35:02.176 UTC).

- Use time travel to find the table snapshot. Use the Query editor to run one query at a time. You can highlight/select one query at a time and click “Run”/“Run again:


Clean up
Complete the following steps to avoid incurring future charges:
- On the Amazon S3 console, delete the table storage bucket (for this post, iceberg-athena-lakeformation-blog).
- In the producer account on the Athena console, run the following commands to delete the tables you created:
- In the producer account on the Lake Formation console, revoke permissions to the consumer account.

- Delete the S3 bucket used for the Athena query result location from the consumer account.

Conclusion
With the support for cross account, fine-grained access control policies for formats such as Iceberg, you have the flexibility to work with any format supported by Athena. The ability to perform CRUD operations against the data in your S3 data lake combined with Lake Formation fine-grained access controls for all tables and formats supported by Athena provides opportunities to innovate and simplify your data strategy. We’d love to hear your feedback!
About the authors
 Kishore Dhamodaran is a Senior Solutions Architect at AWS. Kishore helps strategic customers with their cloud enterprise strategy and migration journey, leveraging his years of industry and cloud experience.
 Jack Ye is a software engineer of the Athena Data Lake and Storage team at AWS. He is an Apache Iceberg Committer and PMC member.
 Chris Olson is a Software Development Engineer at AWS.
 Xiaoxuan Li is a Software Development Engineer at AWS.
 Rahul Sonawane is a Principal Analytics Solutions Architect at AWS with AI/ML and Analytics as his area of specialty.