Post Syndicated from Noritaka Sekiyama original https://aws.amazon.com/blogs/big-data/enhance-monitoring-and-debugging-for-aws-glue-jobs-using-new-job-observability-metrics/
For any modern data-driven company, having smooth data integration pipelines is crucial. These pipelines pull data from various sources, transform it, and load it into destination systems for analytics and reporting. When running properly, it provides timely and trustworthy information. However, without vigilance, the varying data volumes, characteristics, and application behavior can cause data pipelines to become inefficient and problematic. Performance can slow down or pipelines can become unreliable. Undetected errors result in bad data and impact downstream analysis. That’s why robust monitoring and troubleshooting for data pipelines is essential across the following four areas:
- Reliability
- Performance
- Throughput
- Resource utilization
Together, these four aspects of monitoring provide end-to-end visibility and control over a data pipeline and its operations.
Today we are pleased to announce a new class of Amazon CloudWatch metrics reported with your pipelines built on top of AWS Glue for Apache Spark jobs. The new metrics provide aggregate and fine-grained insights into the health and operations of your job runs and the data being processed. In addition to providing insightful dashboards, the metrics provide classification of errors, which helps with root cause analysis of performance bottlenecks and error diagnosis. With this analysis, you can evaluate and apply the recommended fixes and best practices for architecting your jobs and pipelines. As a result, you gain the benefit of higher availability, better performance, and lower cost for your AWS Glue for Apache Spark workload.
This post demonstrates how the new enhanced metrics help you monitor and debug AWS Glue jobs.
Enable the new metrics
The new metrics can be configured through the job parameter enable-observability-metrics.
The new metrics are enabled by default on the AWS Glue Studio console. To configure the metrics on the AWS Glue Studio console, complete the following steps:
- On the AWS Glue console, choose ETL jobs in the navigation pane.
- Under Your jobs, choose your job.
- On the Job details tab, expand Advanced properties.
- Under Job observability metrics, select Enable the creation of additional observability CloudWatch metrics when this job runs.

To enable the new metrics in the AWS Glue CreateJob and StartJobRun APIs, set the following parameters in the DefaultArguments property:
- Key –
--enable-observability-metrics - Value –
true
To enable the new metrics in the AWS Command Line Interface (AWS CLI), set the same job parameters in the --default-arguments argument.
Use case
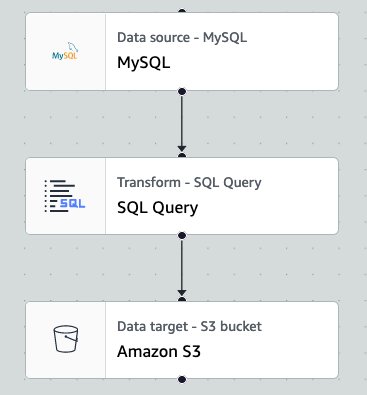
A typical workload for AWS Glue for Apache Spark jobs is to load data from a relational database to a data lake with SQL-based transformations. The following is a visual representation of an example job where the number of workers is 10.
When the example job ran, the workerUtilization metrics showed the following trend.
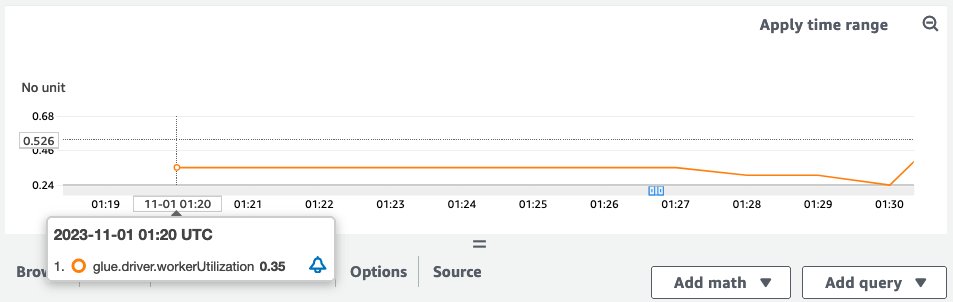
Note that workerUtilization showed values between 0.20 (20%) and 0.40 (40%) for the entire duration. This typically happens when the job capacity is over-provisioned and many Spark executors were idle, resulting in unnecessary cost. To improve resource utilization efficiency, it’s a good idea to enable AWS Glue Auto Scaling. The following screenshot shows the same workerUtilization metrics graph when AWS Glue Auto Scaling is enabled for the same job.
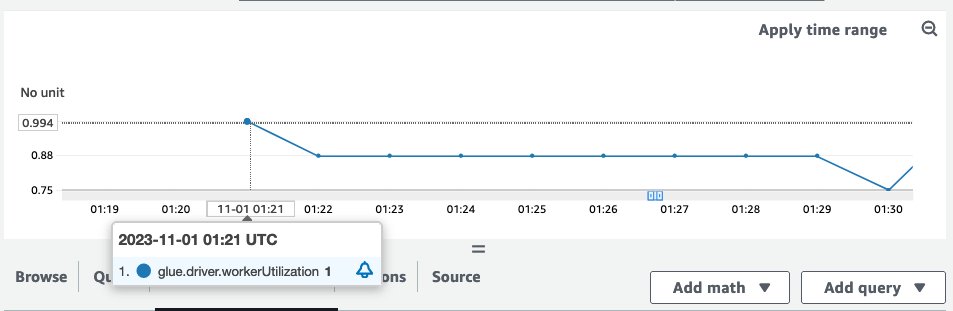
workerUtilization showed 1.0 in the beginning because of AWS Glue Auto Scaling and it trended between 0.75 (75%) and 1.0 (100%) based on the workload requirements.
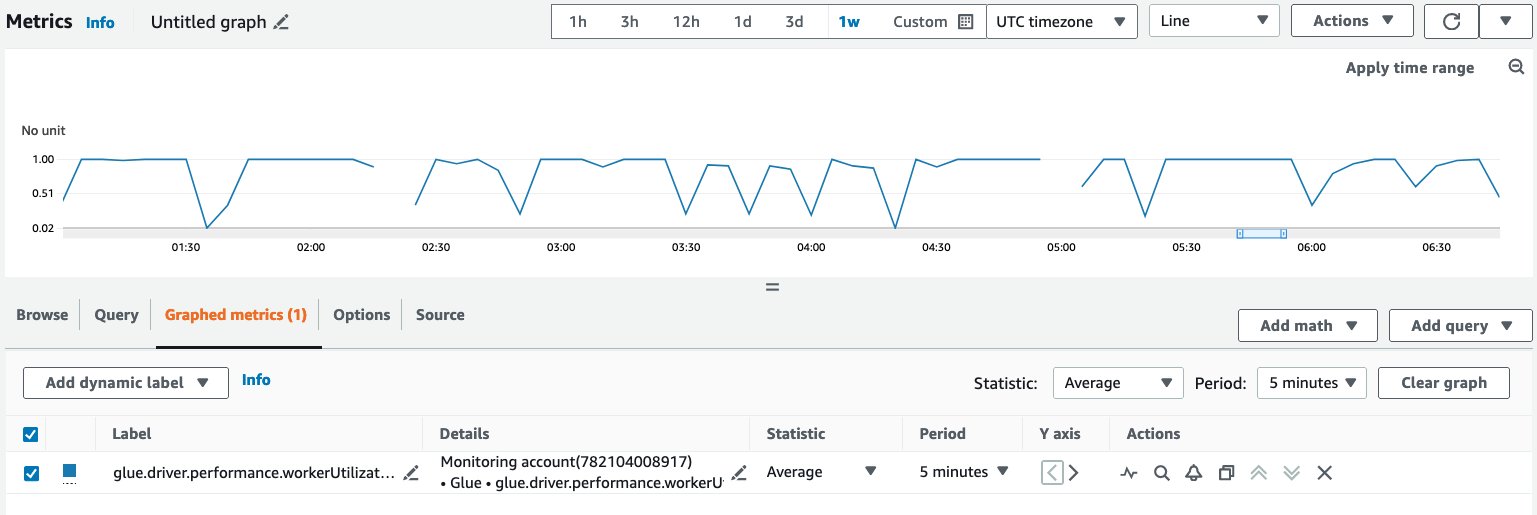
Query and visualize metrics in CloudWatch
Complete the following steps to query and visualize metrics on the CloudWatch console:
- On the CloudWatch console, choose All metrics in the navigation pane.
- Under Custom namespaces, choose Glue.
- Choose Observability Metrics (or Observability Metrics Per Source, or Observability Metrics Per Sink).
- Search for and select the specific metric name, job name, job run ID, and observability group.
- On the Graphed metrics tab, configure your preferred statistic, period, and so on.
Query metrics using the AWS CLI
Complete the following steps for querying using the AWS CLI (for this example, we query the worker utilization metric):
- Create a metric definition JSON file (provide your AWS Glue job name and job run ID):
- Run the
get-metric-datacommand:
Create a CloudWatch alarm
You can create static threshold-based alarms for the different metrics. For instructions, refer to Create a CloudWatch alarm based on a static threshold.
For example, for skewness, you can set an alarm for skewness.stage with a threshold of 1.0, and skewness.job with a threshold of 0.5. This threshold is just a recommendation; you can adjust the threshold based on your specific use case (for example, some jobs are expected to be skewed and it’s not an issue to be alarmed for). Our recommendation is to evaluate the metric values of your job runs for some time before qualifying the anomalous values and configuring the thresholds to alarm.
Other enhanced metrics
For a full list of other enhanced metrics available with AWS Glue jobs, refer to Monitoring with AWS Glue Observability metrics. These metrics allow you to capture the operational insights of your jobs, such as resource utilization (memory and disk), normalized error classes such as compilation and syntax, user or service errors, and throughput for each source or sink (records, files, partitions, and bytes read or written).
Job observability dashboards
You can further simplify observability for your AWS Glue jobs using dashboards for the insight metrics that enable real-time monitoring using Amazon Managed Grafana, and enable visualization and analysis of trends with Amazon QuickSight.
Conclusion
This post demonstrated how the new enhanced CloudWatch metrics help you monitor and debug AWS Glue jobs. With these enhanced metrics, you can more easily identify and troubleshoot issues in real time. This results in AWS Glue jobs that experience higher uptime, faster processing, and reduced expenditures. The end benefit for you is more effective and optimized AWS Glue for Apache Spark workloads. The metrics are available in all AWS Glue supported Regions. Check it out!
About the Authors
 Noritaka Sekiyama is a Principal Big Data Architect on the AWS Glue team. He is responsible for building software artifacts to help customers. In his spare time, he enjoys cycling with his new road bike.
 Shenoda Guirguis is a Senior Software Development Engineer on the AWS Glue team. His passion is in building scalable and distributed Data Infrastructure/Processing Systems. When he gets a chance, Shenoda enjoys reading and playing soccer.
 Sean Ma is a Principal Product Manager on the AWS Glue team. He has an 18+ year track record of innovating and delivering enterprise products that unlock the power of data for users. Outside of work, Sean enjoys scuba diving and college football.
 Mohit Saxena is a Senior Software Development Manager on the AWS Glue team. His team focuses on building distributed systems to enable customers with interactive and simple to use interfaces to efficiently manage and transform petabytes of data seamlessly across data lakes on Amazon S3, databases and data-warehouses on cloud.