Post Syndicated from Stephanie Doyle original https://www.backblaze.com/blog/what-network-data-can-and-cant-tell-us-about-ai-infrastructure/

AI infrastructure is difficult to observe directly. That’s because AI systems are highly distributed. They span storage platforms, GPU clusters, training pipelines, and multiple cloud providers—and those looking to optimize their stacks have to build out a visibility layer that takes all of those things into account. Data is constantly moving between different tools and infrastructure layers, and it’s imperative to understand how and why.
Learn how to structure your data for AI
Your organization is ready to prioritize AI-first projects. But is your data ready? Whether you’re developing AI-powered products to bring in new revenue or building internal AI tools to increase productivity, your AI initiatives start with the data you already have and how it’s stored.
Read the guide, “Navigating Multimodal Dataset Economics,” to understand how to optimize AI infrastructure.

One critically important aspect: understanding the network layer. Network telemetry makes it possible to observe how data actually moves between environments: which endpoints exchange data, how long those connections persist, and how much information flows between them over time.
Since re-launching the Network Stats series in November 2025, we have had direct visibility into what that movement looks like in practice. Backblaze has always been an advocate for the benefits of a multi-cloud design, and our position as a pure storage provider offers a unique perspective on the movement of storage to the neoclouds where AI processing, inference, and model training take place. Our network telemetry captures data flows across those connections in real time.
The Q1 2026 Network Stats report covers a full quarter of observed network traffic across those connections. This makes it possible to see patterns in how AI workloads move data between storage and compute environments.
However, while these patterns are real and worth studying, they need to be interpreted carefully. A single quarter of data may highlight emerging behaviors, but those behaviors may not reflect how AI infrastructure will ultimately be designed.
And, as we often say—the dataset is young, and network landscape is going through a fundamental change. It will be exciting to see what happens over time, but we, as a community, should be discerning.
What network telemetry actually reveals
Network-level metrics expose behaviors that application or storage metrics often don’t reveal. Application logs can show what a system is trying to do, and storage metrics can show how much capacity is being used. But, it’s the network layer that reveals how data actually moves between systems.
Several network patterns help make that movement visible:
- Traffic volume shows how much data is flowing through the system.
- Connection persistence indicates whether that data moves through many short-lived exchanges or a smaller number of sustained transfers.
- Endpoint concentration and magnitude (that is: how much data is transferred per IP address) show how many systems are involved in those exchanges and how much data each endpoint moves.
- Ingress and egress data shed light on different kinds of workloads.
- And, sometimes even the patterns of when data is uploaded or downloaded can reveal human behavior.
When we examine the network data, it begins to reveal how modern workloads operate.
One of the clearest examples appears in the Q4 2025 Network Stats data. In that quarter, neocloud traffic was concentrated around a relatively small number of endpoints, and those connections carry sustained, high-magnitude data transfers over time. Compared with traditional internet traffic patterns, fewer connections are responsible for moving a much larger share of the data. We call those elephant flows.
In Q1 2026, we dug into the ways that the data also show a geographic pattern. Neocloud traffic clusters in specific regions with dense compute and interconnect infrastructure, rather than being evenly distributed across the network.
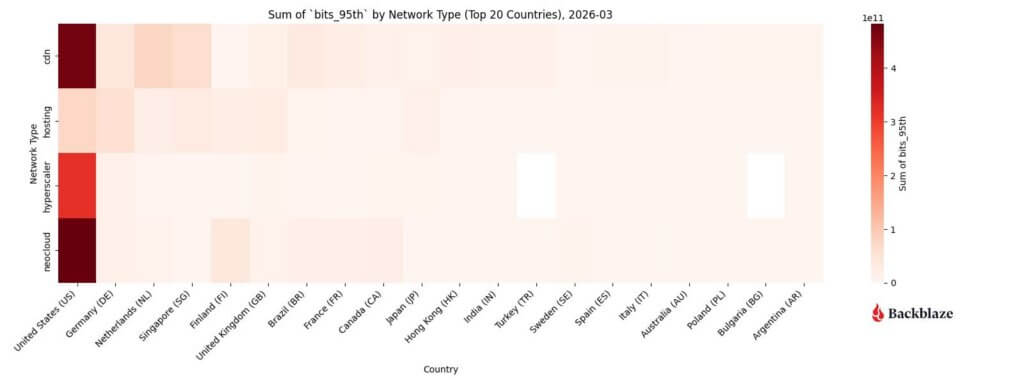
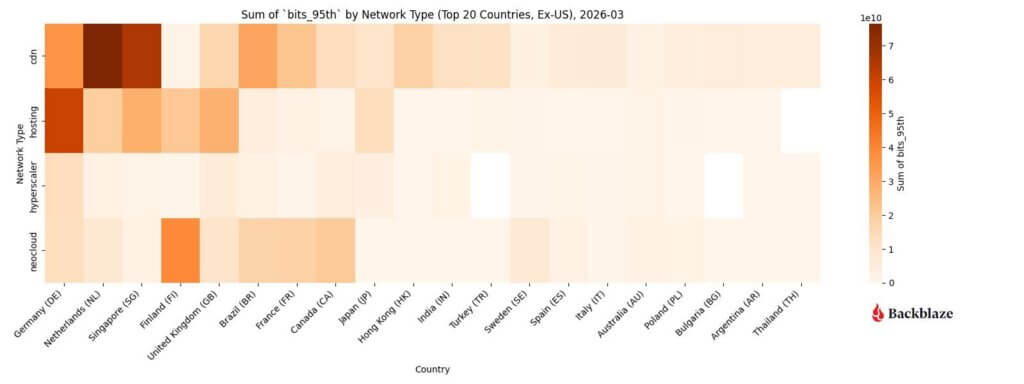

These signals in the network data are meaningful. They reveal important characteristics of how AI workloads behave across infrastructure. But, they do not by themselves explain what those patterns imply for infrastructure design.
What a single quarter of network data cannot tell us
A single quarter of telemetry can reveal emerging patterns, but it cannot distinguish durable infrastructure trends from short-term experimentation.
AI infrastructure is still evolving quickly. New training frameworks are emerging, GPU availability continues to shift, and companies are experimenting with different compute providers and network connections. Because of this, infrastructure decisions today are still temporary. Teams are building pipelines with the resources they can access now, and many are finding that multi-cloud architectures allow them the ability to optimize their tech stack—traditionally only considered cost play, this is far more important from a performance perspective.
That means some of the patterns visible in current network data aren’t constraints for anyone attempting to deal with a changing landscape. For example, these are some of the patterns we can’t attribute causality to in a vacuum:
- Regional clustering may simply result from where GPU capacity happens to be available today.
- Changes in traffic mix may depend on how early training pipelines are assembled across providers.
- Differences in connection patterns may be influenced by how mature different platforms’ network interconnects are.
As these conditions change, the same workloads may produce different network signatures. And, more importantly, a flexible, interoperable tech stack means that enterprises can be responsive.
This also is why network telemetry becomes much more informative when observed quarter by quarter and over time. Multiple quarters of data make it easier to distinguish temporary conditions from infrastructure patterns that persist.
But even before those longer-term patterns emerge, network telemetry still provides valuable insight into how AI infrastructure behaves under current conditions.
How to interpret network telemetry data
The patterns visible in network telemetry become more useful when we consider what they imply for infrastructure planning. Rather than describing the traffic itself, they help engineers understand the operational demands AI workloads place on real systems.
Sustained high-volume transfers point to the level of throughput infrastructure must support. If large datasets move repeatedly across the network, drive IOPS, API servers, load balancers, network switch pairs, and other interconnect layers must be capable of sustaining those flows without becoming bottlenecks.
Traffic concentrated among a relatively small number of systems suggests that storage and compute environments may become tightly coupled in real deployments. AI pipelines often depend on repeated exchanges between specific components rather than distributing activity evenly across many endpoints. For example, it may make sense to co-locate storage on flash hardware when you’re immediately feeding GPUs; however, your warm or cold data may be better served in different environments.
Regional clustering highlights where compute capacity and high-bandwidth interconnect infrastructure are currently concentrated. For operators, that can indicate where AI workloads are most likely to run and where supporting infrastructure must perform reliably at scale.
For engineers and infrastructure planners, data like this helps answer practical questions such as:
- Where sustained high-throughput networking will be required
- How tightly storage and compute systems may become coupled
- Which regions currently concentrate the infrastructure supporting AI workloads
Taken together, this information provides a useful view into the operational demands AI workloads place on infrastructure today. They do not, however, define how AI infrastructure will ultimately be designed.
Infrastructure decisions shouldn’t be locked to early signals
The real problem is that, in traditional environments, infrastructure decisions tend to stick. When a team chooses where data lives, how pipelines move it, and which providers are connected, those choices quickly become part of the system.
Over time, early infrastructure decisions can quietly lock an organization into a specific architecture, even if better options appear later.
Once large datasets are stored in a particular environment, changing course becomes slow and expensive. Moving the data can take days or weeks. Pipelines may need to be rewritten. Teams may have to rebuild integrations between storage and compute systems entirely.
This doesn’t mean early signals should be ignored. Network telemetry still shows how workloads behave today, and can indicate what happens tomorrow. That visibility helps teams understand the operational demands AI workloads place on infrastructure.
These observations should be treated as a snapshot of a system that is still evolving. Infrastructure that allows data to move easily between platforms and compute environments gives teams the freedom to adapt as tools, providers, and architectures change. In fast-moving AI ecosystems, flexibility can matter just as much as raw performance.
Using network telemetry responsibly means learning from the pressures visible today while recognizing that the systems producing these patterns are still taking shape.
The post What Network Data Can and Can’t Tell Us About AI Infrastructure appeared first on Backblaze Blog | Cloud Storage & Cloud Backup