Neoclouds are built around GPUs, and GPUs can only run as fast as the data coming in. At the speeds AI training demands, conventional cloud storage solutions can’t keep up.
That’s where flash storage comes in. Flash is fast and reliable, purpose-built for workloads that need data delivered at extreme speed and low latency. But much of the storage work that surrounds active training—saving checkpoints, storing datasets, keeping finished models—doesn’t need flash-grade speed (or flash-grade prices).
That’s an issue for neoclouds. Their infrastructure is built around flash. So for storage that doesn’t need flash, they often point customers to hyperscaler object storage solutions instead. It’s cheaper, it works, and it keeps the neocloud focused on what it does best.
The problem is data gravity: the more data you have stored somewhere, the harder it becomes to leave. Hyperscalers make this worse by design. They let you put data in for free but charge prohibitively expensive egress fees to take it out. So once your data is entrenched on a hyperscaler’s platform, the cost of leaving keeps climbing. And wherever your data lives, that’s where you tend to buy more services. So while the neocloud keeps getting paid for GPU computing, the hyperscaler quietly takes over the broader account. What started as a sensible storage decision ends up with the hyperscaler owning everything except the GPU contract.
This article explains how a sensible storage decision can slowly hand a customer to a hyperscaler, and how a tiered storage architecture, with flash where it belongs and cheaper high-capacity storage everywhere else, lets neoclouds compete for the whole account.
Each lifecycle stage carries a different storage profile
To see why flash alone isn’t the answer, it helps to walk through what each stage of the AI lifecycle actually needs from storage.
It starts with data ingestion. Before training begins, raw datasets have to be cleansed, labeled, and prepared. This stage needs high-capacity storage that can move large volumes of data efficiently. Speed matters, but not to the degree that flash is necessary.
Active training is the stage where flash earns its place. Data moves through several storage tiers before it reaches the GPU, but at that final step, the model needs it delivered continuously and at very high speed. Only flash is fast enough to keep thousands of GPUs running without interruption.
Checkpointing runs throughout training. Because AI training is a synchronous process with every node in the cluster working in lockstep, a single component failure can bring the entire training run to a halt. And at the scale of a large modern cluster, failures are not rare. The failure rate also scales exponentially with cluster size. Checkpoints are the solution: frequent snapshots of the model’s current state that allow training to resume from where it left off. At large scale, a checkpoint may need to capture 15TB of data in under five seconds, repeated every few minutes, around the clock. This stage needs storage that is fast enough to keep up with that pace, and reliable enough that nothing gets lost.
Once training finishes, the outputs—model weights, logs, and metadata—go into longer-term storage. Fine-tuning experiments and additional training runs add more over time. This stage needs capacity and durability, not speed.
Finally, inference: serving a deployed model requires repeated access to model weights on demand. The data volumes are far smaller than training, and while latency-sensitive deployments may still benefit from flash, the storage demands are far less intensive.
Flash storage is purpose-built for only one of these stages (active training). At every other stage, what’s needed is a cost-effective, high-capacity storage tier, which is precisely what neoclouds are currently sending to hyperscalers. (NVIDIA’s certified storage program validates storage solutions separately for each of these stages, recognizing that a single storage architecture can’t serve all of them well.)
Flash is the wrong tool for most of the job
Flash storage is expensive because it’s built for speed. But you pay for that speed whether you need it or not. Using flash to store datasets, checkpoints, and finished model artifacts is like shipping all of your mail overnight when most of it could go by ground; you’re paying a premium for a capability you don’t need.
And there’s a second problem beyond the cost. Flash that’s tied up storing checkpoints and datasets isn’t available for GPUs, and GPUs are what neoclouds sell. Every terabyte of flash used in the wrong place is capacity taken away from the core product.
The economics have always favored a tiered approach: fast storage where speed is needed, cheaper high-capacity storage everywhere else. In fact, Google, Meta, and Microsoft have run tiered storage architectures for years (Meta’s engineering team describes their approach in four explicit tiers, each selected for the job it does best).
But building out a full storage tier below flash is a significant undertaking, and most neoclouds have understandably stayed focused on their core GPU product. With SSD prices up 257% in under a year, that gap has become too expensive to ignore.
How a tiered stack maps to the lifecycle
The solution is to follow the same logic the hyperscalers have used for years: match the storage to the workload, not the other way around.
For active training, flash is still the answer. VAST, WEKA, and DDN handle this tier with fast, GPU-adjacent storage that keeps training running at full speed.
For everything else, B2 Neo can fill the gap. Datasets live here before training starts. Checkpoints write here continuously during training. Finished model weights and records accumulate here over time. The storage is fast and durable, but priced for capacity workloads rather than flash workloads. B2 Neo connects directly to the hot tier, so data moves between them without a detour through a hyperscaler.
The best part is the neocloud doesn’t have to build any of this. B2 Neo is available as a white-label product, deployed under the neocloud’s own brand. The customer only sees one seamless platform; their data stays on the neocloud’s infrastructure from raw dataset to deployed model and never touches a hyperscaler.
The full picture
Flash is the right storage for one stage of the AI lifecycle. At every other stage, it’s an expensive tool for a job that doesn’t need it.
Neoclouds that only serve the active training tier leave a gap, and customers often fill that gap by sending their data to a hyperscaler. Once it’s there, egress fees keep it there. The neocloud ends up handing the broader customer relationship to whoever holds the data.
The good news is that closing the gap doesn’t require building anything from scratch. The tiered architecture that Google and Meta run at scale is available to neoclouds today as white-label infrastructure.
In this market, the GPU contract is just the beginning. Keeping the data is what keeps the customer.
Hit a wall trying to scale your storage infrastructure? B2 Neo gets you the rest of the way there, no rebuild required. Let’s talk.
Broad refactors and migrations often have to land as one change.
Stacked pull requests are a great way to split work into smaller changes, which makes reviews easier and helps teams ship with less risk. But some changes, like this one, can’t be split cleanly. That leaves you with a single pull request that can get very large, and the review conversation causes it to grow.
The review experience needs to remain fast and smooth even when the diff and its conversation are enormous. In the GitHub Copilot app, we rebuilt the pull request view with that requirement in mind.
To see how far that goes, we opened the biggest pull request we could find: an open source one with 2,200 files, over a million changed lines, and more than 400 inline review comments. Here’s how we made even this extreme pull request performant.
The scope of the problem
Rendering a large diff at speed is well-understood: virtualize the rows, keep the mounted DOM small, and lean on the fact that every row is a line of code at a known height.
Comments are the hard part. A comment’s height depends on how its markdown wraps, the expandable sections, whether there’s a reply box in it, and whether its images have loaded yet. You find all of that out at render time. This forces a different architecture.
Three problems:
Measurement. You can’t know how tall a comment is until you render it. This breaks the design that lets big diffs stay responsive as you scroll.
The data pipeline. A fast diff surface is worthless if the data pipeline feeding it stalls, or if it throws away work it already did.
How we actually found the bugs. These problems surface under load, on a specific engine, at a specific scroll position. So we defined what healthy meant, instrumented the surface to answer it, and ran the whole change → measure → improve loop unattended.
Part 1: Virtualization, and why comments break it
The first step is to understand the geometry that makes a code-only diff fast. Once comments enter the picture, that geometry is no longer enough.
What makes big diffs fast
You cannot put a million DOM nodes on a page. The standard answer is virtualization: mount only the rows that are on screen, plus a small margin, and recycle those same DOM elements as the user scrolls. The list behaves as if all million rows exist. The scrollbar is the right size, scroll-to-row works. But only about 100 rows are ever real at once.
For this illusion to hold, something has to supply the geometry. The scrollbar height is the sum of all row heights. The position of row N is the sum of the heights of the rows above it. Jumping to a row, drawing the scrollbar, deciding what’s on screen, it’s all arithmetic over a table of heights. You can build that table from estimates and correct it as rows get measured, and general-purpose variable-height virtualizers do exactly that.
But if every row is a line of code at a known font size, you don’t have to. You can compute the whole table up front and it never changes, so there’s nothing to correct later.
Call this the “all heights known before paint” contract. Our diff surface is built around it:
An imperative, recycled code-row renderer (no React component per row)
An imperative scroll API with exact “scroll to row N“
None of it scales badly, because no per-frame work grows with the total row count. On pure code this design is the right one, and we kept all of it.
How comments change the contract
Now put a review thread in the middle of the diff. How tall is it?
You don’t know, and you can’t know without rendering it. Its height depends on things that only exist at render time, and they can keep changing after first paint:
Markdown that wraps differently at different widths
<details> blocks the user can expand or collapse in place
A reply composer that opens inside the existing thread and grows as you type
Images and async assets that change height when they finish loading
The obvious answer is to reserve a fixed-height slot for each comment, sized by an estimator. It falls apart on a big pull request. An estimator that’s right on average is still wrong at the extremes. It over-reserves most comments, leaving gaps of whitespace, and under-reserves the expensive ones, which clip or sprout a nested scrollbar. If you measure the real height after paint and write it back into the shared offset table, everything below moves, while the user is already scrolling. That’s a scroll jump, and on a big pull request it’s a large one.
So comments need a different contract. “All heights known before paint” is unachievable for this content. What we could promise instead: heights are bounded, measured lazily, and corrections are small and anchored to whatever the user is looking at.
Two geometries instead of one
The idea that made this tractable was to stop forcing one geometry to serve both kinds of content. We split the document’s height into two independent domains:
total height = deterministic code height          (exact, known up front)
             + Σ dynamic block effective heights   (estimated, then measured)
             + scroll padding
Code geometry keeps the original world. It’s deterministic, prefix-summed, exact, never rebuilt when a comment resizes.
Dynamic block geometry covers everything whose height we can’t predict, such as review threads, drafts, and reply composers. Each one is a block identified by what it is rather than where it currently sits. It has a stable key that survives its content loading, and it’s anchored to a file, line and side rather than to a pixel coordinate, so a reflow can’t lose track of it. We also keep a fingerprint of everything that could change the block’s height: its content, whether a <details> is open, whether a composer is active. And we record the width it was last measured at, rounded into buckets, so an ordinary window resize doesn’t invalidate every measurement in the document.
A block’s effective height is then simple: the measured height if we have a valid one, a cached height if the fingerprint and width still match, and the estimate otherwise. Those heights live in their own index, separate from the code rows, so a resizing comment never forces the code geometry to be rebuilt. And the number of blocks is bounded by comments, not by rows. A few thousand blocks is fine, as long as first paint never mounts or measures all of them at once.
The measurement scheduler, and the mistake we made first
This part took the longest to get right, because our first design was wrong in an instructive way.
The obvious way to measure dynamic content is one ResizeObserver per block, which watches the element and writes its measured height back into the layout whenever it changes. This is what we designed and then rejected during performance hardening. It is the feedback loop that big virtualized surfaces have to avoid. An observer that writes a height back into the layout of the element it’s watching can retrigger itself, and the cost grows with every mounted block.
What shipped instead is a single idle- and scroll-gated measurement pass, held to the same discipline as the deterministic side:
Off the hot path. It runs when the visible range settles, never once per scroll frame, and waits entirely while a scroll is in flight. A reflow mid-scroll is exactly the jank we’re avoiding. It runs again once scrolling stops.
Scoped to the viewport. Only blocks within roughly 2400px of the viewport are candidates, so the work is O(viewport). Distant blocks keep riding their estimate and get corrected as they approach.
On-screen reads win. A mounted block is on screen, so its rendered height is ground truth. The pass reads every mounted candidate in one batch, a single reflow with no writes in between, and records what it finds. A mounted block is never skipped in favor of a stale estimate. That one rule fixed the nastiest bug we hit: comments that rendered with a strip of blank space underneath, because a mounted block had been filtered out of measurement and left sitting on a too-tall estimate.
Off-screen measurement is a bounded fallback. For a nearby block that hasn’t mounted yet, the pass does at most one off-screen render, to correct its reservation before it scrolls into view. Blocks taller than the viewport skip even that. Their over-reservation hides below the fold, so the render isn’t worth paying for.
An observer catches the rest. Some height changes don’t move the fingerprint and don’t coincide with a scroll: typing in a reply composer, an image finishing loading, toggling a <details>. Each mounted block keeps a ResizeObserver, but by default all it does is flag the block so the idle pass re-reads it. It never writes a height itself, which is what would close the feedback loop we rejected. It disconnects on unmount, and an inactive pull request tab observes nothing.
With one deliberate exception. Waiting was visibly wrong for resizes you caused yourself: expanding a <details>, opening a reply composer, an image landing. The block grew immediately, but the code below it only moved on the next idle pass. For one frame the comment was taller while everything under it sat at its old position, and you could see the two steps. So when a block is mounted and on screen, the observer now measures it and applies the correction in the same frame, before paint. The block grows, the code repositions, and everything below shifts together. Two safeguards keep this from becoming the loop we were avoiding: at most one synchronous commit per frame, so a burst of resizes collapses into one, and never during an active scroll, where it falls back to the batched pass.
Scroll anchoring: Correcting without fighting the user
When a measured height differs from its estimate, the scrollbar arithmetic changes, and the naive result is that the viewport jumps. The fix is to correct by identity rather than by pixel:
Before applying height updates, capture what the user is anchored to (a row or a block, by identity), plus the offset within it.
Apply the height deltas.
Resolve that same anchor to its new pixel position.
Scroll so the anchor stays put in the viewport.
Plus a few rules that keep it from feeling wrong:
A block above the viewport changing height → adjust by the delta (keeps your place).
Content hydrating below the viewport → don’t adjust (you can’t see it).
If you toggled a <details> or opened a reply in a visible block → suppress above-block correction for that block, so the interaction feels direct, and let the content below flow down naturally.
Never fight active pointer or wheel momentum; batch the correction after the frame.
That last rule has a sharp edge, and it bit us. “Don’t correct while the user is scrolling” was implemented as a guard on the last observed scroll, and programmatic scrolls refreshed that timestamp too. Toggling the file-tree sidebar changes the width of the diff pane. With line wrapping on, every wrapped line above you reflows to a different number of visual lines, the whole coordinate space shifts, and the surface emits a small scroll of its own as it settles. The guard read that as “the user just scrolled” and skipped the very correction that was supposed to keep your place, so the file you were reading drifted off screen. The fix was to tell user scrolls apart from ones the surface caused itself. Any “is the user interacting?” check has to be one your own side effects can’t satisfy.
So corrections stay small, they reuse measurements we already have, and they follow whatever you’re looking at.
Part 2: The pipeline behind the surface
A diff surface can only be as fast as the data feeding it, and three habits from that side of the work shaped what the UI could do. The first is stream structure before content. The diff is requested incrementally, so the file tree and metadata paint while the document is still loading, and the full set of review threads is resolved up front rather than trickling in. The second is defer per-item work until something needs it. Syntax highlighting runs off the main thread, so rows appear as plain text immediately and get colored when the results arrive. Highlighting improves the surface instead of blocking the scroll. Large markdown bodies and suggested-change context work the same way: nothing is built until it approaches the viewport.
The third habit is about which costs are worth keeping. Releasing a diff document when you navigate away is the right default. These documents are large, and holding on to every one you’ve visited is how a long session ends up eating memory. But pull request metadata persists, so the shell around the diff, the header and the file tree, repaints instantly when you go back, and then sits there for several seconds waiting for a diff it had complete moments ago. An instantly-drawn shell around an empty diff looks broken, even though you’re waiting less time overall. So the policy stayed and we added a cache: keep the last few diffs resident, evict anything beyond that, and let the background refresh notice when one has gone stale.
Part 3: The measurement loop, or how we actually found the bugs
Almost every bug in this project was invisible until it wasn’t, and reproducing one by hand is miserable. A typical report reads: “a strip of whitespace appears below some comments, but only sometimes, only on big pull requests, and it heals if you scroll past and back.” You can’t debug that by staring at the screen, so we built tooling to debug it mechanically.
Instrument with the app’s real signals, not throwaway logs
The naive workflow is to sprinkle console.log calls, exercise the flow by hand, copy the output, paste it to someone (or something) that can analyze it, delete the logs, and repeat. It’s slow, it needs a human in the loop, and worst of all you end up measuring your own hand-rolled instrumentation rather than the app’s real behavior.
So the surface carries permanent, structured probes for its own invariants. They’re plain questions it answers about itself on every render:
Is the surface actually viewport-bound? How many rows and comment blocks are mounted right now?
Is measurement coalescing to a single commit per frame, and how long does that frame take?
How large are the scroll corrections we’re making?
Did any comment block get inserted after scrolling started? (Must be zero once the backend topology has landed.)
Do the per-block observers actually tear down on unmount, or are we leaking one per block?
These are the objective pass/fail signals, and they’re asserted as budgets in an end-to-end test against a synthetic many-comment huge-pull-request fixture. CI can now tell us whether the surface is healthy.
Put the loop on autopilot
The centerpiece was an autonomous change → measure → improve loop. Two lanes:
A headless probe lane ran a declarative flow (open a pull request, scroll to a fraction, toggle a details block, resize the window) against a mock server, reading the app’s own production instrumentation: React render counts, the performance timeline, and a requestAnimationFrame sampler for jank. It did the whole instrument, drive, collect, analyze, rank cycle by itself and printed the bottlenecks in order. Because the flow is just JSON handed to the probe at runtime, an agent could profile any flow by describing it in plain English, without editing a line of source.
An autopilot drove the actual desktop app through the huge-pull-request flow, unattended, on a loop: first cold, with comments still skeletons, then warm, with comments loaded, toggling <details> blocks, opening and cancelling reply composers, collapsing and expanding files, toggling the sidebar tree, sweeping deep into the file list, resizing the window. Every measurement was mirrored to the app’s on-disk log, so an agent could read runtime behavior with nobody at the keyboard. Each sample carried a health signal, and that was the objective check. A warm sample counted as healthy only if there were no unfilled gaps between comments, no comment blocks left blank, and real thread content actually mounted, across the entire scroll range, deep-file sweep included.
The loop we ran was:
Reproduce unattended, on the real engine. Arm the autopilot, let it loop, read the on-disk log.
Detect with a health signal, not with your eyes. Trust the sample fields.
Probe the suspect seam. When a signal goes bad, add one narrow structured probe there, re-arm, re-read. (Editing the surface hot-reloads the live window and re-arms the autopilot, so a fresh capture is about one cycle away.)
Remove the scaffolding. Once you understand the invariant, pin it in a test and the design doc, and keep only the detector-grade signals.
Where this leaves us
Reviewing a pull request this large used to mean one of two things: waiting, or giving up and reading it somewhere else. A review isn’t a document with known dimensions. It’s a conversation that changes shape while you’re reading it, and the surface underneath has to be built for that from the start rather than patched into it afterwards.
The result is a pull request view where a million-line diff with hundreds of threaded comments opens, scrolls, and behaves like a normally sized pull request. Comments render in full instead of clipping into a scrollable box. Expanding a collapsed section moves the code below it and nothing else. Coming back to a pull request you just left puts you where you were.
If you review code for a living, it’s worth feeling the difference on a pull request you already know is painful. Open the worst one you’ve got.
AI agents are getting very good at making things: reports, code builds, images, videos, datasets, customer exports, and backups. But generating a file is only half the job. The agent still needs somewhere durable to put it. That’s where B2 comes in.
Today, we’re introducing the Backblaze B2 MCP Server: an open source server that gives AI agents a safe, standard way to operate cloud object storage.
Introducing the Backblaze B2 MCP Server
Model Context Protocol (MCP) provides a common way for AI agents to discover and use external tools. The Backblaze B2 MCP Server applies that model to Backblaze B2 Cloud Storage, connecting MCP-compatible clients to a focused set of storage operations.
The server is open source and designed so the tools presented to the agent reflect the permissions of the connected B2 application key.
And that last point is important. The MCP server does not invent a new permission model or grant an agent blanket access to your account. If the key can only read from one bucket, the agent’s usable tool set and reach are constrained accordingly. If the key does not permit an operation, the agent cannot use the MCP server to bypass that boundary.
Why launch an MCP server?
Storage has always met developers in two places: the API and the console. Agent tools are becoming a third, and increasingly the one where work starts. Our view is that infrastructure should be available inside the tool someone already has open, at the moment they need it.
That spans a wide range of work: everyday tasks that produce outputs which need to be stored, AI workflows that read and write data as they run, and applications that require storage to handle files. A report or an export has to land somewhere durable. An application built around agents needs somewhere to put user uploads, generated assets, and datasets. Customers have also asked us how their own agents can administer their storage.
MCP is what lets one implementation serve all of it. An MCP server provides these storage tools directly to the AI agents people use for everyday tasks and for coding, so the same credentials, scoping, transfer path, and destructive operation policy apply everywhere your team works. B2 is available inside the tools your teams already have open.
See it in action
Suppose an agent has prepared a customer export. Instead of handing it a general-purpose credential and writing the surrounding storage logic yourself, you could ask:
“Prepare a private destination for this customer export. Keep it for 30 days and give me a secure way to upload it.”
Depending on the application key’s permissions and the server’s policy settings, the agent can:
Create a private bucket or select an existing one the key can access.
Apply lifecycle or retention settings, depending on whether the export should expire automatically or be protected from deletion.
Generate a short-lived upload URL.
Verify that the export arrived.
Return a short-lived download URL to the intended recipient.
For a large export, the bytes move directly to B2 using the short-lived URL; they do not need to pass through the model conversation or the MCP server. That keeps bulk data on the right path and leaves the agent responsible for orchestrating the work, not hauling the payload.
Now imagine a follow-up request: “Delete that export.” The B2 MCP Server can require confirmation before the action proceeds or block destructive operations entirely, depending on how the server is configured. The same principle applies to changes that weaken protection, such as clearing retention or introducing lifecycle rules that schedule deletion.
The result is a useful division of labor: The agent can set up the storage, move the file, and verify the outcome, while the B2 MCP server enforces the connected key’s limits and configured policy.
Built for real storage work
The B2 MCP Server includes up to 40 tools across the B2 Native API, B2’s S3 Compatible API, and purpose-built storage analytics. You do not need to expose all of them to every agent. The available surface adjusts to the connected key and the server’s policy settings.
Manage storage. Create and configure buckets, list and manage objects, define lifecycle rules, work with retention and legal holds, and use Object Lock where the workflow calls for stronger protection.
Move large files directly. Generate short-lived upload and download URLs, or use multipart transfers for large objects, so bulk data stays out of the model and MCP server.
Limit access. Connect a scoped B2 application key so the agent can see and use only the buckets and capabilities it needs. For normal storage work, a non-master key is the right starting point.
Gate destructive actions. Set the destructive-action policy to require confirmation, block the operation, or allow it in a trusted environment. Local use defaults to confirmation; hosted HTTP deployments default to blocking these calls.
Inspect usage. Find storage growth, identify egress leaders, locate the largest files in a bucket, and surface unfinished multipart uploads that may be consuming storage.
Safety starts with the key
An MCP server makes tools available to an agent; it should not make good access controls optional. With B2 MCP, the connected application key remains the first boundary. B2 application keys can be limited by bucket, capability, file prefix, and duration, giving developers a practical way to apply least privilege to agentic workflows.
The server adds another layer around operations that deserve friction. Destructive and protection-weakening actions can require an explicit confirmation or be refused before execution. For hosted deployments, the project includes additional controls and deployment guidance for credential handling, authentication, allowed hosts and origins, rate limits, and logging.
The goal is not to pretend an agent can never make a bad request. It is to give developers clear, enforceable boundaries around what the agent is allowed to do.
Already use B2? Your agents can use it too
If your application data, backups, media, or archives already live in B2, you do not need a separate storage product for agents. The MCP server works with standard B2 application keys and existing buckets.
You can connect an existing key, but in most agentic workflows it is worth creating a narrower key for the job. A reporting agent might need read access to a specific prefix. An export workflow might need permission to write to one private bucket and generate a short-lived download link. A cleanup agent might need list access but no delete capability until a human approves the action.
Try the B2 MCP Server
One-click install (Claude Desktop)
Download b2-mcp.mcpb from the latest release and double-click it. Claude Desktop opens, offers to install the extension, and prompts for your Application Key ID and Application Key (Region and master key optional) — no config file to edit, nothing pasted into the conversation. (If your system hasn’t associated .mcpb files with Claude Desktop yet, open Settings → Extensions and install it from there, or drag the file onto that window.)
Run with npx (any MCP client)
You need three things to get started:
A supported Node.js runtime.
A B2 application key. Use a non-master key and scope it as narrowly as the workflow allows.
An MCP-compatible client.
The fastest way to run the server is with npx:
`npx -y @backblaze-labs/b2-mcp`
For Claude Desktop, add the following block to claude_desktop_config.json, substitute your application key values, and restart the client:
Do not paste the application key into the model conversation. Keep it in the client configuration or your deployment’s secret-management layer.
Then try a deliberately simple first prompt: “List the buckets this key can access.”
For copy-and-paste setup instructions for Cursor, VS Code, Cline, Windsurf, Zed, Continue, Goose, Claude.ai, and hosted deployments, see the client setup guide.
See the B2 MCP Server in action. We’ll set it up, run a complete storage workflow, explain the safety boundaries, and answer your questions.
A safe way for agents to operate storage
Agents need more than somewhere to put files. They need a safe way to operate storage: to prepare the right destination, move data on the right path, verify the outcome, and stop when a request exceeds their permissions or policy.
The Backblaze B2 MCP Server brings those capabilities to the MCP clients developers are already using, while keeping B2 application keys and server-side safeguards in control. Try it with your existing B2 storage, or join the webinar to see the complete workflow.
Output quality is important when working with AI coding agents, but true efficiency comes from getting work done quickly, efficiently, and with the right context.
That’s why token count of individual interactions alone isn’t a meaningful measure of efficiency. The goal shouldn’t be to use fewer tokens, but to tap into the right amount of context to move a task forward. A concise tool response can sometimes require additional calls or work if it leaves out information the agent needs, ultimately making the task slower and more expensive.
That’s why we want to optimize for the outcome rather than the tool call. This post examines four changes in GitHub Copilot that put that principle into practice:
Preserve useful context while reducing repetitive output.
Remove formatting that adds no value to the task.
Shorten instructions without changing useful behavior.
Deliver completed background work without an extra retrieval step.
Possible changes were evaluated offline using agentic coding benchmarks. The most promising changes were then validated through controlled online experiments before shipping. The examples in this post come from GitHub Copilot CLI. Multiple other Copilot products, such as the GitHub Copilot app and Copilot code review, use the same underlying harness and also become more efficient through these improvements.
Figure 1: Four independent A/B experiments using the same AI-credit metric. The segments are shown together for comparison; their effects are not necessarily strictly additive.
The local metric trap
It’s common to shorten the output from each tool call as a way to reduce agent costs. RTK (Rust Token Killer) is a utility that shortens shell output before an agent reads it. We evaluated its effect on GitHub Copilot using our agentic coding benchmarks.
In our harness and benchmark configuration, RTK shortened some responses, but when the omitted text mattered, the model sometimes reopened the original output or reran the command to recover what it needed.
Those recovery steps added turns and carried more context forward. The individual tool response was shorter, but on average, the task used more tokens and took longer. We saved tokens locally and spent more globally.
Figure 2: A shorter tool response can make the completed task more expensive when missing details force the agent to reread output, rerun commands, and carry more context forward.
This result applies to the integration and workloads we tested, not to every RTK configuration or to output compression in general. This meant that tokens per tool call is the wrong objective. An efficiency change has to be evaluated across the complete task, from the user’s request through the final result.
More useful was to look at what can we remove without making the model repeat work.
Compress noise, preserve useful information
The goal was to shorten repetitive output while preserving the context an agent needs to complete its task without retracing steps.
Analysis of benchmark runs showed that install, build, test, and lint output often contains repetitive noise, while source-like output and arbitrary command results are more likely to contain the information an agent needs. That analysis informed a selective output compressor, informed in part by RTK and similar approaches.
The prototype was evaluated on agentic coding benchmarks and a range of open source repositories, exercising their build, test, and lint systems.
Early versions were too aggressive. They made the model repeat work or read the full saved output, increasing end-to-end cost and reducing task success. For example, we initially compressed git diff but removed that filter after benchmark tasks showed agents reopening the original output to recover missing information.
Those early failures led to a three-part policy:
Preserve source-like and arbitrary output. Commands such as cat, git diff, git show, and arbitrary scripts are returned unchanged.
Reorganize search results without dropping content. Matches and file lists from tools such as grep can be grouped more efficiently while retaining every result.
Compress repetitive noise selectively. Install, build, test, and progress output is compressed only when the savings are substantial.
The shipped version emerged through repeated evaluation and refinement. It is conservative not because the goal was to build a conservative compressor, but because that is what the evaluations supported.
When output is compressed, the agent can still retrieve the complete original through a direct recovery path.
Figure 3: The shipped compressor preserves source-like output, reorganizes search results without loss, and compresses only predictable repetitive noise while retaining the full original.
That recovery path is both a safety mechanism and an evaluation signal. We tracked whether the agent opened the saved original, reran commands, repeated exploration, narrowed its searches, or took additional turns. Frequent recovery would indicate that the compressor had removed something valuable.
On offline tasks where output compression triggered, no statistically significant task-success regression was detected, and agents extremely rarely opened the saved originals. In the online experiment, average cost decreased slightly with no material regression detected in the tracked quality metrics.
Remove formatting before removing information
One clean token optimization came from the view tool, which agents use to read file contents into context.
Previously, view prefixed every line with a number before showing the contents to the model. Earlier file-editing tools used those numbers to target changes, but current tools instead match surrounding code and do not use line numbers. The line-number prefixes remained even though the normal workflow no longer used them.
Each prefix was small. Repeated across every line and every file read, however, that unused formatting accumulated throughout a session. So, we removed it.
Figure 4: Removing line-number prefixes preserves the source exactly while eliminating formatting that was repeated across every file read.
Line numbers remain useful in diffs and short snippets. They were wasteful here because they were attached to every file read without serving the current editing workflow.
Removing them caused model-inference cost to fall by roughly 5% in offline agentic coding benchmarks. Success rates stayed within the expected run-to-run variance, and edit failures did not increase.
We then tested the change with Copilot CLI users. The online experiment reduced average daily model-inference cost per user by about 3%, with no material regression detected in the quality or satisfaction metrics we tracked.
For developers, that means more of the context window is available for the work itself rather than formatting the agent does not use.
This was the ideal change: no new instructions for the model, no source of information to recover, and no additional decision to make. The file contents reached the model unchanged.
Compress prompts without compressing intent
Prompts carry instructions that shape how an agent works, and they are sent to the model on every turn. Shortening them only improves efficiency if the agent keeps the behaviors developers depend on.
In GitHub Copilot, the task tool launches specialized agents for parallel work. Its guidance had accumulated across tool descriptions, schemas, agent definitions, system instructions, and companion tools.
A meta-prompting loop, in which Copilot iteratively wrote its own prompt, reduced that prompt by roughly half. Copilot produced and refined smaller candidates, and targeted behavioral tests checked the requirements we wanted to preserve.
The first online experiment found a regression that the initial offline evaluations had missed. The meta-prompting loop had rewritten cautious parallelism guidance into a hard scheduling policy, causing independent custom agents to run sequentially.
We stopped the experiment. Before changing the prompt again, we wrote a regression evaluation for the behavior users had exposed. The eventual fix replaced an explicit allowlist and denylist with one sentence:
Independent agents can run in parallel; consider side effects.
That sentence was shorter and less restrictive; it deferred the choice of whether to run sub-agents in parallel to the model instead of the previous explicit guidance. With it, our new behavior test passed without causing any existing behavioral tests to fail.
Prompt behavior needs tests. If a behavior is not tested, a shorter prompt can remove it without anyone noticing.
Figure 5 Prompt compression became safe only after a regression test exposed serialized agents and a one-sentence fix restored parallelism; the resulting token savings recur on every model turn.
The shipped prompt removes about 1,300 task-tool prompt tokens per turn, corresponding to approximately 1.8% fewer total prompt tokens per session and 2.9% lower normalized cost per active hour, with no quality regression detected in the measured evaluations.
Deliver completed background work without an extra retrieval turn
Agents often run independent work in the background, such as a long-running shell command alongside a sub-agent investigation. Notifications let the agent continue until that work is ready without spending a tool call waiting.
If the agent does not explicitly wait for either task, the harness wakes the model and notifies it when the shell command or sub-agent finishes.
Previously, that notification did not include the completed result, so the agent had to spend another turn retrieving output Copilot had already received. When several tasks finished close together, that detour could repeat. Copilot now batches eligible completion notifications and delivers completed results directly in the existing tool-result format. The agent can continue with the information it needs, without spending an extra turn asking for it again. Explicit reads for work that is still running behave as before.
Figure 6 Before, each background completion could wake a retrieval-only model turn. After, the harness batches eligible completions and delivers completed results in the existing tool-result format.
Before this change, each completed task required one model call to request its result and another to process it. For the shell command and sub-agent shown above, that meant four model calls before work could continue.
Now, the harness batches both completions and supplies their results together, so a single model call can process both. Removing those retrieval detours also avoids carrying the full session context through unnecessary calls.
By delivering completed results directly, without compressing, summarizing, or withholding anything, the harness reduced average token-related usage, as measured in AI Credits, by about 2.3%.
Measure changes in context
A change that saves tokens in one Copilot workflow can increase costs in another.
For example, a tighter set of file-tool instructions was inspired by positive results in Copilot code review. In a Copilot CLI online experiment, it increased cost, so we did not ship it.
By contrast, removing line-number prefixes and selectively compressing output each reduced average prompt tokens per review by roughly 5% in independent evaluations across a large set of Copilot code review tasks using the production model. We detected no material change in the tracked review-quality metrics.
This post was co-written with Michael Stephan, Senior Principal Product Manager, and Christian Kreuzberger, Principal Software Engineer, at Dynatrace.
AI-driven software delivery changes how code gets written, but not what production demands of it. A generated change still has to fit the traffic your service receives, the dependencies it calls, and the capacity limits it runs within. Without that context, you validate the change after it ships, which adds rework and deployment risk.
Kiro turns intent into specifications, code, and pull requests. AWS DevOps Agent investigates incidents and proposes mitigations. Bluebox by Dynatrace supplies the runtime topology, dependency, and traffic data that both draw on, so each change and each investigation is grounded in how the system behaves rather than how it’s expected to behave. In this post, we will follow a travel-booking example from feature design through post-deployment remediation. You’ll see how telemetry from Bluebox shapes a change in Kiro, how AWS DevOps Agent investigates an incident, and where human review and existing CI/CD controls remain in the process.
What are Kiro and AWS DevOps Agent?
Kiro is an agentic development environment that applies AI across the software development lifecycle. Its spec-driven workflow organizes a feature request into requirements, design, and implementation tasks before generating any code.
AWS DevOps Agent is a frontier agent for software delivery and operations across AWS, multicloud, and on-premises environments. It investigates incidents, identifies likely root causes, and recommends mitigations. Its release management capability (Preview) reviews code for release readiness and runs release tests before deployment.
Bluebox by Dynatrace: Helps agents ship the code you trust to production
To close the loop between code generation and production context, Kiro and AWS DevOps Agent rely on real-time production intelligence. This is where Bluebox by Dynatrace fits in. Bluebox provides the observability foundation that detects problems, measures their impact, and surfaces the runtime application topology, service dependencies, and actual traffic patterns that make AI-generated code and autonomous investigations truly production-aware.
Without production telemetry, AI-generated code operates in a vacuum – it cannot know that an endpoint handles 40:1 read-to-write ratios, that a service dependency has specific latency characteristics, or how API traffic fluctuates throughout the day. Bluebox grounds actions taken by Kiro and AWS DevOps Agent in how the system actually behaves, not in assumptions about how it should behave.
How the closed loop works
The combination of Kiro, AWS DevOps Agent, and Bluebox creates a continuous cycle from development through production and back:
Production-aware code generation: Before code is written, Kiro retrieves runtime context from Bluebox – service topology, traffic patterns, and resource utilization. Kiro’s spec-driven workflow translates this context into requirements and generates code that aligns with real production conditions from the first commit.
Confident code review: Kiro generates pull requests with production evidence attached. The release management capability in AWS DevOps Agent reviews the change for dependency impacts, drifts from internal standards, and production readiness – running autonomous tests in isolated environments.
Continuous monitoring: After deployment, Dynatrace continuously monitors application behavior. When an anomaly occurs, Bluebox detects it and surfaces full production context.
Autonomous investigation: Bluebox triggers AWS DevOps Agent with the relevant observability and topology data. AWS DevOps Agent performs a deep investigation, correlating telemetry, logs, infrastructure changes, and deployment history to pinpoint the root cause.
Automated remediation: AWS DevOps Agent generates the mitigation plan from the observability and runtime data that Bluebox provides. Bluebox adds that plan to the investigation report and files it as a GitHub issue. Kiro then proposes a production-aware fix as a pull request for your review, completing the loop.
Figure 1: Bluebox supports the closed loop from feature build to operations.
Next, we walk through a concrete example of this workflow in action.
Walkthrough
We follow a travel-booking application through two connected scenarios: shipping a new feature with production context, then responding to a production incident after it deploys.
Building a production-aware feature
Consider a team enhancing a travel booking application to improve customer experience. You begin by describing a new feature in Kiro, such as updating how products are displayed or adjusting backend logic to support new capabilities. In this case, we are using Kiro IDE.
Figure 2. A feature request in Kiro, with the project’s steering documents loaded for context.
Kiro’s spec-driven workflow expands this request into structured requirements before writing code. You connect Kiro to the Bluebox CLI to retrieve the full production context from Dynatrace: service dependencies, runtime topology, and observed traffic. The following figure shows how Kiro queries current load data for the flight-search path, including the ratio of Amazon DynamoDB reads to writes. Kiro composes and runs the CLI command on your behalf, so you don’t have to type it or set environment variables by hand. The command and its output stay visible in the session, so you can approve it before it runs and check what was retrieved before acting on it. In this case, the command queries the Bluebox API for the requested metrics. The output returns read and write counts per second for the DynamoDB table behind flight search, along with the services calling it.
Figure 3. Kiro runs the Bluebox CLI, then reads the codebase with production context before proposing changes.
The telemetry shows the flight-search endpoint is read-heavy. Users repeatedly query the same routes, at roughly 40 reads for every write against the DynamoDB table. Repeated identical reads are what a cache absorbs, so Kiro proposes an Amazon ElastiCache layer in front of the table, sized to the active working set derived from the observed request distribution. Without the read-to-write ratio, the same request could have produced a larger provisioned table or an added read replica, neither of which addresses repeated identical queries.
Kiro generates the code that implements the change and opens a pull request in GitHub for review. Nothing reaches production until a reviewer approves and merges it. The pull request carries the code changes and the Bluebox telemetry that justified them, so reviewers assess the decision against the same telemetry Kiro retrieved.
Figure 4. Kiro pushes a feature branch and opens a pull request in GitHub.
After review and approval through standard processes, a reviewer merges the pull request, and the existing CI/CD pipeline deploys the change.
Figure 5. The pull request is reviewed and merged through the standard GitHub workflow.
Responding to a production incident
With the feature live, Dynatrace continues monitoring the application. A marketing promotion then drives traffic above the observed baseline, and failed requests start to appear. The loop now runs from operations back to development.
Figure 6. Dynatrace detects a spike in failed requests, surfacing the production incident.
Bluebox collects the relevant observability and topology data, runs an initial root-cause analysis, then opens an autonomous investigation in AWS DevOps Agent. The AWS DevOps Agent multi-agent reasoning architecture decomposes the investigation across specialized capabilities that each examine one class of evidence: telemetry, logs, infrastructure configuration, and recent deployment activity.
Figure 7. Bluebox delegates an autonomous investigation to AWS DevOps Agent.
AWS DevOps Agent locates the cause in the DynamoDB table rather than the new cache. The table’s billing mode had been changed to PROVISIONED, with 5 read capacity units (RCU) and 5 write capacity units (WCU) and no auto scaling. The ElastiCache layer absorbs repeated reads, but cache misses and all writes still reach DynamoDB, and at promotion traffic that residual load exceeds 5 RCU and 5 WCU. AWS DevOps Agent produces a mitigation plan with specific remediation steps. This plan and the full investigation context from Bluebox, is documented as a GitHub issue.
Figure 8. GitHub issue is created with results from Bluebox and AWS DevOps Agent.
Kiro proposes a production-aware fix as a new pull request – including the root-cause analysis, supporting telemetry, and recommended configuration changes.
Figure 9. The Kiro coding session works on the GitHub issue and creates a remediation Pull Request.
The fix is reviewed, merged, and deployed like any other change. Dynatrace then confirms that error rates and response times return to baseline, which closes the loop.
Conclusion
In this post, we showed how Kiro, AWS DevOps Agent, and Bluebox by Dynatrace connect production telemetry with feature development and incident remediation. The travel-booking example keeps human review and existing CI/CD controls in the process while passing operational context from production back to development.
To get started pick one application and define a measurable outcome, such as investigation time, change-failure rate, or pull-request review time. Then:
Download Kiro and start building with spec-driven development
At NVIDIA’s GTC conference, Adobe’s CTO Ely Greenfield walked the audience through the company’s three-year journey building frontier generative AI models from scratch. And the AI training data pipeline required to keep thousands of GPUs productive.
Along the way, he showed a profiler readout from their early training runs—a visualization of exactly how much time each GPU was spending on actual computation versus sitting idle. It revealed that roughly two-thirds of GPU time was spent simply waiting for data. And that idle time had a price tag.
“If we were putting a million dollars into training,” he told the room, “that was $600,000 we were burning away on GPUs sitting and doing nothing.” In other words, roughly sixty cents of every dollar spent on GPU compute was being wasted.
Greenfield’s team traced the waste to two culprits, neither of which is unique to Adobe: whether data can reach your GPUs fast enough, and whether the work it represents is distributed evenly once it arrives.
One culprit is a storage problem. The other isn’t, but you won’t be able to fix it until you’ve solved the first one.
Culprit #1: Storage and retrieval speed
Adobe’s training data lived in petabytes of distributed cloud storage and had to be shipped out to thousands of GPUs constantly, over standard Ethernet. The dataset itself was enormous and varied—images and video, low-res and high-res, simple formats and expensive codecs, all moving at once. Standard networking, which was built for retrieving individual files on request, wasn’t designed for that kind of sustained, parallel, petabyte-scale movement. It became a massive bottleneck.
Checkpointing compounded the problem. As a safeguard, the training run would periodically write a complete copy of the model back to storage. Most of those checkpoints were never needed again. But writing and reading them still consumed real GPU time, which cost a lot of money whether they were used or not.
How Adobe fixed it
Adobe’s solution had two parts.
First, they replaced standard Ethernet with a high-performance networking fabric designed for the petabyte-scale traffic distributed AI training generates. Now, data could finally move at the pace their GPUs needed.
Second, they changed how they saved checkpoints. Instead of writing one giant file containing the entire model, they began breaking the model into smaller pieces and saving pipeline fragments to many places at once. Saving and loading checkpoints now takes significantly less time than it used to. If a checkpoint ever needs to be reassembled, that’s slightly slower, but it’s a rare event. The savings on every other write happen continuously, across thousands of GPUs, around the clock.
The underlying lesson is that for model training, parallel access and sustained high throughput are baseline requirements. Training data has to be immediately accessible at the pace your GPUs consume it, not tucked away in a storage tier that takes minutes or hours to retrieve.
Culprit #2: The data loader problem
A balanced data loader can only do its job if the data it’s balancing is actually available the moment it’s needed. That makes fast storage a precondition for everything else in the pipeline. But even after fixing the storage and retrieval speed culprit, Adobe still had a problem: the way training data was divided across the cluster meant some GPUs were doing far more work than others.
Their pipeline used a straightforward data-parallelism approach: slice the training data into equal-sized chunks and assign one chunk to each GPU in the cluster. But equal-sized chunks weren’t equal work. Some GPUs got simple, low-resolution assets that processed in seconds; others got large, complex files that took minutes. The fast GPUs finished early and sat idle waiting for the slow ones to catch up. And then all of them waited again while their results were merged into one updated model before the next round could begin.
How Adobe fixed it
Adobe stopped treating all data as equivalent. They custom-built a balanced data loader that understood the processing cost of each asset and distributed work so every GPU finished at roughly the same time. Then they restructured how computation was divided across the cluster to make the merging step dramatically cheaper.
A perfectly balanced data loader still idles if the data it’s waiting on hasn’t arrived yet. This is why storage can’t be an afterthought. The loader optimizes what happens once data is there, but storage determines whether it’s there at all.
And building something like Adobe’s balanced data loader takes real engineering investment, including time spent profiling workloads, testing distribution strategies, and tuning until every GPU finishes at roughly the same pace. Teams still fighting storage bottlenecks rarely get to that work. Their engineers are busy figuring out why GPUs are idle in the first place, not optimizing how work gets distributed once data arrives. Removing the storage bottleneck frees up the engineering time needed to tackle the data loader problem properly.
From 40 to 80 cents
After addressing both culprits, Adobe’s GPUs ran at roughly 80% utilization. After accounting for the coordination overhead inherent to running thousands of machines together, 80% is close to the practical ceiling. That’s the difference between a GPU cluster that’s mostly waiting and one that’s mostly working.
The Storage Side of the Solution
Backblaze B2 Overdrive addresses the storage side of exactly the problem Adobe ran into. B2 is always-hot object storage, with no tiering, no retrieval delays, and no waiting for data to be promoted from a cold tier before training can begin. Training data stays immediately accessible whether it was written an hour ago or six months ago.
But availability alone isn’t enough if data can’t move fast enough to keep up with the cluster. B2 Overdrive adds the throughput layer: at up to 1Tbps, it’s designed to keep petabyte-scale GPU clusters fed continuously, not just handle occasional bursts of traffic. Both layers are S3-compatible, so they drop into existing PyTorch or TensorFlow pipelines without a rewrite. And because egress is free, moving training data between storage and GPU compute—across regions or providers—doesn’t add a cost penalty on top of a performance one.
Checkpointing benefits from the same foundation. Adobe’s solution of breaking the model into fragments and saving them to many places at once only works if the underlying storage is fast and parallel enough to make it pay off. Always-hot, high-throughput storage makes checkpoint writes and recoveries faster across the board, so they cost less GPU time whether they happen rarely or often.
Backblaze can’t write your data loader for you, but it can make sure that once you’ve built one, it isn’t waiting on storage to do its job.
Building generative media applications on object storage: What the strongest projects have in common
Between June 22 and August 3, 2026, 1,314 people entered hundreds of projects into a single brief: build a generative media app on Backblaze B2 object storage, orchestrated through the open-source Genblaze SDK, for a share of a $10,000 prize pool.
Almost every entry could generate an image, a video, or a soundtrack, and generate it well. What separated the strongest was the layer underneath: what gets written down, what can be proved later, and what happens when a file has to be checked, corrected, or locked against deletion.
Here’s a closer look at the five that went furthest, and the parts worth reusing. Every entry is browsable in the hackathon project gallery.
The brief, and why it was narrow on purpose
The brief was narrower than most hackathons get. Submissions couldn’t just be a working demo and a repo. Devpost required teams to explain, in writing, how their app actually used both Backblaze B2 and Genblaze, and to list every provider and model behind it. Judging ran against four criteria: real-world utility, production readiness, meaningful use of B2, and meaningful use of Genblaze.
That last pair is the constraint that did the work. “Meaningful use” rules out the default architecture, where a team generates an asset, drops the bytes in a bucket, and calls that storage. It forces a decision about what the storage layer is actually for. What follows is written the way a technical and creative director would walk five finished pipelines against exactly that rubric: who each app is actually for, whether it holds up past the demo, and how deep the storage and orchestration choices go.
The two primitives
Backblaze B2 is the ground every one of these apps had to build on: S3-compatible object storage, sized for the sheer volume of generated assets, thumbnails, metadata, and provenance records a media pipeline throws off, free to start with 10GB included.
Genblaze, Backblaze’s open-source orchestration SDK, is what feeds it: a unified Pipeline API spanning providers like OpenAI, Google, Runway, Luma, ElevenLabs, and Stability Audio, plus models served through platforms such as GMI Cloud and NVIDIA NIM, so a team can swap providers without rewriting its orchestration. Every run produces a canonical provenance manifest that can be embedded directly into the media file itself (an .mp4, a .png, an .mp3) and persisted to B2 or any S3-compatible store.
The hackathon also partnered with GMI Cloud, giving teams easy access to open-source generative models for image, video, audio, chat, reasoning, and multimodal work, which is why it turns up as a provider more than once below.
Two primitives, six weeks, hundreds of teams, and five very different examples of rigor.
A review room for AI video ads that doesn’t make you wait for the whole render.
firstframe builds a review room for the marketing and creative teams who commission AI-generated video ads: instead of waiting on a full multi-scene render before anyone can react, it streams the first finished scene as a live HLS playlist the moment it’s ready, appending segments as later scenes land. A reviewer starts giving notes while the ad is still being made, not after.
Every generated scene is scored by an actual vision model before a human ever sees it, so obviously broken output gets caught and retried automatically rather than shipped to a reviewer’s inbox. A failover step swaps in a backup model only on a genuine provider error, never on an ordinary slow response, and once a scene clears review its master file and manifest are locked against deletion for thirty days: a guarantee the code proves by trying to delete a locked file and catching the rejection. Automated QA paired with a tamper-evident record of what was approved is what turns a generation pipeline into something a brand could actually sign off on.
On B2, the bucket’s folder structure doubles as a workflow: a scene moves through incoming, running, provenance, approved, and rejected prefixes as it clears review. Once a scene is approved, its master file and manifest get a real thirty-day write-once hold using B2’s Object Lock in Governance mode, and the code proves that isn’t just decorative by trying to delete a locked object by its version ID and catching the rejection B2 throws back. A reviewer’s application key is scoped to the readFiles capability with a name prefix restricting it to the approved folder alone. Four separate lifecycle rules cover the bucket’s different prefixes: stalled uploads in incoming have their multipart parts cancelled after 24 hours, while rejected, in-progress, and approved objects each age out on their own separate timers. The video segments themselves land in B2 as ffmpeg finishes each one, with the playlist rewritten after every segment, which makes B2 a live broadcast target rather than an archive that fills up after the fact. Reads go out as path-style presigned URLs, working around a known issue where virtual-host-style presigning fails on a private B2 bucket. B2’s own Event Notifications, five signed webhook rules, keep the review room in sync in real time, with a fallback to plain polling if an account’s Event Notifications API isn’t enabled. The app also watches B2’s own transaction cap and backs off to local disk instead of crashing when a call gets rejected for exceeding it.
On Genblaze, generation runs through an AgentLoop scored by a ThresholdEvaluator. The judge is a real vision model, an NVIDIA NIM llama-3.2-90b-vision-instruct instance grading the actual rendered keyframes, not a fixed retry count. Two pipeline branches, audio and video, fan into a single compositor node instead of running as a straight chain, a fallback_models failover is wired in and confirmed to trigger only on a genuine model error rather than a timeout, and every run carries two layers of lineage: a shared run id across scenes and loop iterations, plus a second, custom chain id layered on top of that. The team even embedded the manifest directly inside the delivered MP4, so a separate verification command can re-download and re-hash every asset the file claims exists. Along the way they filed three pull requests and an issue against Genblaze itself.
firstframe puts B2’s feature set to work in front of the reviewer. Object Lock in Governance mode, scoped application keys, lifecycle rules, Event Notifications, and presigned URLs are all load-bearing parts of the review workflow, doing visible work on every scene that moves through it. That’s architecture built to be trusted, not just to work.
A campaign generator built to double-check its own storage, re-verifying every asset the moment it’s read back.
beavous is built for the marketers and small commerce teams who need a full paid-social campaign out of a single product photo: not one hero image, but four creative concepts, sixteen cropped aspect ratios for every placement, on-label ad copy, and a portrait video reel, packaged as a verified ZIP pulled straight from B2.
A public API hands off to a private worker behind a task queue, and every campaign is namespaced to an organization so tenants stay isolated from each other. When a generation gets rejected, the app doesn’t start over. It chains a correction onto the original attempt, which is closer to how a real creative review actually works than a one-shot retry.
On B2, keys are organized hierarchically by organization and campaign rather than by content hash, because the product is multi-tenant by design. Every upload and download goes through a presigned URL, and the database never stores a raw link, only an object key and a hash. Every time an asset is read back, beavous re-downloads it and re-hashes the bytes independently, rather than trusting a manifest check alone. B2 is treated as the single, sole system of record for every generated asset: a clean, one-source-of-truth design with nothing else to keep in sync.
On Genblaze, three custom providers handle Gemini image generation, Gemini video, and Veo image-to-video, each with its own tiered pricing registered on the model. The more interesting move is a correction chain: when a generation gets rejected, its manifest becomes the parent of the next attempt, an explicit correction lineage most one-shot generation pipelines skip entirely. Prompts are marked private so the text never lands in the public manifest, only a hashed reference to it does, and before any manifest is trusted as a correction parent it gets independently re-verified, not assumed correct just because it was the app’s own write.
beavous’s answer to “do you trust your own storage” is simple: no, never. Check it again, every time. That’s a slower design than trusting your own write, and a more honest one.
A build system for generative media that can prove its own reuse, recovery, and release integrity, live, against B2.
takegraph is built for teams running a production, not a single generation: the kind of project where a script tweak halfway through shouldn’t mean re-rendering everything from scratch. It treats the whole thing like a software build: a content-addressed dependency graph that, when a spec changes, recomputes fingerprints, rebuilds only what’s actually invalidated, and reuses everything else.
A team can also re-download and re-hash the actual bytes behind any reuse, recovery, or release straight from B2, live, checking integrity themselves instead of trusting a log. That kind of self-auditing separates a pipeline meant to run unattended for months from one built to survive a single demo.
On B2, content-addressed keys use a two-level hash split so directory listings stay fast at scale, B2’s own Event Notifications (HMAC-SHA256-signed webhooks) feed a background process, and a separate reconciler periodically re-checks everything by hand in case a webhook is ever missed, coordinated across workers with a database lock so only one reconciler runs at a time. Unvalidated uploads land in a quarantine prefix backed by a real lifecycle rule that expires it automatically, and a bad key gets rejected outright rather than silently rewritten. Two least-privilege application keys, one for day-to-day work and one for releases, are each scoped to a single bucket, and CORS rules on the work bucket exist specifically to support presigned browser uploads. Verification (re-download, re-hash, prove it) is a feature of the product, not an internal tool.
On Genblaze, takegraph builds a real pipeline around the idea: a dedicated run builder, a content-addressable storage sink, manifests, and observability events tied to every step. The team kept its media-generation side lean, calling straight through the GMI Cloud connector for image and video (one of the hackathon’s partner platforms), and pointed all of its custom engineering at the layer that makes the whole pitch work: the storage and consistency system underneath.
takegraph turns storage verification into the product itself: reuse, recovery, and release integrity are things a user can ask the system to prove, live, rather than take on faith. That’s B2 treated as a system of record in the fullest sense: self-healing, event-driven, and built to survive a missed webhook without anyone noticing.
A comic studio with a provider for every model it needed, and a manifest for every frame it drew.
Ninth is built for indie comic authors and motion-comic creators working on a small budget, who revise a scene a dozen times before it’s right and can’t afford to pay for a fresh generation on every pass. Describe a story, and it writes, draws, casts, and stages it panel by panel on an editable timeline, then bakes the result to an MP4.
An edit doesn’t force a re-generation: assets are pulled from a semantic library whenever something close enough already exists, and everything the AI produces (timing, layer position, camera, bubble placement, even the artwork itself) stays editable in place afterward. That reuse-first design is backed by 126 regression tests and a render path that shares its engine with the live editor, so what a creator previews is exactly what gets exported.
Its B2 layer favors verified durability: flat content-addressed keys and a manifest per run, plus real, working endpoints for audit, restore, and backfill that report exactly what’s on B2 versus what’s only on local disk, and rebuild the difference with a SHA-256 check on every recovered file.
On Genblaze, Ninth wrote seven or eight custom providers, covering nearly every model it reached for: Azure’s image model, Gemini’s aspect ratios, Veo keyframes, Gemini’s video interpolation model, ElevenLabs music, and two separate structured-text providers. Each one exists for the same reason: to keep that artifact inside a pipeline and give it a manifest, so a generated frame always carries a record of the run and the prompt that made it.
Ninth’s mention is for discipline: the project that took “every generated frame should be reproducible and recoverable” most literally, and built the tooling to prove it on demand.
A spatial twin that gives a person’s spoken correction the same provenance as a model’s output.
Spatialize is built for venue and accessibility teams who need to rehearse a step-free route through a space before anyone sets foot in it: it turns a flat floor plan into a voice-navigable spatial twin, extracting validated 3D geometry from the plan image, then answering spoken questions with route guidance grounded in that geometry.
Because the underlying use case is safety-adjacent, nothing the model proposes is trusted outright. Every extracted floor plan, and every voice-driven edit to it, has to pass the same deterministic geometry validator before it’s accepted, so a plausible-looking but wrong route never quietly makes it into a rehearsal. When that validator rejects an attempt, it hands back the exact error, and the next attempt corrects specifically that, not a blind retry.
On B2, Spatialize favors resilience: every read goes through a short-lived, presigned link, and if B2 isn’t configured at all, the app quietly falls back to a local, path-safe store instead of failing to boot. It runs two storage paths side by side (its own hierarchical object store for run and scene state, and a separate Genblaze storage sink dedicated to generated-media provenance), keeping application state and generation history cleanly apart.
Under the hood, an agentic loop drives the floor-plan extraction, evaluated at each attempt by that same deterministic validator rather than an LLM’s opinion. Three custom text-to-speech providers form a genuine fallback ladder: a cloud model first, a lightweight third-party API next, and a self-hosted, zero-credential model as the last resort, so a narration request degrades gracefully rather than failing outright. The standout idea: a voice-driven edit to the scene creates a new version tagged as a human change, with the actual transcript kept as evidence, so every point in the final scene traces back to either a model’s manifest or a person’s own words.
Spatialize’s real achievement is conceptual: it gives a spoken correction the same seriousness as a model’s output, tracing every point in the final scene back to either a manifest or a transcript. That’s provenance thinking applied somewhere most generative pipelines never point it.
Same brief, different rigor
Every winning project found its own discipline. What they share is how many different, equally valid kinds of rigor a small team can bring to the same two primitives in six weeks. firstframe made B2’s write-once guarantee visible to a reviewer in real time. beavous made re-verification a habit instead of an afterthought. takegraph made its storage layer heal itself. Ninth made every one of its seven custom providers answerable to the same manifest. Spatialize made a human correction as provable as a model’s.
None of that shows up until a team stops treating storage and orchestration as plumbing and starts treating them as part of the design. firstframe’s win sits at the intersection of both: the same rigor that scores a generated frame with a vision model also locks the finished one against deletion.
What you can build on
Strip the five projects back and the same handful of moves keep appearing, none of which need a hackathon, a large team, or a novel model:
Object Lock in Governance mode turns “approved” from a database flag into a storage-level fact, and firstframe proves the hold is real by attempting the delete by version ID and catching the rejection B2 returns.
Bucket prefixes (incoming, running, approved, rejected) give you queue semantics without a queue, with a separate lifecycle rule per prefix so stalled multipart uploads and dead rejects expire on their own timers.
Re-download and re-hash on read, the way beavous does, because a non-deterministic pipeline produces a lot of near-identical artifacts and hashing is how you know which one you’re holding.
Event Notifications as the fast path, a periodic reconciler as the source of truth, so a dropped webhook costs you latency instead of correctness.
Content-addressed keys with a two-level hash split keep directory listings fast at scale and make reuse cheap: same fingerprint, same bytes, no second generation to pay for.
Application keys scoped one per role, like a reviewer key limited to the readFiles capability with a name prefix restricting it to the approved folder.
Correction lineage instead of retries: the rejected run’s manifest becomes the parent of the next attempt and carries the specific error forward. beavous and Spatialize arrived at this independently, which suggests it’s the general shape rather than a niche trick.
All of it is available today. B2 starts free with 10GB, and Object Lock, lifecycle rules, Event Notifications, scoped application keys, and presigned URLs are in the API from day one. Genblaze gives you one Pipeline API across OpenAI, Google, Runway, Luma, ElevenLabs, and Stability Audio, plus models served through GMI Cloud and NVIDIA NIM, and a canonical provenance manifest out of every run that embeds straight into the .mp4, .png, or .mp3 you ship.
A good first project is smaller than any of these five. Take a pipeline you already have, write a manifest for every run, persist it to B2, and add one endpoint that re-downloads and re-hashes an asset to prove the manifest is honest. That’s a weekend of work, and everything above is a variation on it. Genblaze is open source, and three of the pull requests behind firstframe are already in it.
For more ideas, the full project gallery has every entry from the hackathon, and there’s a lot in there beyond the five covered here.
Java developers no longer have to rely on Java framework-specific approaches to drive AI from their enterprise apps.
While it is true that Langchain4j empowered developers by disintermediating specific AI vendors, you still had a dependency on Langchain4j. And with Spring AI, well, of course you had a dependency on design choices made by Spring, if not on Spring itself.
Now, GitHub Copilot SDK for Java is the first truly framework agnostic way to drive AI from Java. And with its BYOK support, GitHub Copilot SDK for Java is also AI vendor neutral.
💡 Even though it’s called GitHub Copilot SDK, you can use it with any direct model provider, such as OpenAI, Azure, Anthropic, or OpenAI-compatible endpoints, by passing a provider/ProviderConfig with your own baseUrl + apiKey (or bearer token). No Copilot subscription required.
The GitHub Copilot SDK for Java is a client library that empowers your server-side Java code to create Copilot agent sessions, register tools, send prompts, and receive structured responses—all programmatically. It works in server environments, including Jakarta EE and Spring. If you’ve been building enterprise Java for any length of time, this SDK will feel like home: CompletableFuture, annotations, lambdas, virtual threads, it’s all here.
This post shows you how to use the SDK, walks through a complete Jakarta EE 11 sample application, and leaves you with concrete next steps to try it yourself. I chose Jakarta EE 11 for my demo because I was the lead release coordinator for that release. I believe in open standards as the best way to empower developers. For more on Jakarta EE 11 see this InfoQ article.
This sample app is an agent harness using Jakarta EE 11. But, of course, developers can build their own agent harness using the well-known Java frameworks and libraries of their choice.
git clone https://github.com/microsoft/Build26-BRK206-your-agent-anywhere-multiclient-multidevice-with-github-copilot-sdk.git
cd Build26-BRK206-your-agent-anywhere-multiclient-multidevice-with-github-copilot-sdk/src/java-agent-orchestrator
mvn clean package liberty:run
# Open http://localhost:9080/index.xhtml
The Java demo is built on:
Concern
Technology
Runtime
Open Liberty 26.0.0.5
Platform
Jakarta EE 11 (Faces 4.1, CDI 4.1, WebSocket 2.2, Data 1.0, Persistence 3.2)
UI
PrimeFaces 15.0.16
AI orchestration
Copilot SDK for Java 1.0.7-preview.1
Database
H2 in-memory (10 seed property listings)
What the app does
The application is a real-estate lead-management agent pipeline. A customer submits an enquiry (“I’m looking for a 3-bedroom house in London under £800,000”), and the system spins up an isolated Copilot Agent on a virtual thread to process it through a pipeline:
The architecture uses Jakarta WebSocket to push real-time status updates from the server to the browser, so you can watch agents progress through phases as the model calls tools:
Submit multiple inquiries simultaneously to see concurrent virtual-thread agents in action. Each one processes independently with its own Copilot session.
SDK features in action
Let’s walk through the key SDK features as they appear in the sample code.
Defining tools with @CopilotTool
This is the headline API. If you’ve ever written a @GET endpoint in JAX-RS or an @MessageDriven bean, this will feel instantly familiar:
@CopilotTool(value = "Sets the current phase of the agent. Use this to report progress.",
             name = "set_current_phase")
public String setCurrentPhase(
        @CopilotToolParam("The phase to transition to (VALIDATING, SEARCHING, "
                + "WRITING_REPORT, REJECTED_GARBAGE, REJECTED_NO_MATCHES, or DONE)")
        String phaseName) {
    phase = Phase.valueOf(phaseName.trim().toUpperCase(Locale.ROOT));
    notifyUi();
    return "Phase set to " + phase.getLabel();
}
The @CopilotTool annotation declares the method as a tool the model can call. The @CopilotToolParam annotation describes each parameter so the model knows what to pass. The SDK handles all the JSON Schema generation, argument parsing, and dispatch. You just write a normal Java method.
Two build prerequisites for @CopilotTool. The annotation-based tool API is currently an experimental feature of the SDK, so you need to configure two things in your Maven build:
Enable experimental APIs: pass -Acopilot.experimental.allowed=true to the compiler. Without this flag, the annotation processor will refuse to generate the tool metadata. For more details on the experimental APIs see Copilot SDK documentation.
Register the annotation processor: add the SDK as an annotationProcessorPath so the compiler can find the @CopilotTool processor and generate the $$CopilotToolMeta classes at compile time.
When you want a tool defined at the call site without a dedicated method, use the lambda style:
ToolDefinition reportIntentTool = ToolDefinition
        .from("report_intent",
              "Reports the current intent of the agent",
              Param.of(String.class, "intent", "Intent in max 4 words"),
              (String intent) -> {
                  currentIntent = intent;
                  addEvent(Instant.now(), "intent", "Intent updated", intent);
                  notifyUi();
                  return "ok";
              })
        .overridesBuiltInTool(true);
Notice .overridesBuiltInTool(true). This tells the SDK that our report_intent tool deliberately replaces a built-in tool of the same name. This is useful when you need custom behaviour for a tool the model already knows about.
Cross-class tool scanning
Tools don’t have to live in the same class as your agent logic. Here’s searchProperties defined in a separate CDI bean:
@ApplicationScoped
public class PropertyDatabase {

    @CopilotTool(value = "Searches the real estate listings database. "
                       + "Returns up to 10 matching properties.",
                 name = "search_properties")
    public List<Property> searchProperties(
            @CopilotToolParam("Property type substring (e.g. 'flat', 'house')") String type,
            @CopilotToolParam("City substring (e.g. 'London', 'Bristol')") String city,
            @CopilotToolParam("Minimum number of bedrooms (0 for no minimum)") int minBedrooms,
            @CopilotToolParam("Maximum price in GBP (0 for no maximum)") double maxPriceGbp) {
        // ... filter and return matching properties ...
    }
}
You would normally register these with ToolDefinition.fromObject(propertyDatabase). In the sample app, we use a lambda wrapper instead, because CDI client proxies can obscure the annotation metadata.
Customizing the system message
The SDK gives you fine-grained control over the system message. Use SystemMessageMode.CUSTOMIZE to replace specific sections while preserving the rest:
SystemMessageConfig systemMessage = new SystemMessageConfig()
        .setMode(SystemMessageMode.CUSTOMIZE)
        .setSections(Map.of(SystemMessageSections.IDENTITY,
            new SectionOverride()
                .setAction(SectionOverrideAction.REPLACE)
                .setContent("""
                    You are part of a real estate recommendation system.
                    You will receive enquiries from customers, and you must
                    carry out the following workflow...
                    """)));
The text block ("""...""") makes multi-line prompts readable without string concatenation. The IDENTITY section override replaces only the model’s self-description while leaving safety guardrails intact. If you prefer a simpler approach, SystemMessageMode.APPEND adds your content after the default system message without replacing anything.
The agentic loop: sendAndWait(...)
One line kicks off the full agentic loop:
session = client.createSession(sessionConfig).get();
// ...
AssistantMessageEvent result = session.sendAndWait(escapedEnquiry).get();
Behind .get(), the model reasons, calls your tools (potentially multiple times), and returns its final response. On a virtual thread, .get() is cheap. No platform thread is consumed while waiting. The SDK dispatches tool calls to your registered handlers automatically and feeds results back to the model until it’s done.
Real-time event handling with session.on(...)
Subscribe to session events to build responsive UIs:
Every tool call, every result, every assistant message fires an event. The sample app captures these events and pushes them to the browser via Jakarta WebSocket, so the pipeline dashboard updates in real time. You can use pattern matching to handle specific event types:
if (event instanceof AssistantMessageEvent msg) {
    finalReport = msg.getData().content();
} else if (event instanceof ToolExecutionStartEvent start) {
    // Tool is being invoked...
}
Headless client and permission handling
The client is configured for server-side operation:
copilotClient = new CopilotClient(
        new CopilotClientOptions()
                .setMode(CopilotClientMode.EMPTY)
                .setCopilotHome(copilotHome)
                .setExecutor(contextualVirtualThreadExecutor));
CopilotClientMode.EMPTY means no IDE integration — the client talks directly to the Copilot CLI. The custom Executor (discussed below) ensures tool callbacks run with container context.
APPROVE_ALL is appropriate for demos and development. In production, implement a real permission policy that validates which tools the model is allowed to invoke.
Jakarta EE integration patterns
The SDK is not a framework island. It composes naturally with Jakarta EE — and of course also with proprietary frameworks such as Spring.
The Executor parameter is the key integration point. Jakarta Concurrency (§5.2 in the 3.1 spec) requires that application-created threads be obtained from a ManagedThreadFactory so the container can:
Track the thread for lifecycle shutdown (@PreDestroy / server stop)
And use it to create the Executor we pass to the Copilot SDK.
// The ManagedThreadFactory (virtual=true) creates container-managed virtual
// threads that automatically propagate CDI, JNDI, and transaction context.
Executor managedVirtualExecutor = runnable ->
    virtualThreadFactory.newThread(runnable).start()

String copilotHome = Path.of(System.getProperty("user.home"), ".copilot").toString();
CopilotClientOptions copilotClientOptions = new CopilotClientOptions()
        .setMode(CopilotClientMode.EMPTY)
        .setCopilotHome(copilotHome)
        .setExecutor(managedVirtualExecutor);
copilotClient = new CopilotClient(copilotClientOptions);
This creates virtual threads that carry the container’s context. When the SDK dispatches a tool call to searchProperties(), that method can @Inject a JPA repository and query the database, because the container context is present on the callback thread.
Other integration patterns in the sample:
CDI @ApplicationScoped for the singleton CopilotClient (one client per application lifecycle).
Jakarta Faces f:websocket push for real-time browser updates via PushContext.
Jakarta Data @Repository for type-safe database queries without raw JPA boilerplate.
Fine-grained tool access control with ToolSet. The SessionConfig lets you specify exactly which tools each session can access:
sessionConfig.setAvailableTools(new ToolSet()
        .addCustom("*")           // all registered custom tools
        .addBuiltIn("web_fetch")); // only the web_fetch built-in
This is an important production concern. Rather than exposing every built-in tool (file system access, shell execution, etc.), you explicitly opt in to only what the agent needs. In the sample app, we allow all custom tools plus web_fetch so the agent can look up real-time property information during the Search phase.
Summary
Here’s what we covered:
Java-native API: CompletableFuture, annotations, lambdas, and virtual threads make the SDK feel like idiomatic Java, not a ported-from-another-language afterthought.
Three tool-definition styles: annotations for enterprise patterns, lambdas for inline convenience, JSON Schema for full control.
System message customization: section-level overrides give you precise control over agent behaviour.
The agentic loop in one line: sendAndWait(...) handles the full tool-calling loop automatically.
Real-time event streaming: session.on(...) enables responsive UIs and observability.
Headless server-side operation: no IDE required; runs anywhere the Copilot CLI is available.
Natural composition with Jakarta EE: CDI, JPA, WebSocket, and virtual threads all work together through the Executor integration point.
What to try next
Explore the BYOK support. The GitHub Copilot SDK can be used directly against model providers, for example OpenAI, Azure, Anthropic, or OpenAI-compatible endpoints, by passing a provider/ProviderConfig with your own baseUrl + apiKey (or bearer token). No Copilot subscription required.
Clone the sample app and run it locally. Submit multiple enquiries simultaneously to see virtual threads in action.
Swap the model. Try session.setModel(...) to experiment with different Copilot models.
Add your own tool. Define a new @CopilotTool method (a mortgage calculator, a school-district lookup) and watch the agent discover and use it.
Deploy to Azure. Open Liberty runs great on Azure App Service, AKS, or Azure Container Apps. See the Jakarta EE on Azure guidance at https://aka.ms/java/ee.
The Copilot SDK for Java puts the full power of GitHub Copilot behind your Java code with no IDE required and no framework lock-in.
Large-scale machine learning workloads: training, fine-tuning, and inference run on clusters of hundreds to thousands of GPU instances for days or weeks at a stretch. Keeping operational visibility across a fleet of this size is a constant challenge: hardware health events, node lifecycle transitions, capacity fluctuations, and workload-level issues appear in the event stream around the clock, including nights and weekends.
Amazon SageMaker HyperPod is a purpose-built managed cluster service that lets you run distributed model training, fine-tuning, and inference across hundreds of accelerated instances. It provides built-in resiliency that automatically detects and replaces faulty hardware, so long-running jobs can continue with minimal interruption.
For teams operating these clusters, the scale still creates a fundamental tension: you need continuous visibility into your fleet, but you can’t afford to keep engineers watching the event stream 24/7.
What HyperPod resiliency already handles
SageMaker HyperPod’s built-in resiliency layer automatically detects and self-heals instance-level GPU failures. When the Health Monitoring Agent (HMA) identifies a bad GPU, the HyperPod resiliency layer drains, reboots, or replaces the node depending on the error type, and the job resumes without human intervention. This is exactly what you want: routine hardware failures are handled automatically so your training runs keep going.
This solution does not replace HMA or any part of HyperPod’s resiliency. It adds an autonomous investigation layer on top, using the cluster events and health signals that HMA and HyperPod already produce as its input.
Operational conditions where a human still wants to be in the loop
With that self-healing in place, there are operational conditions where a human still wants to be in the loop or decide:
Configuration issues: a lifecycle-script change you made, a misconfigured mount, or a networking/security change that causes provisioning failures on every new node.
Capacity conditions: a replacement waiting on capacity in the pool, where the operator needs to know recovery is in flight and can decide whether to intervene.
Recurring hardware faults: each fault self-heals correctly, but the same GPU error signature recurring across three or more replacements on one instance group in a week is a pattern worth surfacing to an operator as a single signal.
Workload-level conditions: Pods stuck in CrashLoopBackOff for hours, nodes sitting NotReady, or GPU allocation chronically low.
Without automation, these conditions push operators into round-the-clock manual triage: correlating events across the SageMaker control plane, Amazon EKS, and Amazon CloudWatch, and deciding whether HyperPod is still recovering or needs a hand.
Opportunity: AWS DevOps Agent as a 24/7 companion
AWS DevOps Agent provides an autonomous incident-response platform that can be taught a domain’s operational model through custom skills. By wiring your HyperPod cluster into DevOps Agent, you get a 24/7 companion that complements HyperPod’s self-healing. It watches for the operational conditions that still need a human decision, triaging them, root-causing them, and delivering a clear verdict with recommended actions.
By design, DevOps Agent is configured to run in observe-and-report mode for this integration – it is not granted SSM, SSH, or action-taking permissions against your cluster or its nodes. The agent reads cluster events, control-plane state, Kubernetes objects, and CloudWatch logs to reconstruct what happened; every corrective action (node reboots, replacements, drains) continues to be performed by HyperPod’s own resiliency layer or by an operator responding to the emailed verdict. This read-only boundary is deliberate: it keeps the agent’s blast radius zero while still delivering the correlation and triage value.
In this post, you will learn how to connect any SageMaker HyperPod cluster (either the EKS or Slurm Orchestrator option) to AWS DevOps Agent. Conditions are auto-detected, triaged, root-caused from cluster state and CloudWatch logs, and emailed as a clear verdict.You will also see how the solution can be extended to detect additional conditions specific to your workloads.
Solution Overview
What this solution delivers
This solution wires any SageMaker HyperPod cluster into AWS DevOps Agent so that operational conditions calling for a human decision are auto-detected, triaged, root-caused, and delivered as a human-readable verdict email. Specifically, you get:
Autodetection of HyperPod conditions that complement resiliency self-healing, from the live SageMaker event stream and a periodic Kubernetes-state audit.
Triage + root-cause analysis by the DevOps Agent, taught HyperPod’s operational model via two custom skills. It reconstructs the incident timeline and decides whether HyperPod is still recovering or needs an operator.
Human-readable verdict emails: Monitor (recovery in flight, here’s the ETA), Escalate (you need to act, here’s why and what to do), or Resolved (auto-recovery closed the loop). Noise is filtered out.
Extensibility: customize what conditions are detected (by modifying the periodic-audit Lambda) and how the agent reasons about them (by editing the plain-English skills).
The following screenshot shows the DevOps Agent incident response dashboard with example verdict emails for three common fault types:
DevOps Agent incident response dashboard showing investigation list and timeline, with three email verdict examples for GPU NVLink fault, lifecycle-script bootstrap failure, and insufficient-capacity errors
Architecture
The whole solution deploys one AWS CloudFormation stack per cluster. Two event paths feed the DevOps Agent, and one path carries its verdicts back out to you.
Architecture diagram showing the event flow from HyperPod Health Monitoring Agent through EventBridge to DevOps Agent and email notification
This architecture shows a 1:1 relationship between a HyperPod cluster and a DevOps Agent space, and the deployment instructions in this post follow that model. If you need to associate multiple clusters with a single Agent Space, you can customize the CloudFormation template and the ClusterFilter parameter to widen the allowlist of cluster names forwarded by the webhook bridge.
Event flow
Event-driven issue detection: HyperPod emits cluster-state, node-health, and capacity events to Amazon EventBridge. The webhook bridge Lambda drops routine Info-level noise, maps the rest into a DevOps Agent investigation payload, signs it with HMAC-SHA256 using a shared secret stored in AWS Secrets Manager, and POSTs it to the agent’s generic webhook.
Polling-based issue detection: A periodic-audit Lambda checks Kubernetes state (CrashLoopBackOff pods, NotReady nodes) every 15 minutes and fires only when it finds a real issue, plus a daily heartbeat confirming the pipeline is alive. On a healthy cluster, nothing is POSTed, so no investigation runs and no cost is incurred.
Investigation: DevOps Agent receives the payload and runs two custom skills: the triage skill decides whether to link (duplicate), skip (noise), or proceed (investigate). The RCA skill reconstructs the timeline using describe-cluster, list-cluster-nodes, list-cluster-events, kubectl, and CloudWatch logs (HMA health monitoring, lifecycle scripts), then classifies the incident as Suppress, Monitor, Escalate, or Resolved.
Notification: An Amazon Lambda function sends notification emails via Amazon SES. It listens on the aws.aidevops event stream for investigation completions, reads the verdict from the agent’s journal, and sends an email with the headline, what happened, likely cause, and recommended action. Suppress verdicts are filtered to avoid noise on healthy clusters.
Getting started
For a step-by-step walkthrough to deploy this solution, visit the DevOps Agent Integration guide. Once you have the solution running, the following sections explain how to customize detection, reasoning, and notifications for your environment.
Prerequisites
An AWS account with AWS CLI v2 configured for the target region.
An existing SageMaker HyperPod cluster (EKS or Slurm orchestrator).
IAM permissions to create roles, deploy CloudFormation, manage Secrets Manager, and call devops-agent:* and eks:CreateAccessEntry.
For email notifications: a verified Amazon SES sender identity. You can verify an email address in the Amazon SES console or with the AWS CLI. After running the command below, the address owner will receive a verification email and must click the confirmation link:
Recipients must also be verified if your SES account is still in sandbox mode.
Deploying with CloudFormation
The solution deploys as a single CloudFormation stack. Clone the awsome-distributed-ai repository, create a params.json with your cluster name and email settings, and run:
cd 1.architectures/5.sagemaker-hyperpod/tools/devops-agent

# 1. Set up a Python env with boto3 >= 1.43.25
python3 -m venv .venv && source .venv/bin/activate && pip install 'boto3>=1.43.25'

# 2. Fill in your cluster name and email addresses
cp deploy/params.example.json deploy/params.json
# edit: HyperPodClusterName, EmailSender, EmailRecipients

# 3. Deploy
make deploy
This provisions the Agent Space with read-only EKS access (auto-discovered from the cluster’s orchestrator ARN), the EventBridge rule and webhook bridge Lambda, the periodic-audit scheduler, and the email notifier. For Slurm-orchestrated clusters, the EKS access step is skipped automatically.
The webhook bridge — mapping HyperPod events to DevOps Agent
An EventBridge rule captures HyperPod events and invokes a Lambda function. The Lambda forwards all Warn and Error level events, normalizing each into a DevOps Agent investigation payload. It extracts the failure message, instance group, and event metadata, then signs it with HMAC using a shared secret stored in AWS Secrets Manager, and POSTs it to the agent’s generic webhook endpoint. Info-level events are dropped at the bridge to avoid creating investigations for routine status updates.
A cluster allowlist parameter lets you scope which HyperPod clusters trigger investigations, useful when multiple clusters share the same account and region.
How the skills are defined — teaching the agent HyperPod’s operational model
AWS DevOps Agent skills are plain-English instructions that teach the agent how to reason about a domain. This solution includes two complementary skills:
The triage skill runs first on every incoming task. It decides whether to link the event to an existing investigation, skip it, or proceed to a full investigation.
Why triage matters — a concrete example: When a single node fails, HyperPod’s replacement process emits multiple events in quick succession: “lost orchestration-ready status,” “provisioning started,” “capacity request initiated.” Without triage, each event would spawn a separate investigation. The triage skill recognizes these events belong to the same incident (same instance group + overlapping time window) and links them, so only one investigation runs. This saves investigation compute and avoids duplicate emails.
When to SKIP: When a node is already being replaced and a follow-up “lost orchestration-ready status” event arrives with a generic “Request to service failed” message, the triage skill recognizes that a replacement is already in progress for that instance group and skips the event. No new investigation is created for what is simply a progress update of an existing recovery.
When triage produces PROCEED, the RCA skill takes over. It reads cluster state, events, and logs, reconstructs an incident timeline, and classifies the situation into one of four verdicts:
RCA Flowchart showing the four phases of root-cause analysis: data gathering, timeline reconstruction, classification, and recurrence check
Phase 1 — Data gathering: The skill reads describe-cluster, list-cluster-nodes, list-cluster-events, and CloudWatch log streams (HMA health monitoring, lifecycle scripts) to collect the raw facts.
Phase 2 — Timeline reconstruction: It orders events chronologically and identifies the fault chain: what triggered what, which nodes were affected, and what recovery actions HyperPod took.
Phase 3 — Classification: Based on the timeline, recurrence statistics, and HyperPod’s resiliency behavior, it assigns a verdict:
Suppress — a non-issue (for example, a transient event that has already resolved).
Monitor — recovery is in flight; here’s the expected resolution window.
Escalate — you need to act; here’s the root cause and recommended action.
Resolved — auto-recovery closed the loop; no action needed.
Phase 4 — Recurrence check: The skill computes sliding-window statistics over the one week cluster event history. When thresholds are crossed, the verdict escalates to alert the operator of a systemic pattern. For example, the same GPU error signature on the same instance group three or more times in a week, or five or more replacements fleet-wide in 24 hours.
The verdict is written to the agent’s investigation journal along with a human-readable report containing what happened, the likely cause, and recommended operator actions.
The periodic-audit Lambda — Kubernetes state monitoring
The periodic-audit Lambda fires every 15 minutes and inspects Kubernetes Pod/Node state directly (via the EKS API server). It checks for:
Pods in CrashLoopBackOff (default: flagged when restart count reaches five and the last crash is within 15 minutes)
NotReady nodes (default: flagged when a node has been NotReady for at least 15 minutes and at least 10% of nodes are affected)
Namespace-aware filtering controls which pods are checked:
Pods in kube-public and kube-node-lease are ignored entirely by default.
Pods in kube-system, aws-hyperpod, and amazon-cloudwatch are tagged as system-workload issues (distinct from user-workload issues in the verdict).
All thresholds and namespace lists are configurable via the CloudFormation stack parameters.
The Lambda POSTs a webhook event to DevOps Agent only when a real issue is found. On a healthy cluster, nothing is POSTed, so no investigation runs and no cost is incurred. A separate daily heartbeat schedule confirms the monitoring pipeline itself is alive. The heartbeat is visible in the DevOps Agent console but deliberately not emailed on healthy runs — so silence in your inbox means the cluster is healthy, not that the pipeline is broken.
Note: HyperPod infrastructure faults (node health, capacity errors, lifecycle-script failures) are handled event-driven by the webhook bridge. They come from the native HyperPod event stream in EventBridge. The periodic audit deliberately does not duplicate that path; it only covers Kubernetes workload state, which is not in the HyperPod event stream.
Closing the loop — the email notifier
An EventBridge rule on the aws.aidevops event stream captures investigation lifecycle events. The email-notifier Lambda processes these events through the following steps:
Event filtering:Only “Investigation Completed” events are processed (one email per investigation lifecycle). The event payload contains the agent_space_id, task_id, and execution_id.
Dedup: The Lambda checks an S3 marker at s3://<bucket>/emailed/<execution_id>. If present, this investigation has already been emailed and the event is dropped. This prevents duplicate emails when the same completion event is re-emitted.
Fetching the investigation context: The Lambda calls two DevOps Agent APIs:
get_backlog_task(agentSpaceId, taskId) — retrieves the task metadata (title, priority, timestamps).
list_journal_records(agentSpaceId, executionId) — retrieves the investigation’s findings, symptoms, and investigation gaps from the agent’s journal.
Suppress-verdict filtering: If the investigation produced a Suppress verdict or no findings at all, no email is sent.
Email composition: The Lambda composes a single HTML email from the journal records: a short headline followed by a one-paragraph summary covering what happened, the likely cause, and the recommended action.
Send via SES: The formatted email is sent to the configured recipients. After successful delivery, the S3 dedup marker is written.
The operator also has access to the full investigation in the DevOps Agent web console (see following “Viewing investigations” section).
Viewing investigations in the DevOps Agent console
For readers new to AWS DevOps Agent, here’s how to navigate to your investigations:
Select your Agent Space (named hyperpod-<cluster-name>-devops-agent by default).
From the Launch web app drop-down, choose an option to open the DevOps Agent web app.
Select Incidents from the left navigation pane to open the Incident Response Dashboard. It lists all investigations with their subject, status, and timestamp.
Select any investigation to see its full timeline, journal records, and the verdict report.
Asking the agent directly — the DevOps Agent Chat UI
Beyond the automated emails, you don’t have to wait for the next investigation to get answers about your cluster. You can open the DevOps Agent’s AI chat at any time and ask follow-up questions in plain English. The agent answers from the live cluster state, the investigation history, and the skills it has been taught.
For example:
“I got an email about a GPU failure in my cluster. Did it get resolved now with HyperPod’s resiliency?” — The agent checks the current cluster state, confirms whether the replacement succeeded, and provides a timeline of what happened (HMA detection → replacement initiated → node back in service), along with anything to watch for.
“Are there unhealthy Pods on my cluster?” — The agent inspects the Kubernetes state and reports any CrashLoopBackOff pods or NotReady nodes.
“I just triggered scaling up. Check if it is progressing well.” — The agent looks at the cluster’s current node counts vs. target counts and reports whether provisioning is on track.
AWS DevOps Agent chat interface showing a natural language query about cluster health
The chat conversations are stored per Agent Space, so you can revisit past interactions alongside the automated investigations. This makes the Agent Space a single pane of glass for both automated incident response and ad-hoc troubleshooting of your HyperPod cluster.
Extending the solution — detection vs. reasoning
The solution has two extension points, which serve different purposes:
Extending detection (what conditions are caught):
Event-driven path: The webhook bridge Lambda drops Info-level events and forwards all Warn and Error level HyperPod events to DevOps Agent. This typically does not need modification. It already catches all actionable events.
Polling-based path: The periodic-audit Lambda checks Kubernetes state. To detect additional conditions (for example, GPU allocation below a threshold or specific Pod labels stuck in error states), add that logic to the Lambda code.
Extending reasoning (how the agent investigates and classifies): edit the plain-English skill definitions. For example, you can teach the RCA skill new classification rules, add domain-specific context about your workload’s expected behavior, or adjust the recurrence thresholds.
Detection is code; reasoning is natural language. Both are in the repo and designed to be customized independently.
Investigation feedback
After each investigation completes, a Feedback button appears in the DevOps Agent console. Clicking it opens the Investigation feedback dialog, where you can:
Rate whether the root cause was correct
Indicate whether human steering was needed during the investigation
Provide written feedback explaining what could be improved
This structured feedback is stored per investigation. An auto-learning mechanism that uses this feedback to improve future investigations is actively being developed.
DevOps Agent APIs used by this solution
For readers interested in the programmatic integration, here are the key DevOps Agent APIs this solution calls:
Component
API
Purpose
Webhook provisioner (deployment)
register_service
Register the generic webhook service with DevOps Agent
Webhook provisioner (deployment)
associate_service
Associate the webhook with the Agent Space
Skill uploader (deployment)
list_assets
Check if a skill already exists
Skill uploader (deployment)
create_asset / update_asset
Upload or update the triage and RCA skill definitions
To remove all resources created by this solution, run:
make teardown-stack
This deletes the CloudFormation stack, removes the Agent Space, EKS access entries, secrets, and email configuration.
Additionally, if you no longer need the prerequisite resources, you can revert their setup, for example, deleting the verified Amazon SES email address identities you created for notifications.
Cost considerations
This solution is designed to be near-zero cost on a healthy cluster and scales proportionally with fault volume. Cost scales with fault volume, not node count directly. At large scale (100+ nodes), the triage skill becomes critical. A single hardware fault can generate 5-10 correlated EventBridge events, most of which are filtered by the webhook bridge Lambda before reaching the agent. Where triage adds value is linking and deduplicating across similar faults that affect multiple instances, or repeated faults on the same instance over time, consolidating them into a single investigation instead of many. As an example, a 500-node training cluster might see 20-50 investigations per month after filtering and deduplication.
Filtering and triage are your cost savers at scale. The webhook bridge filters correlated events from a single node failure (5-10 EventBridge events reduced to 1 forwarded event), eliminating redundant investigations at the source. Triage then links similar faults across multiple instances into a single investigation. For example, if 5 nodes hit the same GPU error in a window, triage consolidates them into 1 investigation instead of 5 (saving 4 × $4 = $16). The bigger the cluster, the more both layers save.
Investigation duration grows sub-linearly. A 1000-node cluster investigation doesn’t take 100x longer than a 10-node one. The agent queries describe-cluster and list-cluster-events once regardless of size. The data returned is bigger, but the API call count is similar.
CloudWatch Logs queries are the variable. On large clusters, the agent may query more HMA log streams, which takes longer agent-seconds AND incurs CloudWatch Logs Insights charges on your account (not part of DevOps Agent pricing).
DevOps Agent (the primary cost driver): Estimates based on 2 accelerator instances in a cluster
Component
Pricing
Your cluster estimate
Investigations
$0.0083/agent-second
~$4/investigation (at 8 min avg)
Chat (on-demand SRE tasks)
$0.0083/agent-second
~$0.25/chat query (at 30 sec avg)
Daily heartbeat
$0.0083/agent-second
~$1-2/day (short investigation confirming health)
On a healthy cluster with no faults, only the daily heartbeat fires, approximately $30-60/month in DevOps Agent time. On a cluster experiencing 5 real faults per week (typical for a large GPU fleet), expect ~20 investigations/month × $4 each = $80/month in investigation costs.
Free tier and credits:
New DevOps Agent customers receive a 2-month free trial (20 hours of investigations, 20 hours of chat per month). Enterprise Support customers receive monthly credits equal to 75% of their AWS Support charge toward DevOps Agent usage.
Supporting infrastructure (secondary costs):
Component
Monthly Cost Estimates
Lambda invocations
~96/day (15-min audit) + event-driven = well within free tier
S3 (skills + dedup markers)
< $0.01 (a few MB total)
Secrets Manager (1 secret)
$0.40
EventBridge rules
Negligible (per-event pricing)
SES emails
$0.10/1000 emails — at most 1 per investigation
CloudWatch Logs (Lambda)
< $1 (minimal log volume)
Total estimated monthly cost:
Scenario
DevOps Agent
Infrastructure
Total
Healthy cluster (no faults)
~$30-60 (heartbeat only)
< $2
~$32-62/month
Moderate faults (5/week)
~$80-120
< $2
~$82-122/month
Heavy faults (20/week)
~$320-400
< $5
~$325-405/month
How cluster size impacts cost
Factor
Small cluster (1-10 nodes)
Large cluster (100-1000 nodes)
Fault frequency
Rare (maybe 1-2/week)
Constant (NVIDIA reports ~1 fault/2-3 hours at 10K GPU scale)
Events per fault
Few (1 node replacement = 3-5 events)
More (cascading replacements, capacity queuing)
Investigation duration
Shorter (less state to read, fewer events in timeline)
Longer (more nodes to describe, more events to correlate, larger CloudWatch log groups to query)
Triage value
Low (few duplicates)
High (one fault generates many correlated events — triage links them into 1 investigation)
Periodic audit
Fast (few pods/nodes to check)
Slower (more K8s state to inspect)
Cluster Size
Faults/month
Investigations
Est. Agent Cost
1-10 nodes (your test)
2-5
2-5 + heartbeat
$8-20/mo + ~$30 heartbeat
10-50 nodes (typical prod)
5-20
5-15 (triage dedup)
$20-60/mo + ~$30 heartbeat
100-500 nodes (large training)
50-200
20-50 (heavy triage)
$80-200/mo + ~$45 heartbeat
1000+ nodes (frontier)
200-700
50-100 (massive dedup)
$200-500/mo + ~$60 heartbeat
Cost control levers:
Disable the periodic audit (EnablePeriodicAudit: false) to eliminate the heartbeat cost. Live event bridging still works.
Triage (LINK/SKIP decisions) runs at task creation time. No investigation cost is billed for deduplicated or skipped events.
Suppress verdicts filter email notifications but the investigation still runs. If you want to eliminate that cost, tune your EventBridge rule to drop more event types at the bridge level.
Comparison to manual monitoring:
Without automation, each fault requires an on-call engineer to manually correlate events across CloudWatch, EKS, and the SageMaker console, typically 30-45 minutes of triage before they even know whether HyperPod is self-healing or needs intervention. This solution delivers a root-caused verdict in minutes at ~$4 per investigation, while providing 24/7 coverage without human wake-ups. The cost savings compound with cluster scale: at 20 faults per month, that’s 10-15 hours of engineering triage replaced by automated verdicts.
Conclusion
In this post, we showed how to build an end-to-end agentic incident-response pipeline for SageMaker HyperPod using AWS DevOps Agent. The solution complements HyperPod’s built-in resiliency by watching for the operational conditions where a human still wants to be in the loop: configuration issues affecting provisioning, capacity-bound recoveries, recurring hardware fault patterns, and workload-level conditions. It delivers clear, root-caused verdicts to the operator’s inbox.
The broader takeaway is a reusable pattern: teaching an AI agent a domain’s operational model through plain-English skills, so it can distinguish “the system is recovering on its own” from “this needs a human decision.” This pattern applies beyond HyperPod to any event-driven AWS service where operational conditions benefit from automated correlation and triage.
Adjust the CloudFormation parameters: tune the periodic-audit schedule, CrashLoopBackOff thresholds, NotReady node percentages, namespace filtering, and email recipients. No code changes required.
Extend detection: modify the periodic-audit Lambda to check for additional Kubernetes conditions specific to your workloads (for example, GPU allocation below a threshold, specific Pod labels stuck in error states).
Extend reasoning: edit the triage or RCA skill definitions to adjust classification rules, add domain context about your expected cluster behavior, or tune the recurrence thresholds.
Add notification channels: connect Slack or PagerDuty via DevOps Agent’s built-in integrations or via a sibling EventBridge rule on the same aws.aidevops event stream.
The skills are plain English. Iterate on them the same way you’d iterate on a runbook.
This post is co-written with Govind Menon, Head of MCP Product at ServiceNow.
Introduction
Enterprise teams managing applications on AWS often rely on ServiceNow as their IT service management (ITSM) system for incident tracking, change management, and configuration management. When incidents occur, engineers must context-switch between AWS, third party observability tools and ServiceNow, manually correlating data across those sources before updating ServiceNow incident records. This fragmented workflow delays resolution, increases mean time to resolution (MTTR), and introduces the risk of missed signals.
AWS DevOps Agent is a frontier agent that resolves and proactively helps prevent incidents, continuously improving reliability and performance of applications in AWS, and hybrid environments. In this post, we demonstrate how to integrate AWS DevOps Agent with ServiceNow using the Model Context Protocol (MCP) and ServiceNow Action Fabric, enabling autonomous incident investigation and resolution workflows that are governed by ServiceNow and that execute and record authorized actions directly on the application.
By the end of this post, you will be able to:
Configure AWS DevOps Agent as an MCP client connecting to ServiceNow MCP Server created in the MCP Server Console
Authenticate securely via OAuth 2.0 between AWS DevOps Agent and ServiceNow
Enable dynamic discovery of ServiceNow tools exposed through Action Fabric and governed through the ServiceNow MCP Server Console
Automate root cause analysis directly within ServiceNow incidents
Integrating ServiceNow MCP Server with AWS DevOps Agent
The integration between ServiceNow MCP Server and AWS DevOps Agent connects ITSM workflows with automated incident response through the Model Context Protocol (MCP), an open standard for AI agent-to-tool communication.
ServiceNow MCP Server Console lets you create a ServiceNow MCP Server and configure the tools it exposes, capabilities such as incident management, CMDB queries, and change requests as discoverable tools. The console governs what the agent can see and do through tool-level scoping, access control lists, and role masking. It is the access channel for ServiceNow Action Fabric, the application’s governed action layer: ServiceNow does not merely store the agent’s output, it controls and executes the actions the agent is authorized to perform.
AWS DevOps Agent acts as an MCP client that dynamically discovers available ServiceNow tools at runtime. You can create tools based on existing capabilities, such as ServiceNow NowAssist Skills.
When a ServiceNow incident triggers AWS DevOps Agent, the following happens:
Correlates telemetry from Amazon CloudWatch, deployment data, and code changes
Discovers available ServiceNow tools through the ServiceNow MCP Server
Queries ServiceNow for related incidents, change records, and CMDB context
Identifies root cause by correlating AWS telemetry with ServiceNow operational data
Writes findings, root cause analysis, and mitigation plans directly into the ServiceNow incident
Executes governed actions on the application (for example, creating a change request) through the tools the ServiceNow MCP Server Console exposes, where authorized
Security is built into every interaction. Communication uses OAuth 2.0 authentication with scoped
Permissions. The ServiceNow MCP Server Console governs which tools the agent can access and what actions it can perform, with every invocation authenticated, authorized at the tool and skill level, and recorded in an auditable trail that ServiceNow AI Control Tower can observe.
Figure 1: Integration architecture showing AWS DevOps Agent connecting to ServiceNow via MCP Server
Prerequisites
Before you begin, make sure you have access to and understanding of the following:
An AWS account with permissions to create AWS Identity and Access Management (IAM) roles:
Created AWS DevOps Agent Space role and Web app role
Step 1: Configure the ServiceNow MCP Server and its Tools in the MCP Server Console
As first step, configure the ServiceNow instance to expose capabilities through the MCP Server:
Navigate to the MCP Server Console in the ServiceNow Instance
Create a new MCP Server (or select the MCP server provisioned).
Figure 2: MCP Server Console in ServiceNow Instance
Add Tools for the capabilities the agent needs (for example, incident read and update, CMDB query, change request creation), and scope each with ACLs and role masking so the agent can perform only authorized actions.
Figure 3: Tool selection in ServiceNow MCP Server
Configure inbound authentication for the MCP Server.
Figure 4: Create Inbound Integration – OAuth Client Credentials grant
Step 2: Create and configure a DevOps Agent Space
Create an AWS DevOps Agent Space in your AWS account to define the scope of resources the agent will monitor and investigate:
Access the AWS DevOps Agent console
Choose Create Agent Space and provide a name and description, and configure the required IAM roles (automated or manual setup)
Figure 5: Creating an Agent Space in the AWS DevOps Agent console
Figure 6: Agent Space Name and IAM role configuration
Confirm creation of AWS DevOps Agent Space.
Step 3: Register ServiceNow MCP Server in the AWS DevOps Agent console
Register your ServiceNow MCP Server connection to enable tool discovery in the AWS DevOps Agent console.
Navigate to Capability Providers in the AWS DevOps Agent console. Under MCP Server, select Add source, then Register New MCP Server.
Enter your ServiceNow MCP Server endpoint URL:https://<instance>.service-now.com/sncapps/mcp-server/mcp/<server_label>
Figure 7: Entering the ServiceNow MCP Server endpoint URL
Select OAuth Client Credentials as the authorization flow. Enter the Client ID, Client Secret, and Exchange URL (https://<instance>.service-now.com/oauth_token.do) from Step 1.
Figure 8: OAuth Client Credentials configuration for the ServiceNow MCP Server
Submit the registration. AWS DevOps Agent validates the connection and discovers available tools. Select the tools to add to your Agent Space.
Figure 9: Selecting ServiceNow MCP tools to add to the Agent Space
Confirm the MCP Server is associated and tools are connected.
Putting It All Together: End-to-End Test
Once the setup is complete, we need to make sure the connection is working.
Navigate to Operator Access in the AWS DevOps Agent Space.
Open a new chat window, and type “Can you show me all the incident in the past week from ServiceNow”
Make sure the Agent calls the ServiceNow tools and shows the right results.
Figure 10: Test the ServiceNow MCP connection from AWS DevOps Agent
You can also configure your environment so that the creation of an incident in ServiceNow automatically triggers the AWS DevOps Agent. To set up this integration, follow the AWS documentation to establish the connection between AWS DevOps Agent and your ServiceNow instance. Then, create a Business Rule in ServiceNow. This enables incident creation to seamlessly trigger the DevOps Agent without manual intervention.
Once this setup is complete, here’s how the workflow comes together: when an incident is created, the DevOps Agent automatically investigates and adds relevant context such as root cause analysis, related changes, and affected resources directly back into the incident record. This means that by the time your Operations or SRE team picks up the incident, they already have the context they need to begin resolution, significantly reducing triage time and accelerating mean time to recovery (MTTR).
Figure 11: AWS DevOps Agent initiating an automated investigation on the ServiceNow incident
Figure 12: AWS DevOps Agent mitigation plan posted to the ServiceNow incident
Clean up
To avoid incurring ongoing costs, clean up your resources when you are done using the integration. For details on pricing, visit the AWS DevOps Agent pricing page.
When you are done using the integration, clean up your resources:
Delete your Agent Space from the AWS DevOps Agent console
Remove the ServiceNow MCP Server connection from your settings
Delete the IAM roles created for the Agent Space
(Optional) Disable the MCP Server configuration in your ServiceNow instance
Conclusion
For organizations running workloads on AWS and managing operations through ServiceNow, incident response has long meant toggling between systems and racing to document findings before context fades. The integration between AWS DevOps Agent and ServiceNow through MCP and Action Fabric alleviates that gap. The agent investigates autonomously, correlates telemetry with operational context, and documents root cause and mitigation directly in the incident record, compressing resolution times from hours to minutes.
And because the connection is built on MCP, an open protocol for agent-to-tool communication, what you configure today continues to expand as your ServiceNow workflows evolve. New tools exposed through Action Fabric are discovered and available to the agent immediately. To get started, visit the AWS DevOps Agent product page and ServiceNow MCP Server Console page.
At GTC this year, Jensen Huang put a number on a problem that most enterprise AI teams already feel but struggle to articulate: about 90% of what gets generated every year is unstructured data. This includes PDFs, emails, video, contracts, support tickets, and voice recordings.
Until recently, that data was, in his words, almost entirely useless. You could store it or search it by keyword, but machines couldn’t read it, understand what it meant, or draw any connections between it and other content.
GenAI has changed that. RAG pipelines, vector databases, and embedding workflows give machines a way to process unstructured content, comprehend its meaning, and synthesize information across the entire enterprise.
The problem is that these tools put a completely different set of demands on storage than anything that came before them. And most enterprise storage wasn’t built for it.
The access pattern no one planned for
Traditional enterprise storage assumes that data gets written and then occasionally retrieved. The architecture for it was built with hierarchical file systems and tiered storage (hot archives for data that gets accessed regularly, cold archives for anything that hasn’t been touched in a while). It worked well for decades, until RAG pipelines broke it.
A RAG pipeline works by reading your documents and converting them into a format the AI can search. But that conversion process is not a one-time event. It has to be run repeatedly as you test, adjust, and update. Every adjustment means re-reading the same content, re-processing it, and re-writing the results back to storage.
For example, the pipeline breaks documents into chunks because the AI can only search effectively when content is divided into manageable pieces. The size of those chunks directly affects how well the AI answers questions. Too large, and the AI retrieves too much irrelevant content. Too small, and it loses context.
Whenever you have to update your underlying documents, the pipeline has to re-read and re-process everything affected by the change. The same is true when upgrading to a newer AI model, because the new model produces different representations of the same content and requires everything to be re-converted.
While the pipeline is reading, it’s also saving converted content, updated search indices, and checkpoints. And what it saves is tiny. Embeddings, vector chunks, and metadata objects are often just a few kilobytes each, but a production RAG pipeline generates millions of them. Legacy storage treats every save operation the same regardless of file size, so saving a million tiny files costs nearly as much as saving a million large ones.
Tiered storage exacerbates this even more. These systems judge which data is still needed and which can be moved to cheaper, slower storage based on how recently something was accessed. But a RAG pipeline might go quiet for weeks between runs and then suddenly need everything at once. Or it might re-index documents on a schedule that the storage system doesn’t recognize as regular access. Either way, the tiered system sees cold data and moves it to a slower tier. When the pipeline needs that data back, it waits and pays a retrieval fee before it can proceed. That cost and delay compounds across millions of objects and dozens of pipeline runs.
The governance problem hiding inside your index
When a RAG pipeline indexes documents into a vector database, it takes a snapshot of your data at that moment in time. The embeddings it generates reflect the content of those documents as they existed when the pipeline ran. When the original documents are updated or changed, the snapshot doesn’t change with them. The vector index keeps pointing to the old version, and the AI keeps retrieving it and presenting it as current fact.
To a user, that looks like hallucination. The model is confidently citing a document that no longer says what the model thinks it says. But the failure isn’t happening inside the model; it’s happening at the storage layer. Specifically, in the gap between when source documents change and when the index gets updated.
Most enterprises running RAG pipelines today have no systematic way to close that gap. Document management systems aren’t built to notify downstream AI pipelines when content changes. Vector databases aren’t built to automatically invalidate and re-index affected embeddings. The result is an AI system that’s architecturally incapable of knowing when its knowledge has gone stale, so it presents outdated information with the same confidence as current information.
What GenAI storage actually requires
Closing the gap between what RAG pipelines demand and what legacy storage delivers requires three things:
Sustained high throughput. RAG pipelines generate continuous, mixed traffic at every stage of the process—ingesting documents, processing them, writing the results to an index, and querying that index—often all running simultaneously. Storage must be able to move data in and out fast enough to match the speed at which the pipeline generates requests, and sustain that speed across the entire duration of a run, not just handle short bursts.
Always-hot architecture with no tiering. Every document needs to be immediately accessible regardless of when it was last touched. This is not just for pipeline performance, but also because slow re-indexing is what produces stale outputs. When source documents change, the pipeline needs to re-index immediately. Storage that puts documents behind retrieval delays or tiering penalties widens the window in which the AI is working from outdated information and presenting it as fact.
Free data movement. RAG workflows span multiple GPU providers, MLOps platforms, and inference environments across multiple regions. Storage that charges egress fees for every transfer turns architecture decisions into cost calculations and discourages the experimentation that gets AI systems from prototype to production.
The storage layer that doesn’t get in the way
Backblaze B2 Overdrive is built around exactly these requirements. It is always-hot object storage with no tiering, no retrieval delays, and no waiting for data to be promoted before a pipeline can run. Every document is always available, regardless of how recently it was written, which means when the pipeline needs to re-index, storage never slows it down.
At up to 1Tbps sustained throughput, it keeps high-volume RAG pipelines fed continuously through the constant mixed traffic of reads and writes they generate. Because egress is free, teams can move data between storage and compute across regions and providers without a cost penalty. And S3 compatibility lets B2 Overdrive drop into existing LangChain, LlamaIndex, and vector database pipelines without rewrites.
Ninety percent of enterprise data is sitting in formats that, until recently, machines couldn’t do anything useful with. The tools to unlock it now exist. How well they perform and what they cost to run depends largely on the storage underneath them.
Extensive news coverage and analyst reports on AI missing productivity and ROI targets mean that AI failure is something of a hot topic. There’s no arguing that some AI initiatives are misguided, including replacing entire specialist teams with AI. For others, the issue actually lies with data knowledge and readiness–Gartner predicts that through 2026, organizations will abandon 60% of AI projects unsupported by AI-ready data, and S&P Global recently highlighted the importance of ingesting previously overlooked or unknown data to discover interdependencies in risk management.
The pressure to move at the perceived speed of AI makes it easy to skip or rush important prep work. Now that major AI pilots have been up and running, supplementing or sometimes entirely replacing select business functions with mixed results, this exposes an already known problem among AI experts: implementing AI too quickly and ignoring the importance of keeping human experts in the loop increases your threshold for error. This is especially prevalent for both internal AI tools that are meant to augment key roles, and customer-facing AI applications that are supposed to increase accessibility to an outcome, such as generating a lifelike video based on natural language prompts.
What’s causing this? It’s not just the LLMs–it’s the data. Now that human experts are more aware of what AI can get wrong, we’re going back to basics to help you get it right. This starts at the very beginning: curating, ingesting, and storing data using infrastructure that’s actually designed for moving data quickly, and without financial penalty.
Data ingest is the process of any type of data being added to a designated collection destination, whether that’s a specific file folder, database, or object storage bucket. For a lot of applications, data ingest is frequent or nearly constant–busy e-commerce sites with a constant flow of customer transactions and feedback, live video feeds, and combining real-time data sources like pairing security footage with physical building security sensors. This is called streaming ingestion–and streaming ingestion being the foundation of data collection for various types of AI is one of the key reasons why storage is an AI infrastructure problem that often flies under the radar until there’s a serious problem.
Streaming ingestion requires constant low-latency access to the data storage repository to prevent data upload lags and errors.
Streaming ingestion for video and other large files requires high rate limits and high-throughput networking capabilities to optimize upload times, especially when an application requires a file to be ready for processing in seconds/minutes instead of hours/days.
Running out of storage capacity is not an option for model performance, and for compliance and auditing purposes–streaming ingestion requires constant access to storage that is as close to infinite as possible.
Automation from the start
In addition to the files themselves, setting up a highly effective AI data pipeline involves building automation from the very beginning to immediately allocate files to the right bucket using taxonomy and collect and store file metadata to begin data aggregation critical for future labeling and processing.
Why taxonomy is critical for AI
The file itself is the data source. Navigating your dataset starts with implementing a taxonomy that makes your dataset highly searchable as your data grows from a few thousand for your first round of training to millions for an AI application operating in production.
Taxonomy is essentially your file storage structure, or how files are automatically “nested” and relationships between files are built immediately upon ingest. When you’re just getting started, developing your taxonomy helps you stay organized and ready to go searching for a specific file when your coworker doesn’t believe what the data is saying. When you’re working in established teams, implementing a new taxonomy or showing that you understand the importance of following an established taxonomy builds a contract of understanding between you and your data engineering or ML teams. (AKA, changing taxonomy mid-project is a big undertaking with ripple effects, and should not be taken lightly.)
A simple example taxonomy for ingesting raw files can look like this:
/<source>/<modality>/<status>/<date>/filename
Taxonomy should also reflect what the data is actually doing or will do, not just the file type and data source. The goal is to make every object self-describing at write time, so downstream training pipelines can filter, version, and partition without touching the data itself.
Partition by date/time at the prefix level so you can use time-range queries and lifecycle rules without scanning everything
Include modality (video, audio, image, text) as a top-level segment so cross-modal datasets stay logically separated but co-located in the same bucket
Use a UUID or content hash as the filename — never rely on source filenames, which are inconsistent and collision-prone at scale
Use B2 bucket policies or object tagging rules to reject objects written to non-conforming prefixes
Maintain a human-readable taxonomy manifest (taxonomy.json at bucket root) that documents each top-level prefix and its schema
For video specifically, consider a separate prefix segment for resolution or codec: …/video/4k/h264/… — this pays off quickly when training jobs need to filter by input spec
Retain all the metadata
Write metadata as object tags and custom headers at ingest using per-object user-defined metadata at PUT, such as:
This way, the metadata travels with the object and is always returned on HEAD requests without a separate lookup.
But to build out a rich dataset, you will need even more metadata in the form of sidecar metadata files. Retain annotations, bounding boxes, ground-truth labels, licensing info, and consent flag metadata by creating a sidecar JSON with a .meta.json suffix. For the warehouse camera video example listed above, you would end up with two files that look like this:
Enable object versioning on training buckets. If a labeling pipeline updates an annotation, it should write a new version (or a new sidecar) rather than overwriting — training reproducibility depends on knowing which metadata was present at the time a dataset was compiled.
Expose metadata to training pipelines via a manifest
Rather than having training jobs scan bucket prefixes directly, generate a manifest file (JSONL or Parquet) at the end of each ingest batch that enumerates every object key + its full metadata. Tools like PyTorch’s WebDataset and HuggingFace datasets can load directly from these manifests, and it decouples the training job from needing object storage credentials for discovery.
Deciding on storage while evaluating data
To summarize, this is why choosing your storage destination based on your current (or, if you’re already undergoing a data management transformation, future-state) scenario is critical:
Ingest type: Does your storage provide enough network bandwidth to capture the correct type of data in real time (especially for video?)
Data type: Will large files potentially incur large upfront costs with upload fees?
Data processing workflow: Does your storage have capacity headroom for file multiplication during processing, and does the cost structure allow this to happen without potentially draining infrastructure budgets?
Even with Backblaze B2’s hot storage at cold storage pricing, it may be beneficial for you to tier your storage based on your ingestion type, and how frequently the data will be accessed for training.
Batch ingestion is better suited for mid to lower performance storage, as this is typically used for historical datasets or a set schedule of pre-determined data updates, such as jobs pulling from relational databases or CSV uploads once a day or once per week.
Streaming ingestion is well-suited for hot storage to support a continuous stream of real-time (or near-real-time) data processing, such as from social media feeds and high-volume e-commerce AI helper agents.
Hybrid ingestion uses a combination of batch and streaming ingestion to handle both historical and real-time data requirements for AI models.
Surprise retrieval penalties for model training can happen even while building out your MVP or proof of concept–so avoid a storage headache and start building your pipeline at data ingest with Backblaze B2 $6.95 per TB/month. Create an account to get started with 10GB for free, or contact our storage experts for assistance with migrations and more.
Looking for more info on data ingest? Watch the on-demand webinar that dives into more details about data ingest with Backblaze’s Director of Applied AI Jeronimo De Leon.
This post was co-authored by Ayelet Harcz (Product Manager), Hen Perez (CTO Architect), and Shani Gafni (Product Manager) at Wiz.
When an on-call engineer receives an alert at 2 AM, a CPU spike, a latency anomaly, or an unexpected API error, the first question is whether this is an operational issue or a security incident. A CPU spike could be a scaling problem or a cryptominer. A latency anomaly could be a bad deployment or data exfiltration. Without security context in the investigation loop, engineers lack the information to distinguish between the two, delaying resolution and increasing risk.
AWS DevOps Agent is a frontier agent that autonomously investigates incidents and identifies operational improvements across AWS, multicloud, and on-premises environments. It reduces mean time to resolution (MTTR) by performing the triage and investigation work that would otherwise take an on-call engineer hours of manual effort. With the Wiz integration, AWS DevOps Agent queries Wiz’s security graph during investigations through the Model Context Protocol (MCP), surfacing vulnerability data, security findings, and exposure analysis alongside operational telemetry so engineers can quickly determine whether an alert is a performance issue or a security incident.
In this post, we walk through how the integration works, demonstrate a real-world incident investigation where AWS DevOps Agent uses Wiz MCP to surface a critical vulnerability behind an API latency spike, and show how to configure the integration in your environment. If you already use Wiz to secure your AWS environment, this integration puts your existing security data to work during incident investigations.
AWS DevOps Agent
AWS DevOps Agent investigates incidents and identifies operational improvements as an experienced DevOps engineer would: by learning your resources and their relationships, working with your observability tools, runbooks, code repositories, and CI/CD pipelines, and correlating telemetry, code, and deployment data across all of them. For a deeper look at how it works, see How AWS DevOps Agent uses multi-agent reasoning to find root causes.
AWS DevOps Agent is extensible through MCP, which allows the agent to call external tools during its investigation without requiring custom development. This is the mechanism that makes the Wiz integration possible. When the agent identifies a resource under investigation, it queries Wiz MCP for security findings associated with that resource and incorporates the results into its analysis and recommendations.
Wiz MCP
Wiz is designed to secure cloud and AI applications through a unified, graph-powered platform. The Wiz Security Graph connects infrastructure, identities, data, AI components, and runtime activity into a single contextual view. This approach identifies toxic combinations across layers – where exposures, permissions, data access, AI vulnerabilities, and runtime behaviors intersect in ways attackers can realistically exploit.
The Wiz MCP Server acts as a standardized gateway that allows AWS DevOps Agent to query this security graph during investigations. Wiz knows whether your Amazon Elastic Compute Cloud (Amazon EC2) instance has an exploitable Common Vulnerabilities and Exposures (CVE), whether it is publicly exposed, and whether endpoint protection is in place. AWS DevOps Agent, looking at the same instance, knows that CPU spiked, and a deployment happened 20 minutes ago. Separately, each tool tells a partial story. Together, they give the engineer the complete picture needed to act.
Better together: how combined context changes triage
The value of this integration is easiest to understand through three scenarios. Each starts with the same operational signal: a CPU spike on an EC2 instance.
Figure 1 – AWS DevOps Agent sees operational telemetry, Wiz sees security posture. The combination changes the triage decision.
Scenario A: No security findings. A CPU spike fires on an instance. AWS DevOps Agent queries Wiz and confirms the instance is fully monitored, has no known vulnerabilities, and shows zero active threat detections. This is an operational issue. The engineer scales, investigates the deployment, tests, and moves on.
Scenario B: Security issue detected. The same CPU spike fires, the same Amazon CloudWatch alarm triggers, and the same engineer wakes up. But when AWS DevOps Agent queries Wiz, it finds a validated remote code execution vulnerability on that instance, confirmed exploitable, with the resource exposed to the internet. The operational symptoms are identical to Scenario A. The correct response is the opposite: isolate immediately, engage your security team, treat this as a potential compromise.
Scenario C: Wiz coverage gap. The resource isn’t in Wiz at all. AWS DevOps Agent includes this as a finding in the investigation report, noting that no security context was available for the resource. Your team can then address the coverage gap by onboarding the resource into Wiz.
Without the Wiz integration, all three scenarios look the same in your dashboard. With it, AWS DevOps Agent routes each to the correct response path before a human needs to context-switch between tools.
How the integration works: the MCP bridge
The integration uses MCP, the same protocol AWS DevOps Agent uses for many of its external tool connections. When the agent identifies affected resources during an investigation, it calls Wiz’s remote MCP server as part of its evidence collection – no separate step, no manual trigger. The security query happens alongside the operational investigation, not after it. During the MCP call, AWS DevOps Agent sends resource identifiers to Wiz’s MCP endpoint and receives security findings in response. No operational telemetry or broader investigation context is shared with Wiz.
Figure 2 – The investigation flow: operational alert triggers AWS DevOps Agent, which queries Wiz via MCP before reaching a triage decision.
During the MCP call, AWS DevOps Agent queries Wiz tools to build a complete risk picture of the affected resource, here are a few examples:
Wiz MCP Tool
What it tells the agent
list_cloud_resources
Whether Wiz monitors this resource at all (coverage check)
list_findings
All finding types in one call: vulnerabilities, misconfigurations, secrets, data, and host config
list_vulnerability_findings
Deep CVE detail – severity, fix version, and exploitability (CISA KEV / known exploit)
list_issues
Prioritized risk issues, including toxic combinations (internet-facing + no Endpoint Detection and Response (EDR) + exploitable CVE)
list_threats / list_malware_findings
Active threats and malware: cryptomining, data exfiltration, backdoors
list_detections
Recent threat detection signals and anomalous activity
get_green_agent_analysis
AI-generated remediation steps for the issues found
The agent runs these queries together through a single security-auditing skill that loads automatically when it connects to Wiz’s MCP server with the DevOps toolset, so the full security picture comes back in seconds. If the Wiz MCP server is unreachable, times out mid-query, or returns an authentication error, the agent continues its investigation with the operational data it has and flags the missing security context in the investigation findings (Scenario C). You can review exactly which MCP tools were called and what data was returned in the AWS DevOps Agent investigation log for full auditability.
Based on what comes back, the agent classifies the situation: no security findings (operational issue, proceed normally), compromised or at-risk (active threats, exploitable vulnerabilities, or toxic combinations – apply relevant security runbooks to isolate the resource or escalate to security, with Wiz Green Agent remediation steps attached), or unmonitored by Wiz (flag and close the coverage gap). The classification feeds directly into the investigation findings your team receives.
The following demonstration shows AWS DevOps Agent investigating a reported CPU spike. The agent queries Wiz MCP and identifies a critical, internet-exposed Remote Code Execution (RCE) under active exploitation – turning an ambiguous alert into a confirmed security incident.
Video 1 – AWS DevOps Agent investigates a CPU spike and uses Wiz MCP security context to identify a critical RCE exploited through a public endpoint
Getting started
Prerequisites
To use AWS DevOps Agent with Wiz MCP, you need:
An active AWS DevOps Agent configuration with at least one Agent Space
A Wiz tenant with a remote MCP server endpoint (Streamable HTTP transport)
Authentication credentials for the Wiz MCP server. AWS DevOps Agent supports multiple MCP auth methods; for Wiz, use a Wiz service account (Client ID and Secret) or OAuth. Choose the method that matches your Wiz MCP server configuration. For setup details, see Connect remote Wiz MCP server in the Wiz documentation (requires Wiz login)
Enabling the integration
Step 1: Register the Wiz MCP server at account level
Description: e.g., “Wiz security context for incident triage”
Choose Next.
Select the authentication method that matches your Wiz MCP server configuration.
Review your configuration and choose Submit. AWS DevOps Agent validates the connection to the Wiz MCP server. Upon successful validation, the server is registered at the account level.
Step 2: Allowlist Wiz tools in your Agent Space
In the AWS DevOps Agent console, select your Agent Space.
Go to the Capabilities tab.
In the MCP Servers section, choose Add.
Select the registered Wiz MCP server.
Select all the Wiz MCP tools.
Choose Add.
Step 3: Choose how the Wiz security audit runs
Pick one of three options:
Use the Wiz skill tool (recommended). With the Wiz MCP tools allowlisted, AWS DevOps Agent automatically runs the latest devops_resource_auditing_skill workflow from Wiz during investigations. You always get the most up-to-date version, maintained by Wiz.
Import the ready-made skill. Import the wiz-security-context skill from the AWS DevOps Agent skills repo directly into your Agent Space. It is a lightweight skill that calls the Wiz workflow for you, so you get a one-step setup that stays current with Wiz.
Create your own custom skill. Use AWS DevOps Agent’s Create skill with Chat to build a custom skill based on the devops_resource_auditing_skill workflow and tailor it to your environment. This lets you review and tailor the workflow to your environment.
The power of co-build: extending context through MCP
This integration started from a recurring customer question: how do I know if what I’m seeing is an operational problem or an active attack? We worked with Wiz to close this gap. AWS DevOps Agent provides operational investigation and reasoning; Wiz provides cloud security intelligence. MCP provided the integration path without either side needing to reimplement what the other already does well.
Because AWS DevOps Agent supports connecting remote MCP servers as a first-class extension mechanism, co-building new integrations with AWS Partners follows a repeatable pattern. Each integration adds a new dimension of context to the agent’s reasoning, and you benefit without writing custom code or middleware on your side. For example, connecting a change management MCP server would let the agent correlate deployment approvals with incident timing, adding change context alongside security context.
For you, this means the richer the toolset you run in your environment, the more context the agent brings to each investigation. Your existing investments get amplified rather than duplicated, and you benefit each time you connect a new partner MCP server to your Agent Space.
Conclusion
Operational incidents and security incidents often start with the same symptoms. The difference between the right response to each is context that lives in a different tool than the one that fired the alert. The AWS DevOps Agent and Wiz integration brings that context into the investigation loop automatically through MCP.
Automated incident remediation – turning investigation findings into deployed fixes without manual toil – is the next frontier for operations teams running distributed workloads on AWS. Today, when an incident fires at 2 AM, the on-call engineer must correlate telemetry across Amazon CloudWatch, deployment pipelines, and application logs, then manually write and deploy a fix – a process that routinely takes hours. AWS DevOps Agent addresses the first half by autonomously investigating incidents, identifying root causes, and generating mitigation plans in minutes. During preview, customers and partners reported up to 75% lower MTTR, 80% faster investigations, and 94% root cause accuracy.
But investigation and mitigation recommendations are only half the story. Someone still has to read the findings, write the fix, test it, and deploy it. What if that second half could be automated too?
In a previous post, Leverage Agentic AI for Autonomous Incident Response with AWS DevOps Agent, we demonstrated how to configure AWS DevOps Agent to monitor your applications, trigger autonomous investigations, and follow best practices for production deployments. We also published this code sample which demonstrates how investigations could be wired to be triggered automatically when a Amazon CloudWatch alarm is raised. These two articles now allow you to trigger AWS DevOps Agent investigation on a Amazon CloudWatch alarm and produce a mitigation plan.
In this post, we demonstrate how to integrate AWS DevOps Agent mitigation plan output with Kiro CLI – running in headless mode on AWS CodeBuild – to close the remediation loop end-to-end. When AWS DevOps Agent completes a mitigation analysis, an event-driven pipeline automatically routes the findings to Kiro CLI, which applies the fix to your codebase, creates a pull request for human review, and triggers deployment upon approval. The result: L1/L2 incidents go from detection to deployed fix with minimal manual intervention – the only human touchpoint is the pull request approval.
We walk through the complete solution using a sample CloudFormation application, including the infrastructure code, anomaly generation scripts, event routing, and the Kiro CLI steering configuration that makes it all work. All source code is available in the accompanying aws-samples repository.
Solution Overview
Consider a typical web application running on AWS — a frontend behind an Application Load Balancer, backend compute on Amazon EC2, and an Amazon RDS database, with source code and CloudFormation templates in AWS CodeCommit. When something goes wrong in this environment, the solution chains two AWS frontier agents —AWS DevOps Agent for autonomous investigation and mitigation, and Kiro CLI for automated code remediation — through a fully serverless event-driven bridge to take the application from incident to deployed fix.
Fig 1 – Solution architecture
How it works
An incident occurs – Your application experiences an issue – high CPU utilization, elevated error rates, slow response times. Amazon CloudWatch alarms fire.
DevOps Agent investigates – AWS DevOps Agent, which has your application onboarded into an Agent Space, autonomously correlates metrics, logs, and deployment history to identify root cause and generate a mitigation plan.
EventBridge routes the signal – An Amazon EventBridge rule captures Mitigation Completed events (source: aws.aidevops) and invokes a AWS Lambda function.
Lambda extracts and queues – The AWS Lambda function calls the AWS DevOps Agent API to retrieve the mitigation summary and execution plan, then publishes the payload to Amazon SQS queue.
CodeBuild runs Kiro CLI – When a message arrives in the Amazon SQS queue, a AWS Lambda function with an SQS event source mapping triggers a AWS CodeBuild execution, passing the message content as an environment variable. AWS CodeBuild runs Kiro CLI in headless mode (–no-interactive –trust-tools=read,write,grep,shell), using the mitigation payload as a remediation prompt.
Kiro CLI applies the fix – Guided by a steering file that describes the repository structure and remediation conventions, Kiro CLI modifies the CloudFormation template or application code, commits to a feature branch, and creates a pull request.
Human approves, pipeline deploys – A developer reviews the pull request. Upon approval and merge, the associated deployment pipeline gets triggered to execute the change.
The sample repository pushed to your account’s AWS CodeCommit repository
Once completed, follow along the Readme file to setup the components which allow you to implement and execute the above architecture. The sections below provide an explanation of the components that have been built to support the architecture.
Capturing mitigation events
AWS DevOps Agent publishes lifecycle events to the Amazon EventBridge default event bus whenever an investigation or mitigation changes state. Each event uses the source aws.aidevops and a detail-type that identifies the specific like Mitigation Completed, Investigation Completed, or Mitigation Failed. The post focuses on a single signal: the moment a mitigation finishes successfully.
EventBridge rule and Lambda extraction
An Amazon EventBridge rule matching the Mitigation Completed detail-type invokes a AWS Lambda function. The event payload contains metadata (agent_space_id, task_id, and execution_id) which allows the AWS Lambda function to call the AWS DevOps Agent and extracts two key objects: the mitigation summary (what action to take and why) and the execution plan (step-by-step instructions). It publishes this structured payload to an Amazon SQS queue for downstream processing.
Headless remediation with Kiro CLI
With mitigation payloads landing in the Amazon SQS queue, we need a compute environment that can check out the application and infrastructure repository, run Kiro CLI agent against the codebase, and push changes back. AWS CodeBuild is a natural fit — it provides on-demand compute, integrates natively with AWS CodeCommit and requires no persistent infrastructure.
Kiro CLI 2.0 introduced headless mode, which allows it to run programmatically in deployment pipelines without an interactive terminal. You authenticate with an API key (stored in AWS Secrets Manager), pass a prompt, and Kiro CLI executes end-to-end — same tools, same agents, same capabilities as the interactive experience.
How CodeBuild orchestrates the fix
When a message arrives in the Amazon SQS queue, a trigger AWS Lambda function starts a AWS CodeBuild execution, passing the Amazon SQS message body as an environment variable. The AWS CodeBuild buildspec follows a straightforward sequence:
Install : Installs Kiro CLI and configures the environment. The KIRO_API_KEY is pulled automatically from AWS Secrets Manager ,never hardcoded.
Generate prompt: A Python script converts the structured mitigation payload into a natural-language remediation prompt. It inspects the content to classify whether the change targets infrastructure (or application code, then generates a focused prompt with the action, reasoning, and specific instructions.
Create feature branch : Checks out a new branch named after the agent space and execution IDs for traceability.
Run Kiro CLI : Invokes Kiro CLI chat –no-interactive –trust-tools=read,write,grep,shell with the generated prompt. The –trust-tools flag auto-approves specific tool categories following least-privilege, since there is no human to confirm.
Validate and commit : Guardrails check the changes: file count limits, protected file detection, Python syntax validation (py_compile), and YAML linting. If all checks pass, the changes are committed and pushed.
Create pull request : Creates an AWS CodeCommit pull request with the mitigation action as the title and the AWS DevOps Agent reasoning in the description.
The steering file
What makes Kiro CLI effective at remediation – rather than just generating generic code – is the steering file. Steering gives Kiro persistent knowledge about your project: repository structure, coding conventions, and decision frameworks.
For this solution, the steering file serves as the guardrails for automated remediation. It defines:
Repository structure – Maps each directory to its purpose.
Decision framework – Rules for classifying changes as infrastructure vs. application.
Scope constraints – Maximum 3 files per remediation, no new files, no new dependencies, no deletions.
Protected files – The buildspec, infrastructure pipeline templates, bridge code, and steering files themselves are explicitly off-limits.
Fail-safe – If the prompt is ambiguous or Kiro cannot determine what to change, it makes no changes rather than guessing.
This steering file is committed to the repository, so every AWS CodeBuild execution picks it up automatically. It ensures Kiro CLI makes targeted, predictable changes rather than broad refactors.
From pull request to deployment
At this point, the automated pipeline has done its work – Kiro CLI has analyzed the mitigation plan, modified the appropriate files, and created a pull request on a feature branch. The pull request description includes what was changed, why (directly from the AWS DevOps Agent’s reasoning), and the agent space and execution IDs for full traceability back to the original incident.
This is where the human-in-the-loop gate comes in. A developer reviews the pull request -verifying that the change is correct, scoped appropriately, and safe to deploy. This approval step is deliberate: while we trust the agents to investigate, analyze, and propose fixes, a human makes the final deployment decision.
Once the pull request is approved and merged into the main branch, the deployment pipelines implement the approved changes in the target environment.
The entire cycle – from CloudWatch alarm to deployed fix – completes in minutes rather than hours, with the only manual step being the pull request review. For organizations handling high volumes of L1/L2 incidents, this translates directly into reduced operational toil and faster recovery.
Cleanup
To avoid ongoing charges, remove the resources created during this walkthrough. Refer to the Readme for the complete teardown sequence.
Conclusion
In this post, we demonstrated how to integrate AWS DevOps Agent mitigation outputs with [1] Kiro CLI to build a closed-loop incident remediation pipeline. By connecting these two frontiers agents’ operations teams can go from incident detection to deployed fix with a single human touchpoint: the pull request approval.
This approach delivers measurable impact for enterprise operations:
Reduced MTTR – L1/L2 incidents that previously required hours of manual investigation and remediation can now resolve in minutes.
Improved operator productivity – Engineers shift from reactive firefighting to reviewing and approving targeted, AI-generated fixes.
Consistent remediation – Steering files codify your team’s conventions and decision frameworks, ensuring every automated fix follows the same standards regardless of when or how often incidents occur.
Ready to get started? Clone the aws-samples repository for the complete implementation, visit the AWS DevOps Agent documentation to configure your first Agent Space, and explore the Kiro CLI documentation to learn more about steering-file-driven code generation. Have questions or want to share how you’ve adapted this pattern? Leave a comment below or open an issue in the repository
Give an agent better tools and it should do better work. That’s the instinct, anyway.
When you open a pull request, Copilot code review reads the diff and explores the surrounding code to find the problems that matter before they ship. To do that, it used its own code exploration tools. So when we swapped in the better-maintained, shared tools that power the Copilot CLI, grep, glob, and view, we expected a clean upgrade.
Instead, in our benchmarks, we found that the cost of reviews was higher and fewer issues were being caught.
But the tools weren’t the problem. The instructions were. Once we rewrote them for the way a reviewer actually reads a pull request, the regression flipped into a win: roughly 20% lower average review cost, while maintaining the same review quality.
This is the story of how adjusting the workflows around the tools led us to a fix.
Same tools, wrong instincts
If you’ve built on top of an agent framework, you’ve probably inherited its tools too. They work, so you keep them, until the day your use case drifts far enough from what they were designed for that they quietly start working against you. That’s the situation we were in. Before trying to use the shared CLI tools, Copilot code review used its own code exploration tools. That tool layer was inspired by earlier agentic systems, including ideas from SWE-agent-style repository navigation and GitHub Copilot Autofix: list directories, search files, search directories, and read code. Those tools worked, but they were specific to Copilot code review, and they were designed for how models behaved at the time. Earlier agentic coding models made fewer tool calls and were worse at automatically pulling in necessary context. This meant it was more important to include all relevant information in the few tool calls that the model made.
Meanwhile, the Copilot CLI harness has a shared set of Unix-inspired code exploration tools: grep, glob, and view. That harness is also used by a growing number of Copilot agent products, including GitHub Copilot cloud agent, so harness improvements can benefit more than one product. We wanted to clean up and share infrastructure where possible, so we experimented with using the tools from the Copilot CLI harness in Copilot code review. The goal was to reduce duplicated tool implementations, create one shared place to improve code exploration tools, and make it easier to carry those improvements across Copilot products.
On paper, the migration looked simple:
Old Copilot code review
GitHub Copilot CLI
Purpose
list_dir
glob
Discover candidate files and directories before opening code.
search_file and search_dir
grep
Search code for matching text, symbols, or call sites.
read_code
view
Read the relevant file contents once a path or range is known.
The existing review tools were not thin wrappers. When searching for a directory or reading a code range, they could return the matched or requested lines plus extra surrounding code context. That added token cost, but it also matched how earlier models often benefited from having nearby context included automatically.
Initially, we hoped this would be a simple migration: swap one set of tools for another. But when we tested the shared tools in offline benchmarks, the review agent became less efficient and less effective. Average cost increased, and the number of useful comments dropped.
The trace revealed a browsing loop
Our internal Copilot code review benchmarks were useful because they show more than a final score. They show the path the agent took, including which tools it called, how much output came back, where errors happened, and whether it was narrowing toward evidence or widening the search.
When we first tried the shared Copilot CLI tools in offline benchmarks, the agent often behaved as if it was browsing a repository instead of investigating a pull request. It would search broadly, guess likely paths, read broadly, find more things to search, and carry that extra context forward.
Figure 1: Before — a simplified illustration of the general-purpose behavior we observed: widening the search, guessing paths, and accumulating context.
That pattern is understandable. Broad exploration can be useful when the task is “understand this repo.” But it’s not how a reviewer would usually review a pull request.
When I review a pull request, I start from the diff and ask targeted questions:
Where is this function called?
Is this config key used anywhere else?
Is there a test or helper with the same pattern?
What is the smallest nearby code range that explains this behavior?
I do not want to open a large part of the repository before I know what I am looking for. I want the minimal context needed to answer the question, without overloading the review with unrelated code.
That matters because every tool result becomes part of the agent’s working context. Extra file contents can be carried forward into later reasoning, increasing cost and sometimes making the review less focused. A tool result is not a disposable printout; for an agent, it’s extra tokens that stay in the context window.
The traces made that difference visible. The shared tools were not the problem. The instructions were giving the agent the wrong instincts to do an efficient and effective review.
The tools themselves worked, but their instructions were tuned for their use within the Copilot CLI and implied the wrong workflow: the agent used grep, glob, and view like a broad coding assistant instead of a reviewer. A coding assistant may map a whole area before making a change to ensure it doesn’t break some other corner of the code. On the other hand, a reviewer usually starts from the diff, asks whether the change introduced a problem, and then looks for the narrowest nearby evidence required to confirm or dismiss it.
General coding-assistant tool instructions, like the ones used by Copilot CLI or Copilot cloud agent, make sense for an interactive assistant. A developer may ask it to understand a repository, plan a change, edit files, and continue over multiple turns.
Copilot code review has a narrower job: start from a pull request diff, gather enough surrounding evidence to decide whether a change introduces a real issue, and avoid loading context that is not needed for that review question.
It was therefore clear that we couldn’t simply replace the previous Copilot code review tools with the tools from the Copilot CLI without additional prompting work. The problem became: how do we design tool instructions that use these shared tools effectively in a code review setting?
Rewriting the tool instructions for a reviewer’s workflow
The next iterations made the guidance specific to code review. The workflow we wanted Copilot code review to follow was:
Start from the diff and form specific review questions.
Use glob when the path is uncertain and grep to find candidate files, symbols, and call sites.
Batch cheap discovery before reading files.
Use view only when the agent knows which file or line range it needs.
Batch focused reads instead of alternating between one search and one read.
In oversimplified form, this was the behavior we encoded:
Generic posture: Use the available tools to inspect repository context that may be relevant.
Review-shaped guidance: Start from the diff. Narrow first with grep and glob; read exact evidence with view. If grep fails to find relevant context, retry with a simpler escaped search. If a path is wrong, pivot to glob instead of guessing nearby paths.
For example, imagine the diff changes an authorization helper that decides whether an operation is allowed. A relevant review question is not “show me the full contents of every file that calls this helper.” It could instead be the narrower: “are any request-handling callers relying on the old behavior?”
The intended path is short:
start from the helper changed in the diff
grep for callers of that helper
glob for likely route, handler, or controller files
view the most relevant caller ranges
decide whether any caller changes the risk
The guidance also changed how the agent recovered from failed searches. If an input made grep fail, the better next step was one simpler, corrected search. If a path was wrong, the better next step was glob, not guessing neighboring paths and reading whatever happened to exist. That nudged the agent away from letting a small tool failure turn into a larger exploration loop.
Figure 2: After — a simplified illustration of the review-shaped behavior the prompt guided toward: stay anchored to the diff, narrow with grep and glob, then read focused ranges with view.
The change was small in wording and large in effect. It changed the rhythm of the agent from “browse, read, search again” to “ask, narrow, read, decide.”
Benchmarks let us debug behavior, not just scores
The shared harness gave us the tools. The internal Copilot code review benchmarks gave us the feedback loop.
We could run the same review examples, compare tool traces, update the instructions, and run again. That let us ask concrete questions:
Did the agent narrow first, or read broadly first?
Did it batch independent searches?
Did it call view only when it had a reason?
Did a tool-instruction change reduce tool errors, or just move them somewhere else?
Did the trace stay focused on evidence from the diff?
Did the review still preserve the quality metrics we cared about?
The most useful signal was not “the instructions are better.” It was more concrete. The agent was making a similar number of tool calls, but spending more of them on relevant evidence instead of repeatedly expanding the search.
That connected product-level outcomes to understandable engineering behavior. Instead of guessing why a score moved, we could inspect the workflow that produced it.
The result: roughly 20% lower average review cost
In production, the tuned behavior showed roughly 20% lower average review cost compared with the control. Importantly, it did not show a quality signal that could block shipping.
The reduction did not come from the tools by themselves, it came from the workflow around them. Shared code exploration tools, Copilot code review custom tool instructions, and internal benchmarks made the agent’s behavior visible enough to tune.
That framing matters when building with agents. It can be tempting to treat tools as implementation details by swapping one tool for another, then comparing the final answer. But for an agent, the tool surface is part of the product experience. It changes what the agent notices, how it searches, how much context it carries forward, and when it decides it has enough evidence.
Tool descriptions and system instructions are closer to API documentation. Unclear API docs can leave a developer confused and lead to inefficient or wrong decisions. Unclear tool prompting can do the same for an LLM; a small wording change can affect cost, quality, and the shape of the investigation because it changes how the agent spends its attention.
Same tools, different job
We also tried to apply the same kind of focused tool instructions in the CLI, where it did not produce the same kind of win. That is a useful counterexample, and an important guardrail for the lesson.
Copilot code review is anchored to a diff and a review question. Copilot CLI handles broader, interactive coding tasks where exploration can be part of the job. There may be no single diff anchor, the user may change direction over multiple turns, and the right context may not be obvious at the start. The same grep, glob, and view tools can support both products, but the workflow around those tools has to match the product.
The takeaway is that shared tools scale when the instructions and benchmarks match the job.
“Where are the docs?” It’s a question nobody on a product team enjoys answering. The honest reply is usually some variant of “behind.” A writer is staring at a closed pull request, trying to reverse-engineer what changed. The pull request’s author has already moved on. By the time the doc actually publishes, the feature has shipped, sometimes more than once.
That used to be us on the Aspire team (we’re a small team of 10 building dev tools for distributed apps). A few months back, we were trying to figure out how to safely bring AI into automations we already trusted. That’s when we discovered GitHub Agentic Workflows. I started bolting prototypes into microsoft/aspire.
Here’s what that bought us, in numbers pulled straight out of GitHub: for Aspire 13.3 and 13.4, 82 feature-docs pull requests merged at a median of 44.8 hours after the product pull request, every one of them reviewed by the engineer who shipped the feature. No new headcount. No process retraining. Just a different way of asking “who writes this?”
🔒 The constraint: cross-repo automation is the hard part
Our product lives in microsoft/aspire and our docs site lives in microsoft/aspire.dev—different repo, deploy target, and review chain. Most teams figure out same-repo automation pretty quickly; cross-repo automation is where things get sharp. Broad repo-scoped tokens belong in a museum, and any responsible security posture (ours included) restricts them accordingly. That’s a good thing. It’s also a real bottleneck if the place where you write the docs isn’t the place where you write the code.
The default workflow for years was:
Engineer ships a feature in microsoft/aspire.
Docs writer notices weeks later.
Docs writer opens the pull request, reads the diff, and pings the engineer to clarify what changed.
Engineer is on the next feature, vaguely remembers, replies with half the picture.
Docs draft ships, sometimes against a release that’s already out.
This is the reverse-engineering tax. We needed automation that crossed repos without handing an agent a write-everywhere token. GitHub Agentic Workflows turned out to be the answer.
🤖 Why GitHub Agentic Workflows
GitHub Agentic Workflows is a project from the GitHub Next team that I keep describing to people as “GitHub Actions, but with a model as the work-item processor and guard rails that satisfy security review.” That’s reductive, but it’s close.
The shape of it:
You author a workflow as a single markdown file (.github/workflows/my-thing.md). YAML-style frontmatter on top, an English-language prompt underneath.
You run GitHub Agentic Workflows compile, and it generates a sibling .lock.yml (a normal GitHub Actions workflow) that you commit alongside.
At runtime, the workflow runs an agent against your prompt with a constrained toolset.
Critically, the agent doesn’t write to GitHub directly. It emits intent (a JSON blob describing the pull requests, issues, and comments it wants to create), and a separate, narrowly scoped job (the safe-outputs handler) materializes that intent against a per-workflow GitHub app.
That last bullet is the unlock. The agent gets read access and a prompt. Writes go through a tiny verifiable pipeline with explicit allow-lists. Security review nods. We ship.
💚 A small aside: kindred stacks
I love when the tools you’re using to build are built with the same tools you’re using to build with. The GitHub Agentic Workflows docs are built with Astro and Starlight. So is aspire.dev—Astro with Starlight, dressed up with the wider Starlight plugin ecosystem (astro-mermaid, starlight-llms-txt, starlight-sidebar-topics, starlight-image-zoom, the gorgeous @catppuccin/starlight theme, and more. Shout-out to Chris Swithinbank and the Starlight maintainers, the entire ecosystem feels designed by people who genuinely care).
There’s a real kinship there. The tool we use to automate docs and the docs site we automate into share the same foundation. Convenient, because the Mermaid sequence diagram in the next section renders the exact same way in both worlds.
The end-to-end pipeline
Here’s the flow we landed on. The protagonist is a workflow called pr-docs-check.md living in microsoft/aspire.
A run starts on pull_request: closed against main or release/*, gated by merged == true. From there, the workflow first runs a deterministic target branch resolver in plain bash before the agent ever wakes up:
Pull request milestone title (e.g. 13.4 → release/13.4 on aspire.dev).
Linked-issue milestone title (parse Fixes/Closes/Resolves #N from the body, fetch each issue, take the first non-empty milestone).
Pull request base ref, if it matches release/X.Y[.Z].
Fall back to main.
This is the linchpin. Milestones in the product repo map cleanly to release branches in the docs repo. When the agent finally runs, it knows exactly where the docs should land without any creative writing about target branches or guessing.
The agent reads the diff, scans linked issues, and decides: does this need docs? If yes, it drafts the actual content in a checked-out microsoft/aspire.dev workspace, following our existing doc-writer skill (voice, MDX conventions, Starlight components). It then emits a create_pull_request safe-output and hands off.
The safe-outputs handler takes over:
Title prefix: [docs]
Label: docs-from-code
draft: true (we never auto-merge)
Base branch: agent-supplied, restricted to main or release/*
Target repo: microsoft/aspire.dev
Reviewer: the SME identified from the source pull request’s reviews—i.e., whoever the product team trusted to approve the feature, now gets asked to approve the doc for that feature.
A companion job posts a marker comment back on the source pull request with the docs pull request link and minimizes any older pr-docs-check comments on re-run. The engineer who just hit Merge gets a notification within a few minutes: “Here’s the docs draft. Look it over?”
🔐 The safe-outputs contract
The whole security story comes down to a small, boring stretch of frontmatter:
That’s the deal in plain text. The agent gets a GitHub App token whose installation is scoped to exactly two repositories—the product repo and the docs repo—and nothing else in the org is reachable. It can only land pull requests against main or release/*. AGENTS.md and dependency manifests are off-limits by policy. If the pull request creation fails (network blip, conflict, anything), the framework falls back to filing an issue, so nothing is silently dropped.
This is the part security review actually liked. The agent’s reasoning is fuzzy. The action surface is not.
📊 By the numbers
Here are the stats from a rolling 30-day window (May 3 – June 2, 2026) spanning the back end of the Aspire 13.3 release and the run-up to 13.4:
Metric
Value
Product pull requests merged in microsoft/aspire
396 (338 main / 50 release/13.3 / 8 release/13.2)
pr-docs-check workflow runs
396
Draft docs pull requests created on microsoft/aspire.dev
82
– Merged
82 (100%)
– Closed without merge
0
– Still open
0
Docs pull requests target branches
52 → release/13.3, 27 → release/13.4, 3 → main
Median time-to-merge (docs)
44.8 hours
Merged within 24 h / 7 days
38% / 96%
Note: Numbers captured at the time of writing; the workflows keep running, so the totals only go up.
A few of those numbers deserve a second look:
396 runs → 82 pull requests is not a defect. The workflow runs on every merged pull request; most of them are internal refactors, test fixes, or dependency bumps with no user-facing surface. The agent saying “no docs needed” 300+ times is a feature.
100% merge rate says the agent’s docs picks are right. The tighter prompt we shipped after the v1 false-positive phase is paying off.
✅ What worked, ❌ what didn’t
What worked
✅ Milestone → release-branch mapping. This was the single highest-leverage choice we made. Engineers already set milestones on pull requests and issues; we got accurate target-branch routing for free.
✅ Draft-only, SME-as-reviewer. The agent never merges. The engineer who shipped the feature is the one who confirms the docs are right. We’ve stopped reverse-engineering features at the doc layer. The engineer just tells the docs draft what to say, in the place where they already are.
✅ Scoped GitHub app per workflow. Each workflow gets its own app token with explicit repo and permission scopes. Security review approved. We approved too; the first time we needed to rotate keys.
✅ protected-files: blocked. The agent cannot touch AGENTS.md, package manifests, or repo security config. Period.
What didn’t (at first)
❌ The agent’s “is this docs-worthy?” gate was too generous in the first version. It drafted pull requests for changes that were genuinely internal, such as a CI tweak or a logging refactor. The result: 9 closures of 69 pull requests (≈13%), so we tightened the prompt’s user-facing-change definition and added explicit negative examples (CI, internal helpers, tests-only). Now, the rate is trending down.
❌ Cross-repo pull request creation needed a mirrored checkout pattern that wasn’t obvious from the docs. The agent works in one repo; safe-outputs needs to find the target repo to push a branch. We solved it by checking out microsoft/aspire.dev twice—once as the current workspace, once under _repos/aspire.dev—so the safe-outputs handler can rediscover it deterministically.
❌ Big diffs blow prompt budgets. We pre-extract pull request metadata (linked issues, milestone, base ref) in pre-agent-steps bash, so the agent gets a small, structured summary instead of a giant payload. This is GitHub Agentic Workflow’s designed-in pattern, and it works.
Wrapping up
The changes we made shifted our thinking. A feature wasn’t considered done until the docs were. Docs no longer trail along behind it like a tin can on a string. The engineer’s review is the gate; the bot does the typing.
Critically, this doesn’t replace docs writers; it un-burdens them. Our writers used to spend most of their time reverse-engineering features. Now they spend their time on the things only a human can do well: narrative pages, sample programs, conceptual walkthroughs, the parts of the docs that don’t fall out of a diff. The bot handles the mechanical “this new option was added; here’s the reference page update” work that was never enjoyable for anyone.
Huge thanks to the GitHub Next team for GitHub Agentic Workflows (and for making the safe-outputs primitive a first-class part of the design), and to Chris Swithinbank and the Starlight maintainers for the docs platform we automate into. A genuine thank-you, too, to the security folks whose guardrails forced us to design this the right way the first time. The boring secret of good automation is that strong security constraints make the system more trustworthy and more correct.
If you build a product in one repo and ship docs in another—and especially if you have to do it inside any nontrivial security boundary—GitHub Agentic Workflows is worth a serious look. Start with one workflow, such as pr-docs-check, and watch what happens to your median time-to-docs.
🔗 The other workflows
pr-docs-check is the one I wrote this post about, but it’s not running alone. If you’re curious about the rest, the source is public:
milestone-changelog.md: runs every two hours, picks up newly merged pull requests in the active milestone, and maintains a 13.x-Change-log wiki page (new features, improvements, notable bug fixes) with a companion editorial-feedback issue. 346 runs.
release-update-support-mdx.md: on a stable Aspire release, drafts a [support] pull request on aspire.dev that updates the support policy page (promotes the new version, demotes the previous one, refreshes the “Last updated” badge).
update-integration-data.md: lives in the docs repo; runs pnpm update:all daily, refreshes NuGet metadata + GitHub stats + sample data, and opens a chore: Update integration data PR with supersede-and-close logic for stale runs. 27 runs, eight merged pull requests.
repo-pulse.md: a rolling three-day repo dashboard pinned to a single issue and updated in place: recent merges, pull requests awaiting review, new issues, discussion activity. One issue, always fresh.
Backblaze, Inc. (Nasdaq: BLZE), the cloud storage platform for the AI era, today announced an agreement with CoreWeave, Inc. (Nasdaq: CRWV), The Essential Cloud for AI.
Under the multi-exabyte, $335 million agreement, Backblaze will provide cost-efficient storage capacity that supports portions of CoreWeave’s managed storage infrastructure, helping optimize placement of data across performance tiers while preserving high-performance storage resources for the demands of AI workloads. The Backblaze technology supports HDD-based storage tiers in CoreWeave AI Object Storage. Customers already utilizing CoreWeave AI Object Storage with its patented LOTA distributed cache will immediately have access to new service tiers without any code modifications.
Every stage of the AI lifecycle depends on the ability to store and move massive volumes of data efficiently. Training, inference, checkpointing, data preparation, model outputs, and retrieval-augmented generation (RAG) all require storage that performs at the speed and scale modern AI demands.
“Storage is the foundation every AI workflow is built on — without it, even the world’s most powerful compute sits idle,” said Gleb Budman, co-founder and CEO, Backblaze. “We’re pleased to work with CoreWeave on elements of their storage environment. This collaboration demonstrates how our platform can help organizations meet growing infrastructure demands.”
Backblaze serves more than 100,000 customers worldwide and has extensive experience operating large-scale storage infrastructure. Its cloud platform is designed to deliver reliable, cost-efficient storage services across a range of enterprise and data-intensive use cases.
“Backblaze has built a reputation for making complex, HDD-based storage infrastructure reliable and easy-to-consume at scale. We’re pleased to work with them as we continue expanding our platform and managed service offerings to support AI workloads at scale,” said Nick Hoover, Vice President at CoreWeave.
CoreWeave’s AI cloud platform spans infrastructure, technology, tools, and services. The company serves leading AI model developers, enterprises, and research organizations, including 9 of the top 10 AI model providers.
The generative AI wave is moving from text into media. ChatGPT taught a generation of developers how to wire up an LLM. The next chapter is harder and more interesting: video, image, audio, and multimodal workflows that combine them. New models for each of these are landing every few weeks, from established labs and from teams nobody had heard of a quarter ago. The quality keeps climbing, and the catalog keeps expanding.
That pace is good news, but it asks more of the apps that depend on it. A pipeline that hard-codes today’s best video model is going to feel dated in a month. The apps that come out ahead will be the ones built on reactive architectures: pipelines that stream progress as events, fan out concurrent work, fall back when a provider stalls, and let you swap in a new model with a single line of code.
That’s where the moat is now. If you’re building an AI media product, the differentiation is in the pipeline: which models you call, in what order, how you fall back when one is slow, how you keep latency tolerable, where the assets land, and how you prove what was generated. The teams winning this space treat the orchestration layer as their core IP. The frontend on top is the easy part.
We’re looking for builds that solve real-world use cases. Show us what becomes possible when the pipeline stops being a bottleneck.
What we’re running
The Backblaze Generative Media Hackathon is an online competition for developers building generative media apps. $10,000 in cash prizes, 10 GB of free Backblaze B2 storage to start with, and GMI Cloud credits for the first 270 eligible participants.
Grand Prize: $7,000
Second Place: $2,000
Third Place: $1,000
Registration and submissions run June 22 through August 3, 2026 (5 pm ET). Winners are announced August 12.
The stack
Backblaze B2, Genblaze, and GMI Cloud are the three pieces of a media pipeline that’s both easy to vibe code and serious enough to take to production.
Backblaze B2 is S3-compatible object storage for the generated assets, the metadata, the provenance manifests, the thumbnails, and the logs. Durable URLs that never expire. Event Notifications fire downstream work without polling. Object Lock makes your provenance records tamper-evident. Lifecycle Rules handle cleanup so intermediate artifacts don’t pile up.
Genblaze is our open-source Python SDK for orchestrating generative media workflows. One Pipeline API spans OpenAI, Google, Runway, Luma, Decart, ElevenLabs, Stability Audio, NVIDIA NIM, GMI Cloud, and others. Every run produces a SHA-256-verified provenance manifest. Swap providers with a one-line change. New models drop every couple of months, and your app doesn’t need a rewrite each time.
GMI Cloud is a unified inference platform for open source AI. Image, video, audio, chat, reasoning, and multimodal models behind a single API key. If you want to try five video models in a weekend, this is the easiest way.
What to build
Anything that turns a generative AI capability into something a real person would actually use. Some directions:
AI video generation or editing apps
Image generation, remixing, or transformation tools
Audio, music, or voice generation workflows
Multimodal apps that combine text, image, video, and audio
AI media libraries for storing, organizing, and searching generated assets
Provenance-aware workflows that track how each piece of media was generated
Agentic media pipelines that generate, evaluate, retry, and store outputs
Tools for creators, marketers, educators, entertainers, or developers
Judges will weigh real-world utility, production readiness, and how meaningfully your app uses B2 and Genblaze. We’re looking for projects where the pipeline is doing real work. Apps that handle multiple providers, recover from errors, track provenance, and store assets reliably.
How to enter
Visit the hackathon page on Devpost for registration details, eligibility requirements, prizes, submission guidelines, and important dates:
Build your generative AI media application using Backblaze B2 and Genblaze, then submit your project before the deadline.
If you want a head start on what a Genblaze + B2 app looks like in code, two reference repos already exist. genblaze-gen-media-multi-provider-sample chains five providers into one prompt-to-MP4 pipeline. genblaze-gmicloud-pipeline is a deep multi-model composition inside one provider.
When an alarm fires at 2 AM, the first thing most engineers do is grep logs, check recent deployments, and trace code paths. However, the context they need — metrics, traces, topology, configurations — lives in a separate browser tabs and applications. What if your IDE could bring that cloud intelligence directly to your code, understand the full picture, and help you fix the issue end-to-end? Introducing, The Kiro power for AWS DevOps Agent removes that context switching by connecting your IDE directly to the AWS DevOps Agent, so you can investigate incidents, identify root causes, and generate fixes, all from the same place you write code.
This post is for developers and operators who develop applications using Kiro and want to troubleshoot production issues faster without leaving their editor. We’ll walk through how the power works, what it can do, and a step-by-step example of resolving a real incident.
The Kiro power for AWS DevOps Agent connects Kiro, the AI-powered IDE from Amazon, to the AWS DevOps Agent. It brings the production intelligence and release management in AWS DevOps Agent directly into your development environment — where you already plan, architect, debug, and ship code.
With this power installed, you can review your changes for production risks, investigate production incidents, optimize costs, review architecture, map service topology, and generate remediation code — all through natural language conversation, enhanced with the local context of your workspace.
Challenges in cloud operations today
Operating modern cloud applications means navigating a maze of interconnected services. A single user-facing error might require tracing through Amazon Elastic Container Service (Amazon ECS) tasks, Application Load Balancers, AWS Lambda functions, Amazon DynamoDB tables, and dozens of Amazon CloudWatch metric dimensions. Operators face persistent challenges:
Context switching — Investigating an incident requires jumping between the IDE, the AWS Management Console, log viewers, trace explorers, and documentation. Each switch costs time and breaks concentration during high-pressure incidents.
Siloed knowledge — Understanding which metrics matter, which services depend on each other, and what “normal” looks like for a given application often lives in runbooks that are outdated or in the heads of senior engineers. New team members face a steep learning curve.
Remediation gap — Even after identifying a root cause, translating findings into a working fix — an AWS CloudFormation parameter change, a scaling policy update, or an AWS Identity and Access Management (IAM) policy correction — requires switching contexts again and manually applying changes. These challenges compound when teams operate across multiple AWS accounts and environments. Kiro powers address these challenges by bringing operational intelligence directly into the IDE where developers already work.
Challenges in modern software delivery
AI coding agents have changed how fast code gets written, but the code review, testing, and pipeline processes that move code to production were designed for human pace and haven’t kept up. Teams face two persistent challenges:
Review capacity — AI-assisted development produces changes faster than human reviewers can evaluate them. Changes that don’t adhere to internal standards, dependency breaks, and access-control gaps that would have been caught by human reviews can slip through at machine pace.
Invisible dependencies — Applications span multiple repositories, shared infrastructure, and cross-team API contracts. A parameter rename in one repository silently breaks downstream consumers, and no single reviewer holds the full dependency graph in their head.
Faster code generation without corresponding delivery automation simply moves the bottleneck downstream. The Kiro power for AWS DevOps Agent addresses this by bringing release management intelligence into the IDE so you can review changes for production risks and run exploratory release testing of your web and API applications. Any issues can be immediately mitigated before you even push your code changes.
What are Kiro powers?
A Kiro power is a curated package that gives Kiro specialized capabilities in a specific domain, in this case, AWS operations. When installed, the power provides Kiro with tool connections to your AWS environment, domain-specific knowledge (best practices, error recovery patterns), and instructions for routing your requests to the right workflow. Critically, the power combines your local workspace context (code, git history, configuration files) with cloud-side intelligence (metrics, topology, deployment history) — so Kiro understands both what your code does and how your infrastructure behaves. For a deeper look at the powers framework, see Getting started with Kiro powers
Each power typically includes:
MCP server configuration — Connects Kiro to external tools and data through the Model Context Protocol, providing read and write access to cloud resources
Steering files — Domain-specific instructions that teach Kiro how to route intents, choose the right workflow, and handle edge cases
Contextual knowledge — Domain-specific guidance captured in markdown spec files and lifecycle hooks that encode best practices, common patterns, and error recovery strategies (as described in the blog, Introducing powers).
The Kiro power for AWS DevOps Agent
The Kiro power for AWS DevOps Agent packages the full capabilities of AWS DevOps Agent into a single install for Kiro. Once enabled, Kiro gains the ability to converse with a specialized AI agent that has deep knowledge of your AWS infrastructure, your operational history, and AWS best practices.
You can do the following with this power:
Investigate incidents — Describe the symptoms in natural language (“ECS tasks are failing with OOM errors on my-service”) and Kiro orchestrates a deep investigation across CloudWatch metrics, AWS X-Ray traces, Amazon ECS task events, and recent deployments to identify the root cause.
Optimize costs — Ask “What cost savings are available for my ECS services?” and receive specific, data-backed recommendations with estimated monthly savings based on actual utilization metrics from your account.
Review architecture — Request a topology map or security audit of your services. The agent queries your infrastructure and returns findings with actionable improvement suggestions.
Chat across agent spaces — Operate across multiple AWS DevOps Agent agent spaces from a single Kiro session using AWS SigV4. Each agent space can represent a different team, application, or AWS account — and you can switch between them naturally.
Generate remediation code — After identifying a root cause, Kiro can generate the fix directly in your workspace. Because it has access to both the investigation findings and your local code, the remediation is specific to your application, not generic boilerplate.
Run a release readiness review — After finishing a batch of code changes, have the DevOps Agent review the changes for dependency risks, deviations from your standards and best practices, and expansion of access controls in CloudFormation that go beyond best practices. It also builds and runs your code in an AWS-managed sandbox to better assess any production risks.
Perform exploratory release testing for deployed applications — If you deploy your web or API application to a production-like environment, Kiro can have the DevOps Agent run an exploratory tests on it. Any bugs or regressions found can be fixed without leaving the IDE.
How it works
The power provides two complementary workflows that Kiro selects automatically based on your request:
Chat (updates in seconds) — For instant answers about cost, architecture, topology, and knowledge discovery. Kiro creates a conversation with the DevOps Agent and streams responses in real time. Follow-up questions retain full context within the same session.
Investigation (completes in minutes) — For complex incidents requiring deep analysis. The DevOps Agent examines CloudWatch metrics, X-Ray traces, deployment history, and service topology, then delivers a root cause analysis with prioritized recommendations.
The following diagram shows how Kiro combines local workspace context with the DevOps Agent’s cloud intelligence:
Figure 1: Kiro combines local workspace context with the DevOps Agent’s cloud intelligence through the AWS DevOps Agent MCP Server.
Prerequisites
Before using the power, ensure you have:
AWS credentials configured (AWS IAM Identity Center recommended) if using AWS SigV4.
Kiro installed and a workspace set up
An AWS DevOps Agent agent space configured with data sources (CloudWatch, X-Ray, or other integrations)
Create an access token or have AWS SigV4 configured. The access tokens feature must be enabled on your Agent Space for access tokens to work.
For access tokens, you must have IAM permissions to manage access tokens (aidevops:CreateAccessToken, aidevops:RevokeAccessToken, aidevops:RotateAccessToken).
Sign in to the AWS Management Console and open the AWS DevOps Agent console.
Choose your Agent Space.
Choose the Configuration tab.
In the Access tokens section, choose Enable.
Confirm the action.
Create a token
Open the DevOps Agent web app for your Agent Space, then from the navigation menu, choose Settings, then choose Access Tokens.
Choose Create access token.
Enter a name for the token.
Choose a scope:
read – View investigations, recommendations, chats, and Agent Space resources.
operate – Full access. Includes everything in read, plus send messages, create chats, and manage backlog tasks and recommendations.
Set an expiration (1 to 60 days).
Copy the token value and store it in a safe, secure location. You cannot retrieve it again.
After creating a token, the web app displays a configuration example that you can copy directly into your client.
The power works with any agent space that has active data sources. The more data sources connected, the richer the investigations and recommendations.
Getting started with the Kiro power for AWS DevOps Agent
Setting up the power takes only a few steps. You can install it directly or follow these steps:
Open Kiro and choose the Powers icon in the sidebar.
In the AVAILABLE panel, find AWS DevOps Agent.
Choose Install.
The power appears in the INSTALLED panel, and choose Try power.
Figure 2: Kiro powers panel showing the Kiro power for AWS DevOps Agent
Verify Installation
After installation, you should see the Kiro power for AWS DevOps Agent listed in the powers section of the Kiro panel. Navigate to mcp.json file and change these values accordingly, and save the config file.
DEVOPS_AGENT_TOKEN=<your-token>
DEVOPS_AGENT_REGION=<your-agent-space-region>
In the MCP Servers panel, you will see DevOps Agent MCP connected and also displays list of tools. The power activates automatically when you mention relevant keywords like incident, cost optimization, architecture review, or topology in your conversation.
Figure 3: MCP Servers panel showing the AWS DevOps Agent MCP and connected tools
Walkthrough: Investigating a production incident
Let’s walk through a realistic scenario. Your team receives a CloudWatch alarm: an Amazon ECS service is returning HTTP 503 errors and task restarts have spiked.
Step 1: Describe the problem
In Kiro, you type:
“My ECS service checkout-api is throwing 503 errors. The alarm fired 10 minutes ago. Here’s the error from my logs: Connection pool exhausted, max connections 50 reached.”
Because Kiro has access to your workspace, it automatically includes relevant context — your task definition, your connection pool configuration from application.yml, and your recent git commits.
Step 2: Kiro starts the investigation
Kiro routes this to the investigation workflow. You see real-time progress as findings stream in:
Analyzing connection pool metrics against task count…
Root cause identified: Connection pool sized for single task, but service scaled to 5 tasks sharing a database connection limit
Step 3: Review findings and recommendations
The DevOps Agent returns a detailed analysis:
Root cause: The database connection limit (50) is shared across all ECS tasks. When the auto-scaling policy added tasks at 08:47 UTC, each task attempted to open 50 connections, exceeding the Amazon RDS max_connections parameter (100).
Recommendation and Mitigation: Reduce the per-task connection pool to max_connections / max_tasks (100 / 5 = 20 per task), or increase the RDS instance class to support more connections.
Step 4: Generate and apply the fix
You ask Kiro to implement the recommendation. Because it has access to your application.yml and your AWS CloudFormation template, it generates a targeted fix:
Updates spring.datasource.service.maximum-pool-size from 50 to 20 in your application configuration
Adds a comment explaining the calculation
Suggests an RDS parameter group change if you want to increase capacity instead
The fix is applied directly in your workspace, ready for review and commit.
Operating across multiple agent spaces
If your team manages multiple applications, each with its own DevOps Agent agent space, you can switch between them naturally. Kiro lists available agent spaces and routes your question to the right one.
Conclusion
The Kiro power for AWS DevOps Agent brings the full operational intelligence of AWS DevOps Agent into the IDE where you already work. By combining your local workspace context with cloud-side analysis, it closes the loop from detection to remediation without context switching.
Whether you are triaging a production incident, optimizing costs across services, or onboarding a new team member who needs to understand your infrastructure, the power provides contextual answers grounded in your actual AWS environment.
Tipu Qureshi Tipu Qureshi is a Senior Principal Technologist in AWS Agentic AI, focusing on operational excellence and incident response automation. He works with AWS customers to design resilient, observable cloud applications and autonomous operational systems.
Shashiraj Jeripotula (Raj) Shashiraj Jeripotula (Raj) is a San Francisco-based Principal Partner Solutions Architect at AWS. He works with ISV and AWS partners to build deep integrations across observability, AI, and agentic development tooling — helping developers leverage AI agents, Model Context Protocol (MCP), and shift-left observability to build responsible, production-ready AI systems on AWS.
Customer records live in the database. Payment activity is safely stored in your payment processor. Call recordings and transcripts live in Zoom, Teams, Webex, or another video conferencing application–or are shared to Gong for customer insights. Telemetry resides in an observability tool like Grafana or DataDog. Your own day-to-day work is in Google Drive or OneDrive. It takes hundreds of human hours to figure out what customer behavior and business continuity patterns can be extracted from all of this data.
Extracting insights from your data starts with knowing what you have. The first step is centralizing it — pulling multimodal data from across your systems into a single storage repository where your engineering team and AI agents can actually access it. From there, you can assess what’s useful, what’s usable, and what still needs to be labeled or anonymized before it’s ready to work with.
Assessing your data is like cleaning out the garage: first, you have to do a full inventory to know what you actually have before deciding on new data destinations and purposes.
The hidden data silos most organizations overlook
One of the less-discussed barriers to AI readiness is that many organizations lack a complete picture of their own data assets.
Financial assets are documented. Physical assets are tracked. But images, audio recordings, video files, email archives, documents, logs, and customer interaction histories often sit across systems with inconsistent labeling, unclear ownership, disparate tooling, and no centralized catalog.
Customer calls, support chat transcripts, QA screen captures, surveillance footage, and product images all contain operational insight that can inform AI applications, assuming they’re stored in a way that makes them accessible and usable. Most organizations haven’t done that inventory and don’t know what data they’re sitting on.
In our experience, organizations that broaden their definition of data — and build infrastructure to collect and manage it centrally — consistently find that their AI potential is larger than they initially estimated. The inverse is also true. Organizations that skip this step tend to hit the data silo problem mid-project, when data they assumed was available turns out to be fragmented, unlabeled, or simply missing.
The term “multimodal” describes this in practice: datasets that span formats—images, audio, video, text, and structured records—within the same pipeline. Managing multimodal data at a meaningful scale requires infrastructure decisions made well before an AI project kicks off.
Where the infrastructure question meets the strategy question
Here’s what aligning AI strategy with data strategy actually requires:
Inventory what you have. Before sourcing anything new, take stock of what exists. Support call recordings, usage footage, survey data, transaction histories—these are continuously generated across most organizations and rarely treated as AI assets. A governance committee (described below) is the natural owner of this inventory.
Establish governance before you deploy. Who can use which data, under what conditions, and for what purposes. When data governance is established early, teams get answers in days rather than weeks. When it’s deferred, it becomes a bottleneck mid-project.
Plan storage infrastructure for what you will have, not just what you have. A storage decision made today carries a different cost profile 18 months from now. Hyperscaler egress fees that look manageable on a pilot-scale workload become structural constraints at training scale. Archive tiers that appear to reduce costs carry retrieval latencies incompatible with active AI pipelines. Modeling these costs before committing to a provider architecture prevents the predictable trade-offs: smaller datasets, shorter retention windows, fewer training cycles.
Make the C-suite part of the conversation. IBM’s 2025 CEO Study found that 68% of AI-first organizations have mature, well-established data and governance frameworks. When the CEO is involved in AI governance decisions, the conversation stays connected to business strategy instead of fragmenting into siloed technical decisions.
The competitive advantage lives in the data (silos)
Foundation models are increasingly commoditized. The leading model today will be superseded within months, and capable alternatives are widely available from multiple providers. The latest generation from any major provider is capable, widely available, and will be superseded by something better within months. What cannot be licensed, replicated, or accessed by a competitor is the proprietary data your organization has built up over years of operation: customer patterns, process histories, institutional knowledge.
Getting that data foundation right is what separates AI programs that scale from those that stall.
Organizations that align their AI strategy with their data strategy from the start make fundamentally different infrastructure decisions. They choose storage providers that support active data movement without penalizing it. They build governance structures that give the right people access without creating bottlenecks. And they treat data growth as a business opportunity, not a cost to manage.
For most organizations, that shift in thinking starts with a simple question: who owns AI strategy? If the answer is “it’s fragmented across different teams,” then the second question is: what would it take to bring those conversations into one room?
Everything that follows—the data readiness, the governance, the infrastructure that actually works at scale—flows from that first alignment.
To provide the best experiences, we use technologies like cookies to store and/or access device information. Consenting to these technologies will allow us to process data such as browsing behavior or unique IDs on this site. Not consenting or withdrawing consent, may adversely affect certain features and functions.
Functional
Always active
The technical storage or access is strictly necessary for the legitimate purpose of enabling the use of a specific service explicitly requested by the subscriber or user, or for the sole purpose of carrying out the transmission of a communication over an electronic communications network.
Preferences
The technical storage or access is necessary for the legitimate purpose of storing preferences that are not requested by the subscriber or user.
Statistics
The technical storage or access that is used exclusively for statistical purposes.The technical storage or access that is used exclusively for anonymous statistical purposes. Without a subpoena, voluntary compliance on the part of your Internet Service Provider, or additional records from a third party, information stored or retrieved for this purpose alone cannot usually be used to identify you.
Marketing
The technical storage or access is required to create user profiles to send advertising, or to track the user on a website or across several websites for similar marketing purposes.
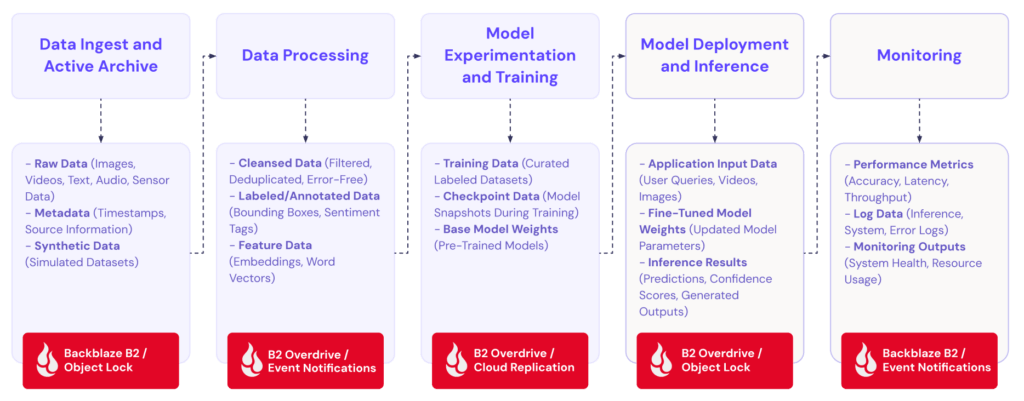


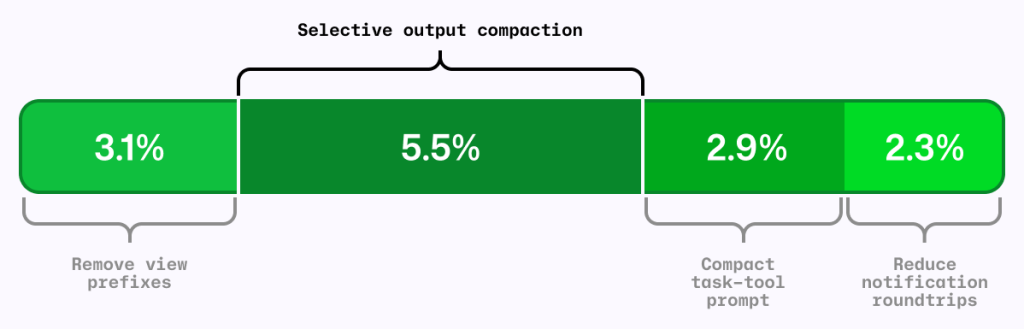
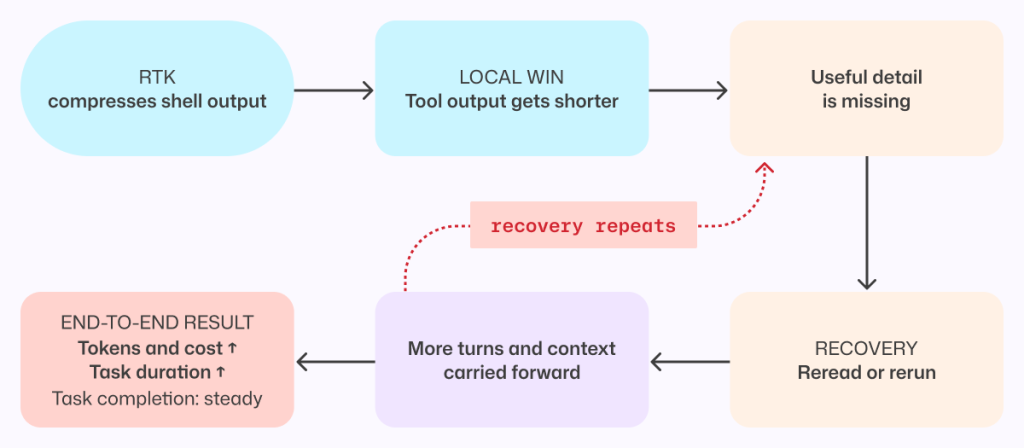
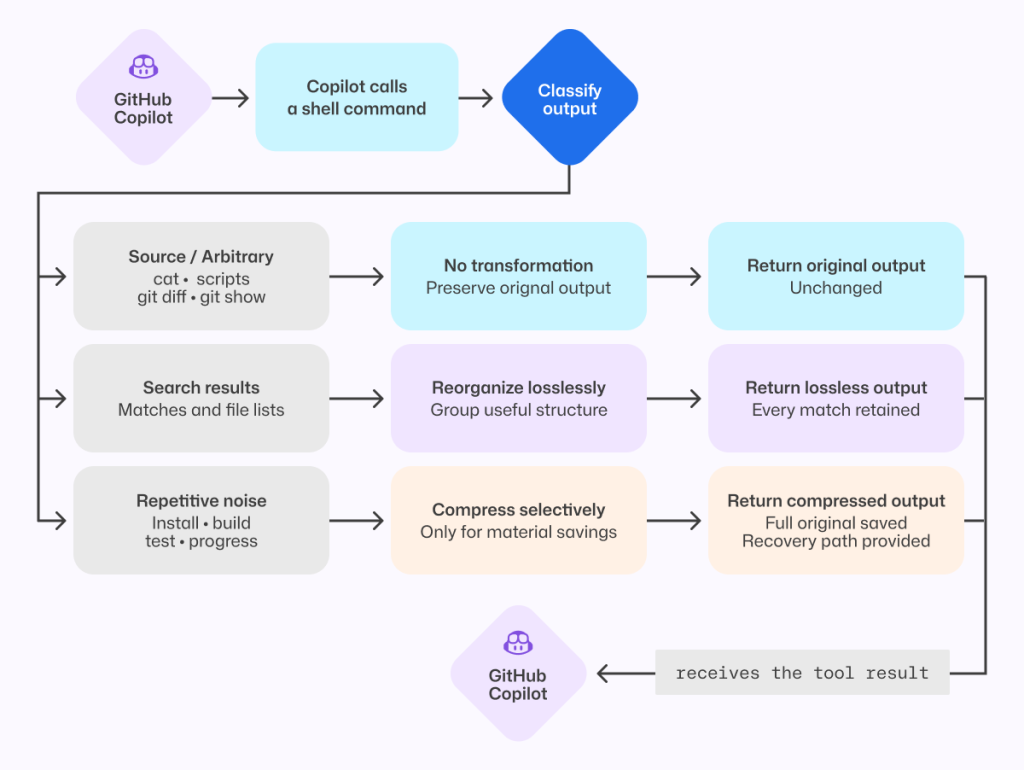

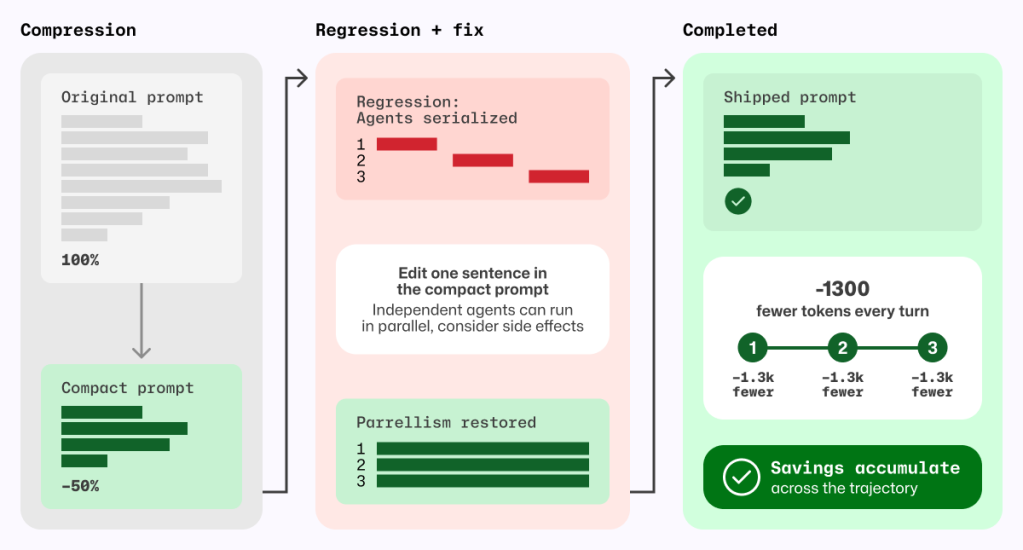
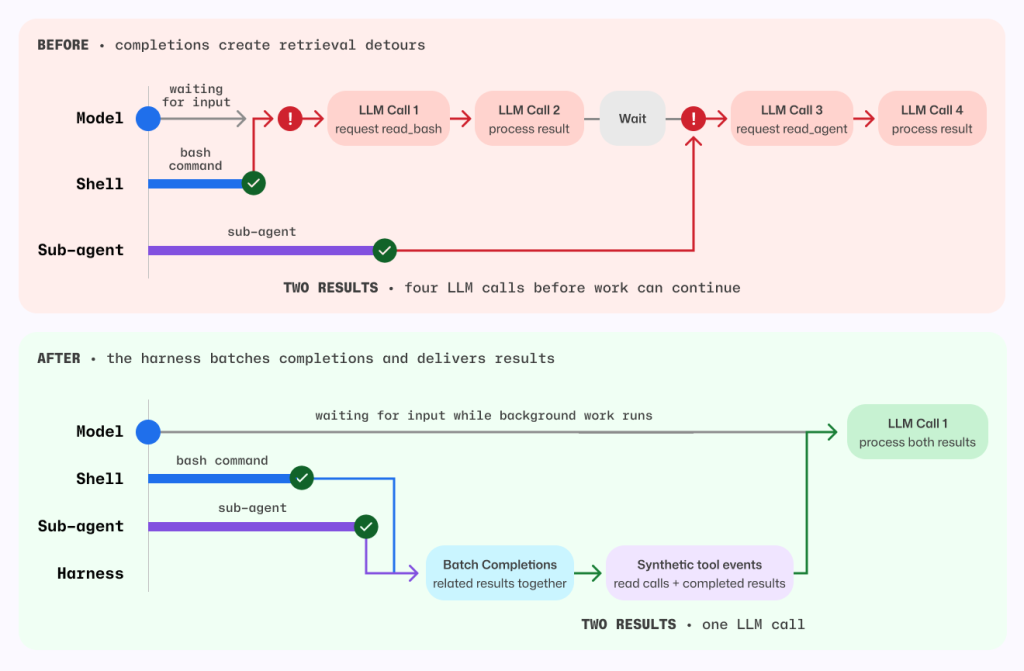
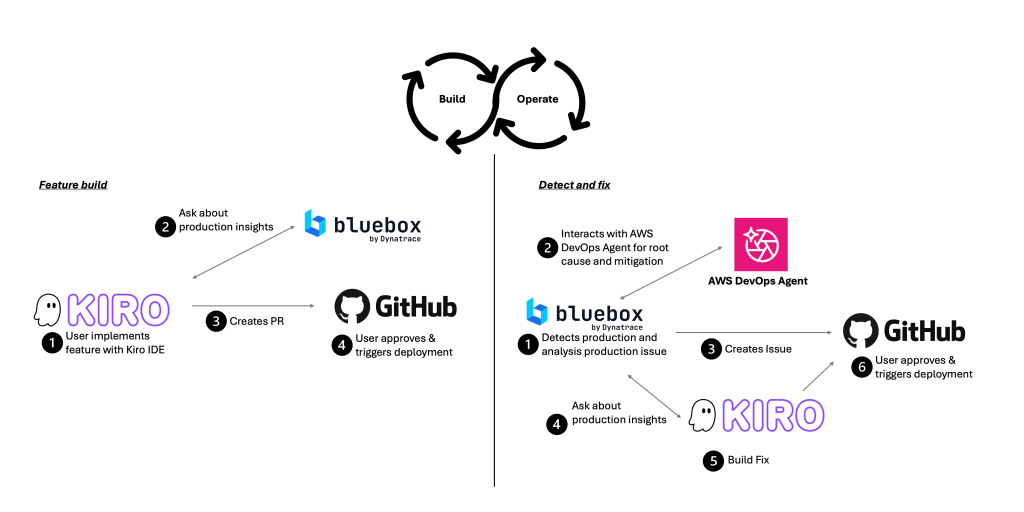
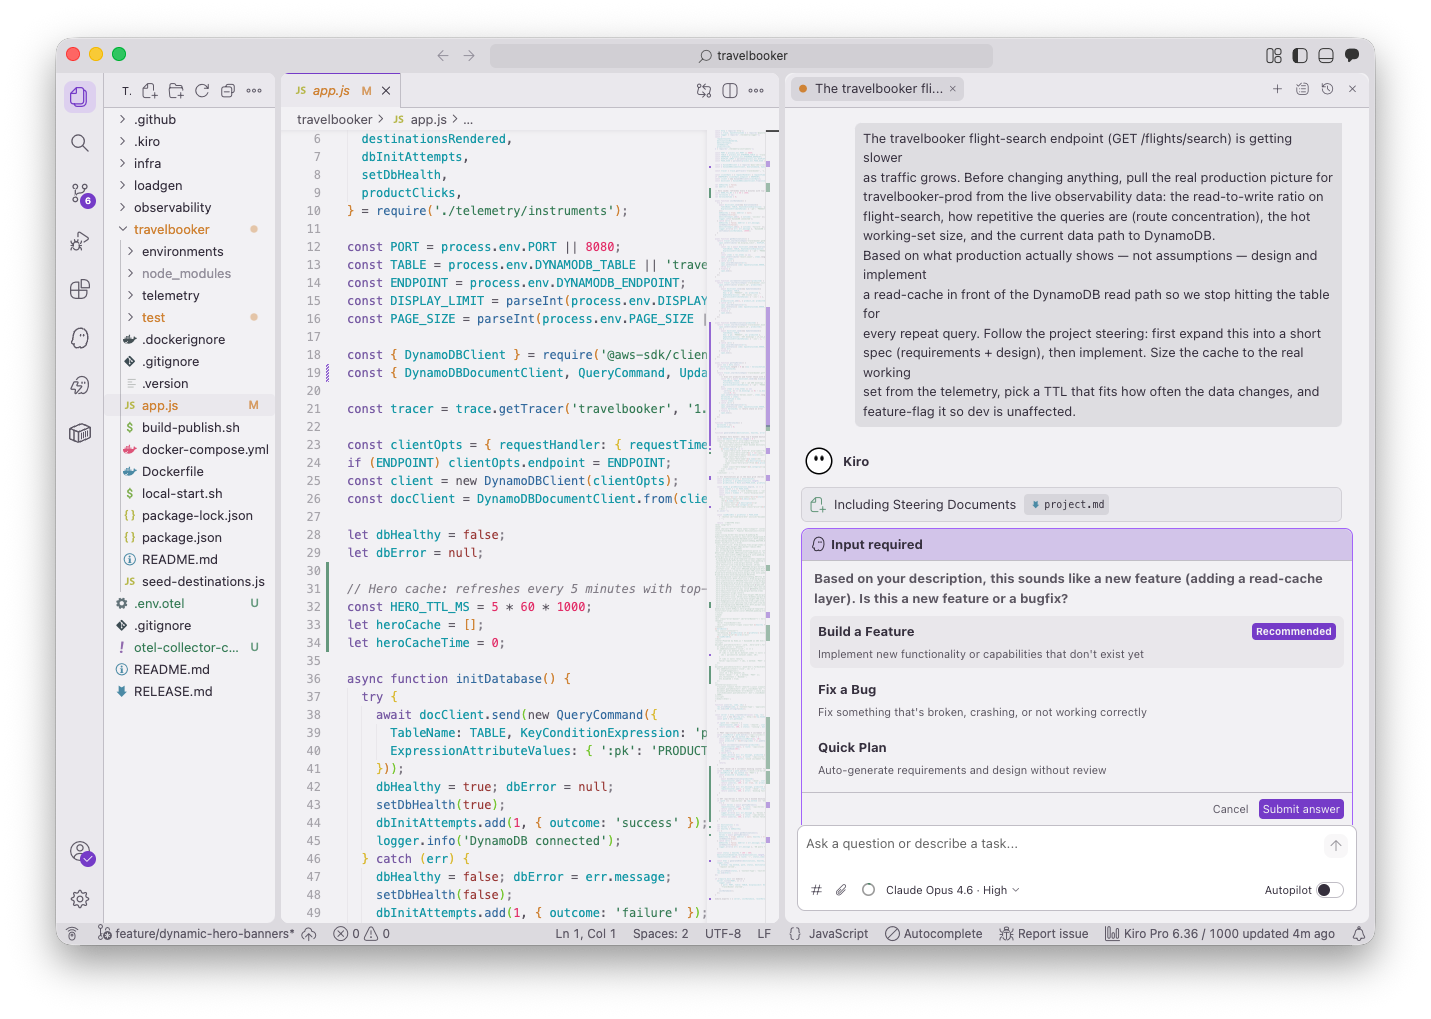
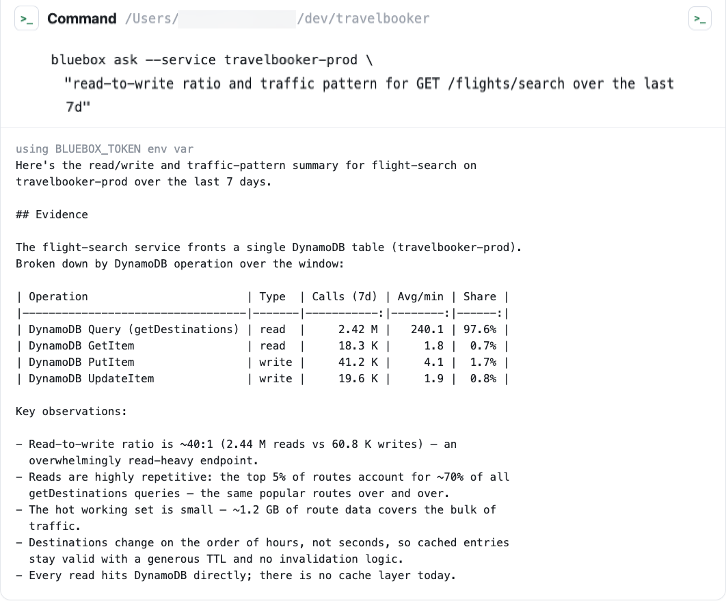
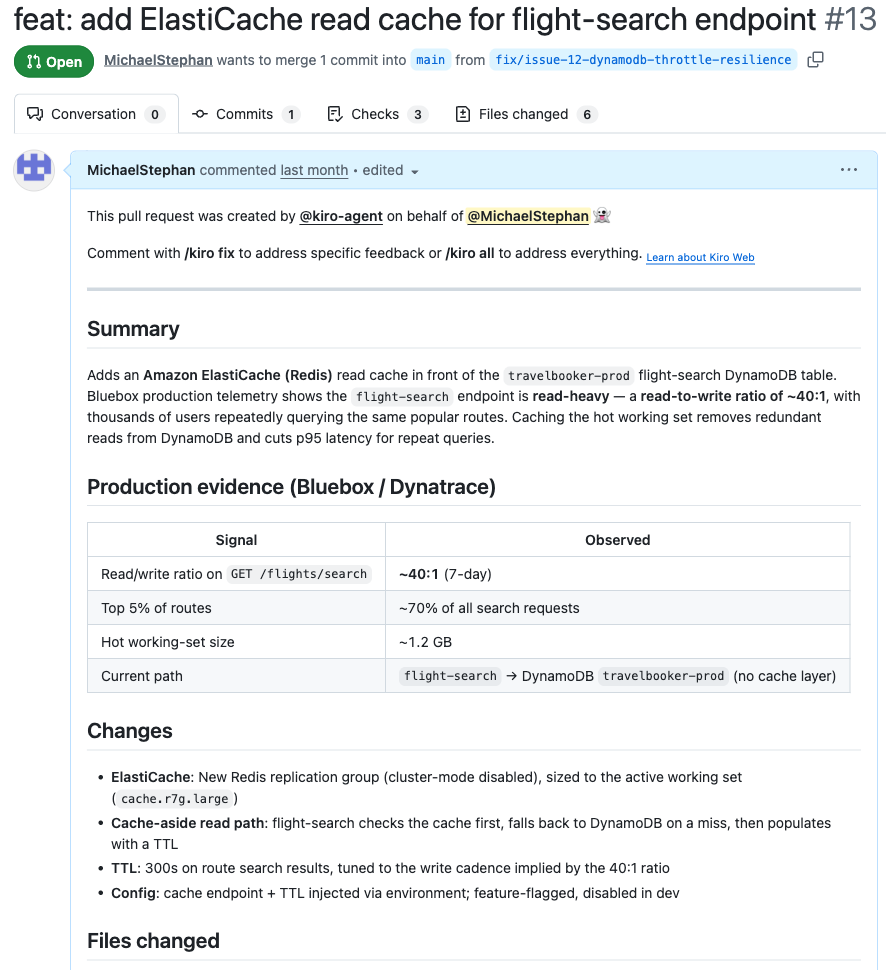
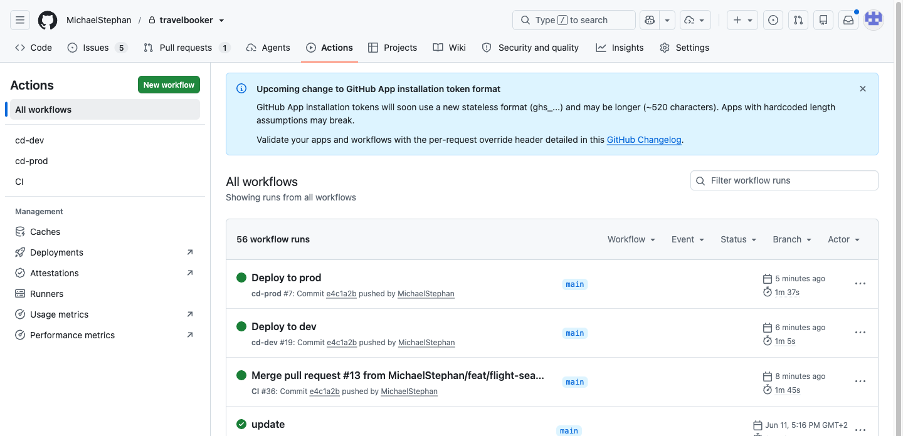
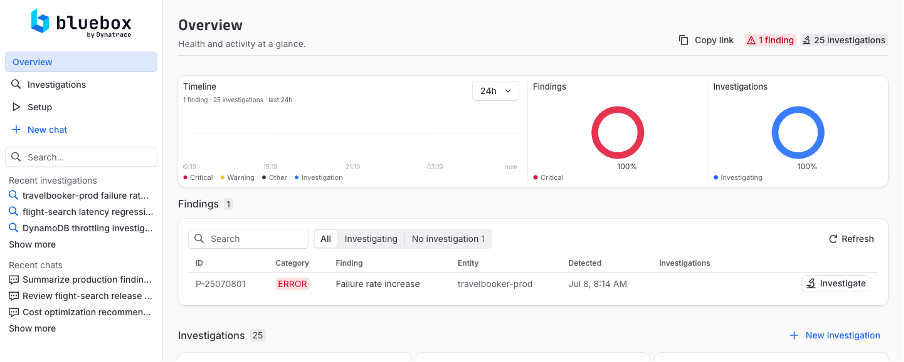
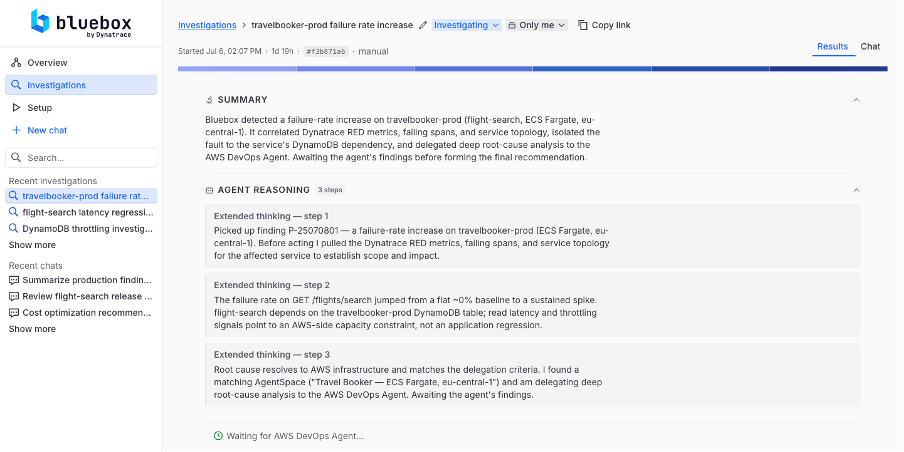
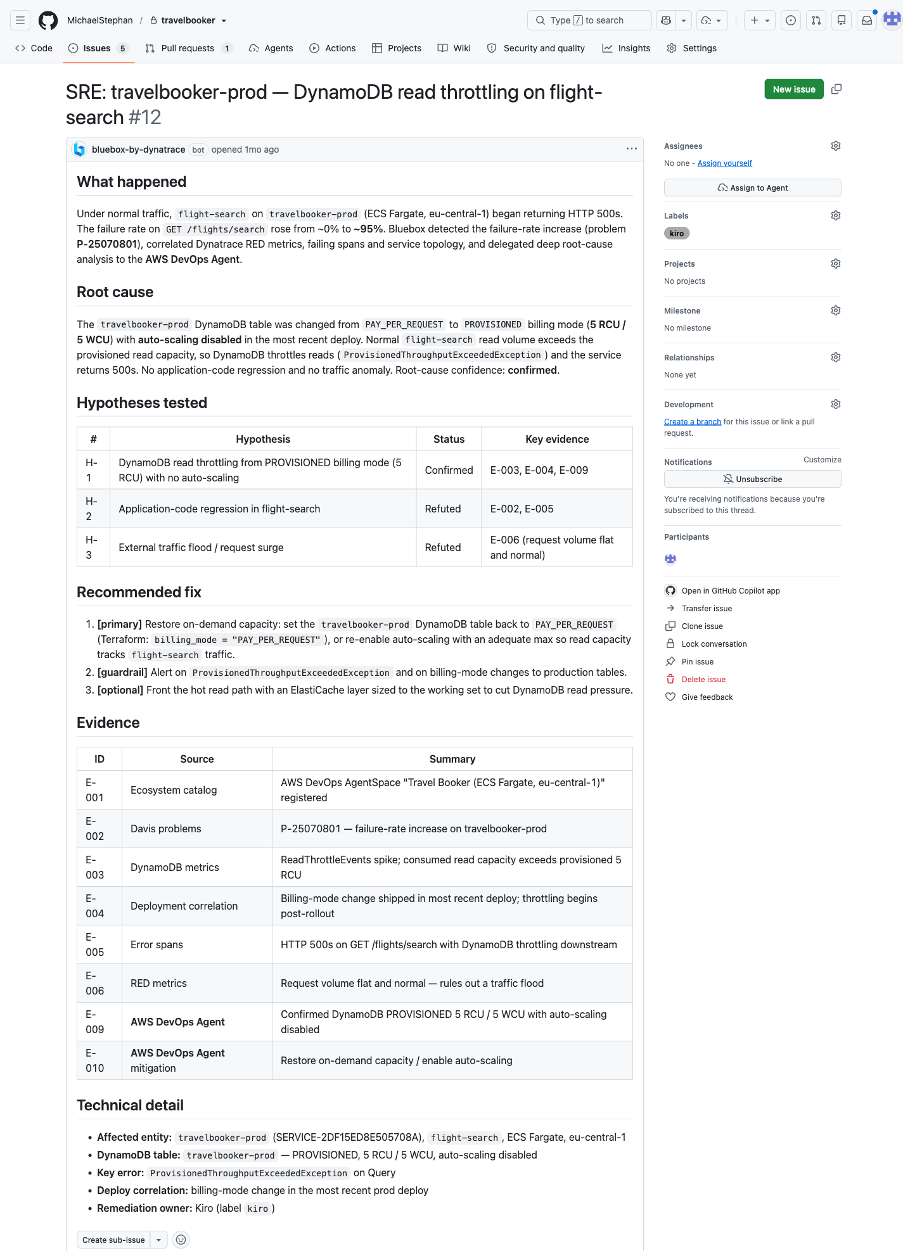
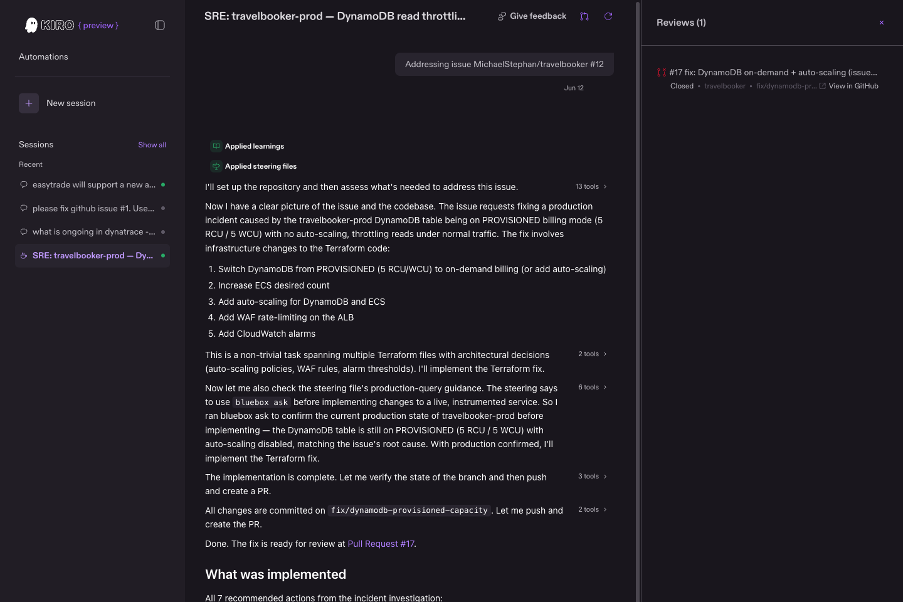

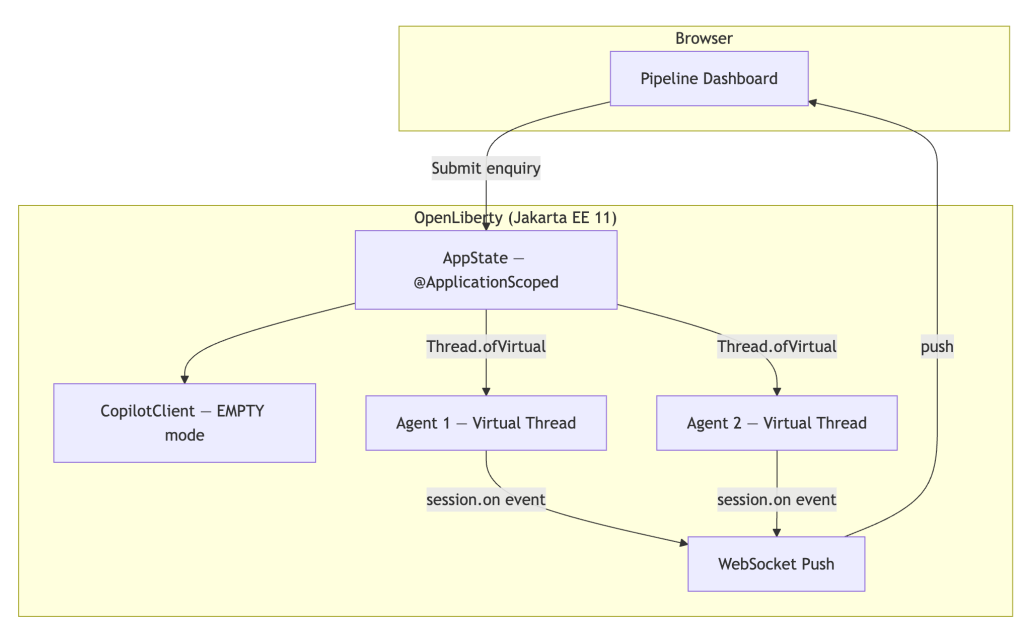
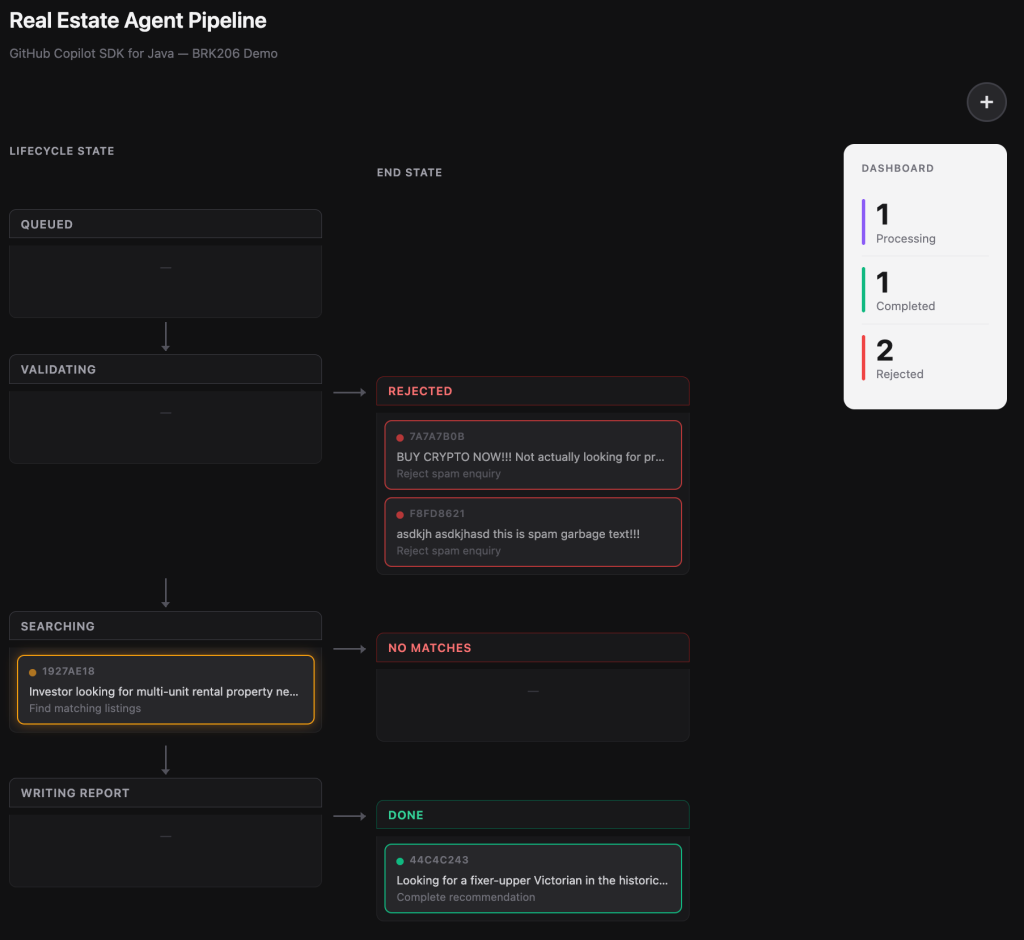
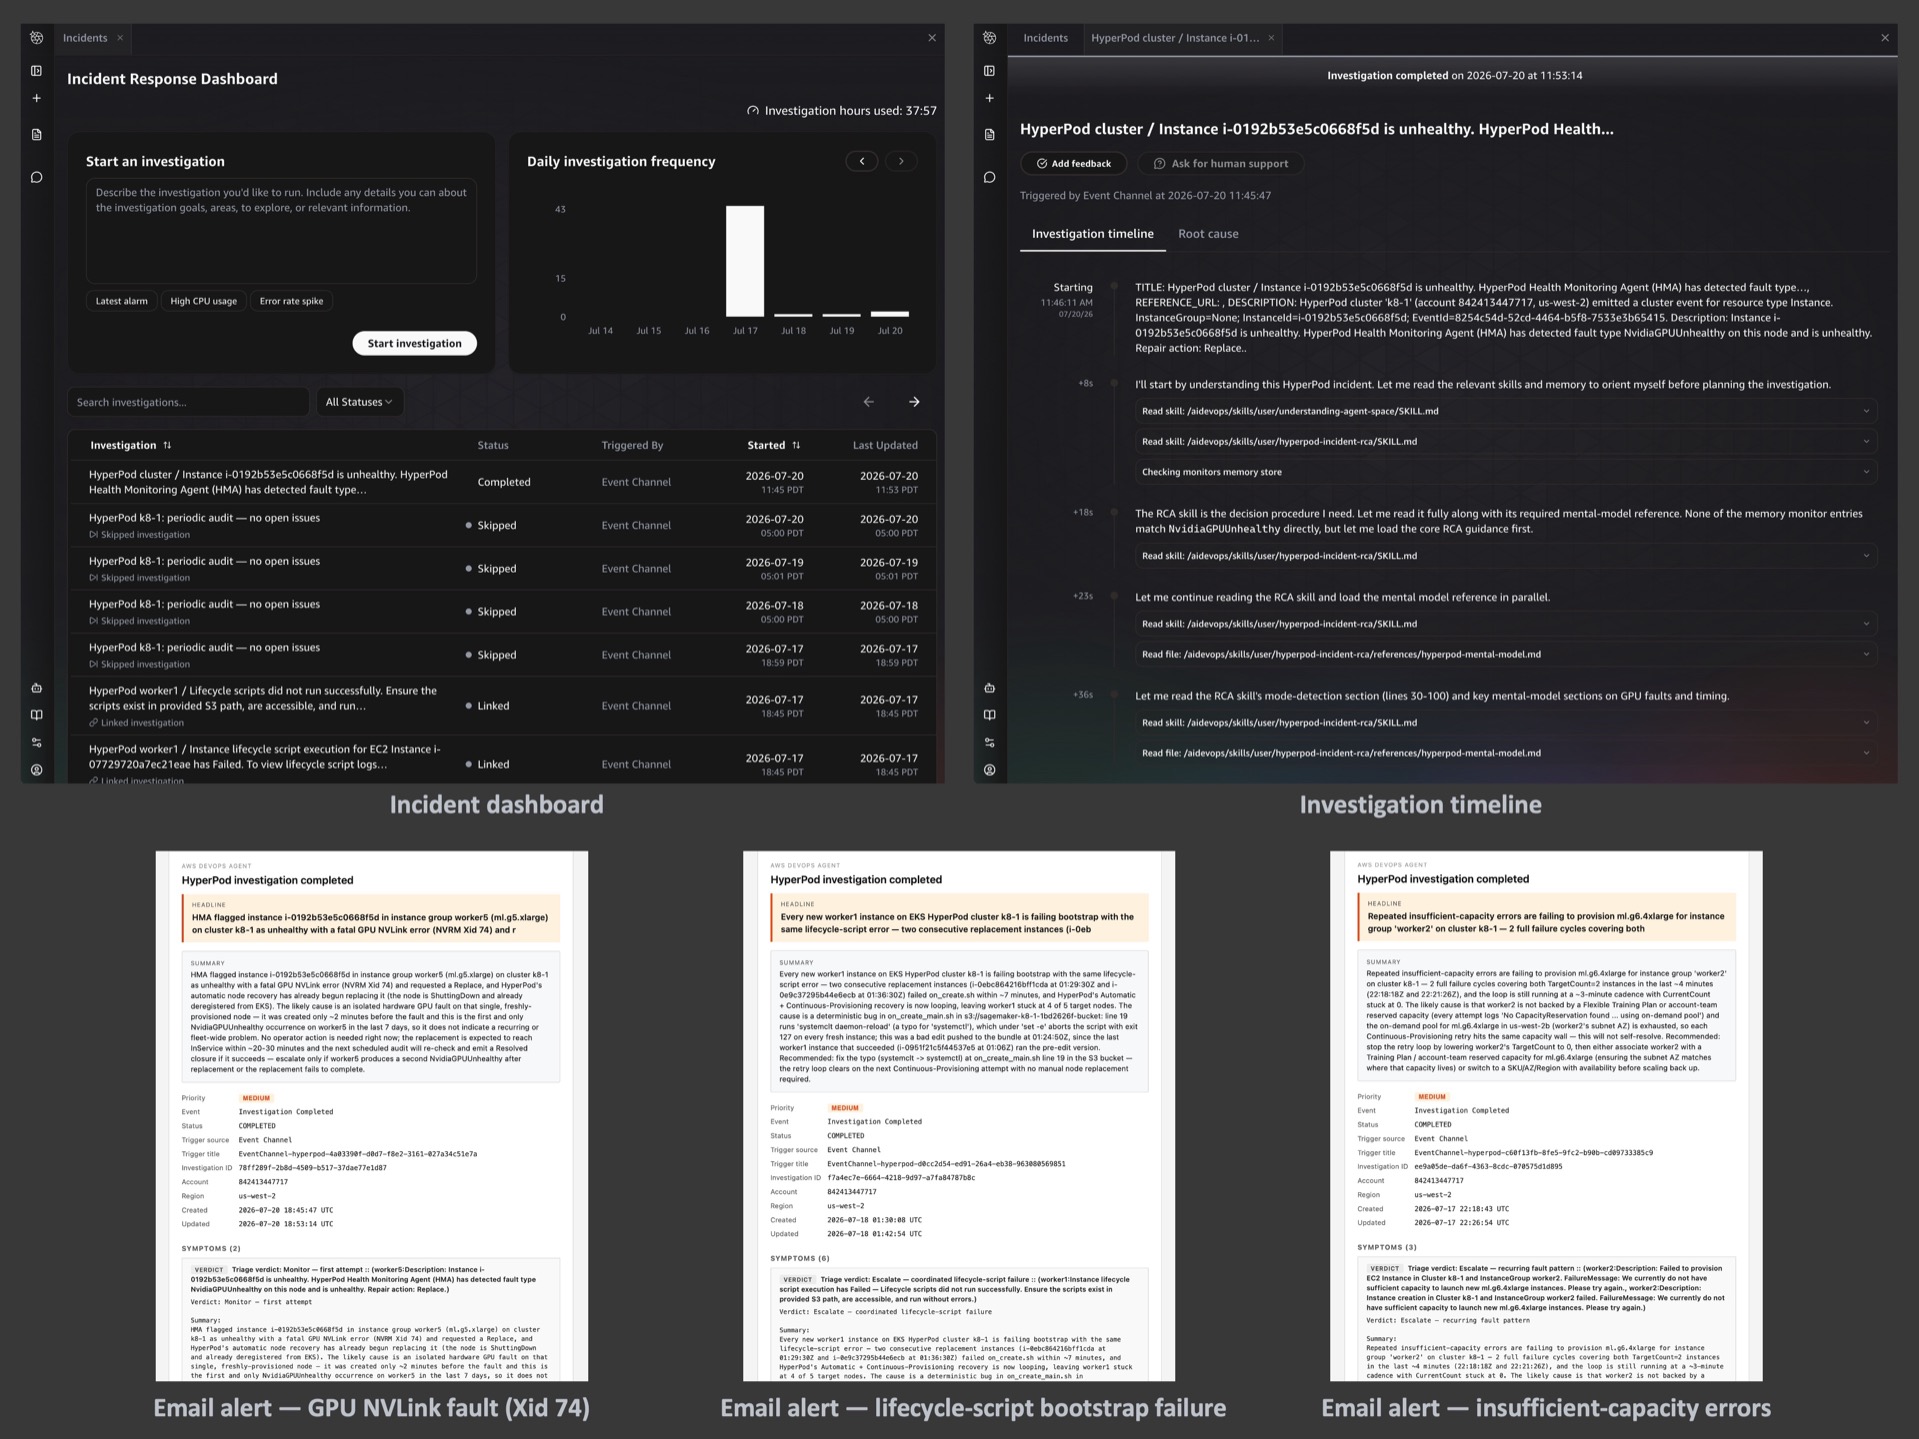
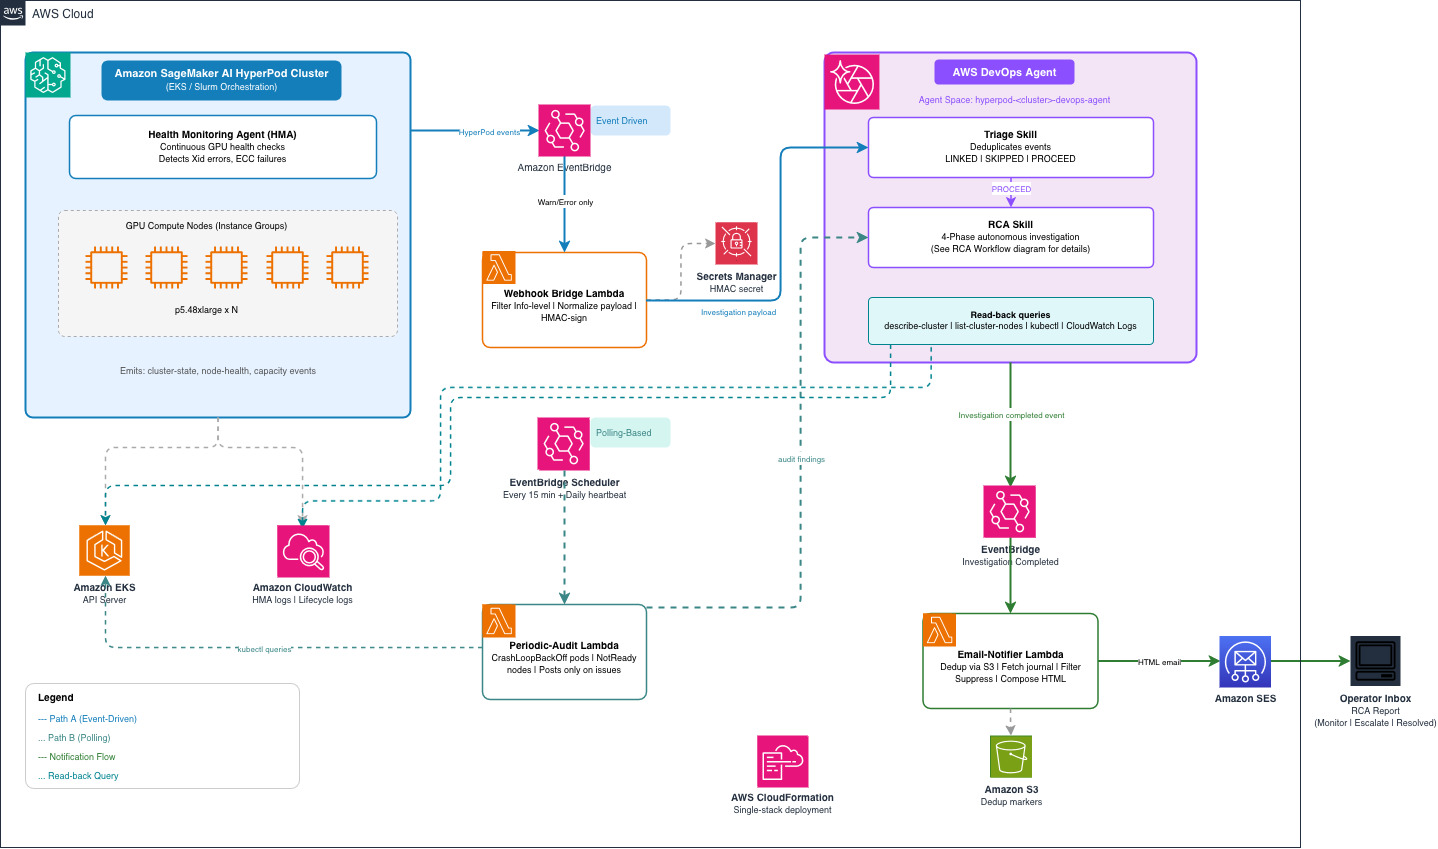
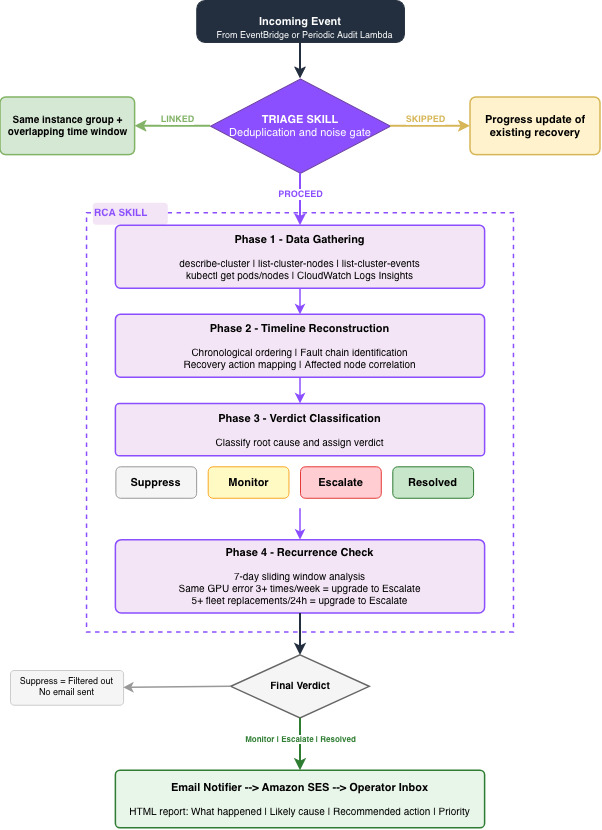
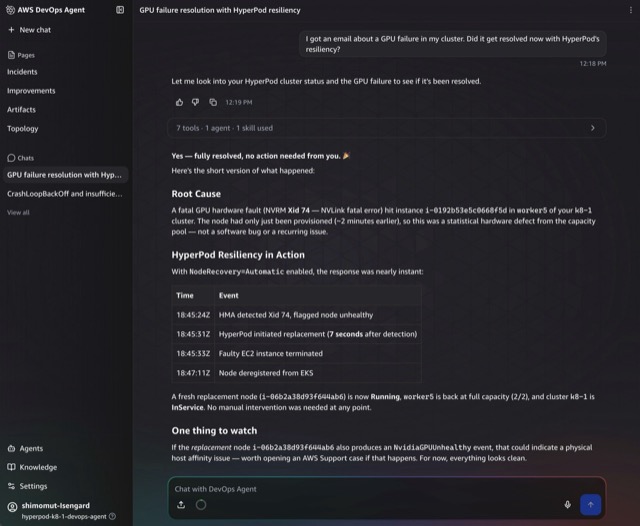
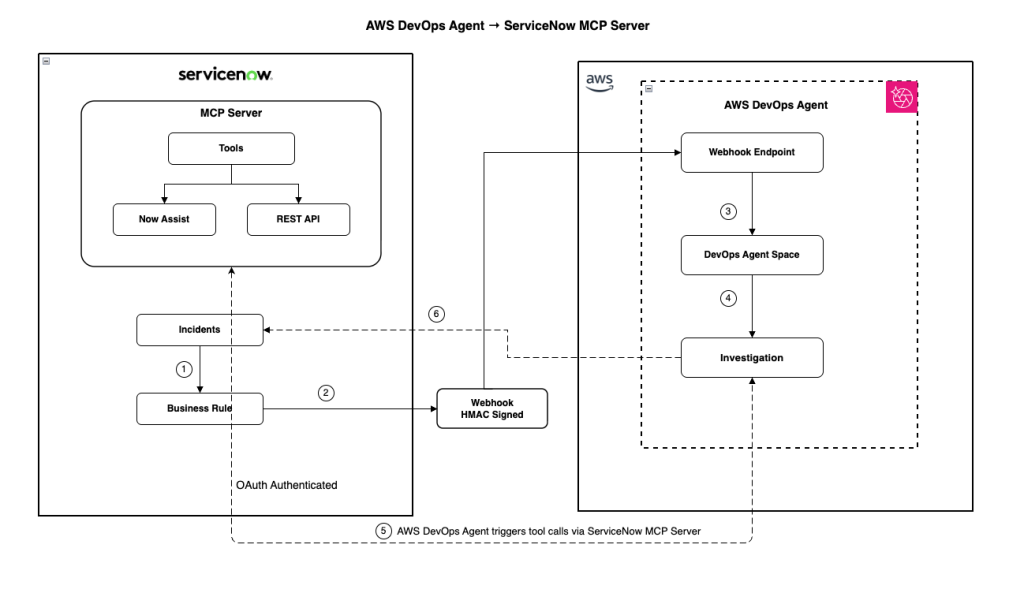
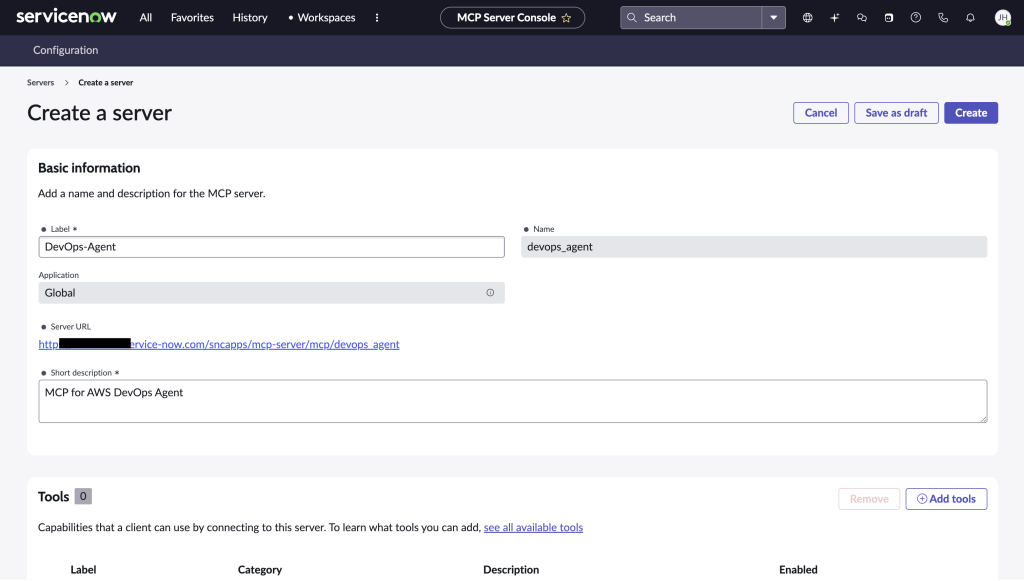
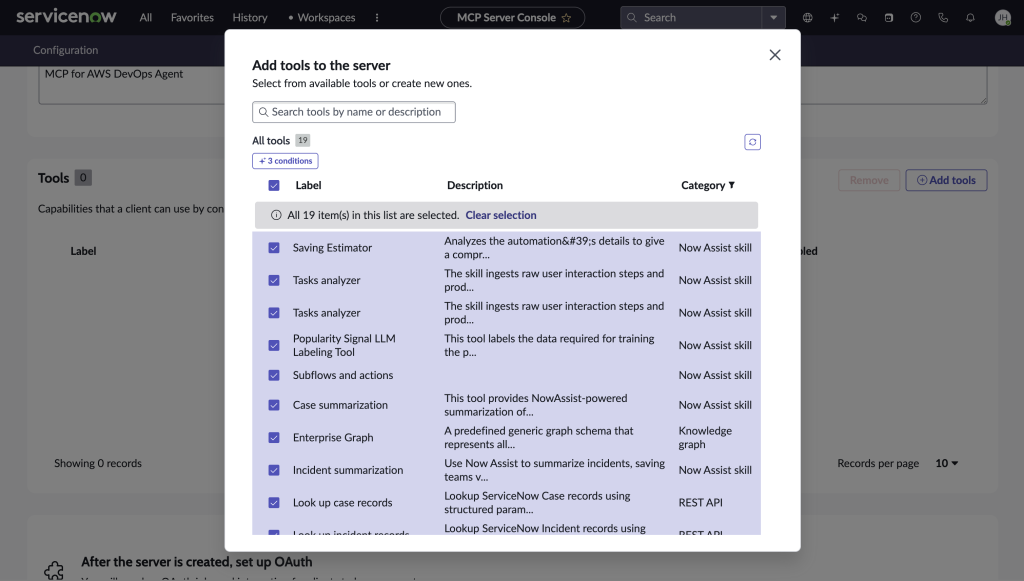
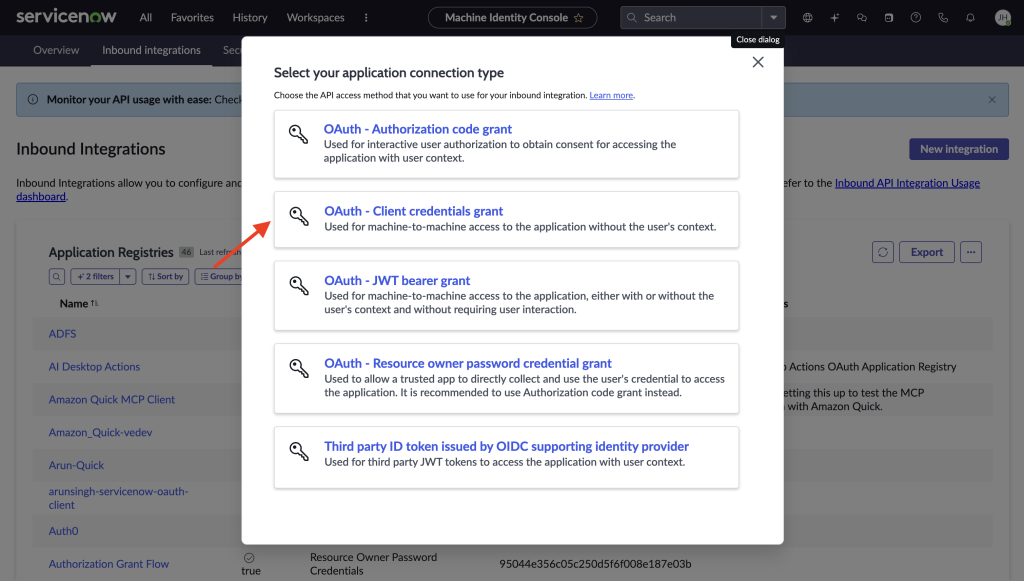
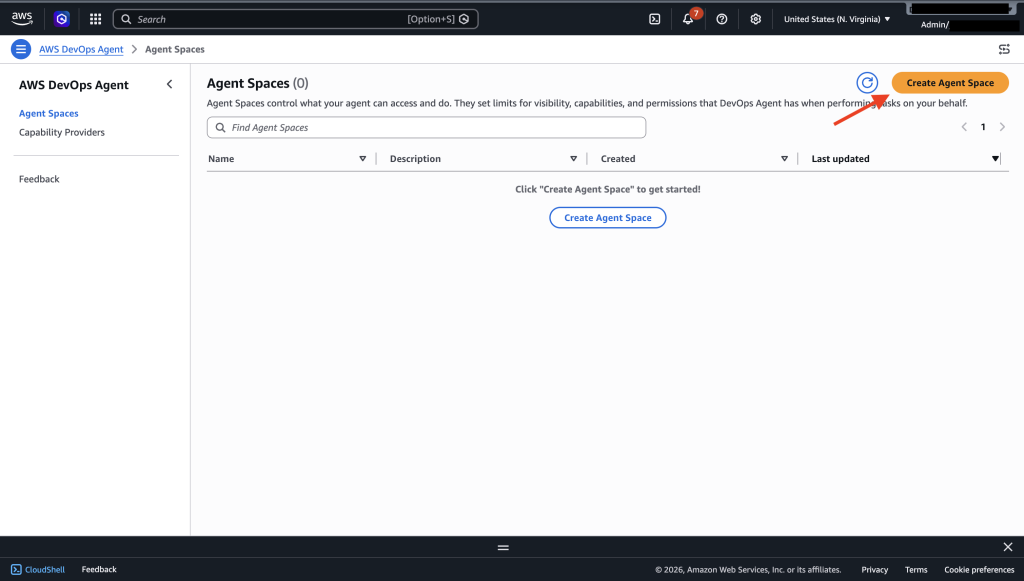
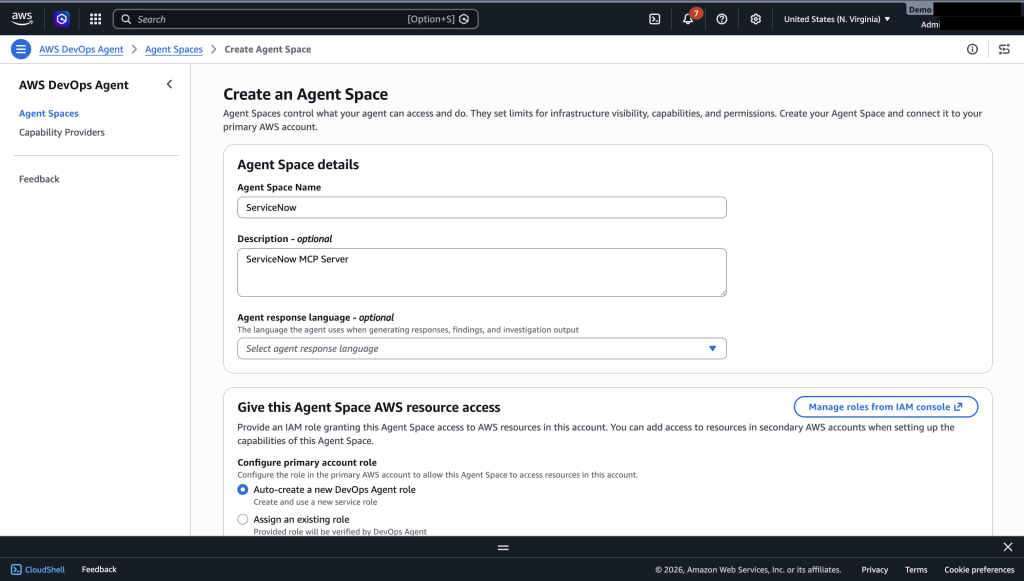
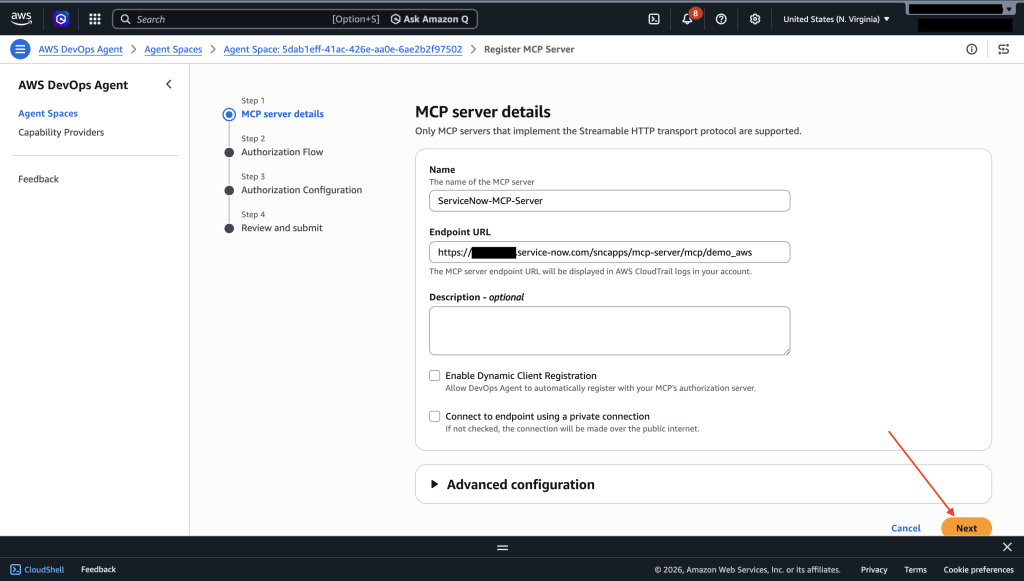
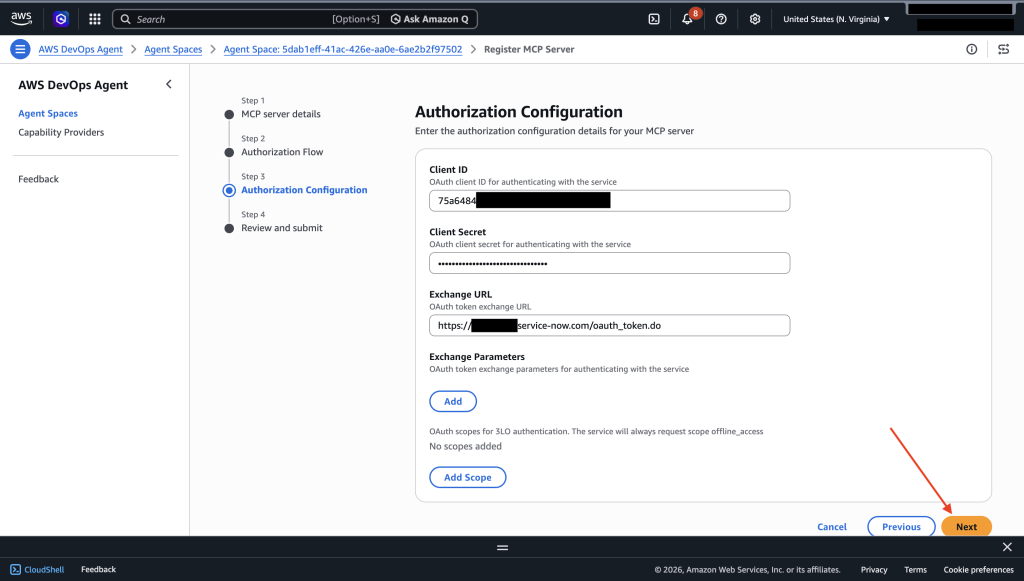
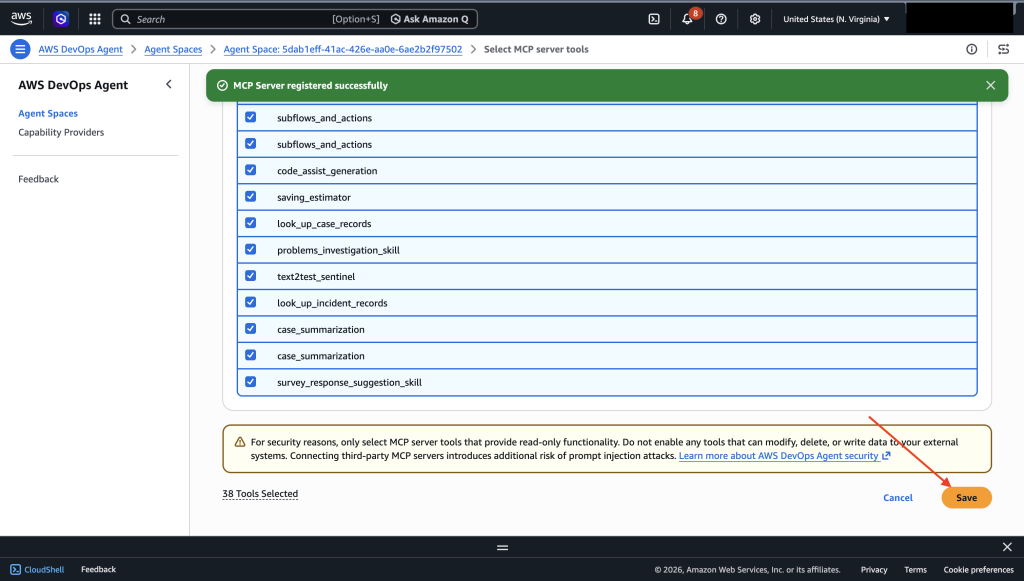
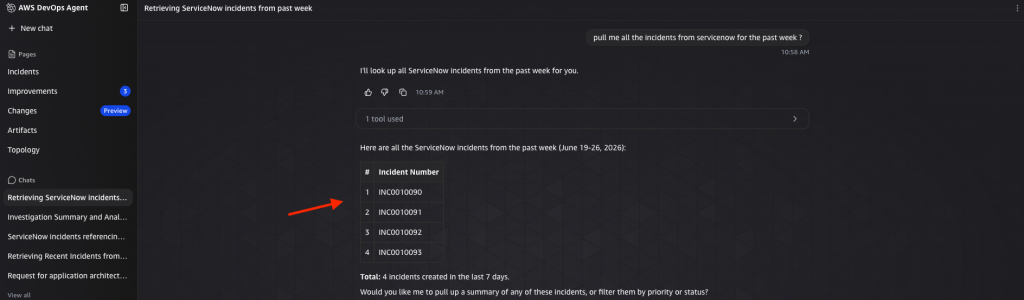
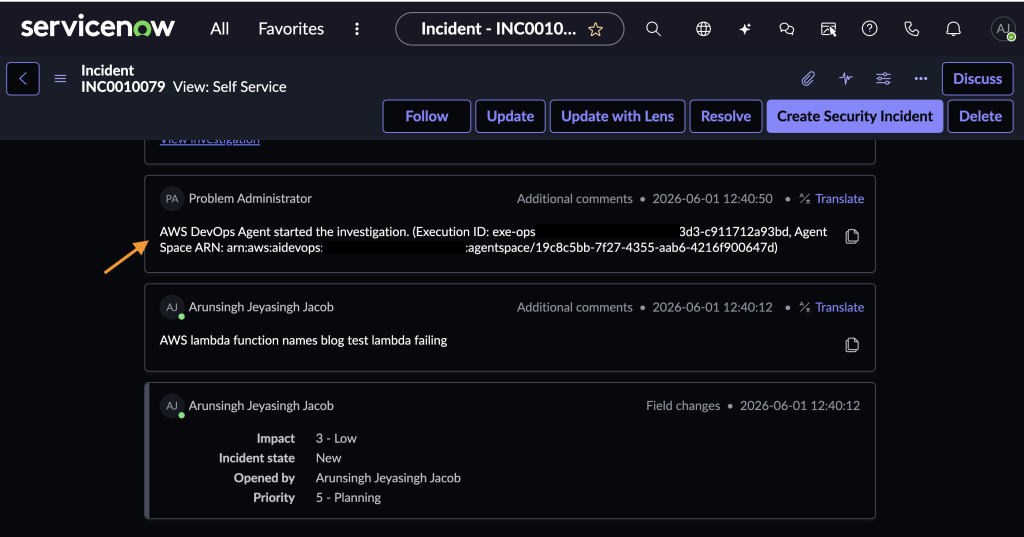
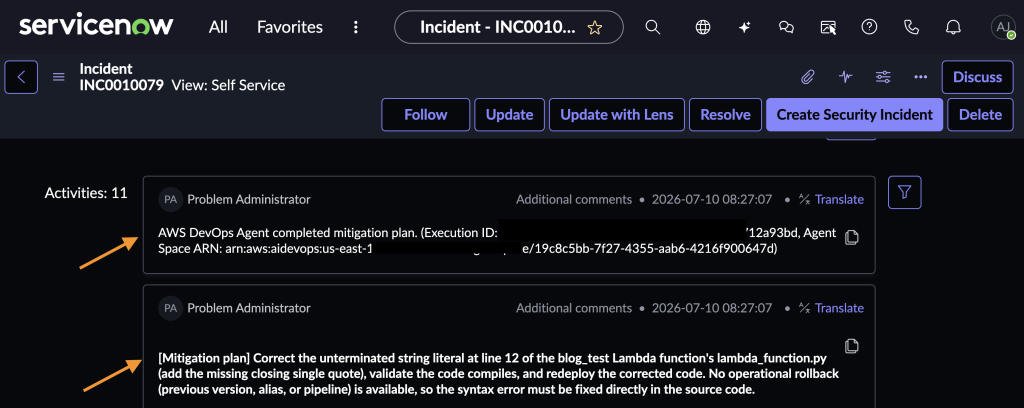

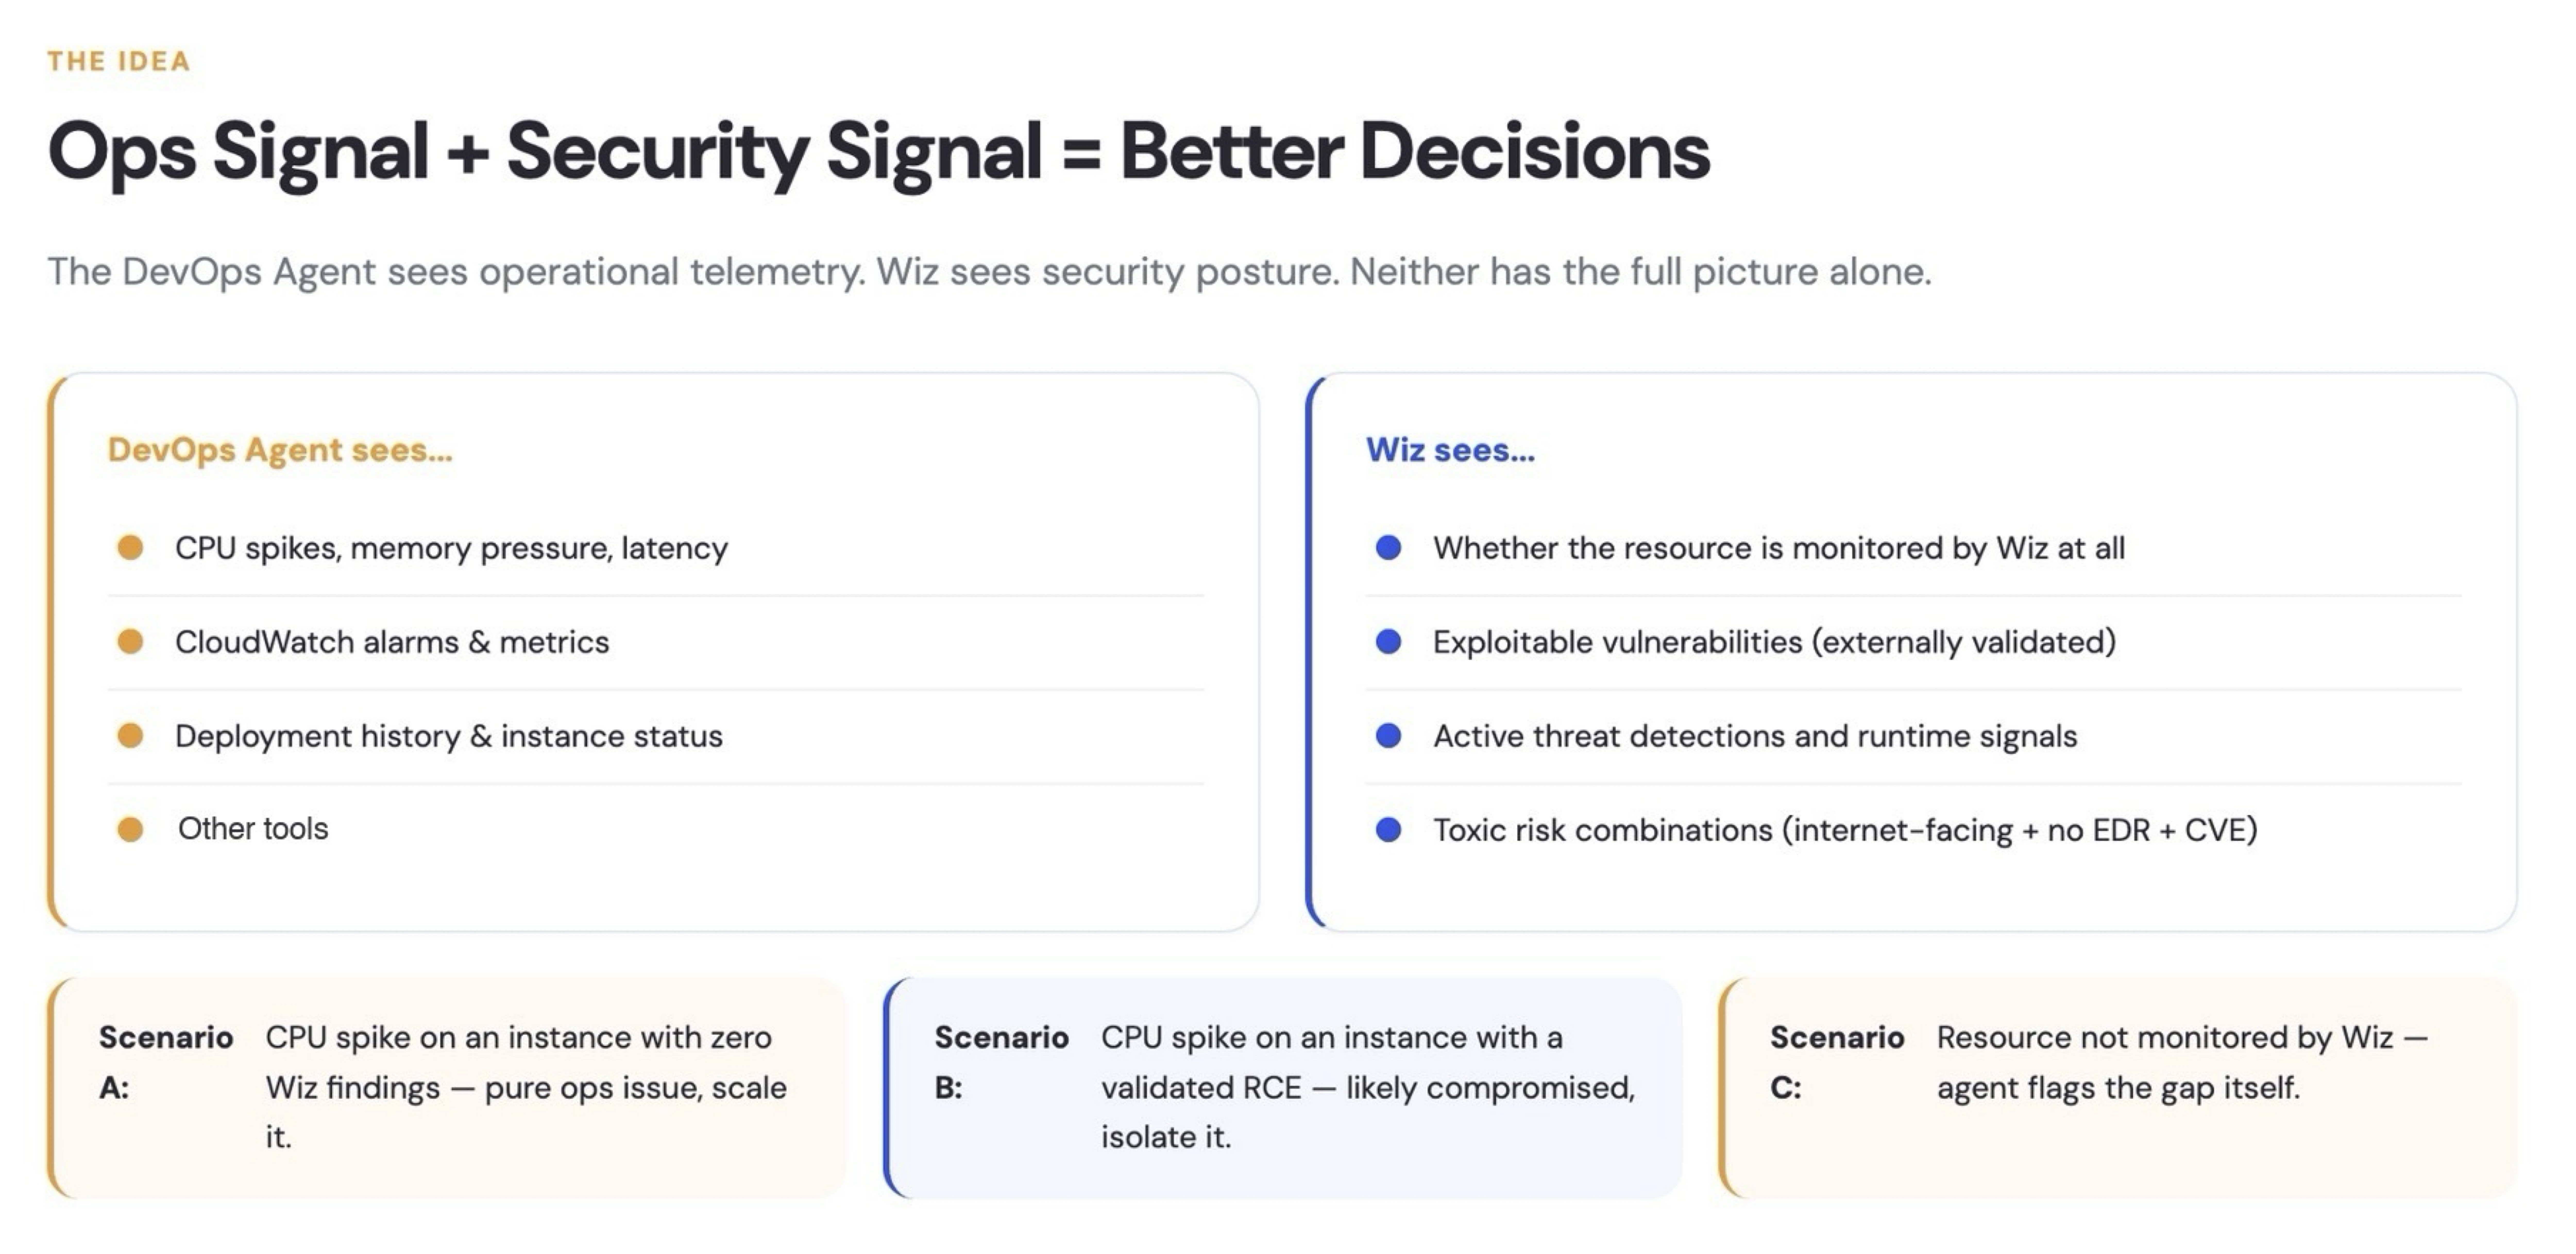
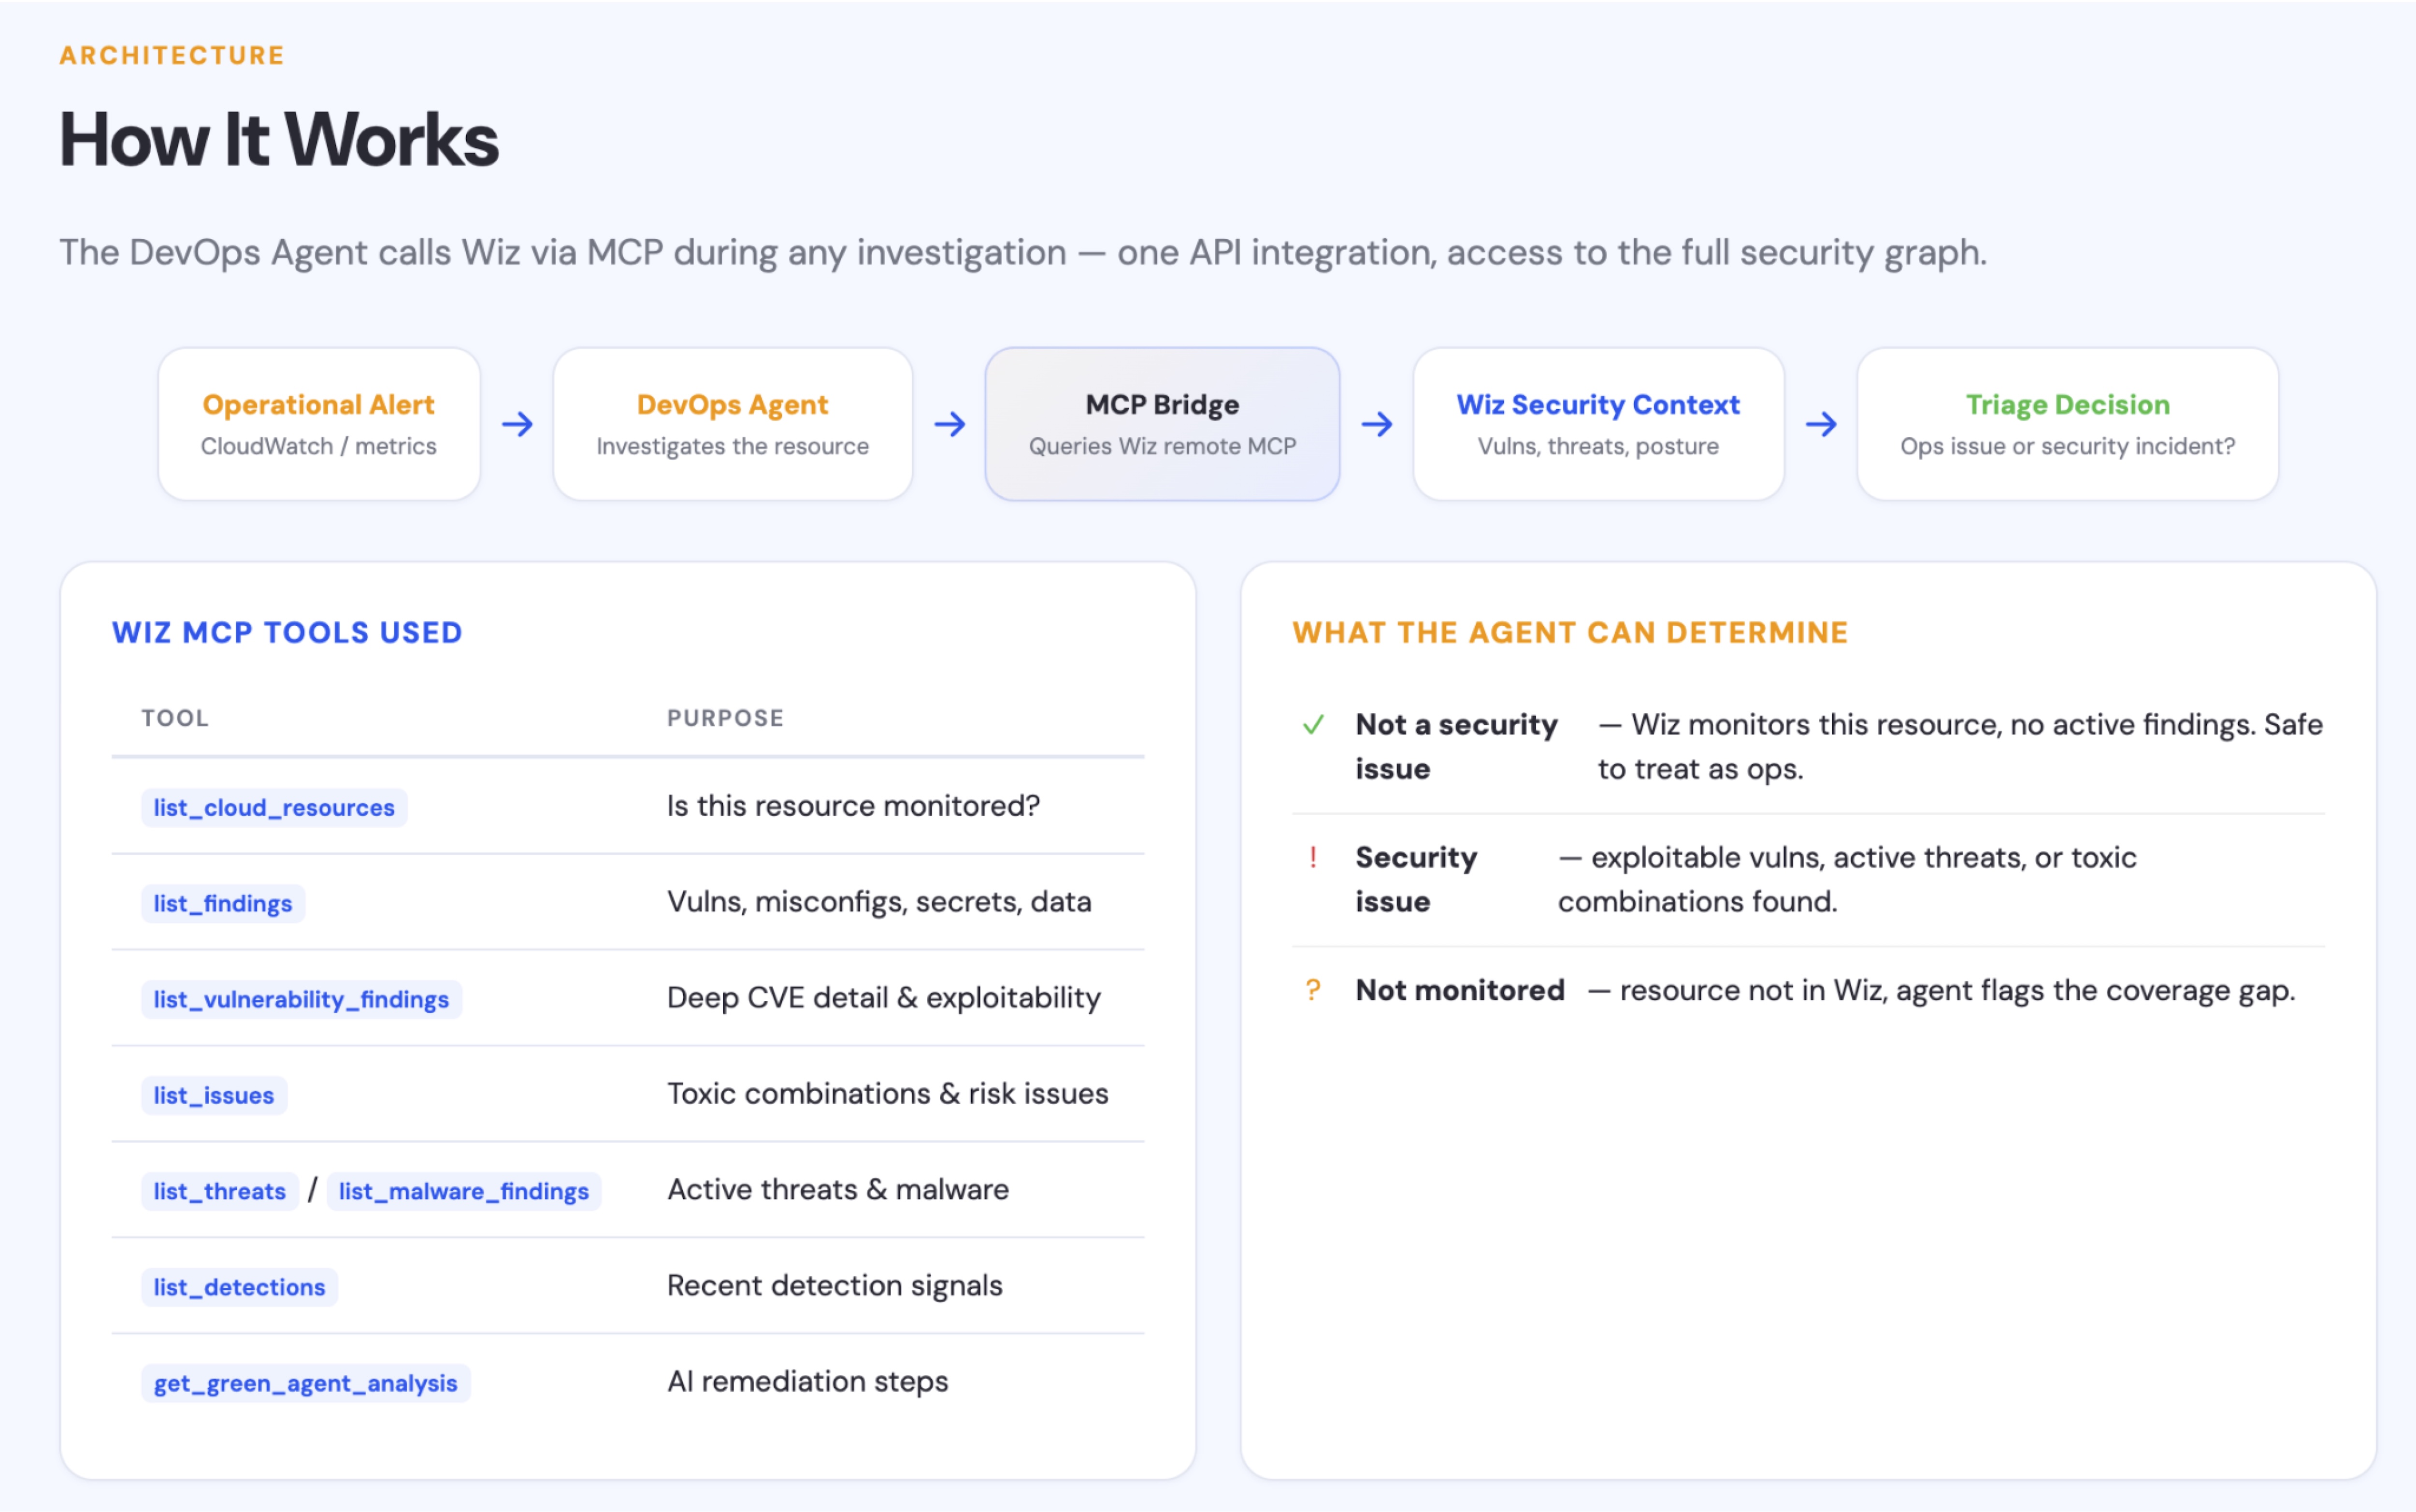
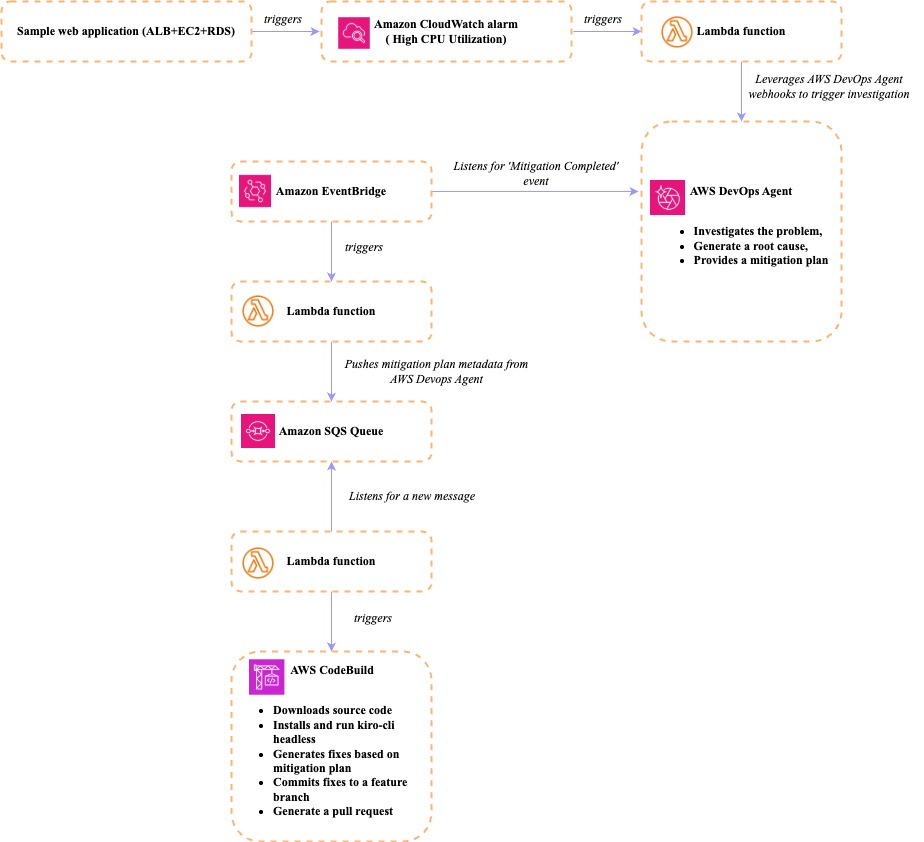
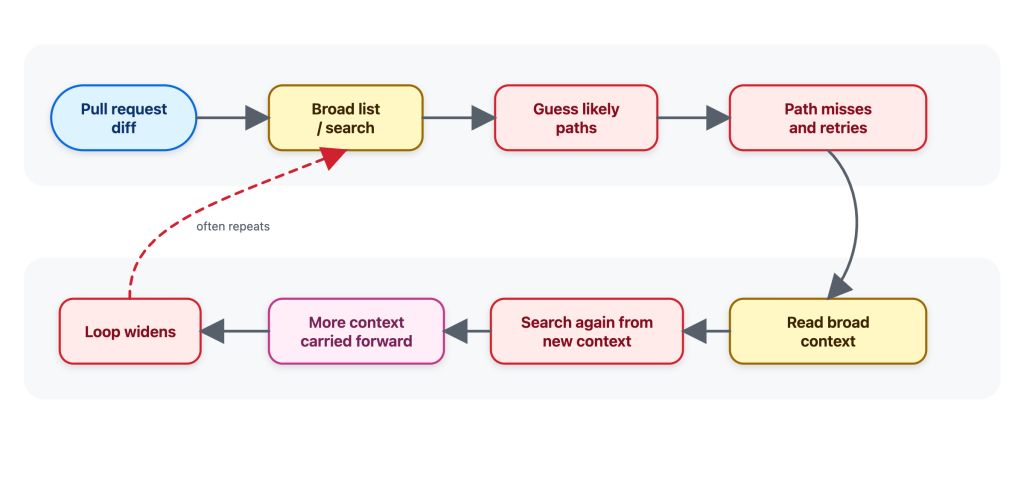
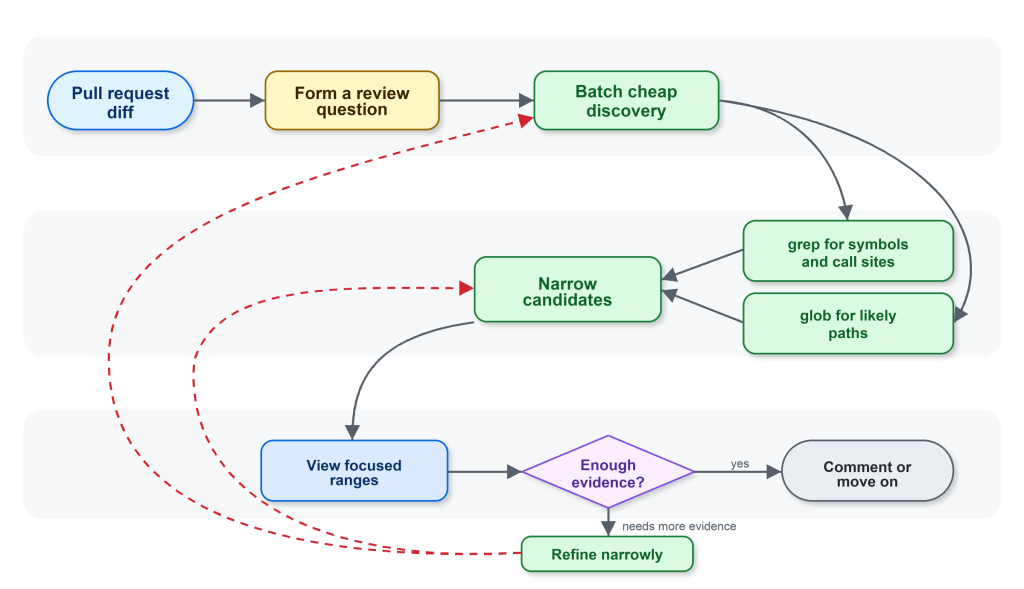
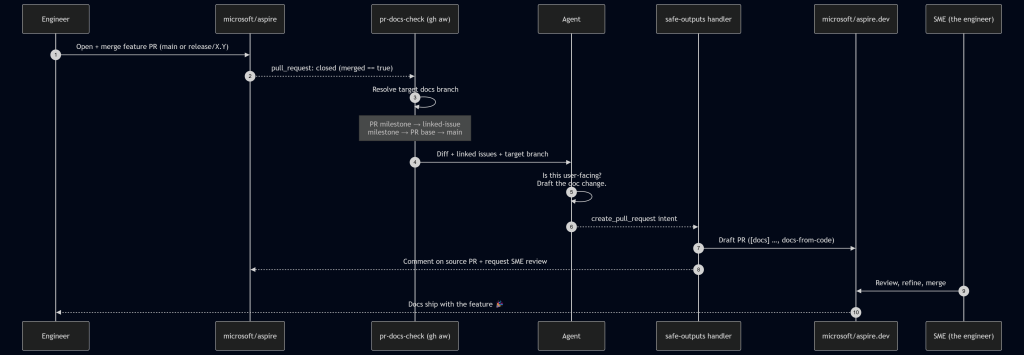
 .
.