Post Syndicated from Steve Phillips original https://aws.amazon.com/blogs/big-data/ai-powered-performance-recommendations-for-amazon-redshift/
Data platform teams running Amazon Redshift collect performance telemetry across system views like SYS_QUERY_HISTORY, SVV_TABLE_INFO, and SVV_ALTER_TABLE_RECOMMENDATIONS, plus Amazon CloudWatch metrics for capacity, query execution, and storage. The challenge is interpretation. Correlating a spike in QueryRuntimeBreakdown commit time with hundreds of small INSERT statements, or connecting high disk spill with undersized compute, takes deep expertise and hours of manual analysis.
In this post, you learn how to build an AI-powered solution that collects the telemetry, pre-computes performance signals, correlates them with CloudWatch, and uses Amazon Bedrock to generate prioritized recommendations. The source code is in the accompanying GitHub repository: sample-ai-performance-advisor-for-amazon-redshift.
The signal-based design is what makes this solution produce precise recommendations rather than generic advice. Instead of dumping raw system view output into the large language model (LLM) prompt, the collector pre-computes boolean and threshold-based findings, pairs them with CloudWatch correlations, and hands the model a structured context. The model then cross-references specific query IDs, table names, and metric values in its output.
Solution overview
Two AWS Lambda functions run on a 24-hour Amazon EventBridge schedule:
- The collector Lambda runs 13 diagnostic SQL queries against Amazon Redshift Serverless and reads the workgroup’s Workload Management (WLM) configuration. It also collects CloudWatch metrics across capacity, query execution, WLM, connections, and storage. From these inputs, it computes the performance signals. Finally, it writes a telemetry JSON file to Amazon Simple Storage Service (Amazon S3).
- The analyzer Lambda reads the telemetry from Amazon S3, builds a structured prompt with inline CloudWatch-to-signal correlations. Using the correlations, the analyzer calls Amazon Bedrock (Anthropic Claude Sonnet 4.6), and writes the resulting recommendations JSON back to Amazon S3.
- An Amazon Simple Notification Service (Amazon SNS) topic sends an email summary of the top recommendations to subscribers.
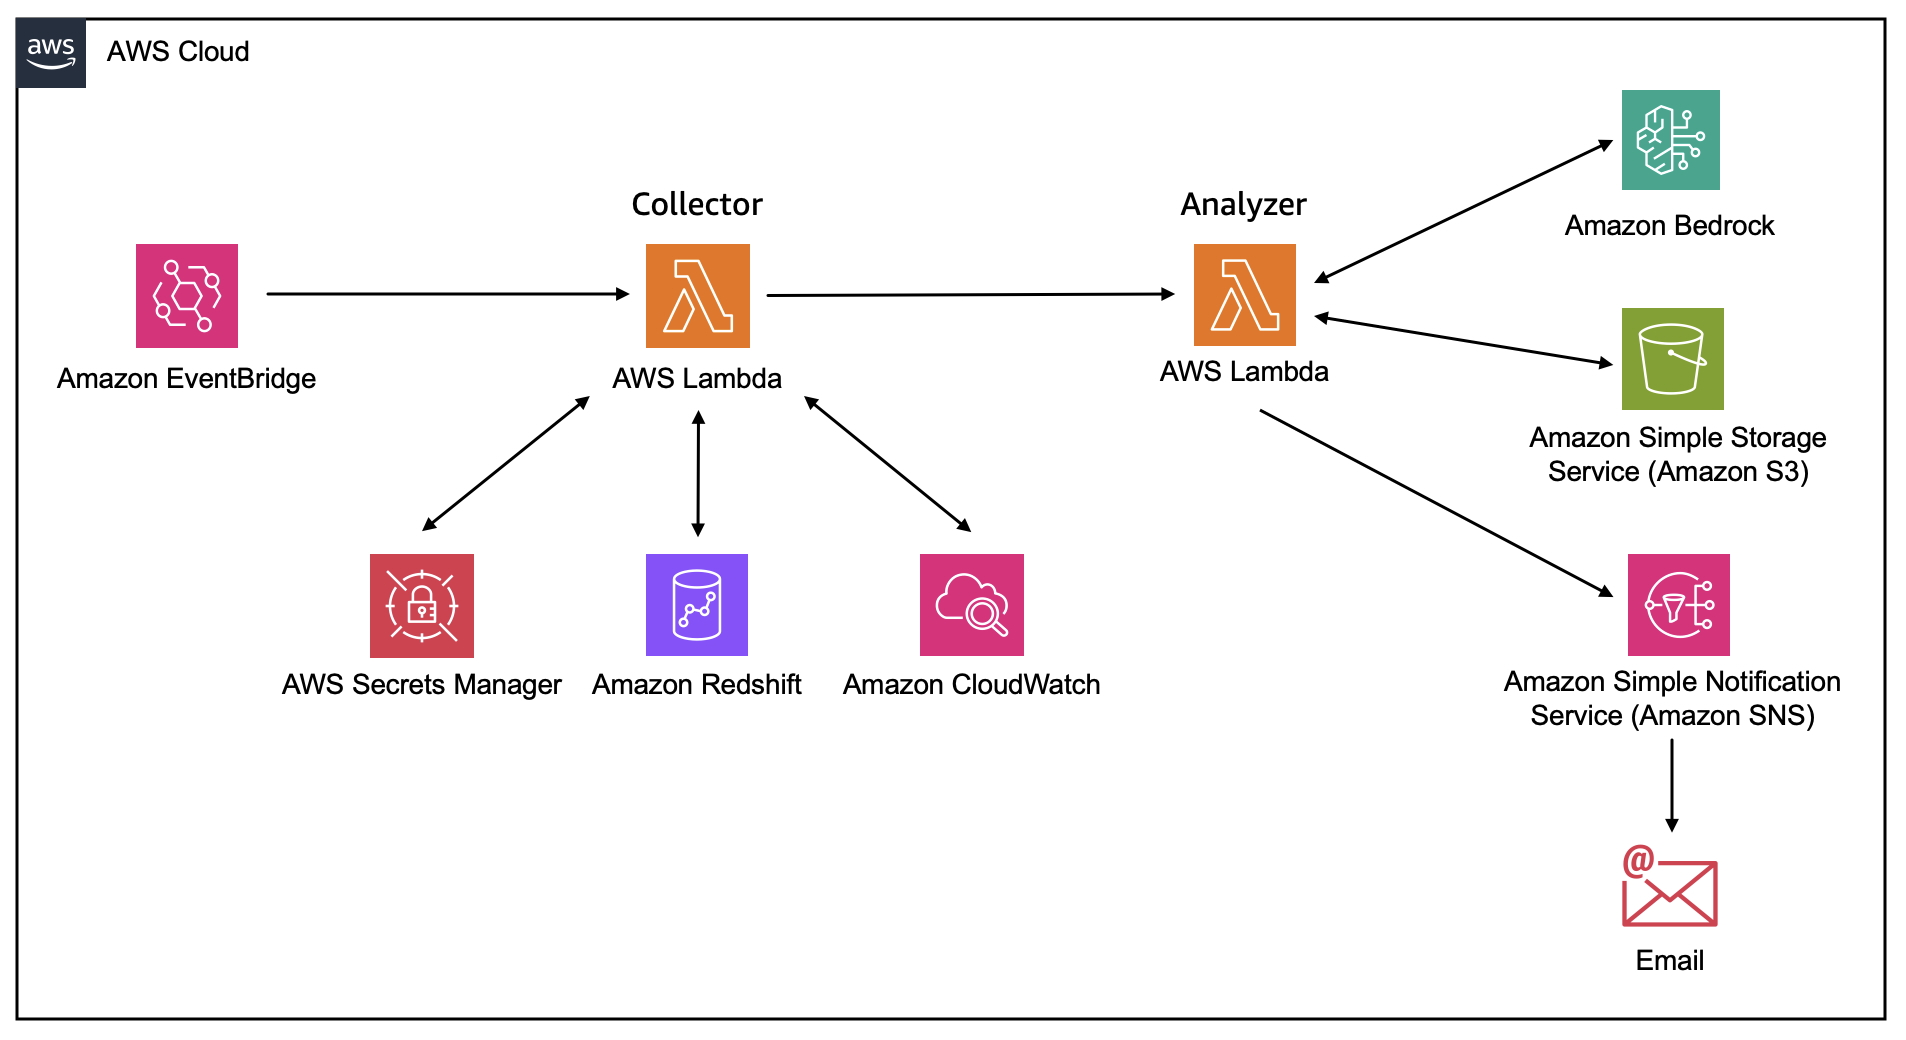
Figure 1 – Architecture diagram
Prerequisites
Before deploying the solution, make sure the following are in place.
- An Amazon Redshift Serverless workgroup with a database and query history.
- An Amazon Redshift database administrator user (superuser). The collector reads views that only a superuser can query (
SVV_TABLE_INFO,SVV_ALTER_TABLE_RECOMMENDATIONS,SVV_MV_INFO,SYS_SERVERLESS_USAGE,SYS_AUTO_TABLE_OPTIMIZATION).
Store the admin credentials in AWS Secrets Manager and pass the secret ARN to the collector.
Alternatively, have an existing superuser runALTER USER "IAMR:redshift-performance-recommendations-role" CREATEUSER;
once to grant the Lambda role superuser privileges. - Amazon Bedrock model access for the model of choice. For this solution, a
us.anthropic.claude-*model is recommended for multi-region inference. The solution doesn’t depend on a single model. - The AWS Command Line Interface (AWS CLI) installed and configured, and a clone of the GitHub repository.
Create the supporting resources
You need an Amazon S3 bucket, an Amazon SNS topic, an AWS Secrets Manager secret, and an AWS Identity and Access Management (IAM) role before the Lambda functions can run.
Create the Amazon S3 bucket
The Amazon S3 bucket will host the output report.
- Open the Amazon S3 console and choose Create bucket.
- Enter a globally unique name (for example,
amzn-s3-demo-bucket), keep the default settings, and choose Create bucket.
The collector writes telemetry JSON under the telemetry/ prefix and the analyzer writes recommendations under the recommendations/ prefix.
Create the Amazon SNS topic and subscription
Use Amazon SNS to generate notifications once reports are created.
- Open the Amazon SNS console and choose Topics, Create topic.
- Select Standard, and enter the name
redshift-performance-recommendations. - Choose Create topic.
- On the topic detail page, choose Create subscription.
- Select Email as the protocol, enter your email address, and choose Create subscription.
- Open the confirmation email from AWS Notifications and choose Confirm subscription.
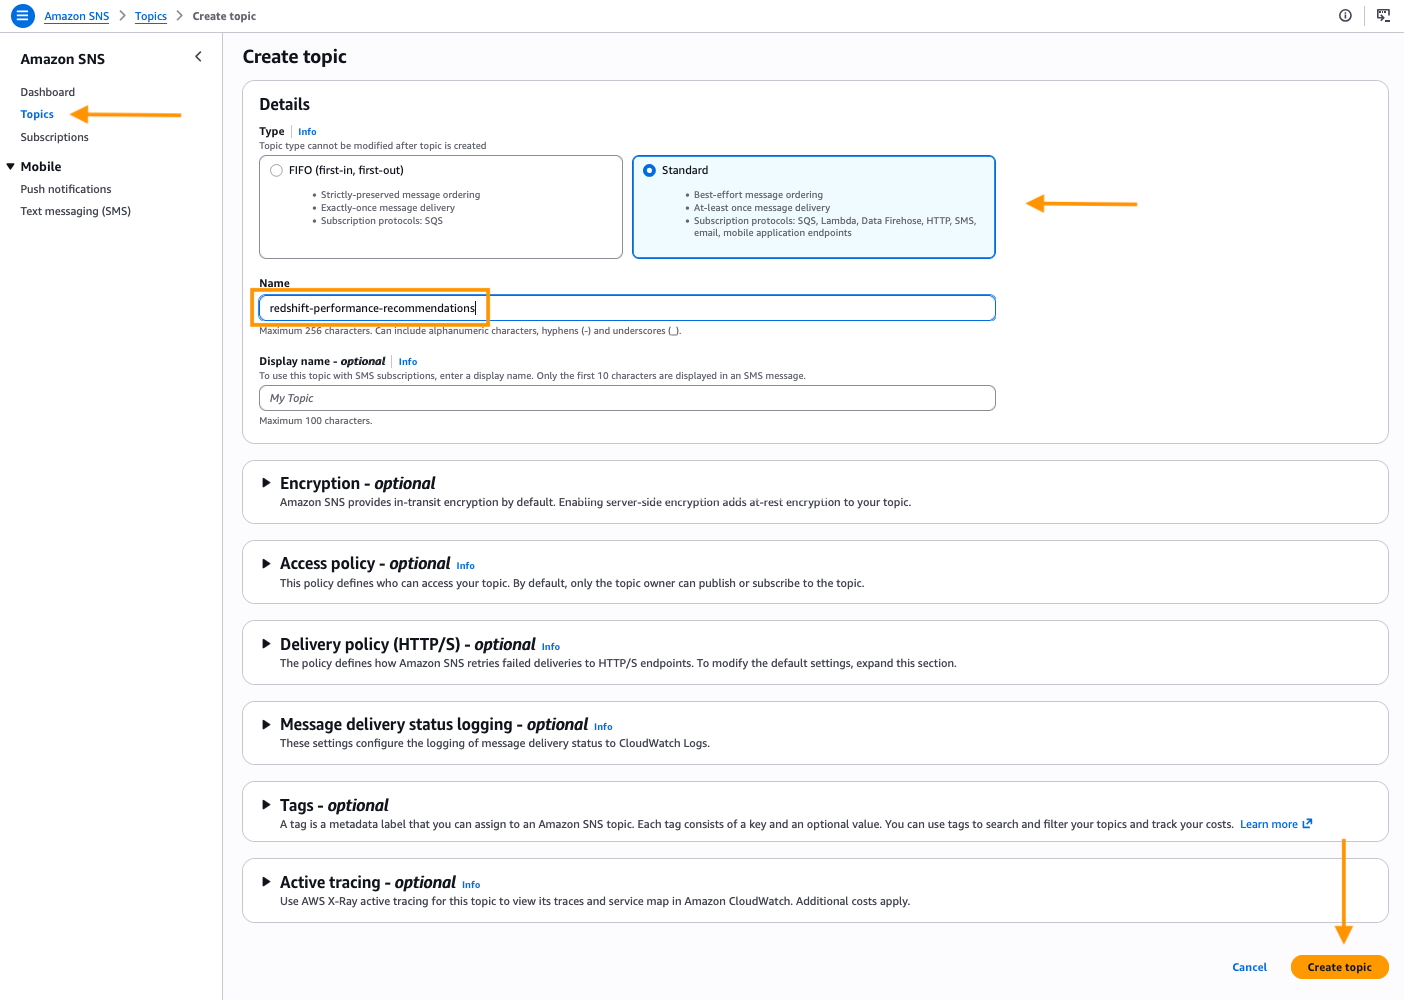
Figure 2 – Create SNS Topic
Store the admin credentials in AWS Secrets Manager
To avoid using hard-coded credentials, create an AWS Secrets Manager secret to connect to Amazon Redshift.
- Open the AWS Secrets Manager console and choose Store a new secret.
- Select Other type of secret, choose the Plaintext tab, and paste the following, replacing
<ADMIN_PASSWORD>with the workgroup’s admin password: - Choose Next, enter
redshift-performance-adminas the secret name, then choose Next, Next, and Store. - Copy the secret Amazon Resource Name (ARN) from the secret detail page. You pass it to the collector in a later step.
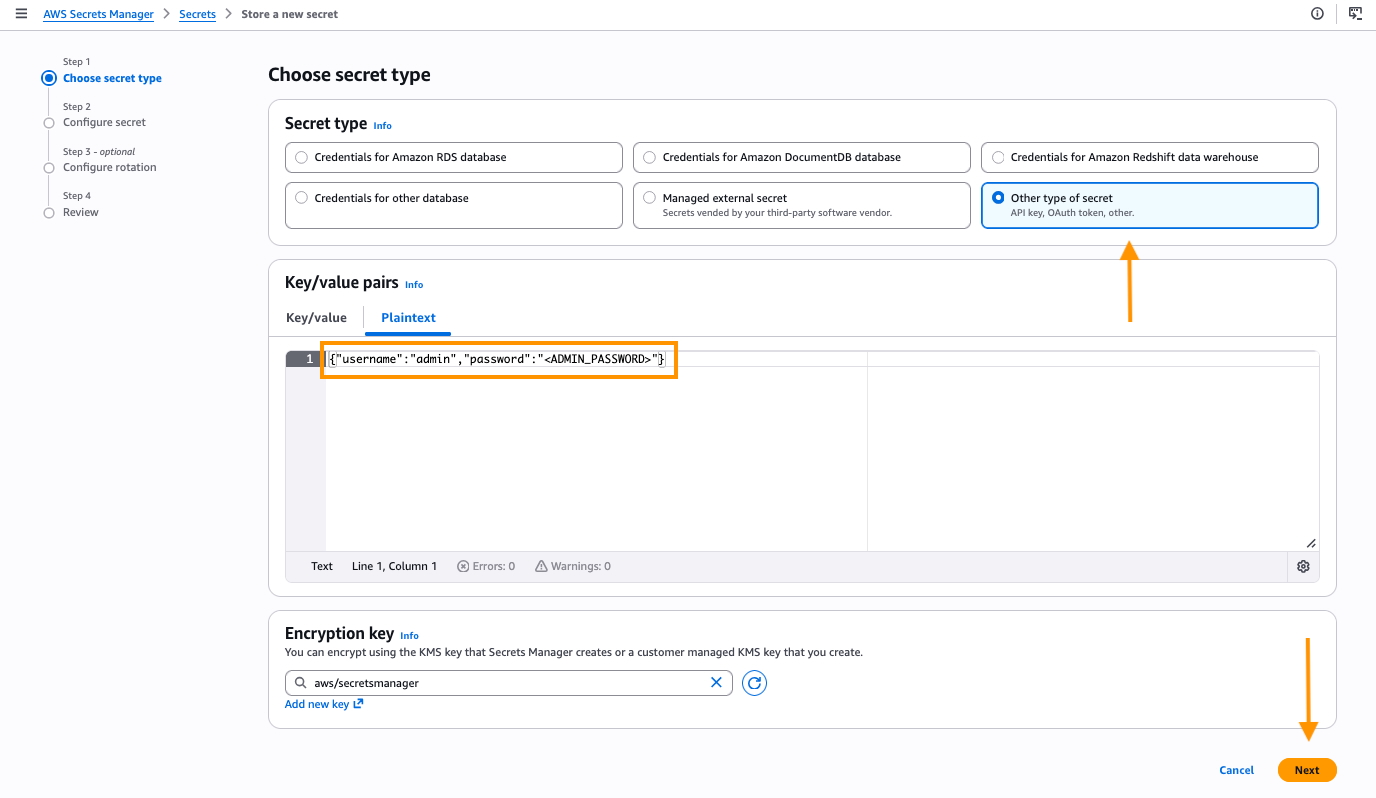
Figure 3 – Create secret
Create the IAM role and attach the policy
The repository includes a trust policy in iam/trust-policy.json (allowing lambda.amazonaws.com to assume the role) and the least-privilege permission policy in iam/lambda-role-policy.json. Replace the <ACCOUNT_ID>, <REGION>, <YOUR_BUCKET>, and SNS topic ARN placeholders in the permission policy with your values, then create the role in the AWS Management Console or with this AWS CLI command:
The permission policy grants the Amazon Redshift Data API, Amazon S3, Amazon SNS, Amazon Bedrock, AWS Lambda invoke, AWS Secrets Manager, and Amazon CloudWatch Logs permissions that both Lambda functions require.
Deploy the Lambda functions
The collector source is in lambda/collector.py and it loads the SQL files in sql/ at runtime. The deployment package must contain both.
Package the collector
Open a terminal or shell window and execute a command to copy the collector code, supporting SQL into a folder and archive.
Create the collector function
Using the AWS Management Console, navigate to AWS Lambda.
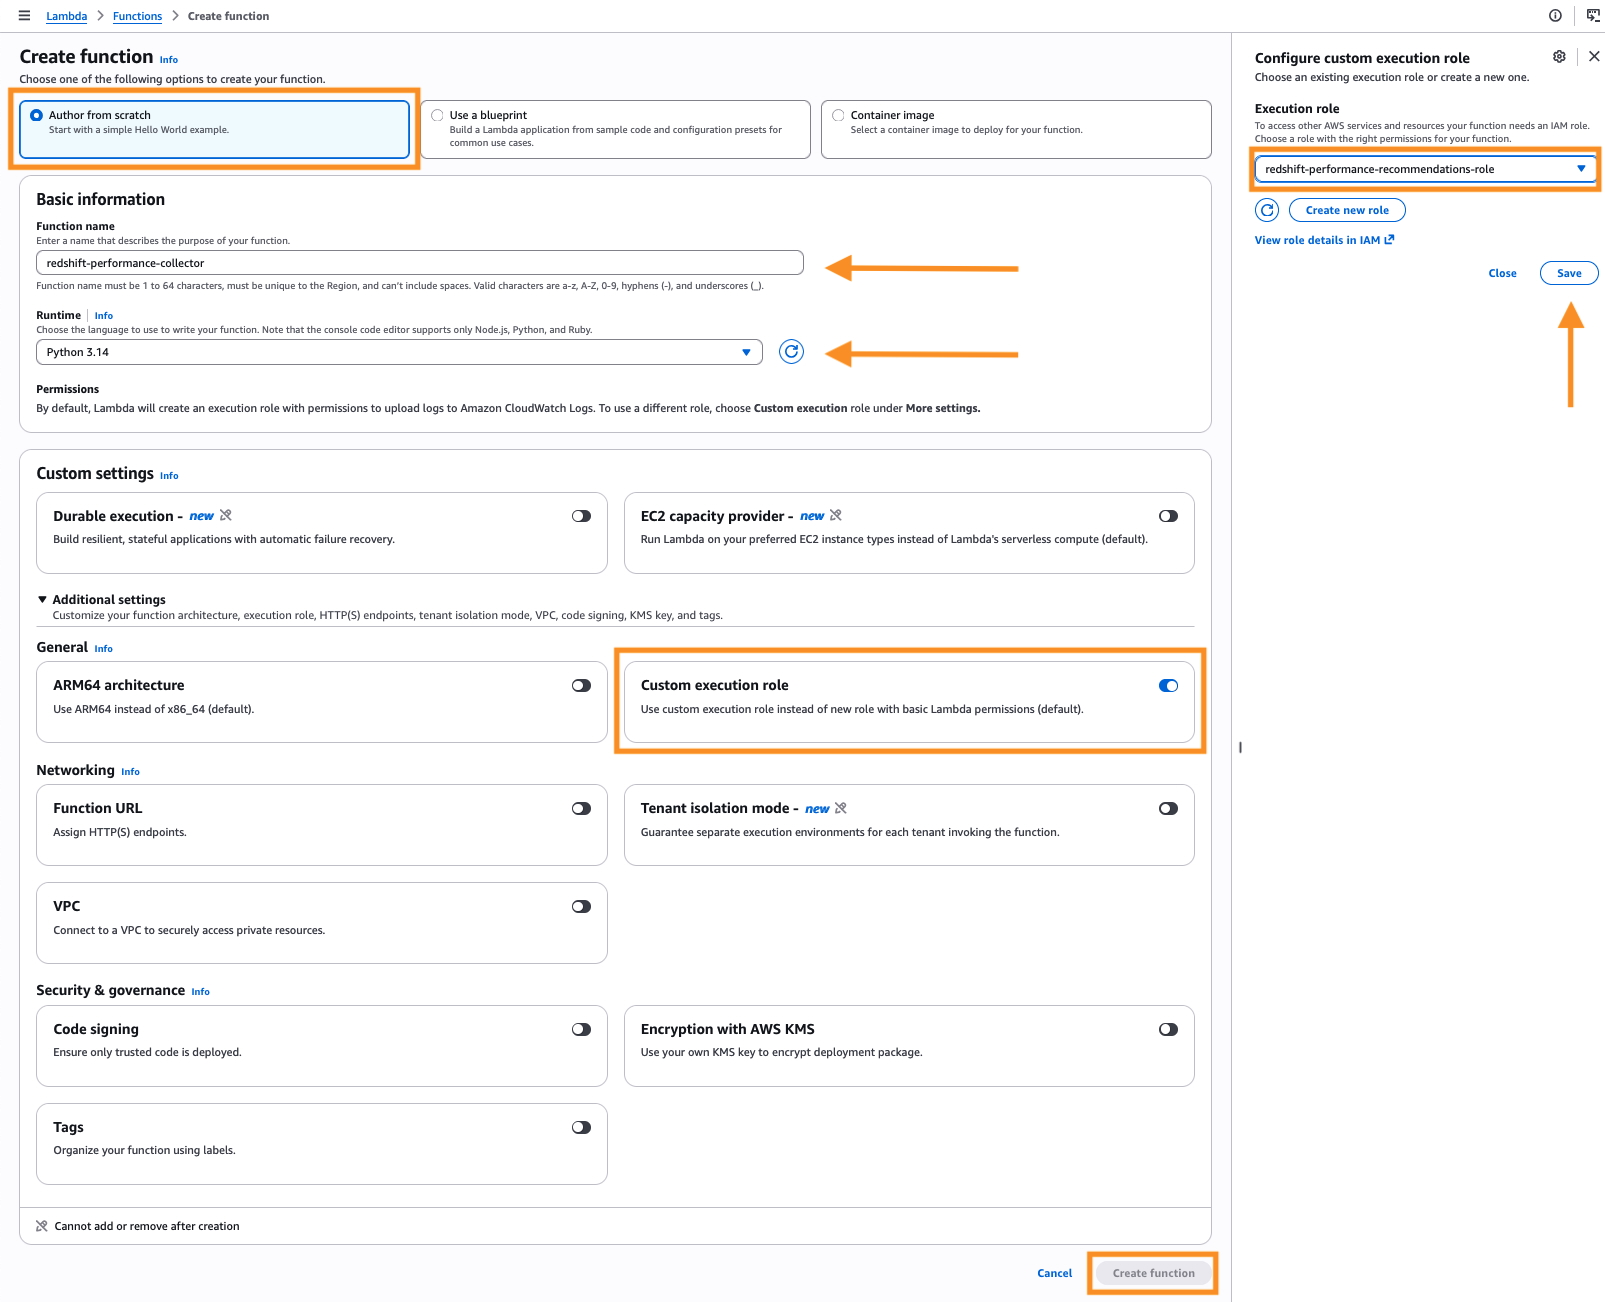
- Choose Create function.

Figure 4 – Create AWS Lambda function
- Select Author from scratch, enter
redshift-performance-collectoras the name, and select Python 3.14. - Expand Custom settings, toggle Custom execution role, choose an existing role, select
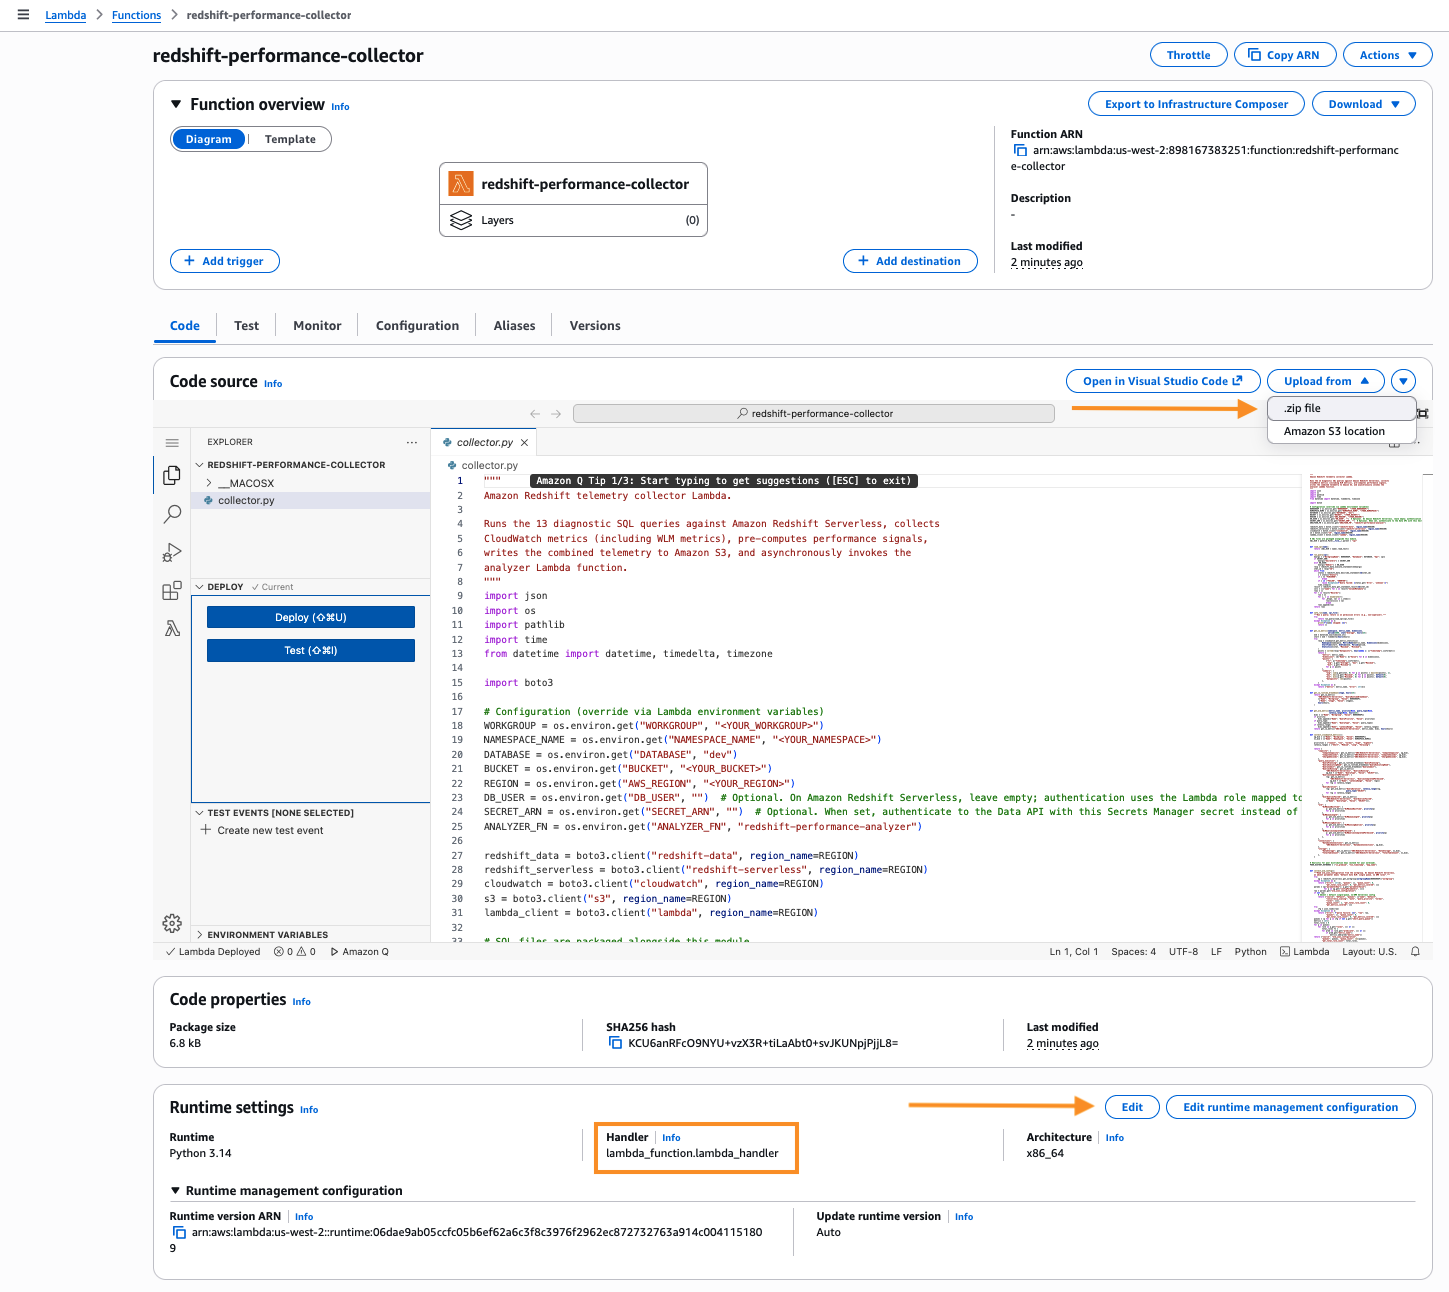
redshift-performance-recommendations-role, and choose Save. - On the function page, choose Upload from, .zip file, and upload
build/collector.zip. - In Runtime settings, select Edit, and set the Handler to
collector.lambda_handler.
Figure 5 – Set AWS Lambda handler
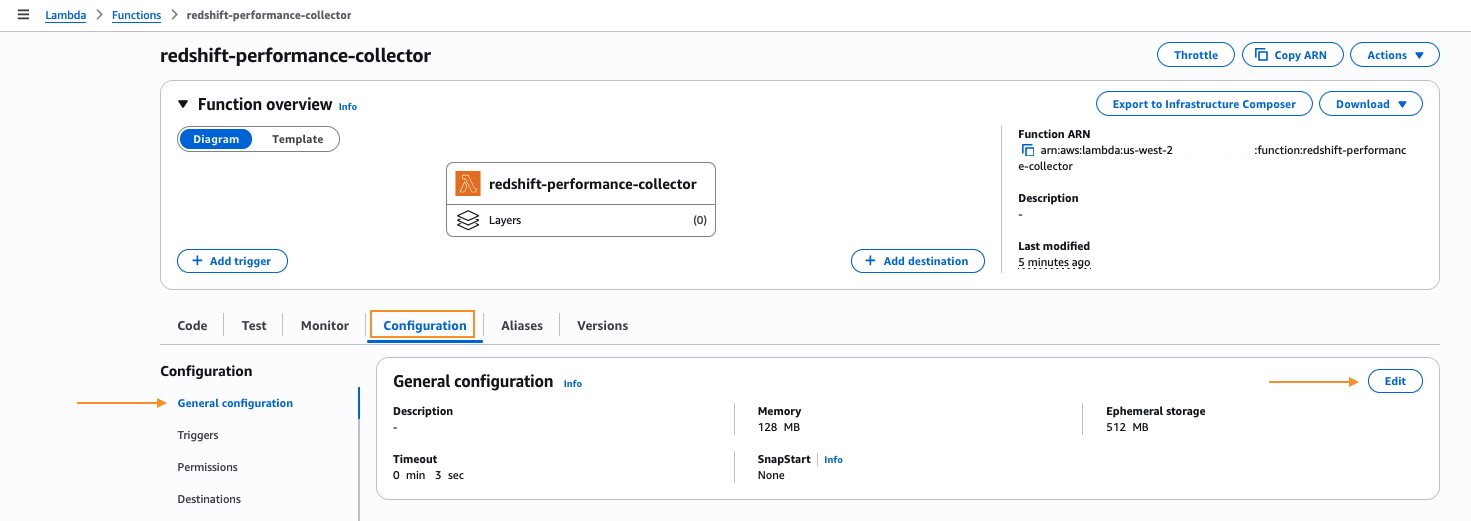
- Choose Configuration, Edit, set timeout to 5 minutes, and memory to 256 MB.

Figure 6 – Set AWS Lambda timeout and memory
- Under Configuration, select Environment variables, and add the following keys:
WORKGROUP: your Amazon Redshift Serverless workgroup name.NAMESPACE_NAME: the namespace the workgroup belongs to.DATABASE:dev(or your target database).BUCKET: the Amazon S3 bucket name you created earlier.SECRET_ARN: the AWS Secrets Manager secret ARN you copied earlier.ANALYZER_FN:redshift-performance-analyzer.
Package and create the analyzer
Repeat the same steps for the analyzer, using lambda/analyzer.py with a 15-minute timeout:
Use the Lambda console to create redshift-performance-analyzer with handler analyzer.lambda_handler, timeout 15 minutes, memory 256 MB, the same execution role, and these environment variables:
BUCKET: the same Amazon S3 bucket.SNS_TOPIC: the SNS topic ARN.MODEL_ID:us.anthropic.claude-sonnet-4-6.
The analyzer creates the Amazon Bedrock client with read_timeout=600 and max_tokens=16384 to handle large prompts and long responses. Anthropic Claude inference on a full telemetry payload typically takes 2–4 minutes.
How the signals and the prompt work
You don’t write any custom code for signal computation or prompt construction. Both computation and construction live in the repository.
The compute_signals() function in lambda/collector.py scans the telemetry for Boolean and threshold-based anti-patterns. At the table level, it looks for row skew, ghost rows, stale statistics, unsorted data, sub-optimal sort or distribution keys, and oversized VARCHAR columns. It also flags runtime and workload issues such as disk spill, small-insert bursts, high Data Definition Language (DDL) executions, and unoptimized COPY file size. Beyond that, it catches Amazon Redshift Spectrum queries that fail to prune partitions and data sharing materialized views doing full refresh. It also flags WLM configurations that lack Query Monitoring Rules (QMR), such as limits on blocks spilled to disk and query execution time. The full set of signals and thresholds is defined inline in the function. To tune a threshold or add a custom signal, edit this function and redeploy.
The build_prompt() function in lambda/analyzer.py constructs the Amazon Bedrock prompt in four sections. The first section lists the triggered signals. The second adds CloudWatch metrics, annotated with >> CORRELATION lines that pair each signal with its supporting metric. The third includes the filtered supporting data, limited to the table and query rows that triggered a signal. The fourth gives explicit instructions to return a pipe delimited text where every recommendation references specific table names, query IDs, and metric values. This structure is why the model produces targeted output rather than generic best-practice advice.
Schedule daily runs
Use the Amazon EventBridge console to trigger the collector every 24 hours.
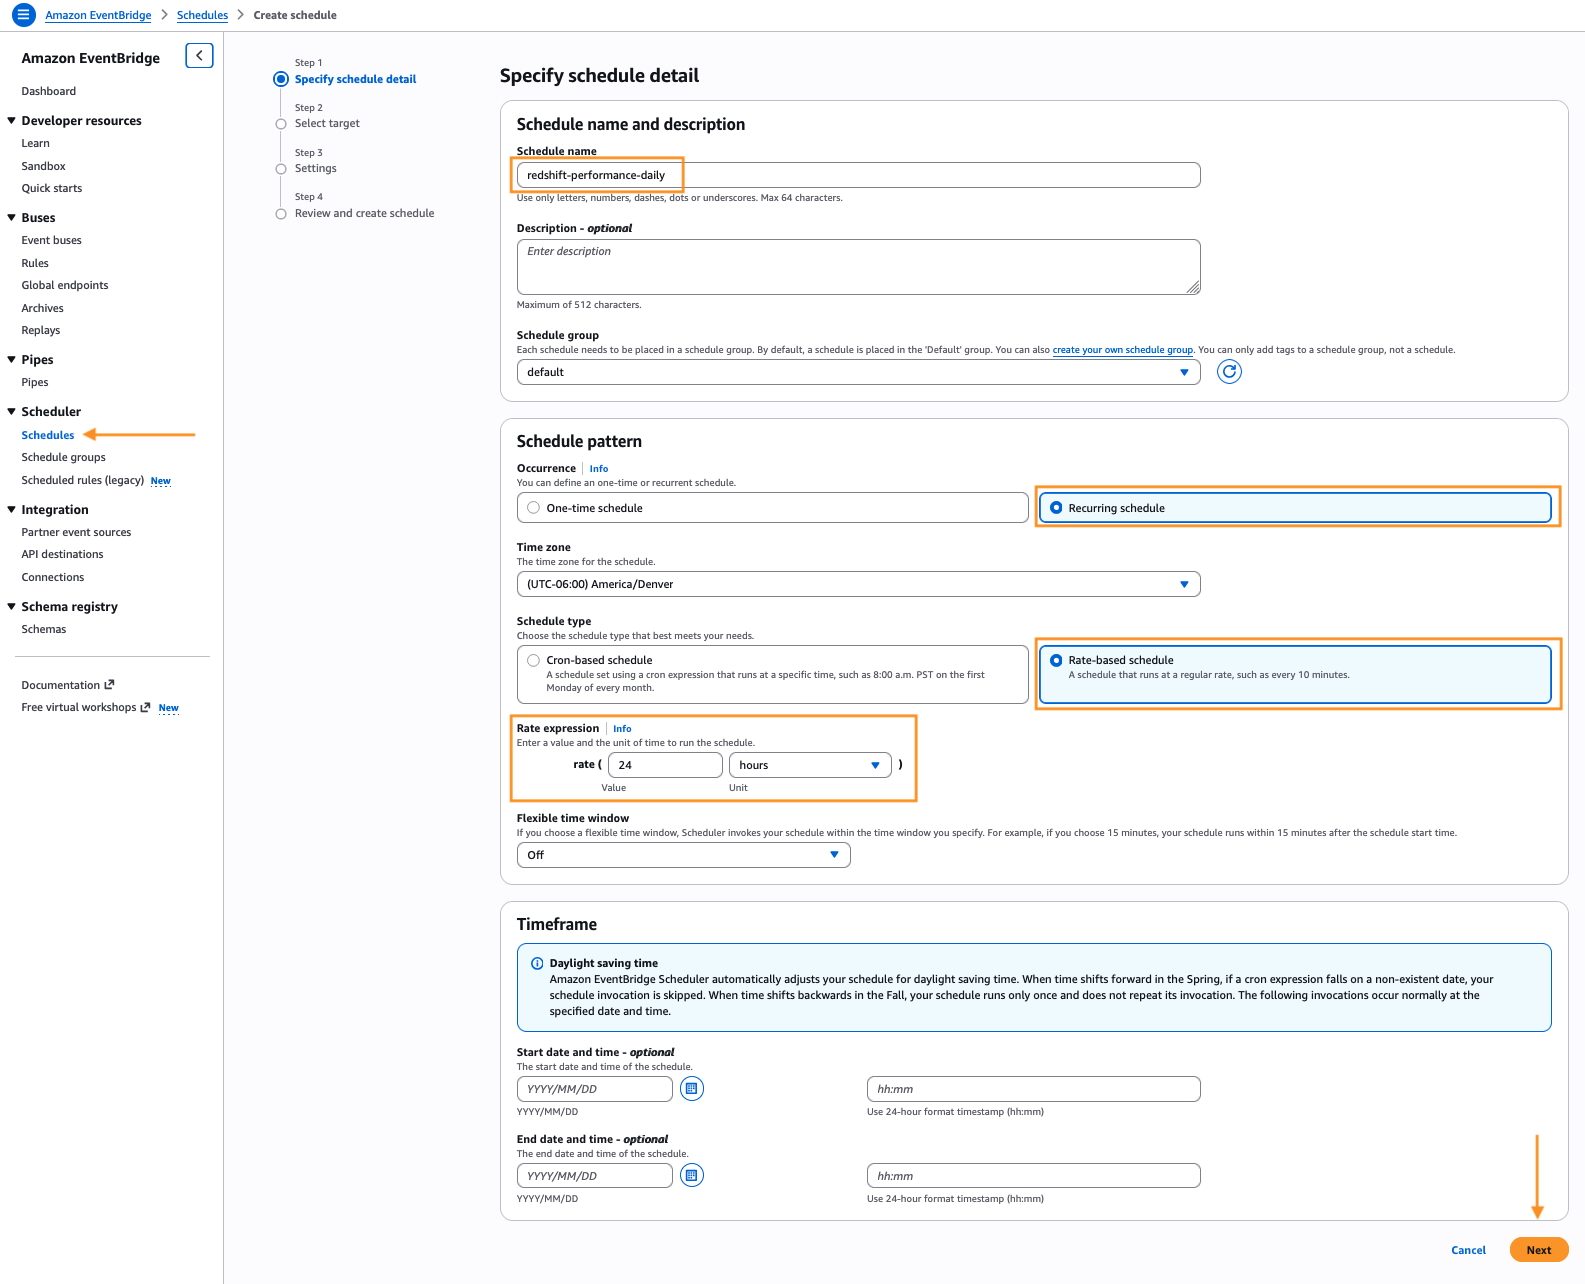
- Open the EventBridge console and choose Schedules under Scheduler, Create schedule.
- Enter the name
redshift-performance-dailyfor Schedule name, toggle Recurring schedule and Rate-based schedule. - Under Rate expression, enter 24 and select hours.
- For Flexible time window, choose Off, and select Next.

Figure 7 – Create Amazon EventBridge schedule
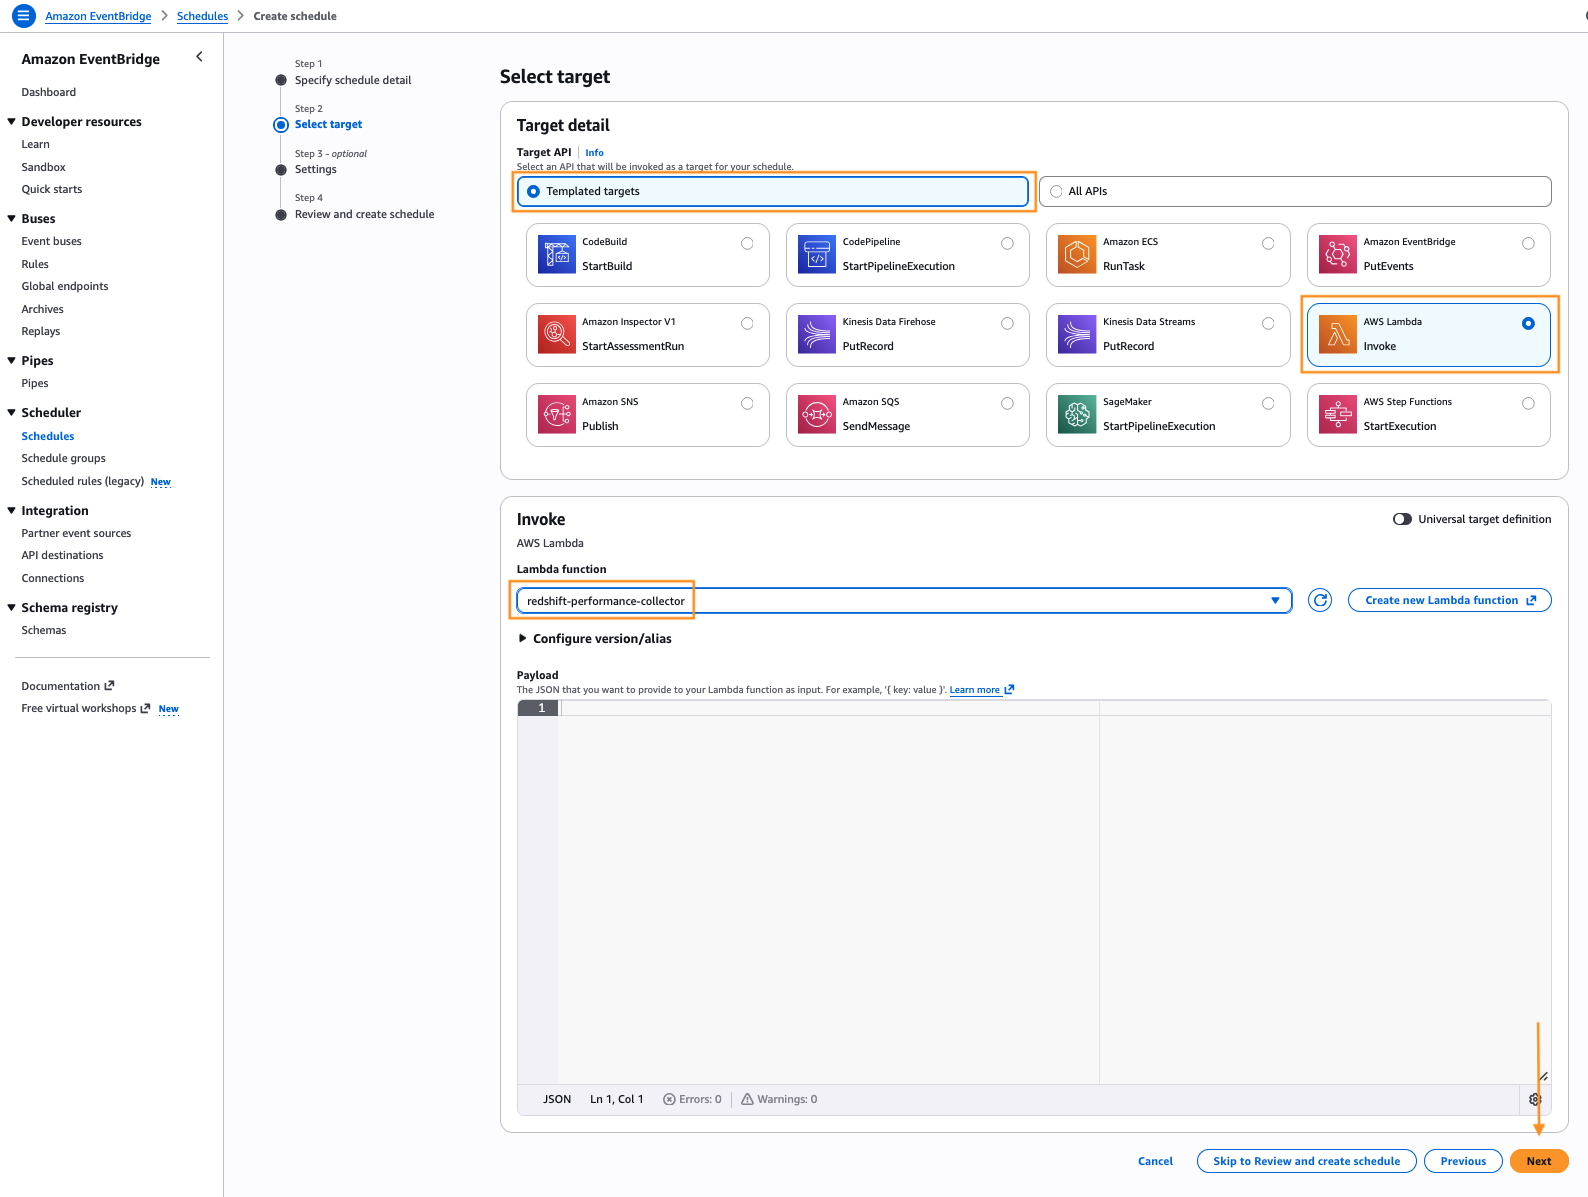
- On the Select target page, choose AWS Lambda, select the
redshift-performance-collectorfunction, and choose Next.
Figure 8 – Select Amazon EventBridge schedule target
- Accept the defaults for Settings and select Next. EventBridge automatically adds a resource-based permission on the Lambda function so the rule can invoke it.
- Choose Create schedule.
Run it once and review the output
Invoke the collector manually to confirm the pipeline works end-to-end.
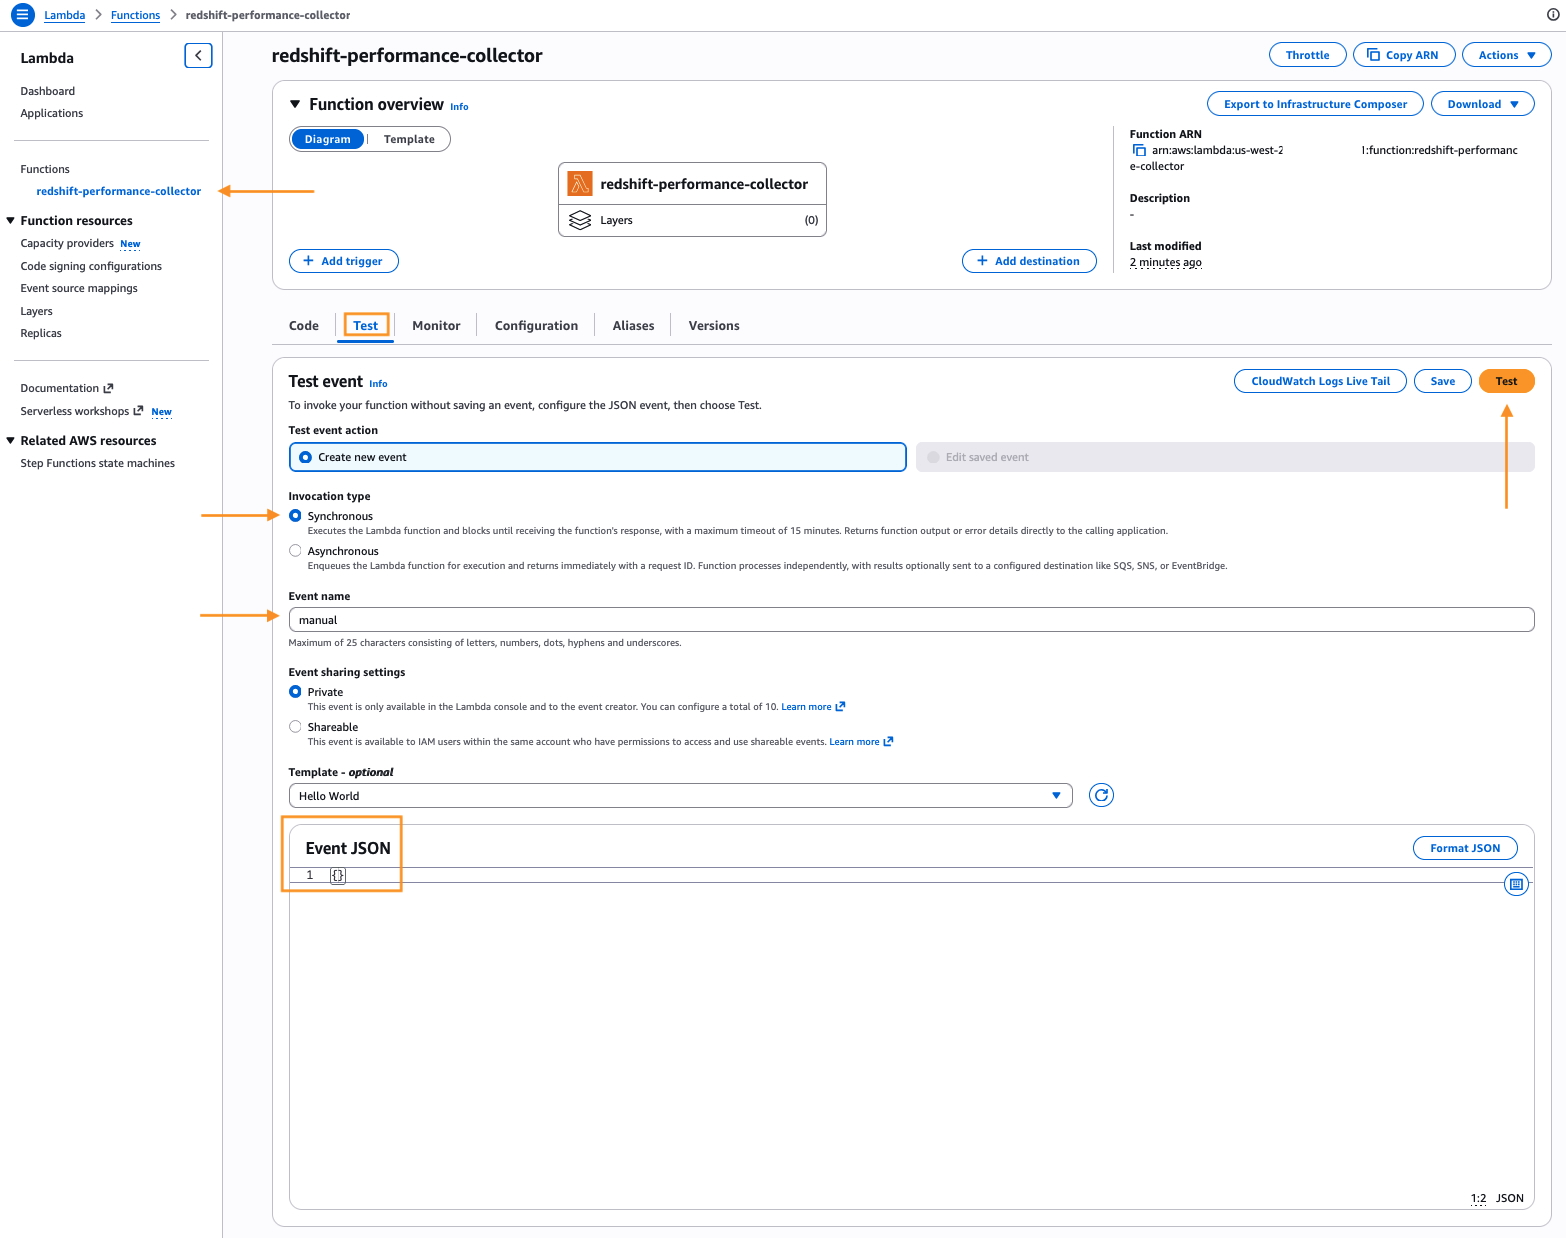
- In the Lambda console, open the
redshift-performance-collectorfunction and choose Test. Create a test event namedmanualwith the body{}and choose Test.
Figure 9 – Test end-to-end workflow
- The function completes in under a minute. Check the Monitor tab for the invocation log via the CloudWatch live logs link.
- In the Amazon S3 console, open your bucket. Confirm that the
telemetry/prefix contains a JSON file with the current timestamp. - Within 2–4 minutes, the analyzer publishes a message to the SNS topic. Check the email address you subscribed for the summary with the top 10 recommendations. Confirm that the
recommendations/prefix in Amazon S3 contains the full JSON.
Each recommendation has a priority (critical, high, medium, low) and a category (query_optimization, table_design, capacity, wlm, maintenance, or ingestion). It also includes a signal_source that names the signals and CloudWatch metrics that triggered it, a plain-language explanation, a specific SQL or configuration action, and an expected impact estimate.
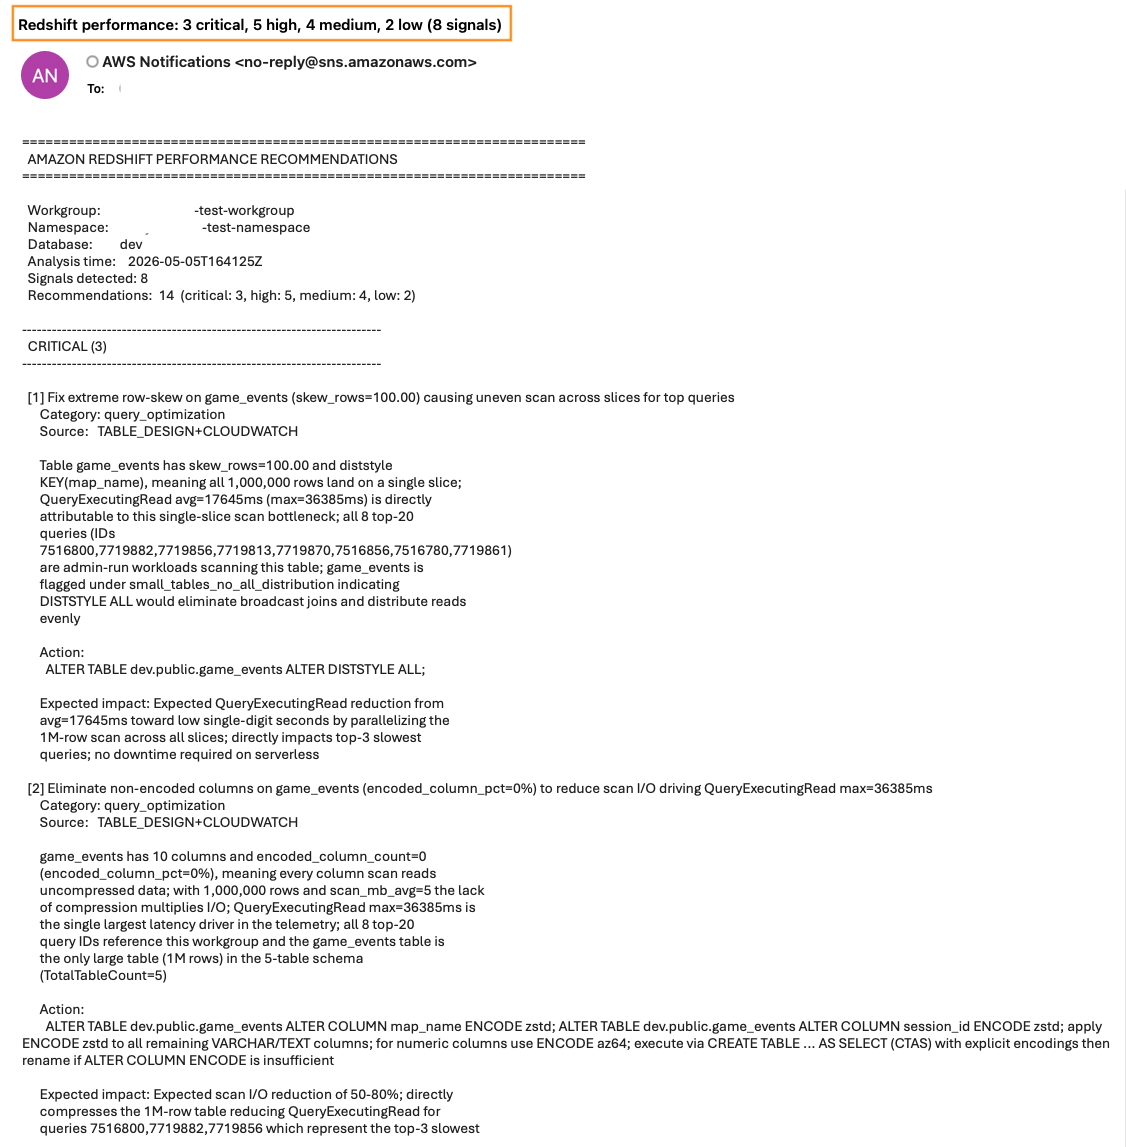
Figure 10 – Sample analyzer emailed output
Best practices
- Tune thresholds to your workload. The default thresholds in
compute_signals()come from the Amazon Redshift operational review playbook. For high-velocity ingestion or small-cluster environments, consider lowering the small-insert threshold, widening the stale-statistics window, or adding custom signals for your own tables. - Keep the signal-to-metric correlations current. When you add a signal, also add a matching correlation in
build_correlations(). The inline>> CORRELATIONlines are what make the model connect an infrastructure metric to an application-level symptom. - Review recommendations before you act. The analyzer produces prioritized suggestions, but
VACUUM,ANALYZE, andALTER TABLEactions change table state. Read the explanation and action on each recommendation, validate the SQL against your schema, and run it during a maintenance window.
Cleaning up
To avoid ongoing charges, delete the resources you created for this solution:
- The two AWS Lambda functions:
redshift-performance-collectorandredshift-performance-analyzer. - The Amazon EventBridge rule:
redshift-performance-daily. - The Amazon SNS topic and its email subscription:
redshift-performance-recommendations. - The Amazon S3 bucket, including the
telemetry/andrecommendations/objects. - The AWS Secrets Manager secret:
redshift-performance-admin. - The IAM role and its inline policy:
redshift-performance-recommendations-role.
Conclusion
You now have a daily performance review for Amazon Redshift Serverless that runs entirely on AWS Lambda, stores every run in Amazon S3, and delivers prioritized recommendations by email. The signal-based prompt pattern keeps the Amazon Bedrock cost low and the recommendations specific to your workload.
To learn more, see the following resources:
- Source code: sample-ai-performance-advisor-for-amazon-redshift on the GitHub website.
- Amazon Redshift system tables and views.
- Amazon Bedrock User Guide.
- Monitoring Amazon Redshift Serverless with Amazon CloudWatch.