Post Syndicated from Senthil Kamala Rathinam original https://aws.amazon.com/blogs/big-data/automate-and-orchestrate-amazon-emr-jobs-using-aws-step-functions-and-amazon-eventbridge/
Many enterprises are adopting Apache Spark for scalable data processing tasks such as extract, transform, and load (ETL), batch analytics, and data enrichment. As data pipelines evolve, the need for flexible and cost-efficient execution environments that support automation, governance, and performance at scale also evolve in parallel. Amazon EMR provides a powerful environment to run Spark workloads, and depending on workload characteristics and compliance requirements, teams can choose between fully managed options like Amazon EMR Serverless or more customizable configurations using Amazon EMR on Amazon Elastic Compute Cloud (Amazon EC2).
In use cases where infrastructure control, data locality, or strict security postures are essential, such as in financial services, healthcare, or government, running transient EMR on EC2 clusters becomes a preferred choice. However, orchestrating the full lifecycle of these clusters, from provisioning to job submission and eventual teardown, can introduce operational overhead and risk if done manually.
To streamline this process, the AWS Cloud offers built-in orchestration capabilities using AWS Step Functions and Amazon EventBridge. Together, these services help you automate and schedule the entire EMR job lifecycle, reducing manual intervention while optimizing cost and compliance. Step Functions provides the workflow logic to manage cluster creation, Spark job execution, and cluster termination, and EventBridge schedules these workflows based on business or operational needs.
In this post, we discuss how to build a fully automated, scheduled Spark processing pipeline using Amazon EMR on EC2, orchestrated with Step Functions and triggered by EventBridge. We walk through how to deploy this solution using AWS CloudFormation, processes COVID-19 public dataset data in Amazon Simple Storage Service (Amazon S3), and store the aggregated results in Amazon S3. This architecture is ideal for periodic or scheduled batch processing scenarios where infrastructure control, auditability, and cost-efficiency are critical.
Solution overview
This solution uses the publicly available COVID-19 dataset to illustrate how to build a modular, scheduled architecture for scalable and cost-efficient batch processing for time-bound data workloads.The solution follows these steps:
- Raw COVID-19 data in CSV format is stored in an S3 input bucket.
- A scheduled rule in EventBridge triggers a Step Functions workflow.
- The Step Functions workflow provisions a transient Amazon EMR cluster using EC2 instances.
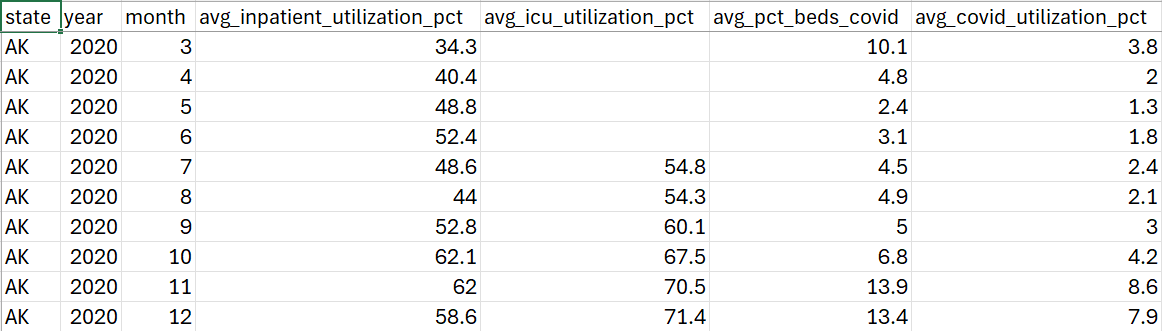
- A PySpark job is submitted to the cluster to calculate COVID-19 hospital utilization data to compute monthly state-level averages of inpatient and ICU bed utilization, and COVID-19 patient percentages.
- The processed results are written back to an S3 output bucket.
- After successful job completion, the EMR cluster is automatically deleted.
- Logs are persisted to Amazon S3 for observability and troubleshooting.
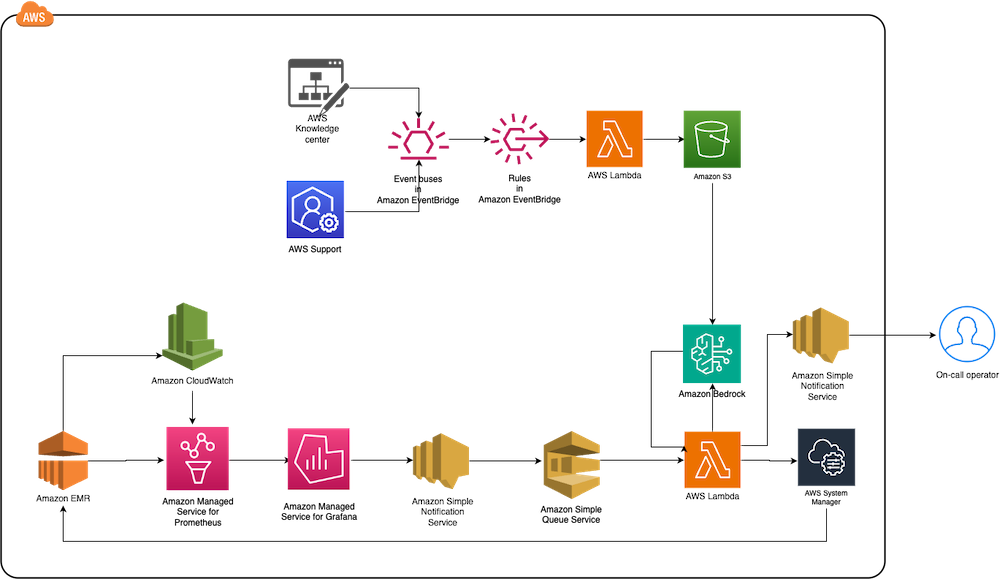
By automating this workflow, you alleviate the need to manually manage EMR clusters while gaining cost-efficiency by running compute only when needed. This architecture is ideal for periodic Spark jobs such as ETL pipelines, regulatory reporting, and batch analytics, especially when control, compliance, and customization are required.The following diagram illustrates the architecture for this use case.
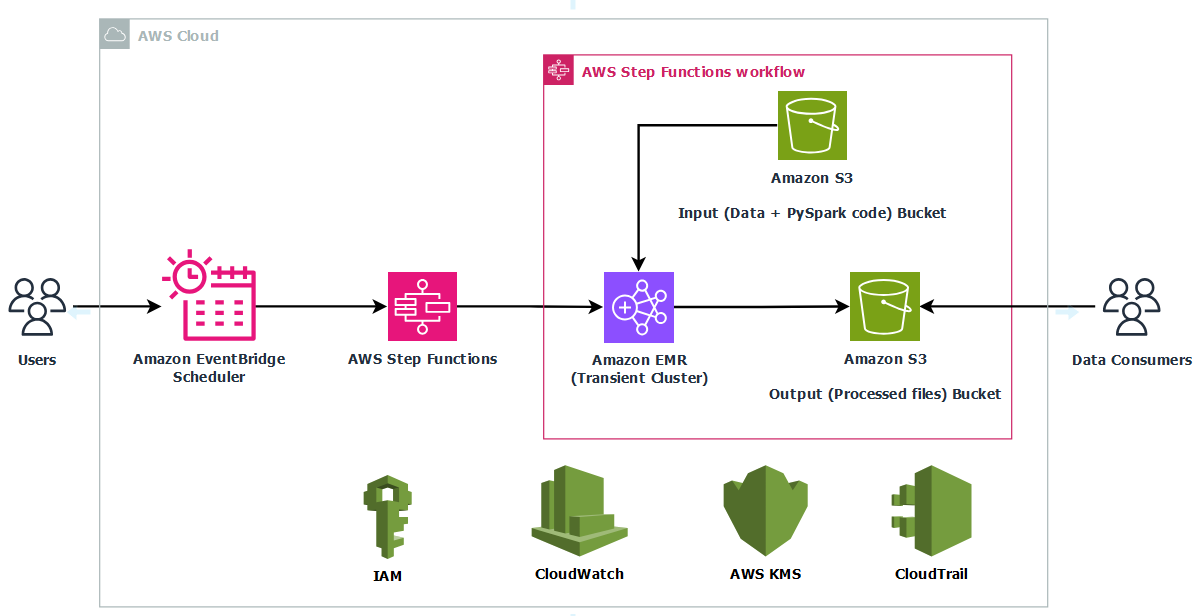
The infrastructure is deployed using AWS CloudFormation to provide consistency and repeatability. AWS Identity and Access Management (IAM) roles grant least‑privilege access to Step Functions, Amazon EMR, EC2 instances, and S3 buckets, and optional AWS Key Management Service (AWS KMS) encryption can secure data at rest in Amazon S3 and Amazon CloudWatch Logs. By combining a scheduled trigger, stateful orchestration, and centralized logging, this solution delivers a fully automated, cost‑optimized, and secure way to run transient Spark workloads in production.
Prerequisites
Before you get started, make sure you have the following prerequisites:
- An AWS account. If you don’t have one, you can sign up for one.
- An IAM user with administrator access. For instructions, see Create a user with administrative access.
- The AWS Command Line Interface (AWS CLI) is installed on your local machine
- A default virtual private cloud (VPC) and subnet in the target AWS Region where you plan to run the CloudFormation template.
Set up resources with AWS CloudFormation
To provision the required resources using a single CloudFormation template, complete the following steps:
- Sign in to the AWS Management Console as an admin user.
- Clone the sample repository to your local machine or AWS CloudShell and navigate into the project directory.
- Set an environment variable for the AWS Region where you plan to deploy the resources. Replace the placeholder with your Region code, for example,
us-east-1. - Deploy the stack using the following command. Update the stack name if needed. In this example, the stack is created with the name
covid19-analysis.
You can monitor the stack creation progress on the AWS CloudFormation console on the Events tab. The deployment typically completes in under 5 minutes.
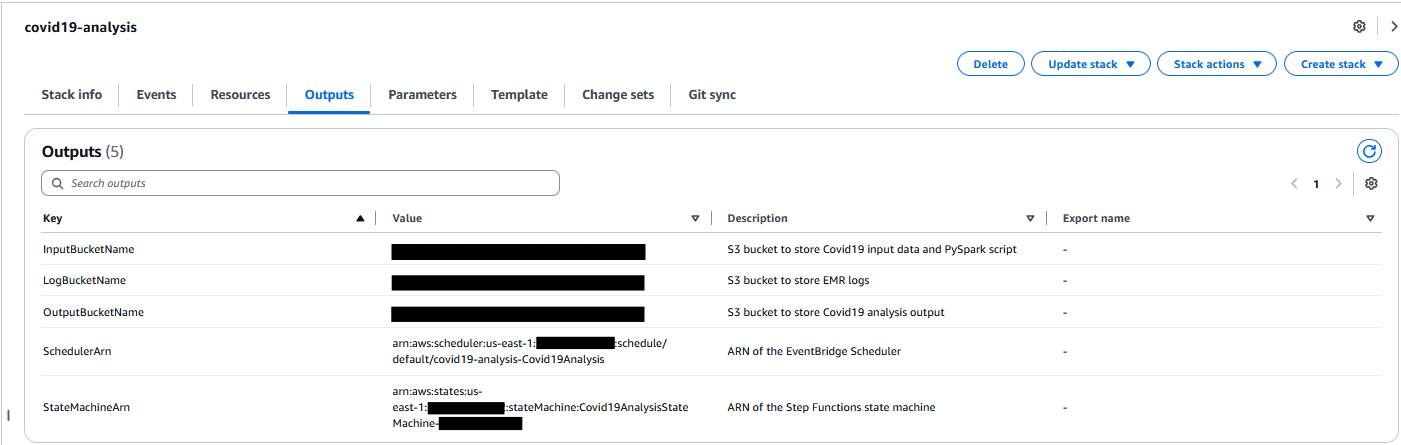
After the stack is successfully created, go to the Outputs tab on the AWS CloudFormation console and note the following values for use in later steps:
- InputBucketName
- OutputBucketName
- LogBucketName
Set up the COVID-19 dataset
With your infrastructure in place, complete the following steps to set up the input data:
- Download the COVID-19 data CSV file from HealthData.gov to your local machine.
- Rename the downloaded file to covid19-dataset.csv.
- Upload the renamed file to your S3 input bucket under the raw/ folder path.
Set up the PySpark Script
Complete the following steps to set up the PySpark script:
- Open AWS CloudShell from the console.
- Confirm that you are working inside the sample-emr-transient-cluster-step-functions-eventbridge directory before running the next command.
- Copy the PySpark script needed for this walkthrough into your input bucket:
This script processes COVID-19 hospital utilization data stored as CSV files in your S3 input bucket. When running the job, provide the following command-line arguments:
--input– The S3 path to the input CSV files--output– The S3 path to store the processed results
The script reads the raw dataset, standardizes various date formats, and filters out records with invalid or missing dates. It then extracts key utilization metrics such as inpatient bed usage, ICU bed usage, and the percentage of beds occupied by COVID-19 patients and calculates monthly averages grouped by state. The aggregated output is saved as timestamped CSV files in the specified S3 location.
This example demonstrates how you can use PySpark to efficiently clean, transform, and analyze large-scale healthcare data to gain actionable insights on hospital capacity trends during the pandemic.
Configure a schedule in EventBridge
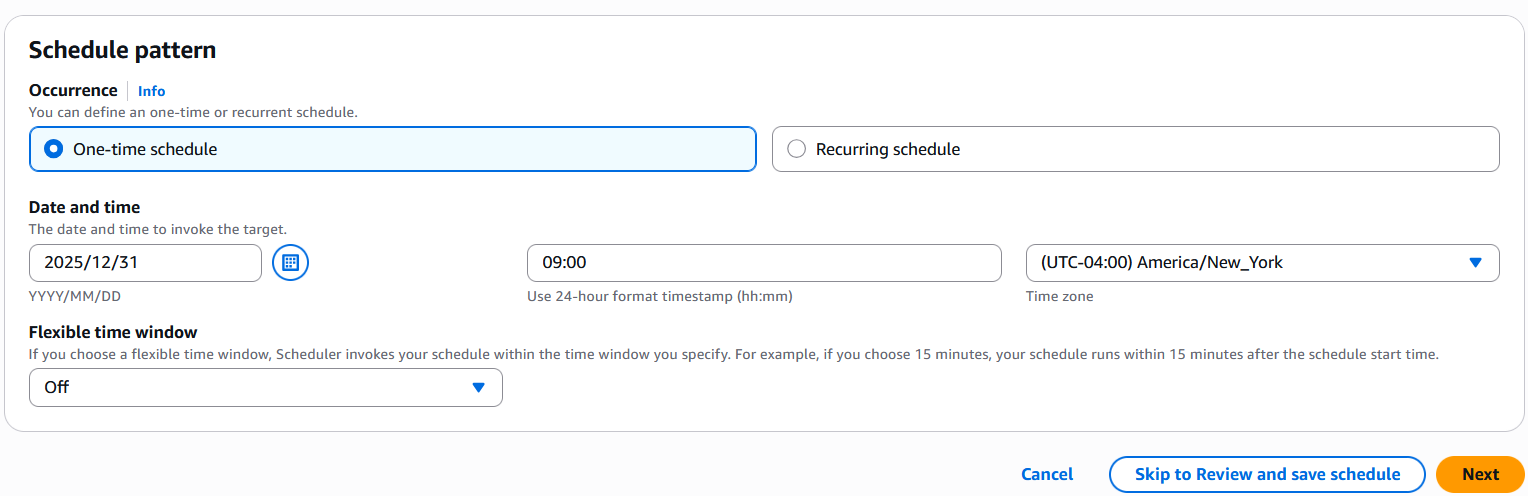
The Step Functions state machine is by default scheduled to run on December 31, 2025, as a one-time execution. You can update the schedule for recurring or one-time execution as needed. Complete the following steps:
- On the EventBridge console, choose Schedules under Scheduler in the navigation pane.
- Select the schedule named <StackName>-covid19-analysis and choose Edit.
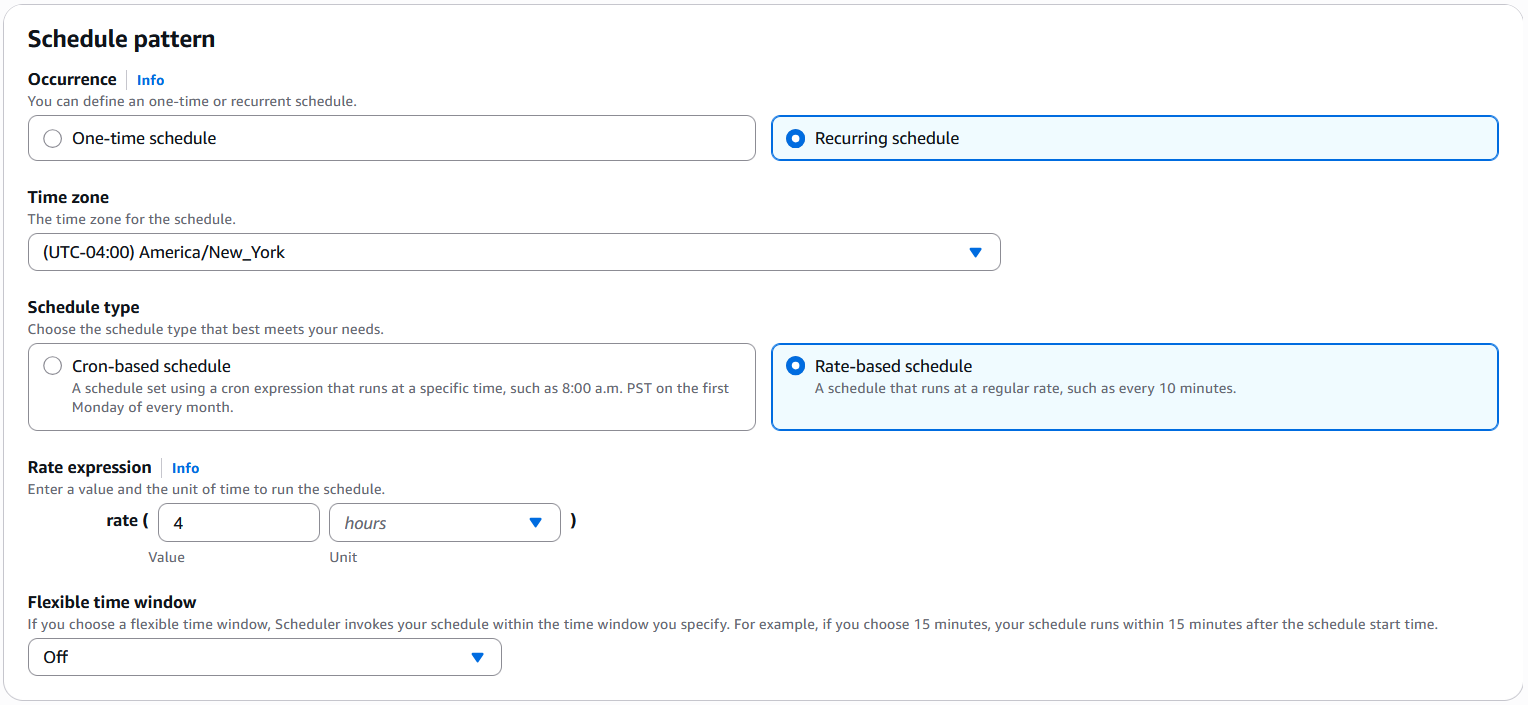
- Set your preferred schedule pattern.
- If you want to run the schedule one time, select One-time schedule for Occurrence and enter a date and time.

- If you want to run this on a recurring basis, select Recurring schedule. Specify the schedule type as either Cron-based schedule or Rate-based schedule as needed.

- If you want to run the schedule one time, select One-time schedule for Occurrence and enter a date and time.
- Choose Next twice and choose Save schedule.
Start the workflow in Step Functions
Based on your EventBridge schedule, the Step Functions workflow will run automatically. For this walkthrough, complete the following steps to trigger it manually:
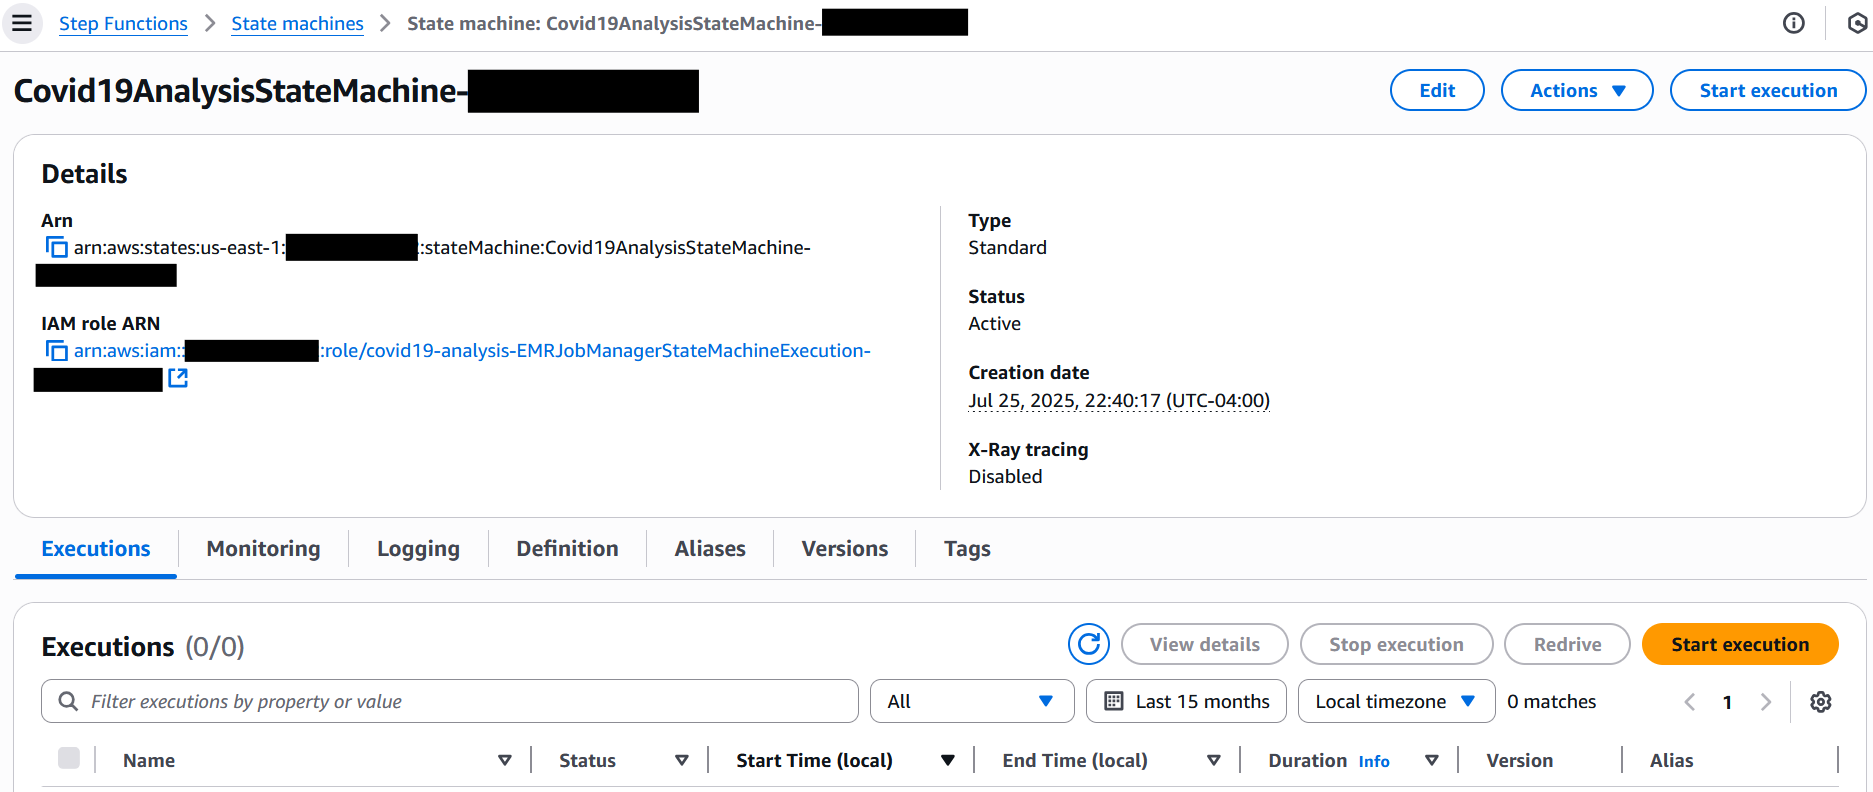
- On the Step Functions console, choose State machines in the navigation pane.
- Choose the state machine that begins with Covid19AnalysisStateMachine-*.
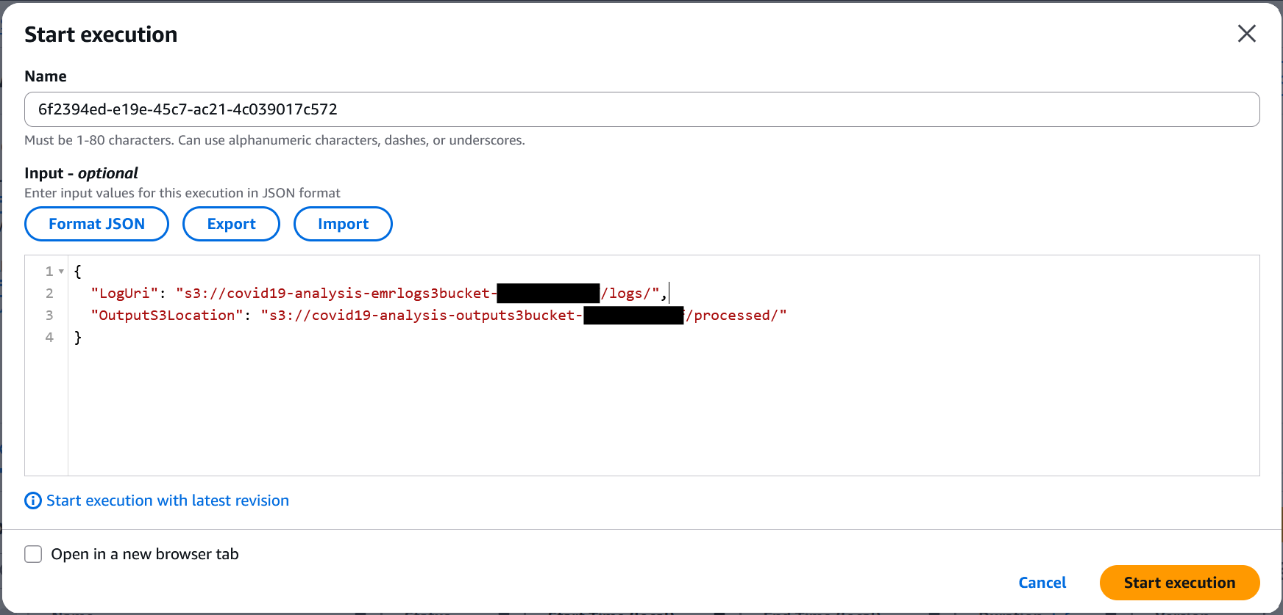
- Choose Start execution.

- In the Input section, provide the following JSON (provide the log bucket and output bucket names with the appropriate values captured earlier):
- Choose Start execution to initiate the workflow.

Monitor the EMR job and workflow execution
After you start the workflow, you can track both the Step Functions state transitions and the EMR job progress in real time on the console.
Monitor the Step Functions state machine
Complete the following steps to monitor the Step Functions state machine:
- On the Step Functions console, choose State machines in the navigation pane.
- Choose the state machine that begins with Covid19AnalysisStateMachine-*.
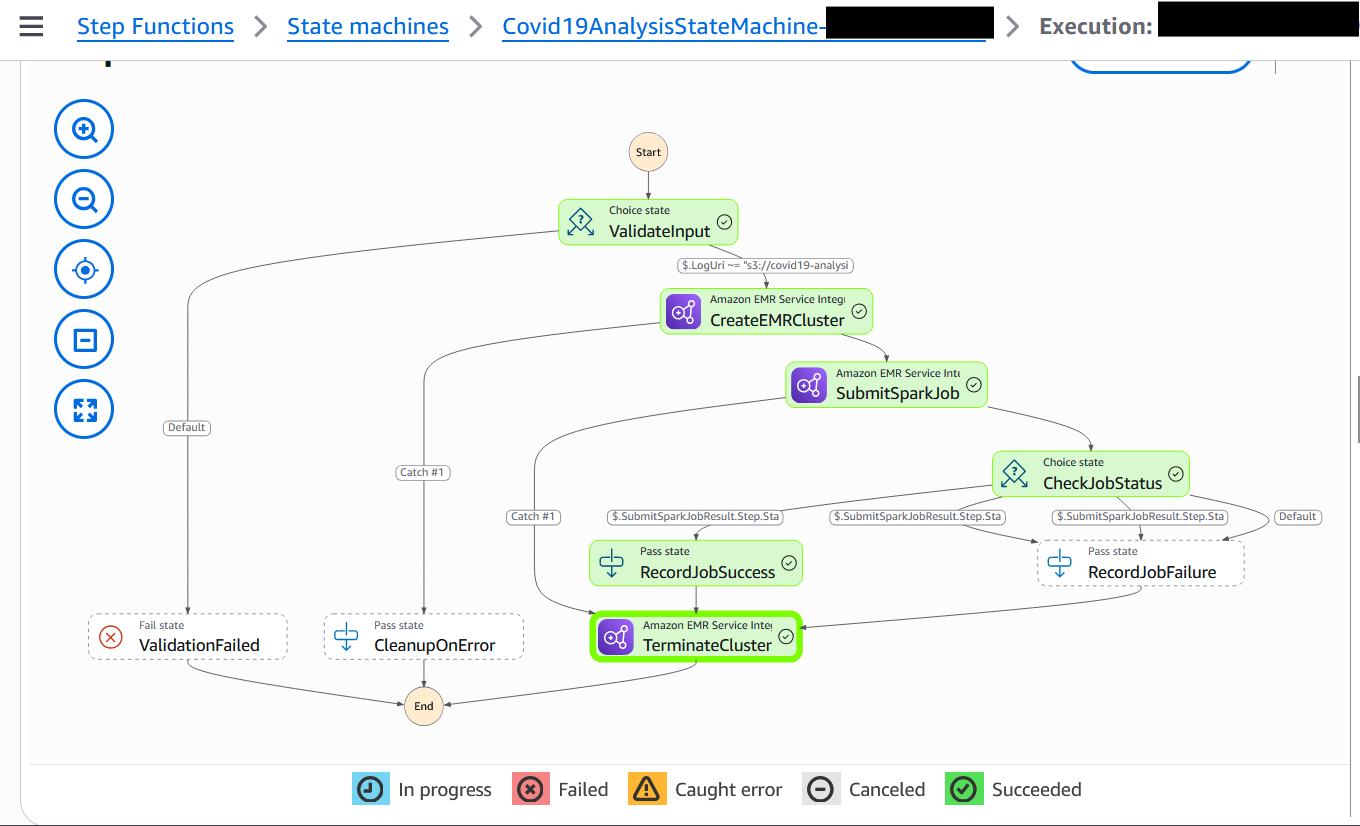
- Choose the running execution to view the visual workflow.
Each state node will update as it progresses—green for success, red for failure.
- To explore a step, choose its node and inspect the input, output, and error details in the side pane.
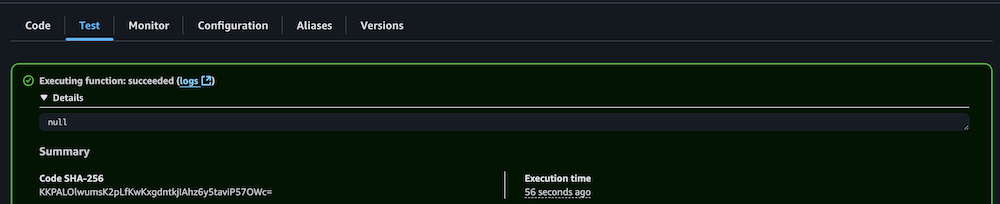
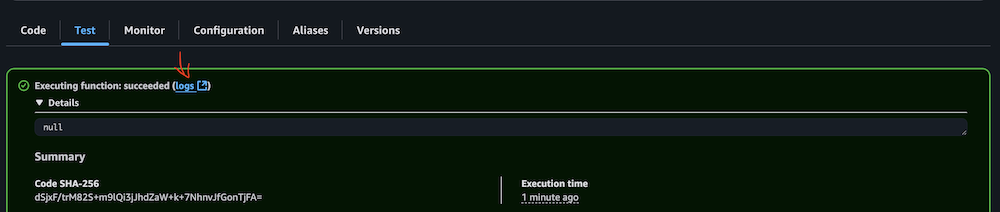
The following screenshot shows an example of a successfully executed workflow.
Monitor the EMR cluster and EMR step
Complete the following steps to monitor the EMR cluster and EMR step status:
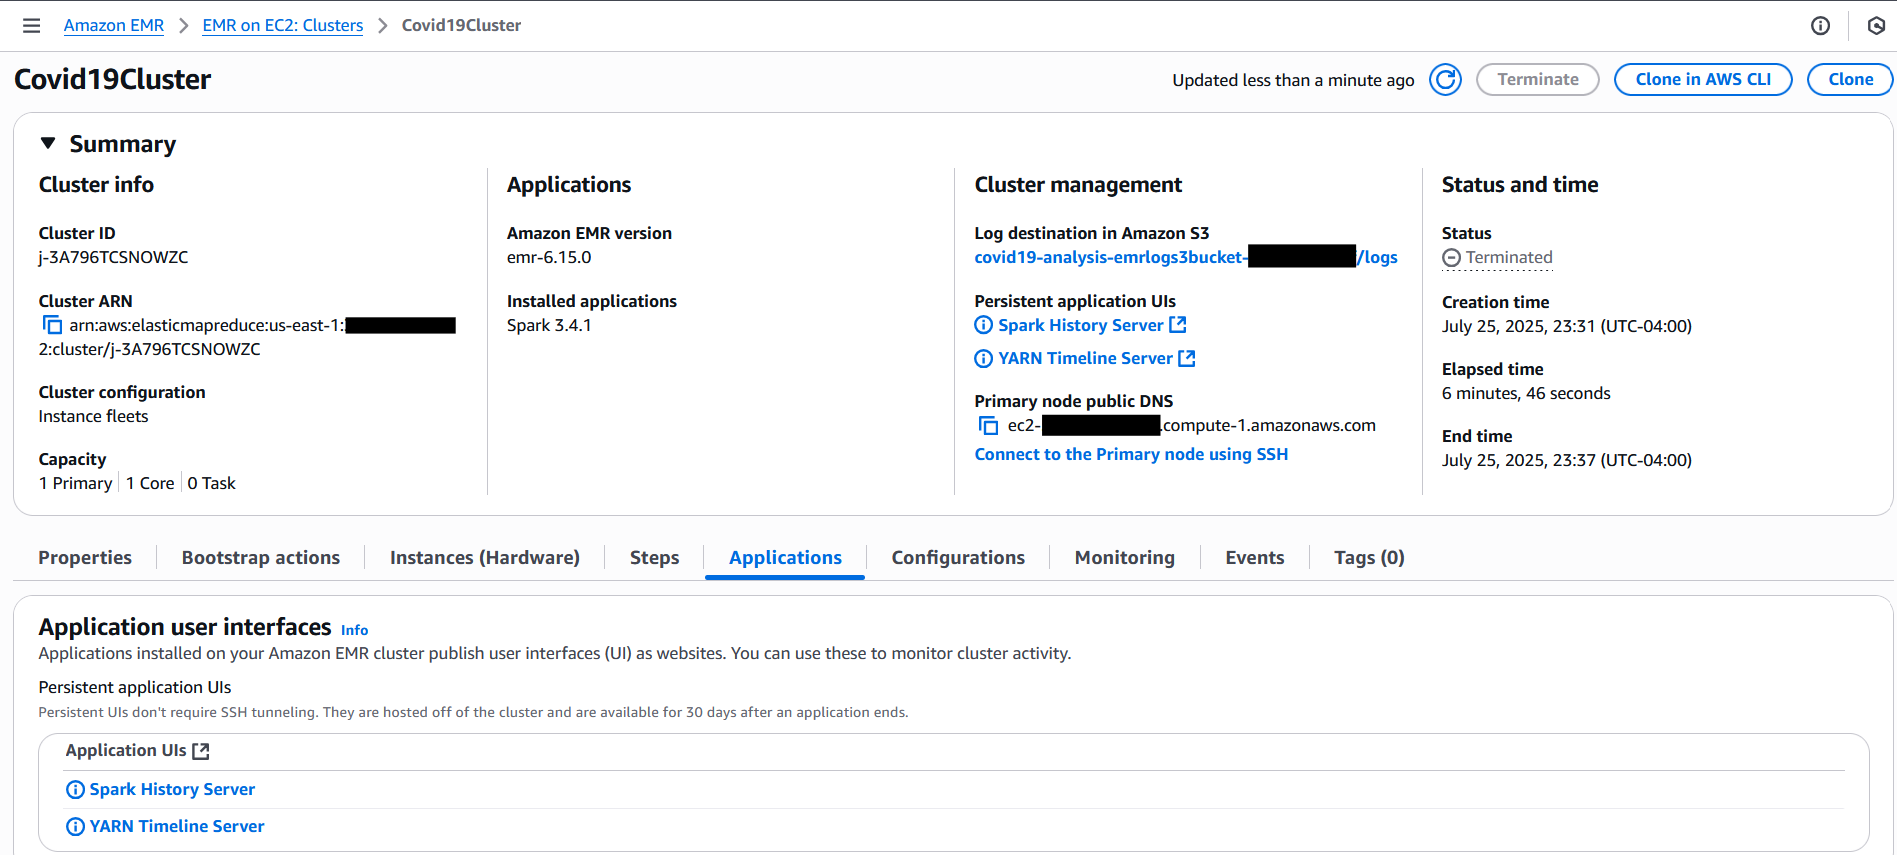
- While the cluster is active, open the Amazon EMR console and choose Clusters in the navigation pane.
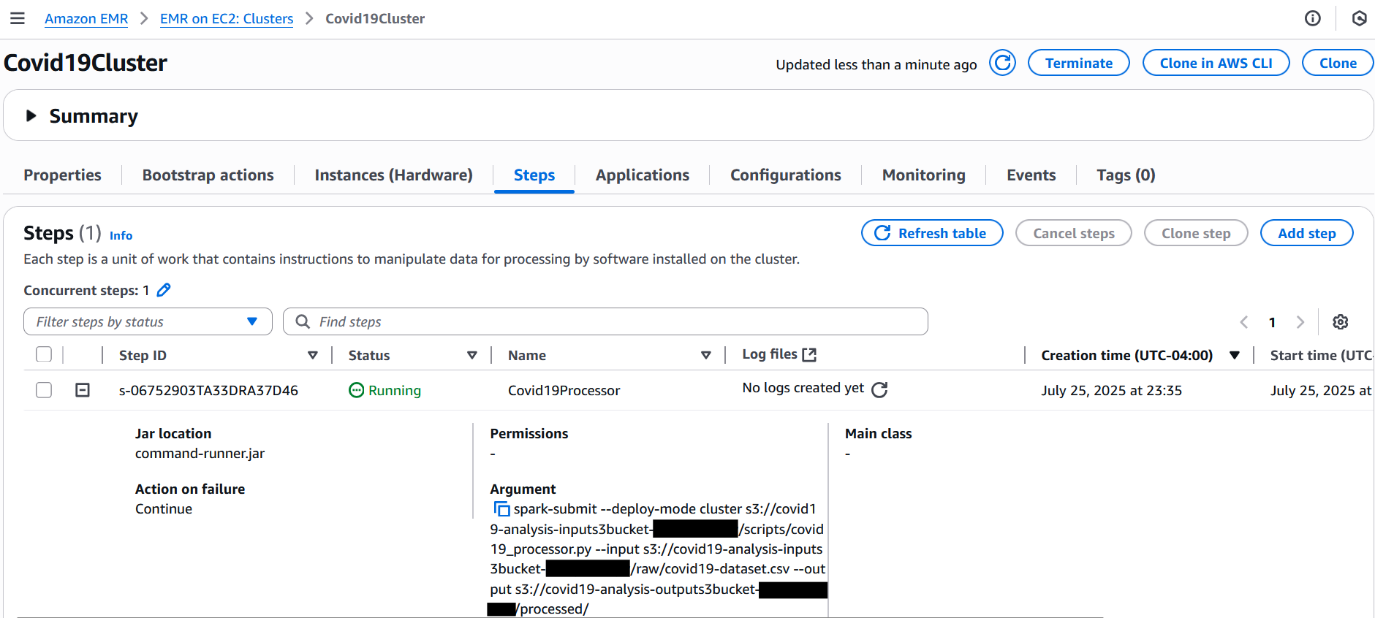
- Locate the Covid19Cluster transient EMR cluster.
Initially, it will be in Starting status.
On the Steps tab, you can see your Spark submit step listed. As the job progresses, the step status changes from Pending to Running to finally Completed or Failed.

- Choose the Applications tab to view the application UIs, in which you can access the Spark History Server and YARN Timeline Server for monitoring and troubleshooting.
Monitor CloudWatch logs
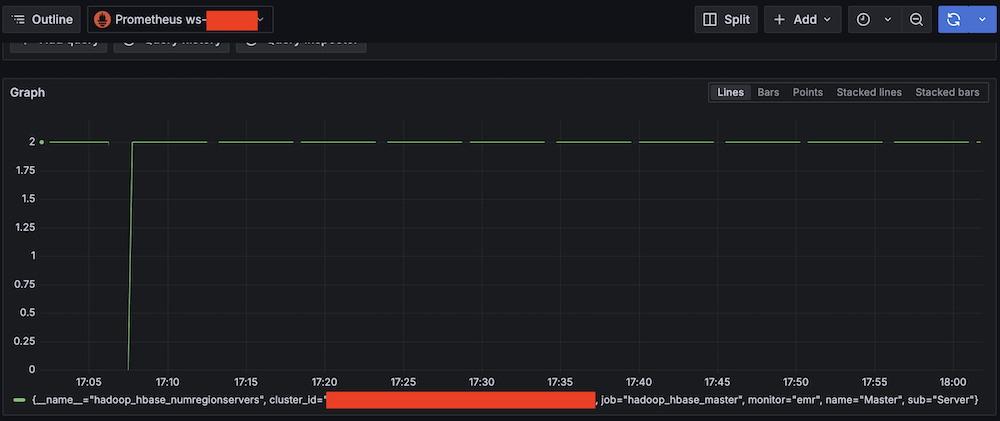
To enable CloudWatch logging and enhanced monitoring for your EMR on EC2 cluster, refer to Amazon EMR on EC2 – Enhanced Monitoring with CloudWatch using custom metrics and logs. This guide explains how to install and configure the CloudWatch agent using a bootstrap action, so you can stream system-level metrics (such as CPU, memory, and disk usage) and application logs from EMR nodes directly to CloudWatch. With this setup, you can gain real-time visibility into cluster health and performance, simplify troubleshooting, and retain critical logs even after the cluster is terminated.
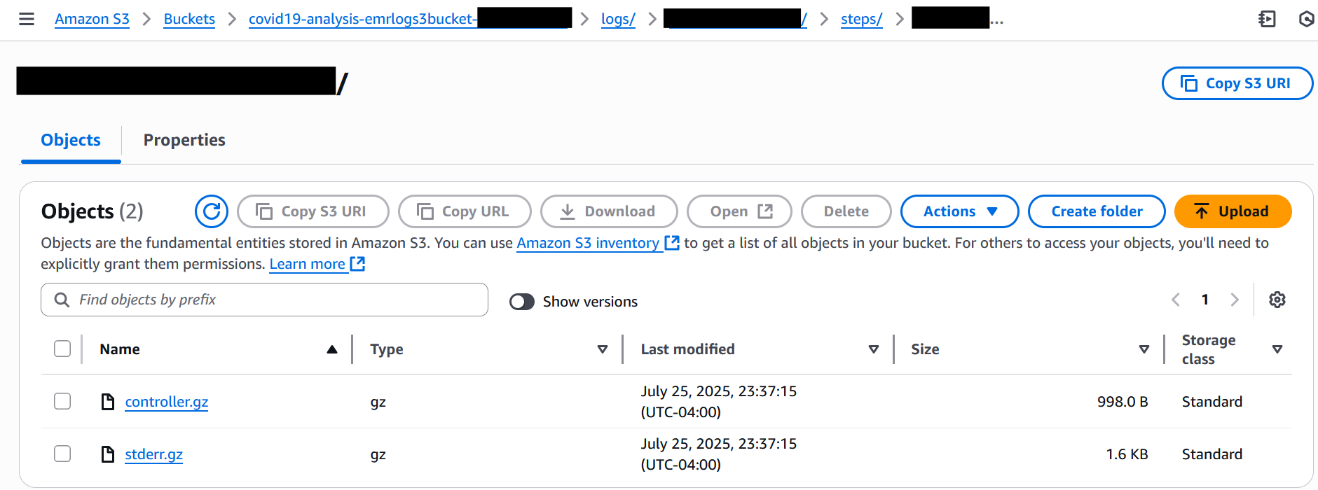
For this walkthrough, check the logs in the S3 log output location.
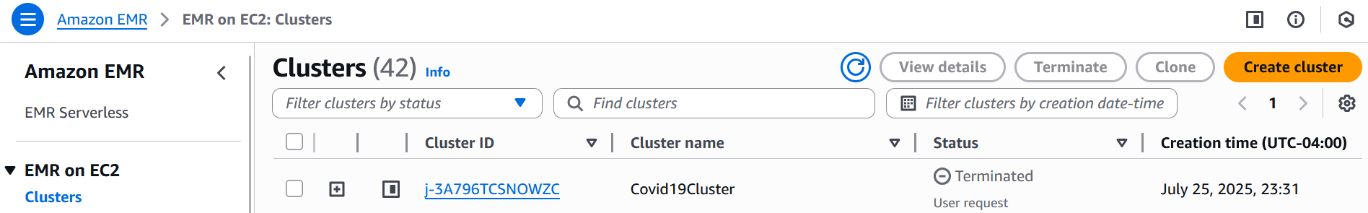
Confirm cluster deletion
When the Spark step is complete, Step Functions will automatically delete the Amazon EMR cluster. Refresh the Clusters page on the Amazon EMR console. You should see your cluster status change from Terminating to Terminated within a minute.
By following these steps, you gain full end-to-end visibility into your workflow from the moment the Step Functions state machine is triggered to the automatic shutdown of the EMR cluster. You can monitor execution progress, troubleshoot issues, confirm job success, and continuously optimize your transient Spark workloads.
Verify job output in Amazon S3
When the job is complete, complete the following steps to check the processed results in the S3 output bucket:
- On the Amazon S3 console, choose Buckets in the navigation pane.
- Open the output S3 bucket you noted earlier.
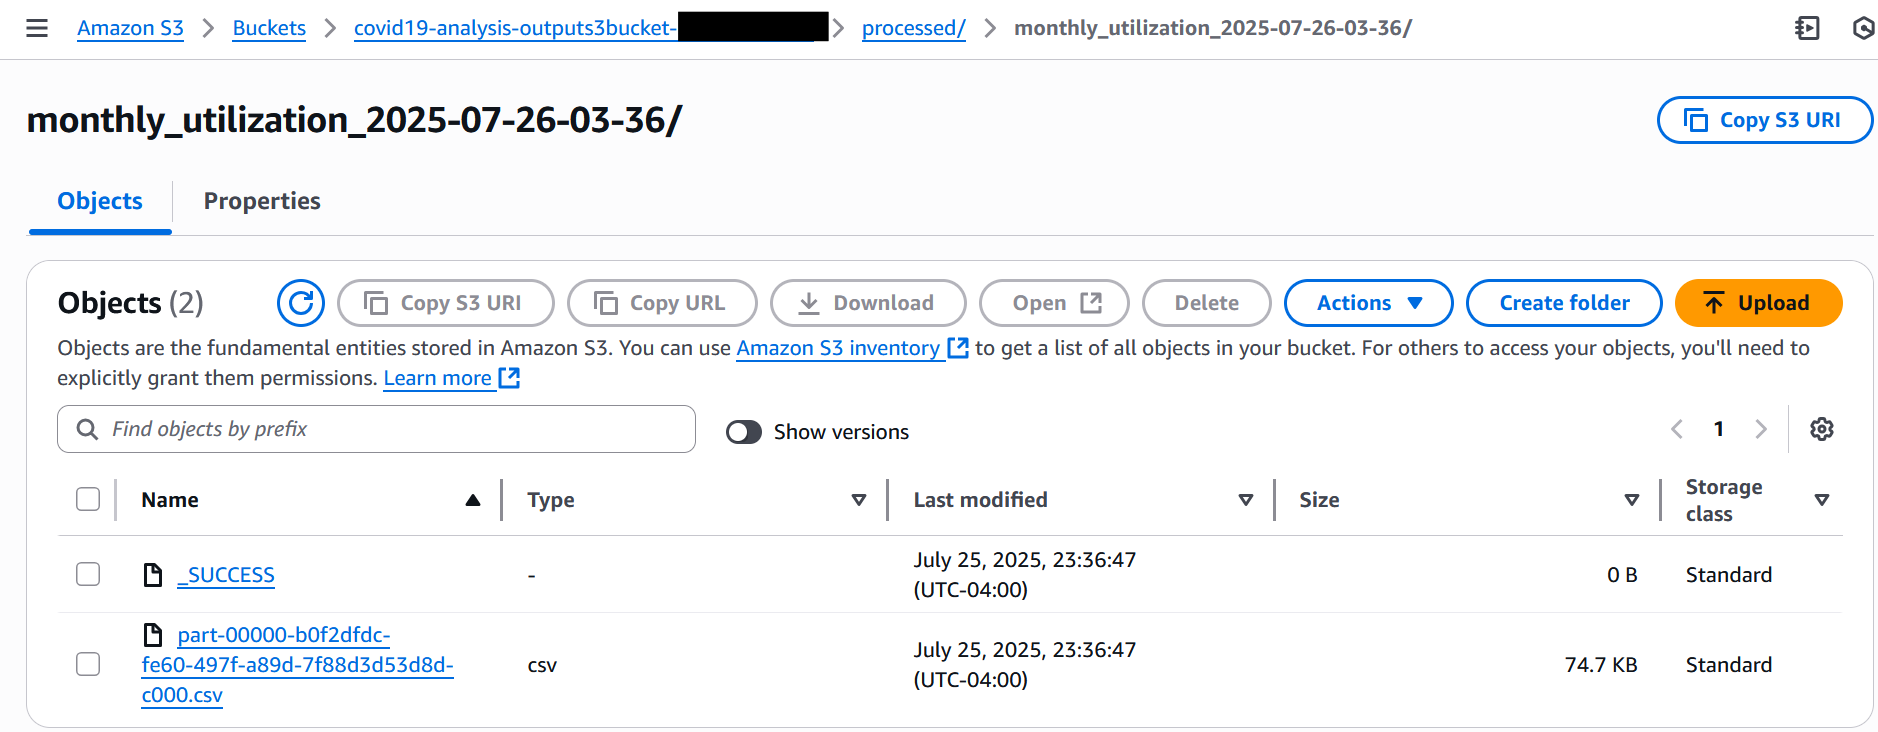
- Open the processed folder.
- Navigate into the timestamped subfolder to view the CSV output file.

- Download the CSV file to view the processed results, as shown in the following screenshot.

Monitoring and troubleshooting
To monitor the progress of your Spark job running on a transient EMR on EC2 cluster, use the Step Functions console. It provides real-time visibility into each state transition in your workflow, from cluster creation and job submission to cluster deletion. This makes it straightforward to track execution flow and identify where issues might occur.During job execution, you can use the Amazon EMR console to access cluster-level monitoring. This includes YARN application statuses, step-level logs, and overall cluster health. If CloudWatch logging is enabled in your job configuration, driver and executor logs stream in near real time, so you can quickly detect and diagnose errors, resource constraints, or data skew within your Spark application.
After the workflow is complete, regardless of whether it succeeds or fails, you can perform a detailed post-execution analysis by reviewing the logs stored in the S3 bucket specified in the LogUri parameter. This log directory includes standard output and error logs, along with Spark history files, offering insights into execution behavior and performance metrics.
For continued access to the Spark UI during job execution, you can use persistent application UIs on the EMR console. These links remain accessible even after the cluster is stopped, enabling deeper root-cause analysis and performance tuning for future runs.
This visibility into both workflow orchestration and job execution can help teams optimize their Spark workloads, reduce troubleshooting time, and build confidence in their EMR automation pipelines.
Clean up
To avoid incurring ongoing charges, clean up the resources provisioned during this walkthrough:
- Empty the S3 buckets:
- On the Amazon S3 console, choose Buckets in the navigation pane.
- Select the input, output, and log buckets used in this tutorial.
- Choose Empty to remove all objects before deleting the buckets (optional).
- Delete the CloudFormation stack:
- On the AWS CloudFormation console, choose Stacks in the navigation pane.
- Select the stack you created for this solution and choose Delete.
- Confirm the deletion to remove associated resources.
Conclusion
In this post, we showed how to build a fully automated and cost-effective Spark processing pipeline using Step Functions, EventBridge, and Amazon EMR on EC2. The workflow provisions a transient EMR cluster, runs a Spark job to process data, and stops the cluster after the job completes. This approach helps reduce costs while giving you full control over the process. This solution is ideal for scheduled data processing tasks such as ETL jobs, log analytics, or batch reporting, especially when you need detailed control over infrastructure, security, and compliance settings.
To get started, deploy the solution in your environment using the CloudFormation stack provided and adjust it to fit your data processing needs. Check out the Step Functions Developer Guide and Amazon EMR Management Guide to explore further.
Share your feedback and ideas in the comments or connect with your AWS Solutions Architect to fine-tune this pattern for your use case.


 Amit Maindola is a Senior Data Architect focused on data engineering, analytics, and AI/ML at Amazon Web Services. He helps customers in their digital transformation journey and enables them to build highly scalable, robust, and secure cloud-based analytical solutions on AWS to gain timely insights and make critical business decisions.
 Srinivas Kandi is a Senior Architect at Stifel focusing on delivering the next generation of cloud data platform on AWS. Prior to joining Stifel, Srini was a delivery specialist in cloud data analytics at AWS helping several customers in their transformational journey into AWS cloud. In his free time, Srini likes to explore cooking, travel and learn new trends and innovations in AI and cloud computing.
 Hossein Johari is a seasoned data and analytics leader with over 25 years of experience architecting enterprise-scale platforms. As Lead and Senior Architect at Stifel Financial Corp. in St. Louis, Missouri, he spearheads initiatives in Data Platforms and Strategic Solutions, driving the design and implementation of innovative frameworks that support enterprise-wide analytics, strategic decision-making, and digital transformation. Known for aligning technical vision with business objectives, he works closely with cross-functional teams to deliver scalable, forward-looking solutions that advance organizational agility and performance.
 Ahmad Rawashdeh is a Senior Architect at Stifel Financial. He supports Stifel and its clients in designing, implementing, and building scalable and reliable data architectures on Amazon Web Services (AWS), with a strong focus on data lake strategies, database services, and efficient data ingestion and transformation pipelines.
 Lei Meng is a data architect at Stifel. His focus is working in designing and implementing scalable and secure data solutions on the AWS and helping Stifel’s cloud migration from on-premises systems.


 Michael Davies is a Data Engineer at OUA. He has extensive experience within the education industry, with a particular focus on building robust and efficient data architecture and pipelines.
 Emma Arrigo is a Solutions Architect at AWS, focusing on education customers across Australia. She specializes in leveraging cloud technology and machine learning to address complex business challenges in the education sector. Emma’s passion for data extends beyond her professional life, as evidenced by her dog named Data.


 Sean Zou is a Cloud Operations leader with MuleSoft at Salesforce. Sean has been involved in many aspects of MuleSoft’s Cloud Operations, and helped drive MuleSoft’s cloud infrastructure to scale more than tenfold in 7 years. He built the Oversight Engineering function at MuleSoft from scratch.
 Terry Quan focuses on FinOps issues. He works on MuleSoft Engineering on cloud computing budgets and forecasting, cost reduction efforts, costs-to-serve, and coordinates with Salesforce Finance. Terry is a FinOps Practitioner and Professional Certified.
 Audrey Yuan is a Software Engineer with MuleSoft at Salesforce. Audrey works on data lakehouse solutions to help drive cloud maturity across the six pillars of the Well-Architected Framework.
 Rueben Jimenez is a Senior Solutions Architect at AWS, designing and implementing complex data analytics, AI/ML, and cloud infrastructure solutions.
 Avijit Goswami is a Principal Solutions Architect at AWS specialized in data and analytics. He supports AWS strategic customers in building high-performing, secure, and scalable data lake solutions on AWS using AWS managed services and open source solutions. Outside of his work, Avijit likes to travel, hike, watch sports, and listen to music.