Post Syndicated from Stephanie Doyle original https://www.backblaze.com/blog/backblaze-drive-stats-for-q2-2026/

Running a storage cloud means serving as both builder and building inspector. You choose the materials, put them to work at scale, and return quarter after quarter to see how the structure is holding up. After 13+ years of publishing Drive Stats, we know the materials in this particular house pretty well. So, when our preferred home improvement store introduces a new and improved brick (so to speak) we want to understand how it fits into the build.
That question is becoming more relevant as higher-capacity drives become more (dare we say) load bearing. We’ve already been tracking the performance of drives at 20TB and above as a group; later in this installment of Drive Stats, we’ll talk about some of the differences between our current building blocks (CMR HDDs) and the new bricks. But first, to take this extended pun to its inevitable conclusion, the inspection (a.k.a. The Stats).
This Q2 2026 Drive Stats report begins with the latest walkthrough: the quarter’s annualized failure rates, the models that stood out, and the lifetime record of the fleet. Then, we’ll look at some of the emerging technologies that could shape the next phase of construction.
Sign up for the Drive Stats webinar

Drive Stats: The digest version
Q2 2026 Hard drive failure rates
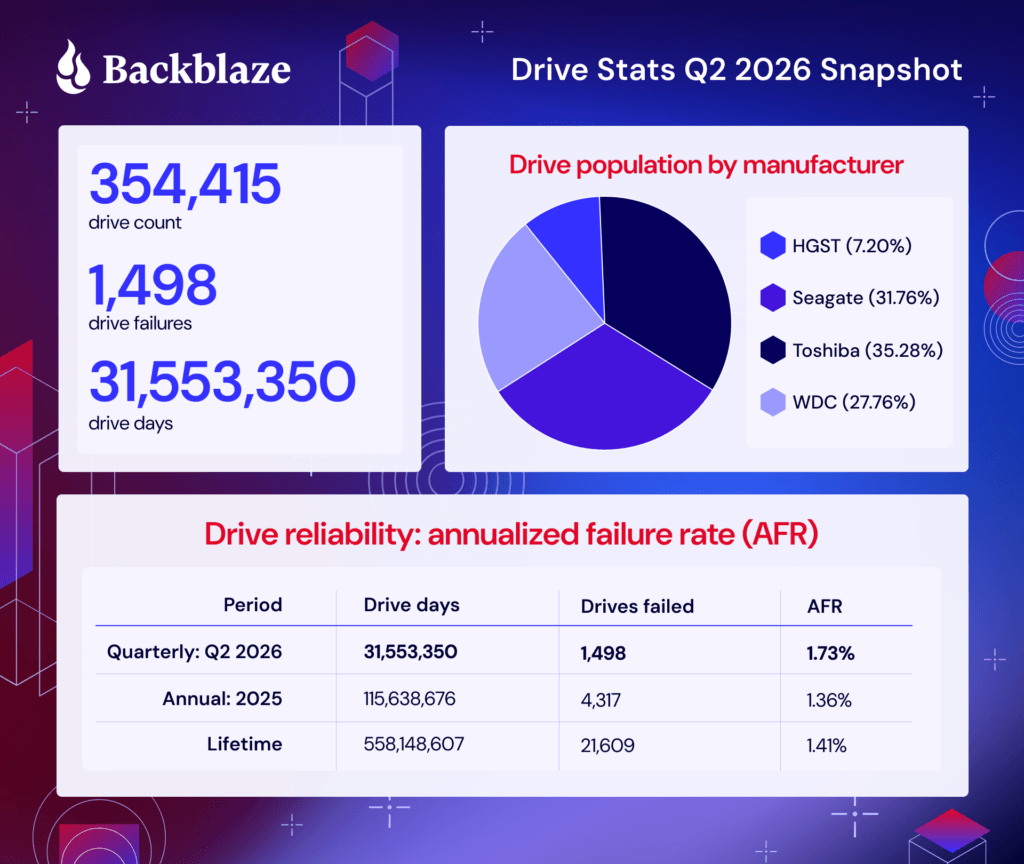
Throughout Q2 2026, Backblaze monitored 359,101 drives used to store data. For our evaluation, we removed from consideration 3,881 boot drives and 705 hard drives, as they did not meet the criteria to be included. We’ll discuss the criteria we used in the next section of this report. Removing these drives leaves us with 354,415 hard drives to analyze. The table below shows the annualized failure rates for Q1 2026 for this collection of drives.
Backblaze Hard Drive Failure Rates for Q2 2026
Reporting period April 1, 2026–June 30, 2026 inclusive
Drive models with drive count > 100 and drive days > 10,000 as of June 30, 2026 in Q2 2026.
| MFG | Model | Size (TB) | Drive Count | Avg. Age (Months) | Drive Days | Failures | AFR (%) |
|---|---|---|---|---|---|---|---|
| HGST | HUH721212ALE600 | 12 | 2,599 | 78.4 | 236,107 | 7 | 1.08 |
| HGST | HUH721212ALE604 | 12 | 13,196 | 59.4 | 1,190,182 | 109 | 3.34 |
| HGST | HUH721212ALN604 | 12 | 9,694 | 83.8 | 861,297 | 180 | 7.63 |
| Seagate | ST8000DM002 | 8 | 6,903 | 114.8 | 563,210 | 38 | 2.46 |
| Seagate | ST8000NM000A | 8 | 239 | 40.4 | 21,499 | 0 | 0 |
| Seagate | ST8000NM0055 | 8 | 13,112 | 104.7 | 1,177,541 | 111 | 3.44 |
| Seagate | ST10000NM0086 | 10 | 965 | 101.7 | 86,092 | 22 | 9.33 |
| Seagate | ST12000NM0007 | 12 | 972 | 78.8 | 87,496 | 10 | 4.17 |
| Seagate | ST12000NM0008 | 12 | 18,521 | 73.7 | 1,671,057 | 145 | 3.17 |
| Seagate | ST12000NM000J | 12 | 1,079 | 22 | 97,746 | 0 | 0 |
| Seagate | ST12000NM001G | 12 | 13,177 | 63.7 | 1,193,856 | 44 | 1.35 |
| Seagate | ST14000NM000J | 14 | 497 | 17 | 43,349 | 0 | 0 |
| Seagate | ST14000NM001G | 14 | 10,498 | 63.2 | 949,396 | 39 | 1.5 |
| Seagate | ST14000NM0138 | 14 | 1,235 | 65.5 | 110,410 | 25 | 8.26 |
| Seagate | ST16000NM000J | 16 | 171 | 15.4 | 14,221 | 1 | 2.57 |
| Seagate | ST16000NM001G | 16 | 35,100 | 43.7 | 3,162,117 | 56 | 0.65 |
| Seagate | ST16000NM002J | 16 | 467 | 41.7 | 42,086 | 4 | 3.47 |
| Seagate | ST24000NM002H | 24 | 9,631 | 12.2 | 861,587 | 78 | 3.3 |
| Toshiba | MG07ACA14TA | 14 | 37,171 | 67.1 | 3,368,924 | 179 | 1.94 |
| Toshiba | MG07ACA14TEY | 14 | 989 | 42.8 | 89,164 | 6 | 2.46 |
| Toshiba | MG08ACA16TA | 16 | 39,932 | 33.7 | 3,614,263 | 100 | 1.01 |
| Toshiba | MG08ACA16TE | 16 | 6,306 | 51.4 | 568,379 | 16 | 1.03 |
| Toshiba | MG08ACA16TEY | 16 | 4,857 | 53.5 | 439,243 | 44 | 3.66 |
| Toshiba | MG09ACA16TE | 16 | 905 | 6.2 | 68,429 | 2 | 1.07 |
| Toshiba | MG10ACA20TE | 20 | 25,270 | 12.1 | 2,117,524 | 64 | 1.1 |
| Toshiba | MG11ACA24TE | 24 | 9,620 | 5.8 | 824,903 | 13 | 0.58 |
| WDC | WUH721414ALE6L4 | 14 | 8,635 | 64.2 | 783,318 | 23 | 1.07 |
| WDC | WUH721816ALE6L0 | 16 | 2,970 | 53.3 | 268,875 | 30 | 4.07 |
| WDC | WUH721816ALE6L4 | 16 | 26,827 | 37.5 | 2,432,374 | 77 | 1.16 |
| WDC | WUH722222ALE6L4 | 22 | 45,665 | 19.1 | 4,146,339 | 63 | 0.55 |
| WDC | WUH722626ALE6L4 | 26 | 7,212 | 3.4 | 462,366 | 12 | 0.95 |
| Totals | 354,415 | 31,553,350 | 1,498 | 1.73 |
Note and observations
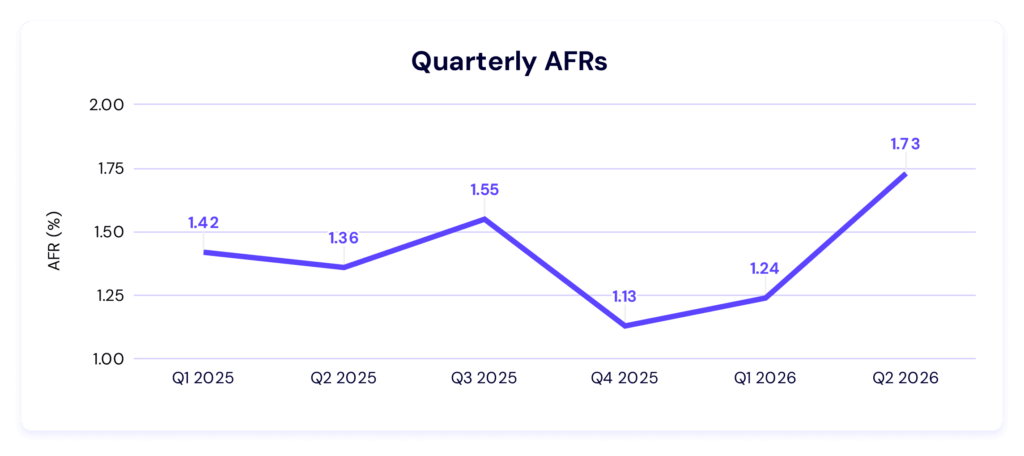
- The quarterly AFR is 1.73%, the highest it’s been in quite a while. We’ll talk about the reasons why in just a bit, but for now, here’s your quarter-over-quarter tracking of the failure rate:
- As usual, let’s round up the honor roll. These drives had zero failures:
- Seagate ST8000NM000A (8TB)
- Seagate ST12000NM000J (12TB)
- Seagate ST14000NM000J (14TB)
- And these drives had one:
- Seagate ST16000NM000J (16TB)
No typos here, folks: that’s a clean sweep by Seagate.
- Out with the old. This quarter, we’ve seen two drives fully retire, the 4TB HGST HMS5C4040BLE640 at nearly nine years old total; and, the 8TB HGST HUH728080ALE600 at nearly eight years old.
- But where is the new? Just like last quarter, we have no new drive models—a curiosity, especially to have that happen two quarters in a row. But, also like last quarter, that doesn’t mean no new deployments. While most drive models’ counts stayed more or less the same (plus or minus replacements), we once again see deployment concentrated in the 20TB+ drives.
What’s going on with the high-end outliers?
This quarter we had three outliers, which, according to a quartile analysis, defines an outlier as an AFR above 6.95%. Those drives are:
- HGST HUH721212ALN604 (12TB)—7.63%
- Seagate ST10000NM0086 (10TB)—9.33%
- Seagate ST14000NM0138 (14TB)—8.26%
Each of these drives have some pretty clear reasons for high failure rates. The HGST drive is nearly seven years old, and the 10TB Seagate was nearly 8.5 years old.
Meanwhile, both the Seagate drives have a pretty low drive count—the 10TB drive only has 965; whereas the 14TB has 1,235. That means that while they only had 22 and 25 failures (respectively) their AFRs were quite high.
It’s worth noting there were a total of seven drives that still had an AFR of >3.0%. While we’ve just determined those aren’t outliers, that’s still quite a few high AFRs compared to other quarters—that means that 10 out 31 drives had an AFR higher than 3.0%.
I haven’t done a full analysis of how rare it is to have our distribution of >3.0% skew that high, but a casual look at the last few quarters show it to be skewed towards the higher end of the spectrum. That will, of course, bring up our average. Something to keep an eye on as we move forward.
Standard definitions
As mentioned, we remove drives that don’t meet our criteria. We’ve covered the reasons that we’ve designed these exclusions in past reports, but here’s the quick and dirty:
| Period | Drive Count | Drive Days |
|---|---|---|
| Quarterly | > 100 | > 10,000 |
| Annual | > 250 | > 50,000 |
| Lifetime | > 500 | >100,000 |
Regardless of whether or not a given drive model is included in this article’s charts and tables, all of the line item data is included in our Drive Stats dataset which you can download by visiting our Drive Stats page.
Lifetime hard drive failure rates
Backblaze Lifetime Hard Drive Failure Rates
Reporting period ending June 30, 2026 inclusive
Drive models with > 500 drives and > 100,000 lifetime drive days
| MFG | Model | Size (TB) | Drive Count | Avg. Age (Months) | Drive Days | Failures | AFR (%) |
|---|---|---|---|---|---|---|---|
| HGST | HUH721212ALE600 | 12 | 2,599 | 77.4 | 6,351,520 | 111 | 0.64 |
| HGST | HUH721212ALE604 | 12 | 13,196 | 57.7 | 25,209,144 | 1,224 | 1.77 |
| HGST | HUH721212ALN604 | 12 | 9,694 | 79.8 | 27,776,092 | 1,858 | 2.44 |
| Seagate | ST8000DM002 | 8 | 6,903 | 107.3 | 33,679,046 | 1,418 | 1.54 |
| Seagate | ST8000NM0055 | 8 | 13,112 | 97.1 | 46,308,955 | 2,515 | 1.98 |
| Seagate | ST10000NM0086 | 10 | 965 | 92.1 | 3,652,808 | 328 | 3.28 |
| Seagate | ST12000NM0007 | 12 | 972 | 31.7 | 37,413,220 | 2,307 | 2.25 |
| Seagate | ST12000NM0008 | 12 | 18,521 | 69.8 | 44,683,877 | 2,612 | 2.13 |
| Seagate | ST12000NM000J | 12 | 1,079 | 21.5 | 730,603 | 22 | 1.1 |
| Seagate | ST12000NM001G | 12 | 13,177 | 62.3 | 26,300,571 | 723 | 1 |
| Seagate | ST14000NM001G | 14 | 10,498 | 61.2 | 20,975,305 | 795 | 1.38 |
| Seagate | ST14000NM0138 | 14 | 1,235 | 56 | 2,878,064 | 464 | 5.88 |
| Seagate | ST16000NM001G | 16 | 35,100 | 43.1 | 47,227,179 | 876 | 0.68 |
| Seagate | ST24000NM002H | 24 | 9,631 | 12.1 | 3,640,687 | 323 | 3.24 |
| Toshiba | MG07ACA14TA | 14 | 37,171 | 65.4 | 78,387,008 | 2,293 | 1.07 |
| Toshiba | MG07ACA14TEY | 14 | 989 | 41.1 | 1,324,965 | 64 | 1.76 |
| Toshiba | MG08ACA16TA | 16 | 39,932 | 33.2 | 41,520,709 | 1,213 | 1.07 |
| Toshiba | MG08ACA16TE | 16 | 6,306 | 49.9 | 10,113,070 | 341 | 1.23 |
| Toshiba | MG08ACA16TEY | 16 | 4,857 | 52.1 | 8,475,023 | 564 | 2.43 |
| Toshiba | MG09ACA16TE | 16 | 905 | 6.1 | 169,812 | 6 | 1.29 |
| Toshiba | MG10ACA20TE | 20 | 25,270 | 12.1 | 9,324,427 | 202 | 0.79 |
| Toshiba | MG11ACA24TE | 24 | 9,620 | 5.8 | 1,694,377 | 23 | 0.5 |
| WDC | WUH721414ALE6L4 | 14 | 8,635 | 63.5 | 17,127,349 | 254 | 0.54 |
| WDC | WUH721816ALE6L0 | 16 | 2,970 | 52.8 | 4,934,292 | 162 | 1.2 |
| WDC | WUH721816ALE6L4 | 16 | 26,827 | 37.2 | 30,895,588 | 471 | 0.56 |
| WDC | WUH722222ALE6L4 | 22 | 45,665 | 19 | 26,618,389 | 423 | 0.58 |
| WDC | WUH722626ALE6L4 | 26 | 7,212 | 3.4 | 736,527 | 17 | 0.84 |
| Totals | 353,041 | 558,148,607 | 21,609 | 1.41 |
Notes and observations
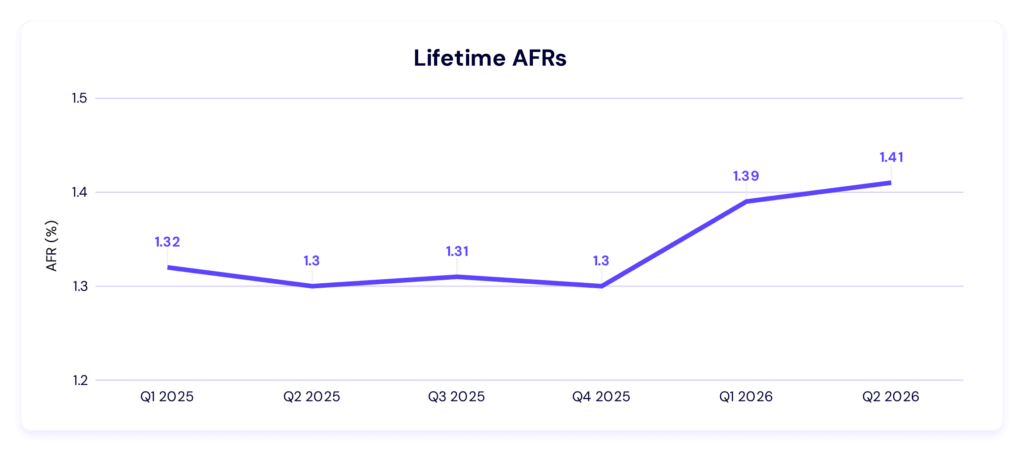
- The lifetime AFR is consistent. We see a slight uptick this quarter to 1.41%.
- Four models don’t make the cut on the lifetime table. These models didn’t make the drive count minimum to be reported in the lifetime table:
- Seagate ST8000NM000A (8TB)—239 drives
- Seagate ST14000NM000J (14TB)—497 drives
- Seagate ST16000NM000J (16TB)—171 drives
- Seagate ST16000NM002J (16TB)—467 drives
Interestingly, the first three on that list all were on our zero failure list as well.
About those bigger drives
Recently, we’ve spent a lot of time in this series talking about high-capacity drives. The 20TB+ club has grown from a curiosity to more than 25% of the drives in this quarter’s dataset, and deployment continues to concentrate at the larger end of the range.
As an industry, we’ve been watching the steady drive towards higher capacity drives—WD announced a 40TB UltraSMR drive just this year, with a roadmap that shows how they’ll get to 100TB by 2029. One way manufacturers are increasing that density is by changing how the tracks themselves are arranged on disk, and that has implications for how data centers read and write data. So, let’s talk about what that looks like.
CMR, SMR, and a word about roofing
Hard drives write data in concentric tracks. Each track can be rewritten independently. Before we get into anything else, it’s important to understand that there’s a physical size difference between the read and write heads in a hard drive.
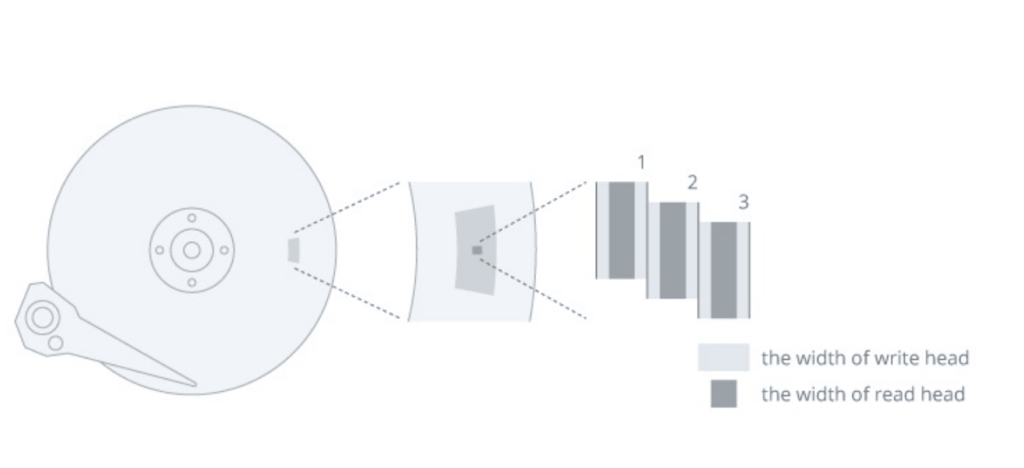
Source.
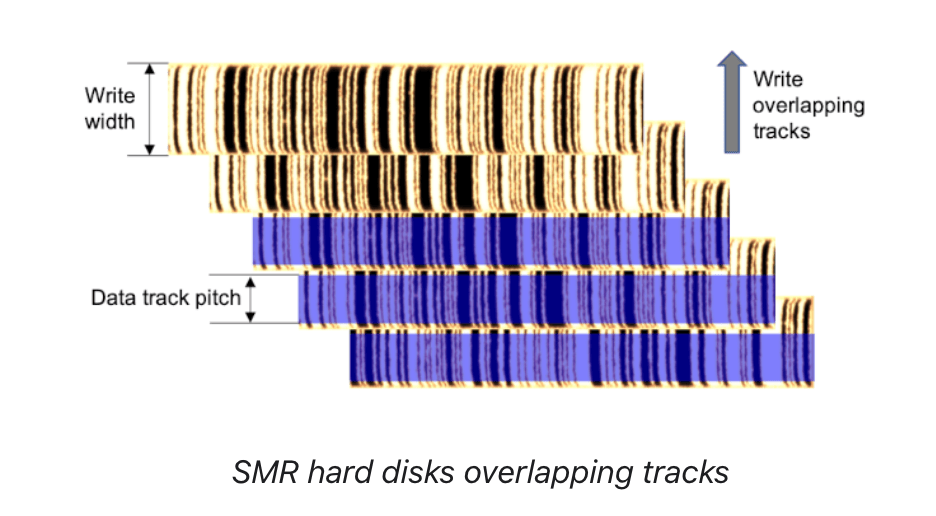
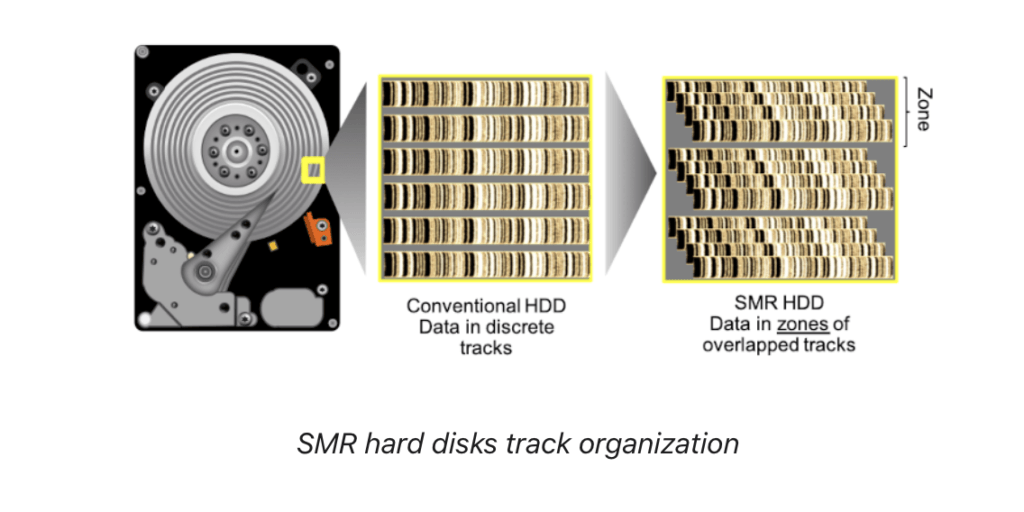
With conventional magnetic recording (CMR), those tracks sit side by side with guard space between them. Shingled magnetic recording (SMR) changes the track geometry. The tracks overlap, much like roof shingles—a naming decision that, at least for this report, we decided to really lean in on.
Now back to those drive heads: this technique works because a drive’s write head lays down a wider track than its read head needs to retrieve. Overlap part of each track with the next one and the data remains readable, while more of it fits on the platter. Depending on the implementation, that can add roughly 10% to 25% more capacity.
The tradeoff also resembles actual shingles: changing something in the middle can disturb what was layered over it. SMR organizes tracks into bands or zones, so updating data may require the drive—or the software managing it—to reorganize a larger section.
How that behavior is managed matters, so you actually will see a few different flavors of SMR:
- Drive-managed SMR: The drive’s firmware handles data placement and band rewriting. It looks like a conventional block device to the host, but write performance can become unpredictable.
- Host-managed SMR: The operating system or application writes data sequentially within designated zones. This requires compatible software but gives the host greater control.
- Host-aware SMR: Supports SMR-aware commands while retaining some compatibility with conventional workflows.
It can be a bit hard to grasp without a visual, so here’s what that looks like in practice. Here’s an exploded version of an SMR write band:
And a side-by-side of CMR and SMR.
CMR vs. SMR Drives: What’s the difference?
To really nail it down (pun, as always, intended), here’s a handy-dandy table to compare:
| CMR | SMR | |
|---|---|---|
| Track layout | Side by side, with guard space | Overlapping, like shingles |
| Capacity on comparable platters | Baseline | Roughly 10%–25% higher |
| Reads | Predictable | Generally comparable |
| Sequential writes | Well suited | Well suited |
| Random rewrites | Any track can be updated directly | May require reorganizing a band or zone |
| Who handles the complexity | Standard storage stack | Drive firmware or SMR-aware host software |
| Best fit | General-purpose workloads | Sequential or append-oriented workloads |
What CMR vs. SMR means in a data center
The appeal is straightforward: more terabytes per drive slot, in the same rack space, at roughly similar drive-level power. That can improve both dollars per terabyte and watts per terabyte without requiring anyone to build another building. At data center-scale, a modest density gain becomes a very large number with a dollar sign in front of it.
But, SMR cares about workload shape. Sequential and append-oriented writes play nicely with its architecture; frequent small rewrites create more work. Depending on the type of SMR, the software stack may also need to understand zones and place data accordingly.
That makes qualification less “swap the drive” and more “plan the project.” Capacity and AFR still matter, but so do sustained write behavior, rebuild performance, parity or erasure-coding overhead, firmware, and the storage software sitting above the drive.
What about HAMR?
Without making the obvious joke, let’s talk about how HAMR fits into the conversation.
HAMR is a hard drive technology that briefly heats a microscopic spot on the platter with a laser as data is written. The heat allows the drive to write to smaller, more stable magnetic grains, increasing the amount of data that can fit on each platter. And, while most hard drive platters have traditionally been built on aluminum-alloy substrates, glass is standard in 2.5-inch HAMR drives and increasingly common in high-capacity 3.5-inch HAMR designs.
Because those techniques solve different problems, manufacturers can combine them. So, the answer to “SMR or HAMR?” is mostly “yes.”
What does this mean for Drive Stats?
There are no SMR drives in the Backblaze fleet today, and none of the drives in the tables above are shingled. But SMR is being developed across the hard drive industry, and “not today” does not mean “not ever.”
We’ll approach it the same way we approached the first higher-capacity drives: as SMR drives enter the fleet, we’ll flag which ones they are, and we’ll all get to chat about their AFRs.
Get the full dataset
As always, the complete dataset used to create the tables and charts in this report is available on our Hard Drive Test Data page. You can download and use this data for free for your own purpose. All we ask are three things:
- You cite Backblaze as the source if you use the data;
- You accept that you are solely responsible for how you use the data, and;
- You do not sell this data itself to anyone; it is free.
If you’re a new Drive Stats fan, consider signing up for the newsletter. If you’re not ready for that kind of commitment, sound off in the comments section below or reach out directly to us to let us know what you’re working on.
The post Backblaze Drive Stats for Q2 2026 appeared first on Backblaze Blog | Cloud Storage & Cloud Backup