Post Syndicated from Aparna Krishnamoorthy original https://aws.amazon.com/blogs/devops/running-production-experiments-with-aws-appconfig-experimentation/
A redesigned checkout button is meant to lift sales. A longer cache time to live (TTL) is meant to cut backend load. But until you test a change against real production traffic, decisions come down to intuition and whoever argues hardest, not evidence. With AWS AppConfig experimentation, you can make data-driven calls instead: using A/B testing, you expose a change to a slice of real users, measure what happens, and let the results decide. It’s part of AWS AppConfig, a capability of AWS Systems Manager, so there’s no separate platform to stand up.
Testing in a development environment confirms a change works, but not how real users or production workloads respond. Releasing to everyone at once answers that but exposes every user to any negative effects, such as broken checkout flows or degraded performance. An experiment is the middle ground: real production traffic, but only a controlled slice of it.
AWS AppConfig experimentation builds on AWS AppConfig feature flags: you define a hypothesis and eligible audience, and a feature flag assigns each participant to the control or a treatment. The AWS AppConfig Agent delivers the right value to each participant, and you keep full control of your data, you join treatment-assignment records with your existing analytics platform.
In this post, you build the following experiments:
- A frontend experiment that tests a redesigned Add to cart button
- A backend experiment that compares cache TTL settings in a service running on Amazon Elastic Container Service (Amazon ECS)
You also learn how to record treatment assignments, monitor application health, analyze the results, and promote the winning treatment.
Prerequisites
This post assumes you’ve completed the experimentation prerequisites in the AWS AppConfig User Guide: a feature flag deployed to your environment, the AWS AppConfig Agent installed and configured in your compute environment (including the IAM permissions it needs), and experiment assignment logging enabled on the Agent. To follow the examples here, you also need:
1. AWS Command Line Interface (AWS CLI) 2.35.12 or later, configured with credentials for the account and Region you use. Verify your version with aws –version.
2. A data warehouse or analytics destination for assignment and outcomes data. This post uses Amazon Athena over data in Amazon S3, but AWS AppConfig experimentation works with Amazon CloudWatch or any warehouse you already use, such as Amazon Redshift or Snowflake.
Architecture Overview
AWS AppConfig experimentation adds A/B testing on top of the AWS AppConfig workflow you already use. The control plane lives in AWS AppConfig, treatments are delivered at the edge by the AWS AppConfig Agent, and analysis stays in your existing data warehouse. AWS AppConfig itself provides real-time aggregate traffic metrics; it doesn’t own results analytics, which keeps your metric definitions and data under your control.
The flow looks like this:
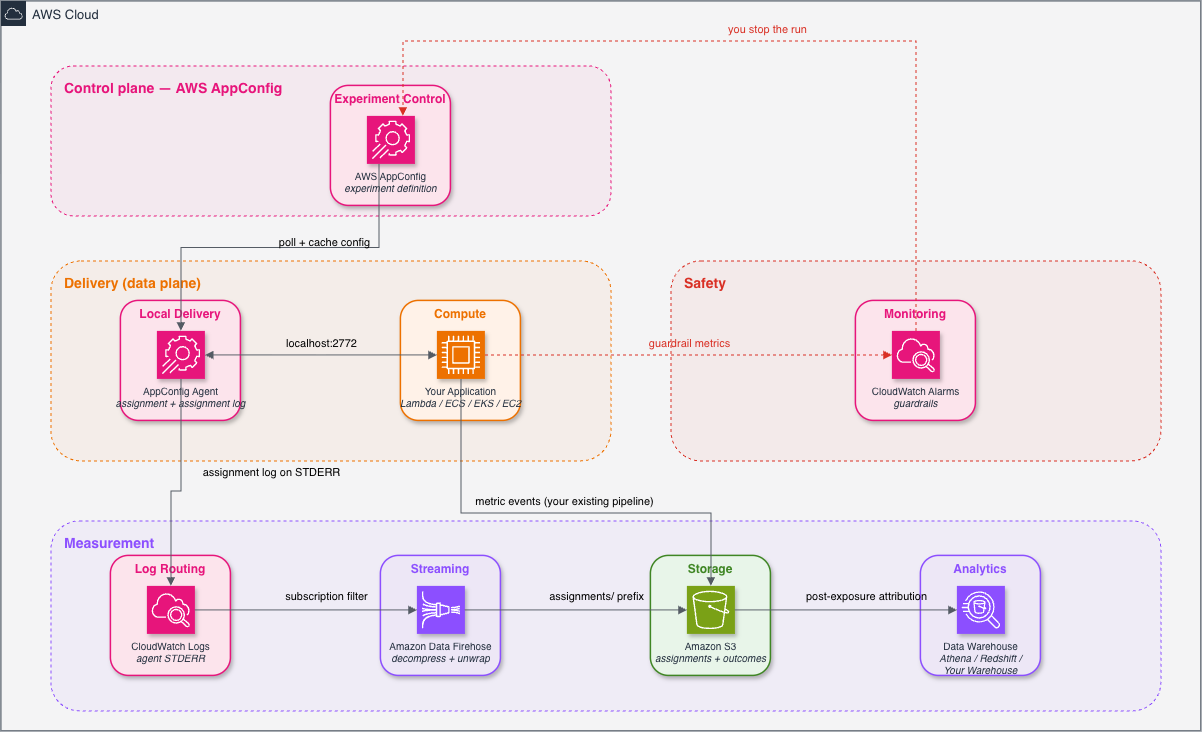
Figure 1: AWS AppConfig experimentation — the control plane in AWS AppConfig plus three runtime responsibilities (delivery, measurement, and safety), with the Agent’s assignment log reaching Amazon S3 through Amazon CloudWatch Logs and Amazon Data Firehose
Beyond the control plane in AWS AppConfig, where you define the experiment and its treatments, three things happen at runtime:
- Delivery (the data plane). The AWS AppConfig Agent retrieves the feature flag configuration from AWS AppConfig, caches it locally, and asynchronously polls for updates. Your application asks the agent for a flag over the local HTTP endpoint (
http://localhost:2772/...), passing an entity Id and any relevant request context. The agent returns the assigned treatment. The Agent returns the same treatment for the same entity for the life of the run, so a user or instance never flips treatments mid-experiment. - Measurement. Two data sets meet here. The first is treatment assignments. The Agent writes one JSON record per assignment to standard error. Your log driver ships that record to Amazon CloudWatch Logs, and a subscription filter (matched on the record type) forwards it through Amazon Data Firehose into Amazon S3. The second is your metric events — conversions, latency, cost, and errors — which keep flowing through whatever pipeline you already run.
Note: We recommend not using sensitive information such as personally identifiable information (PII) for the entity ID, the Agent logs it verbatim. If you must, hash or pseudonymize it identically in both your assignment and metric data – the entity ID is the key that joins the two. - Safety. Amazon CloudWatch alarms watch operational and experiment metrics. If an alarm fires during a run, you stop the run, which ends exposure and returns users to the deployed configuration.
One mechanism serves a frontend team, an AI team, and a backend team, each keeping its own metrics and tooling.
Example 1 — Frontend UI Experiment
Scenario. Your team believes a redesigned “Add to cart” button will lift conversion, but you only have a hypothesis. You want to expose it to a slice of production traffic and measure real behavior.
Create the experiment (console)
The experiment definition ties an application, environment, configuration profile, and feature flag to a control and one or more treatments. Audience rules determine who is eligible, and launch criteria define what counts as success. In the AWS AppConfig console, choose Experiments, then Create experiment, and work through five steps. AI-assisted experiment design in the console can validate your setup against Amazon’s experimentation best practices, helping you catch design gaps before you start a run.
Step 1 — Document your hypothesis. Give the experiment a descriptive Experiment name (add-to-cart-redesign), state the Experiment hypothesis, and use Launch criteria to record the evidence required before you promote a winner — a minimum sample per treatment, the lift you’re looking for, and the guardrails that must not regress. Writing it down now is what makes the result interpretable weeks later, and Validate my hypothesis and launch criteria will review both before you continue. Select StoreFront as the Application name.
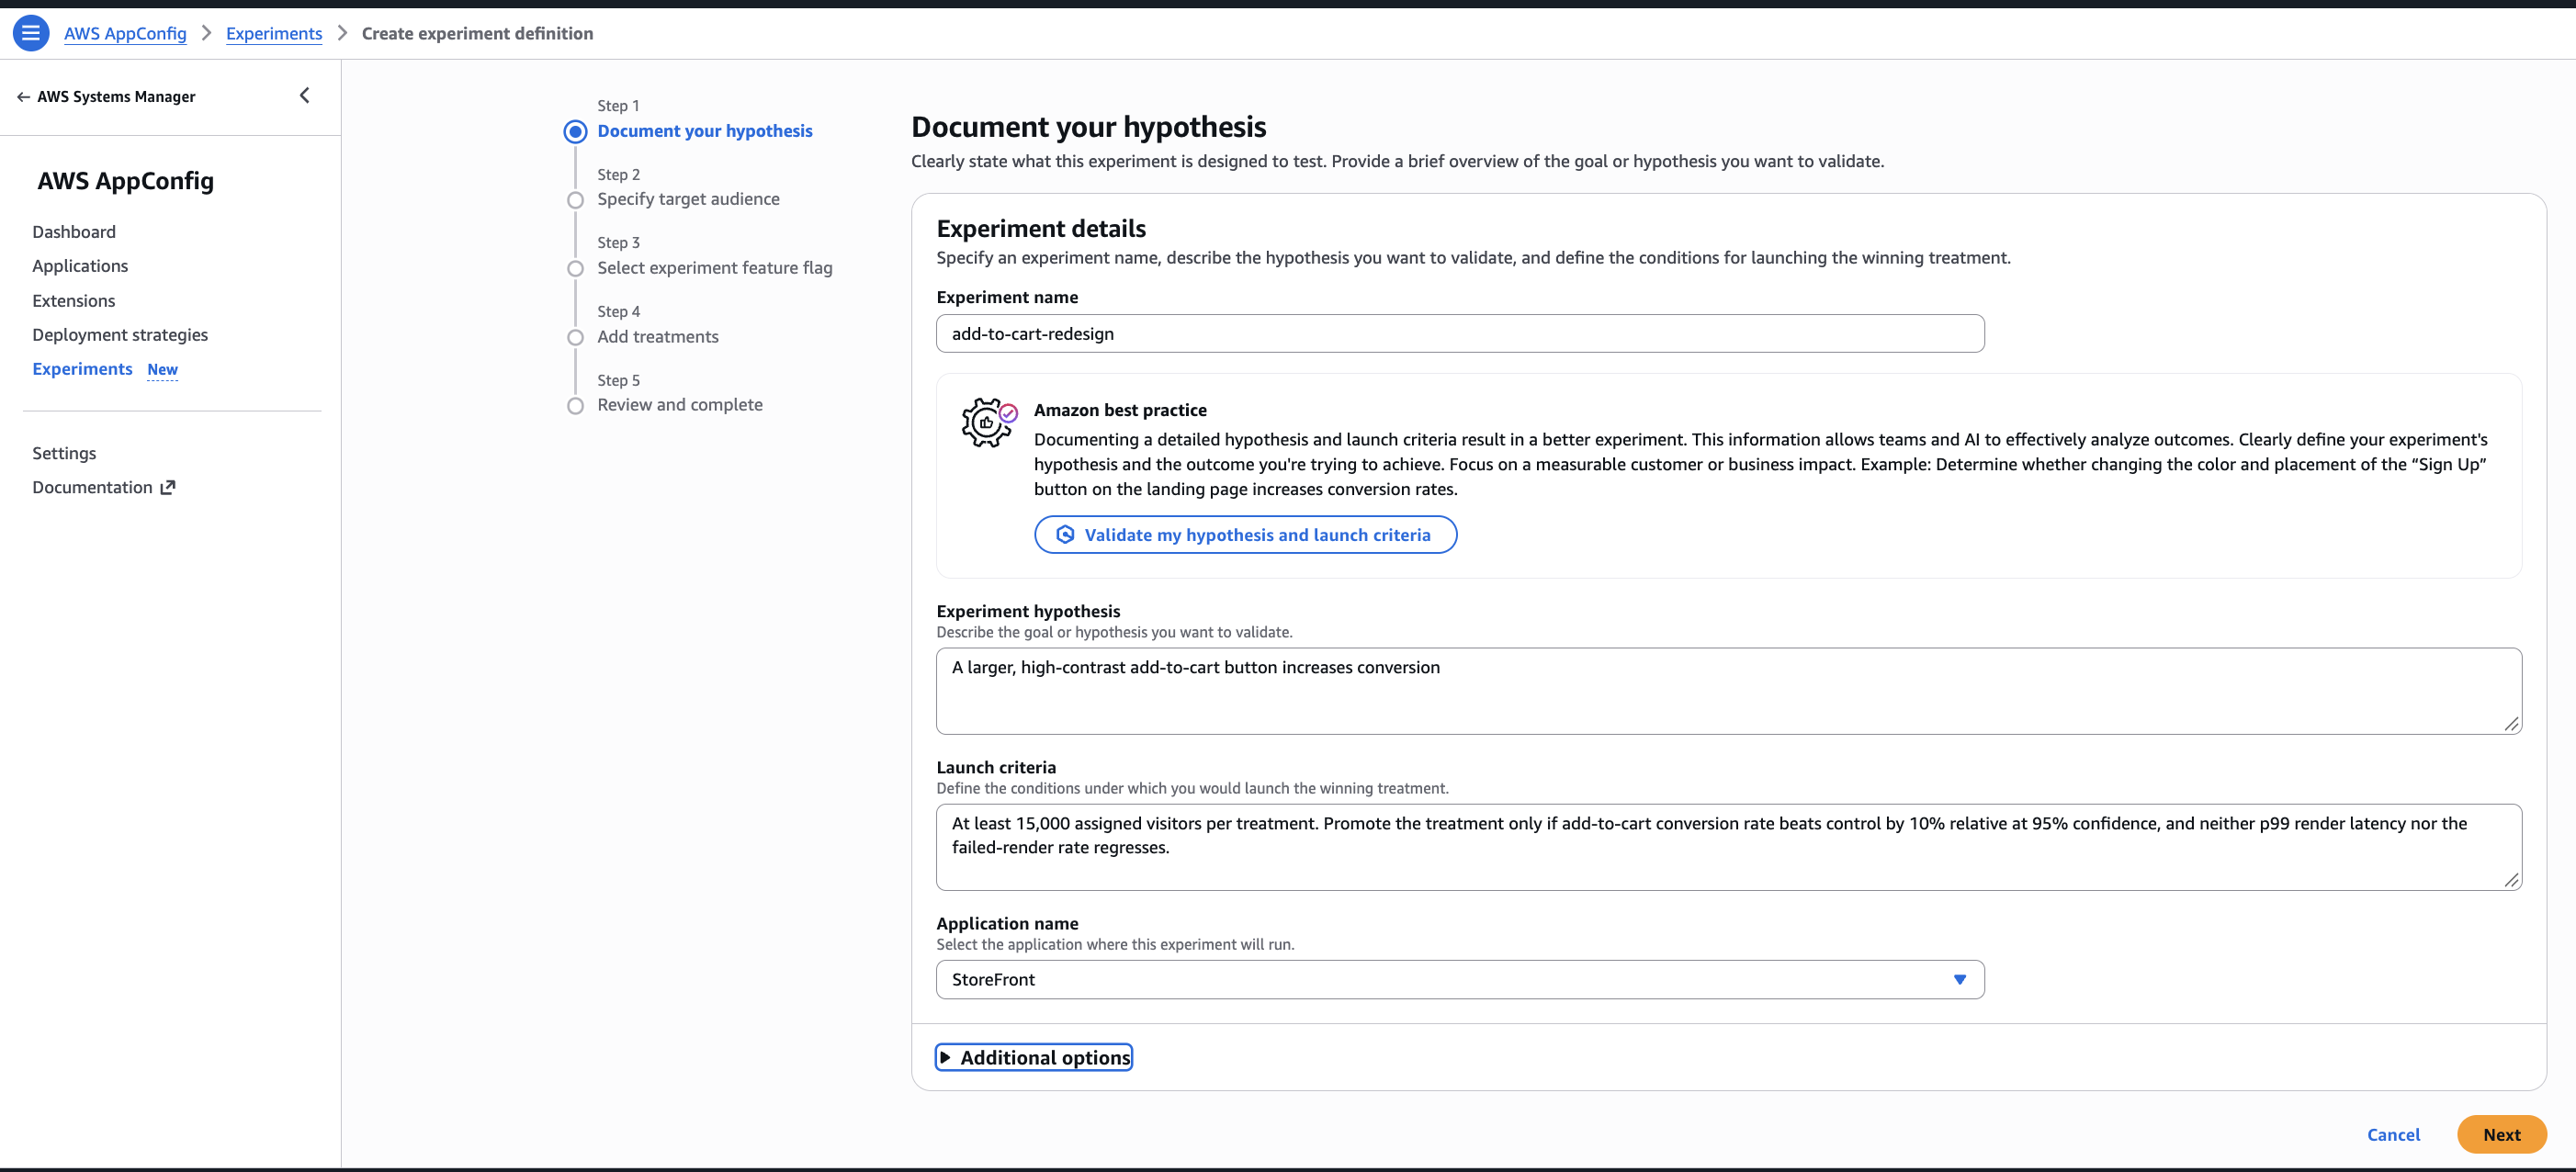 Figure 2: Documenting the hypothesis and launch criteria for the add-to-cart experiment
Step 2 — Specify target audience. Describe the audience, then build the rule. The Rule builder tab composes conditions from an attribute, an operator, and a value: $platform equals “web”, joined with And to $geo in [“USA”,”CAN”]. Sample blueprints offers pre-built rules to start from, and the Editor tab shows the same rule as an expression — the form to use if you later automate this:
(and
(eq $platform "web")
(in $geo ["USA","CAN"])
)
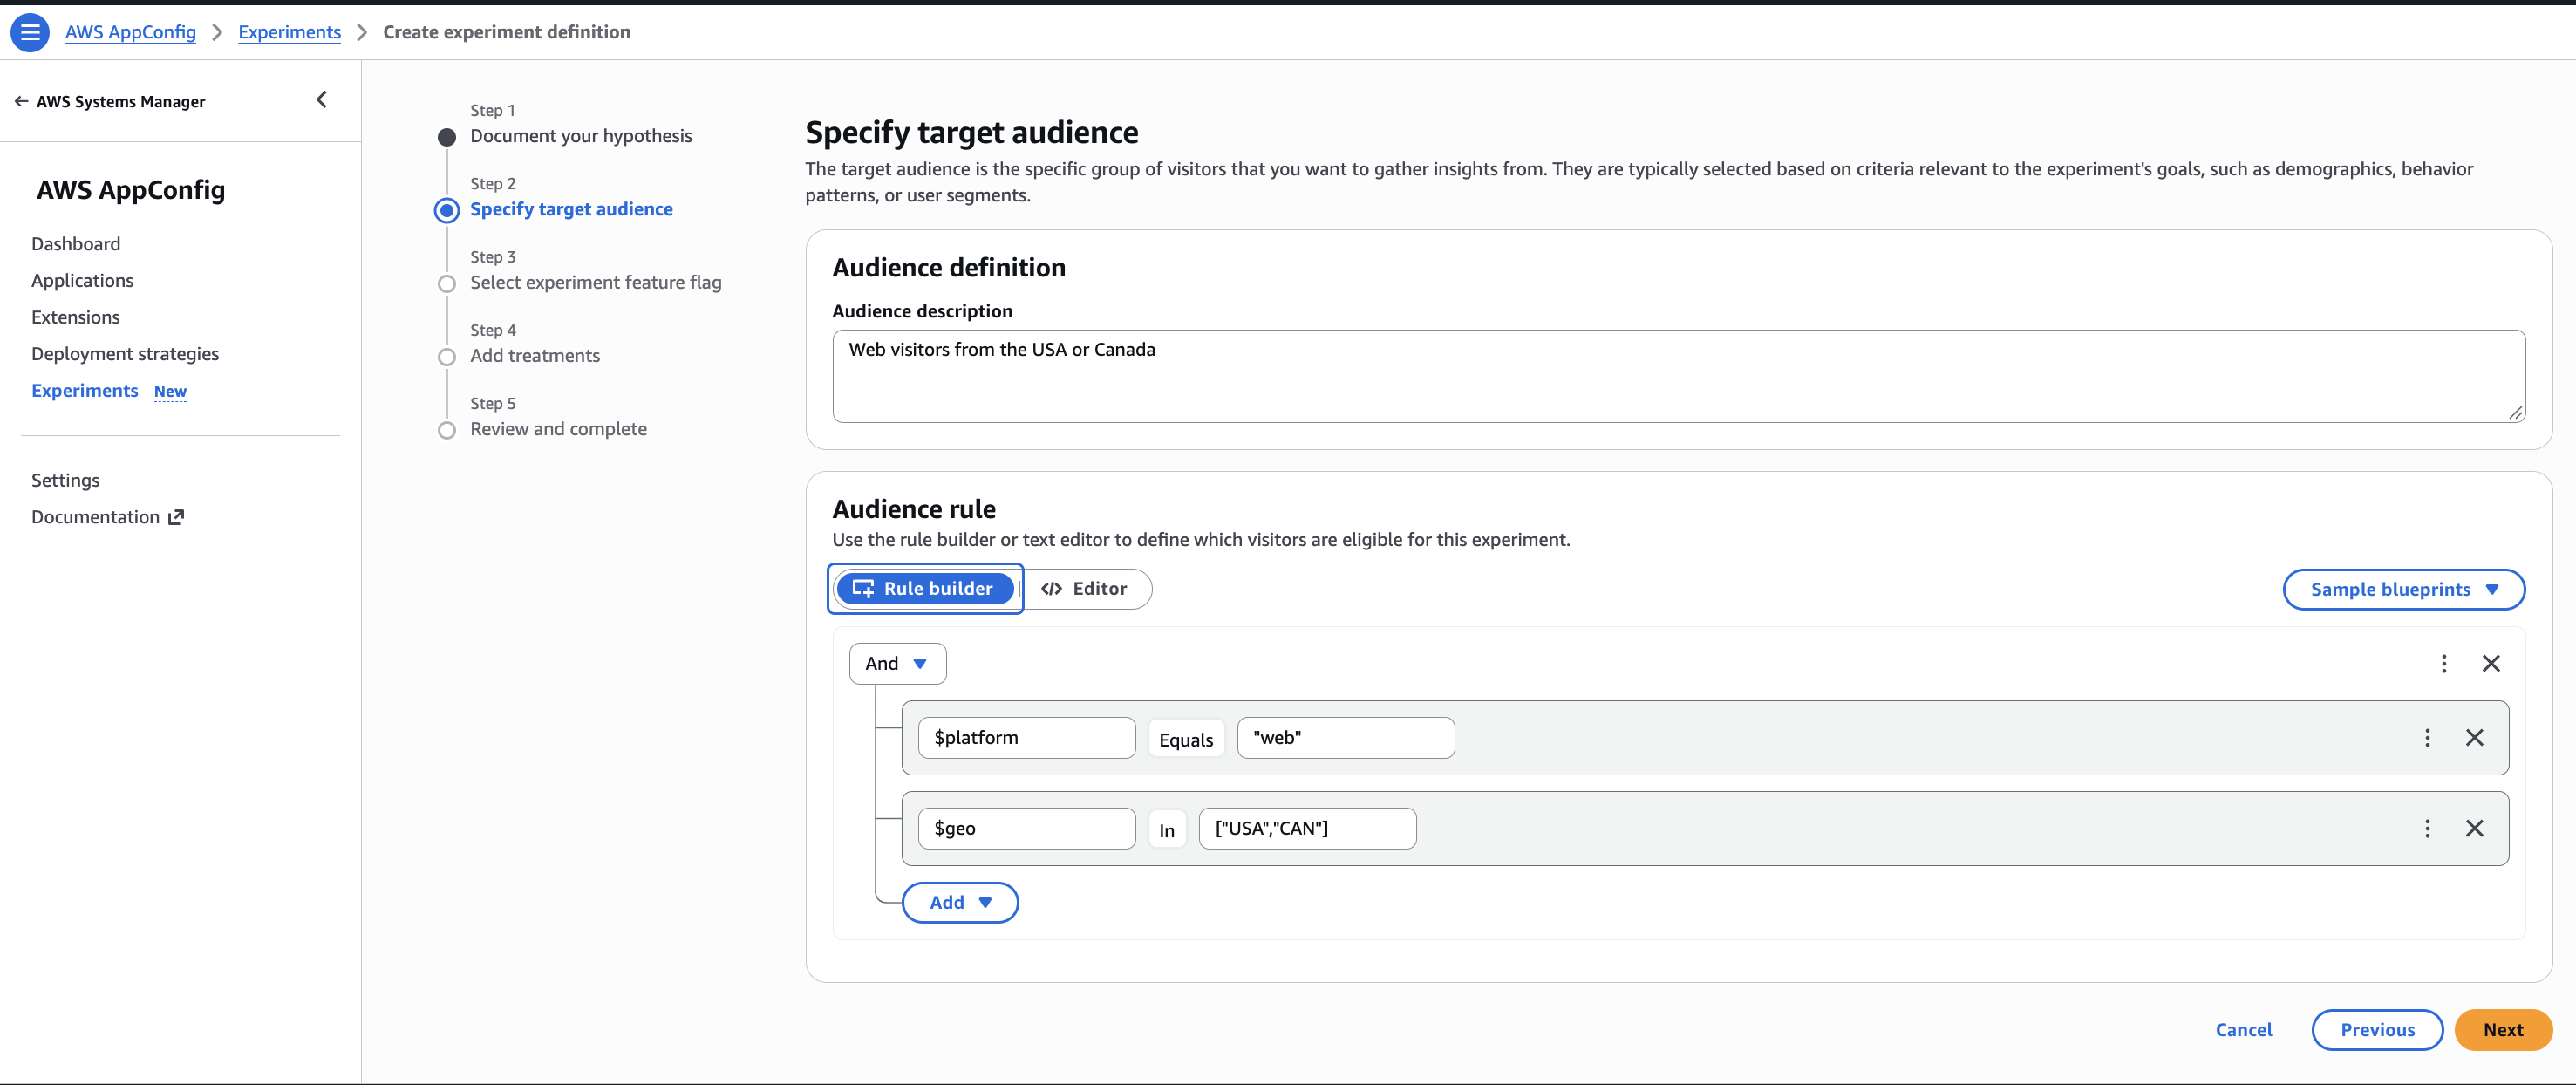
Figure 3: Building the audience rule from two conditions
That notation is an S-expression — a prefix, function-style form, (operator arg1 arg2 …). The notation is generic; AppConfig defines the operators and the $-prefixed attribute references, which are populated from the caller context your application sends. Here $geo is an attribute your application supplies — the visitor’s country, not an AWS Region.
Note: AWS AppConfig is Regional, so an experiment lives in one AWS Region — don’t use AWS Region as an audience attribute. Segment on caller properties (geography, platform, plan tier, app version); to test across Regions, replicate the experiment definition in each and measure independently.
Step 3 — Select experiment feature flag. Choose the Environment (prod), the Configuration profile holding the flag (Features), and the Feature flag itself (add_to_cart_button). The list shows flags already deployed to that environment.
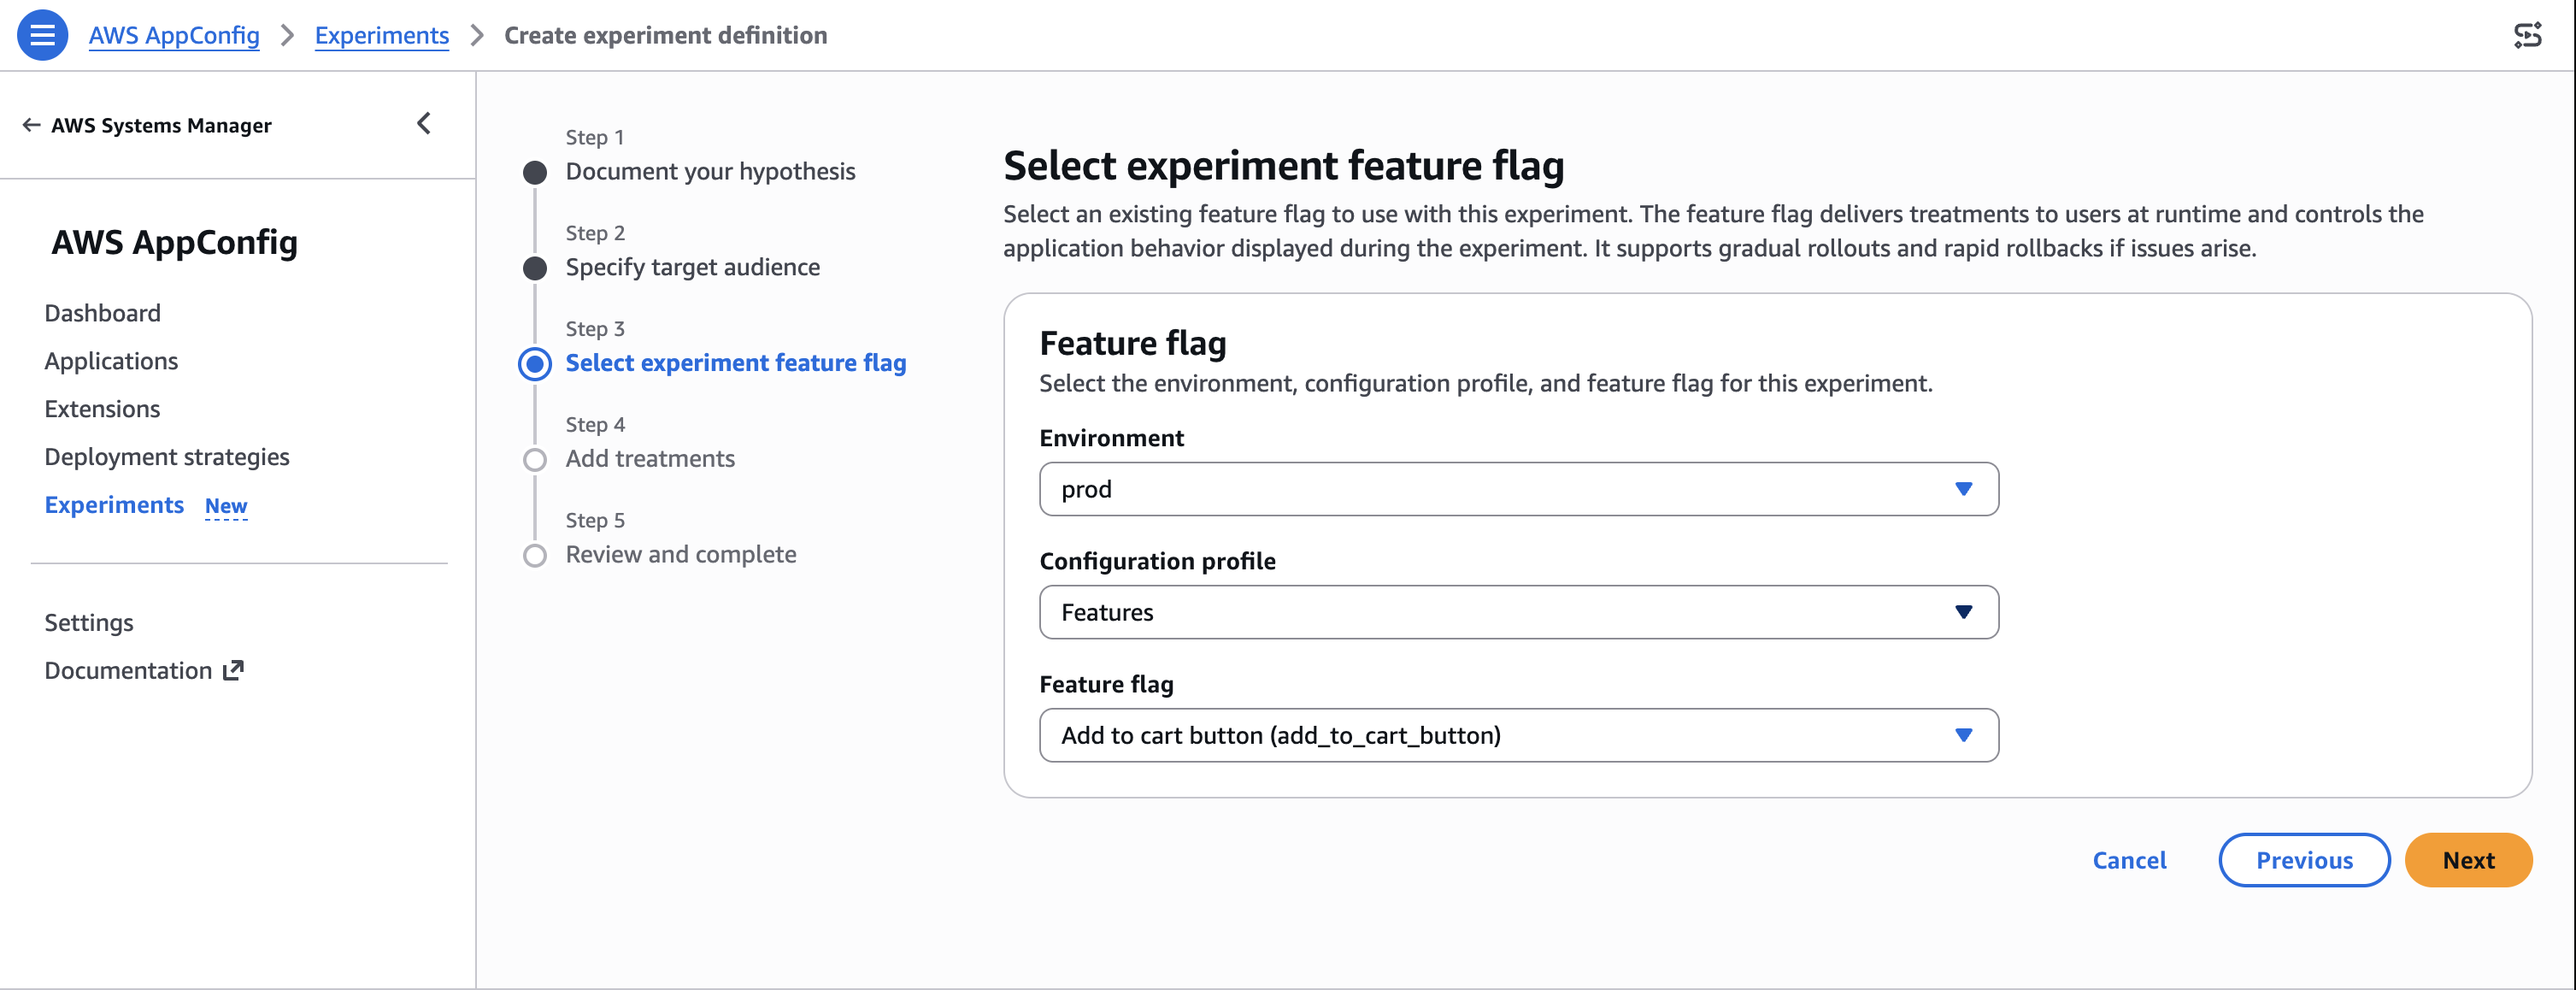 Figure 4: Selecting the deployed feature flag the experiment will control
Step 4 — Add treatments. Describe the Control as your known-good baseline, confirm its Flag value is toggled ON, and under Attribute values set button_style to classic and button_color to #232F3E. The list includes every attribute the flag defines, including ones this experiment doesn’t vary.
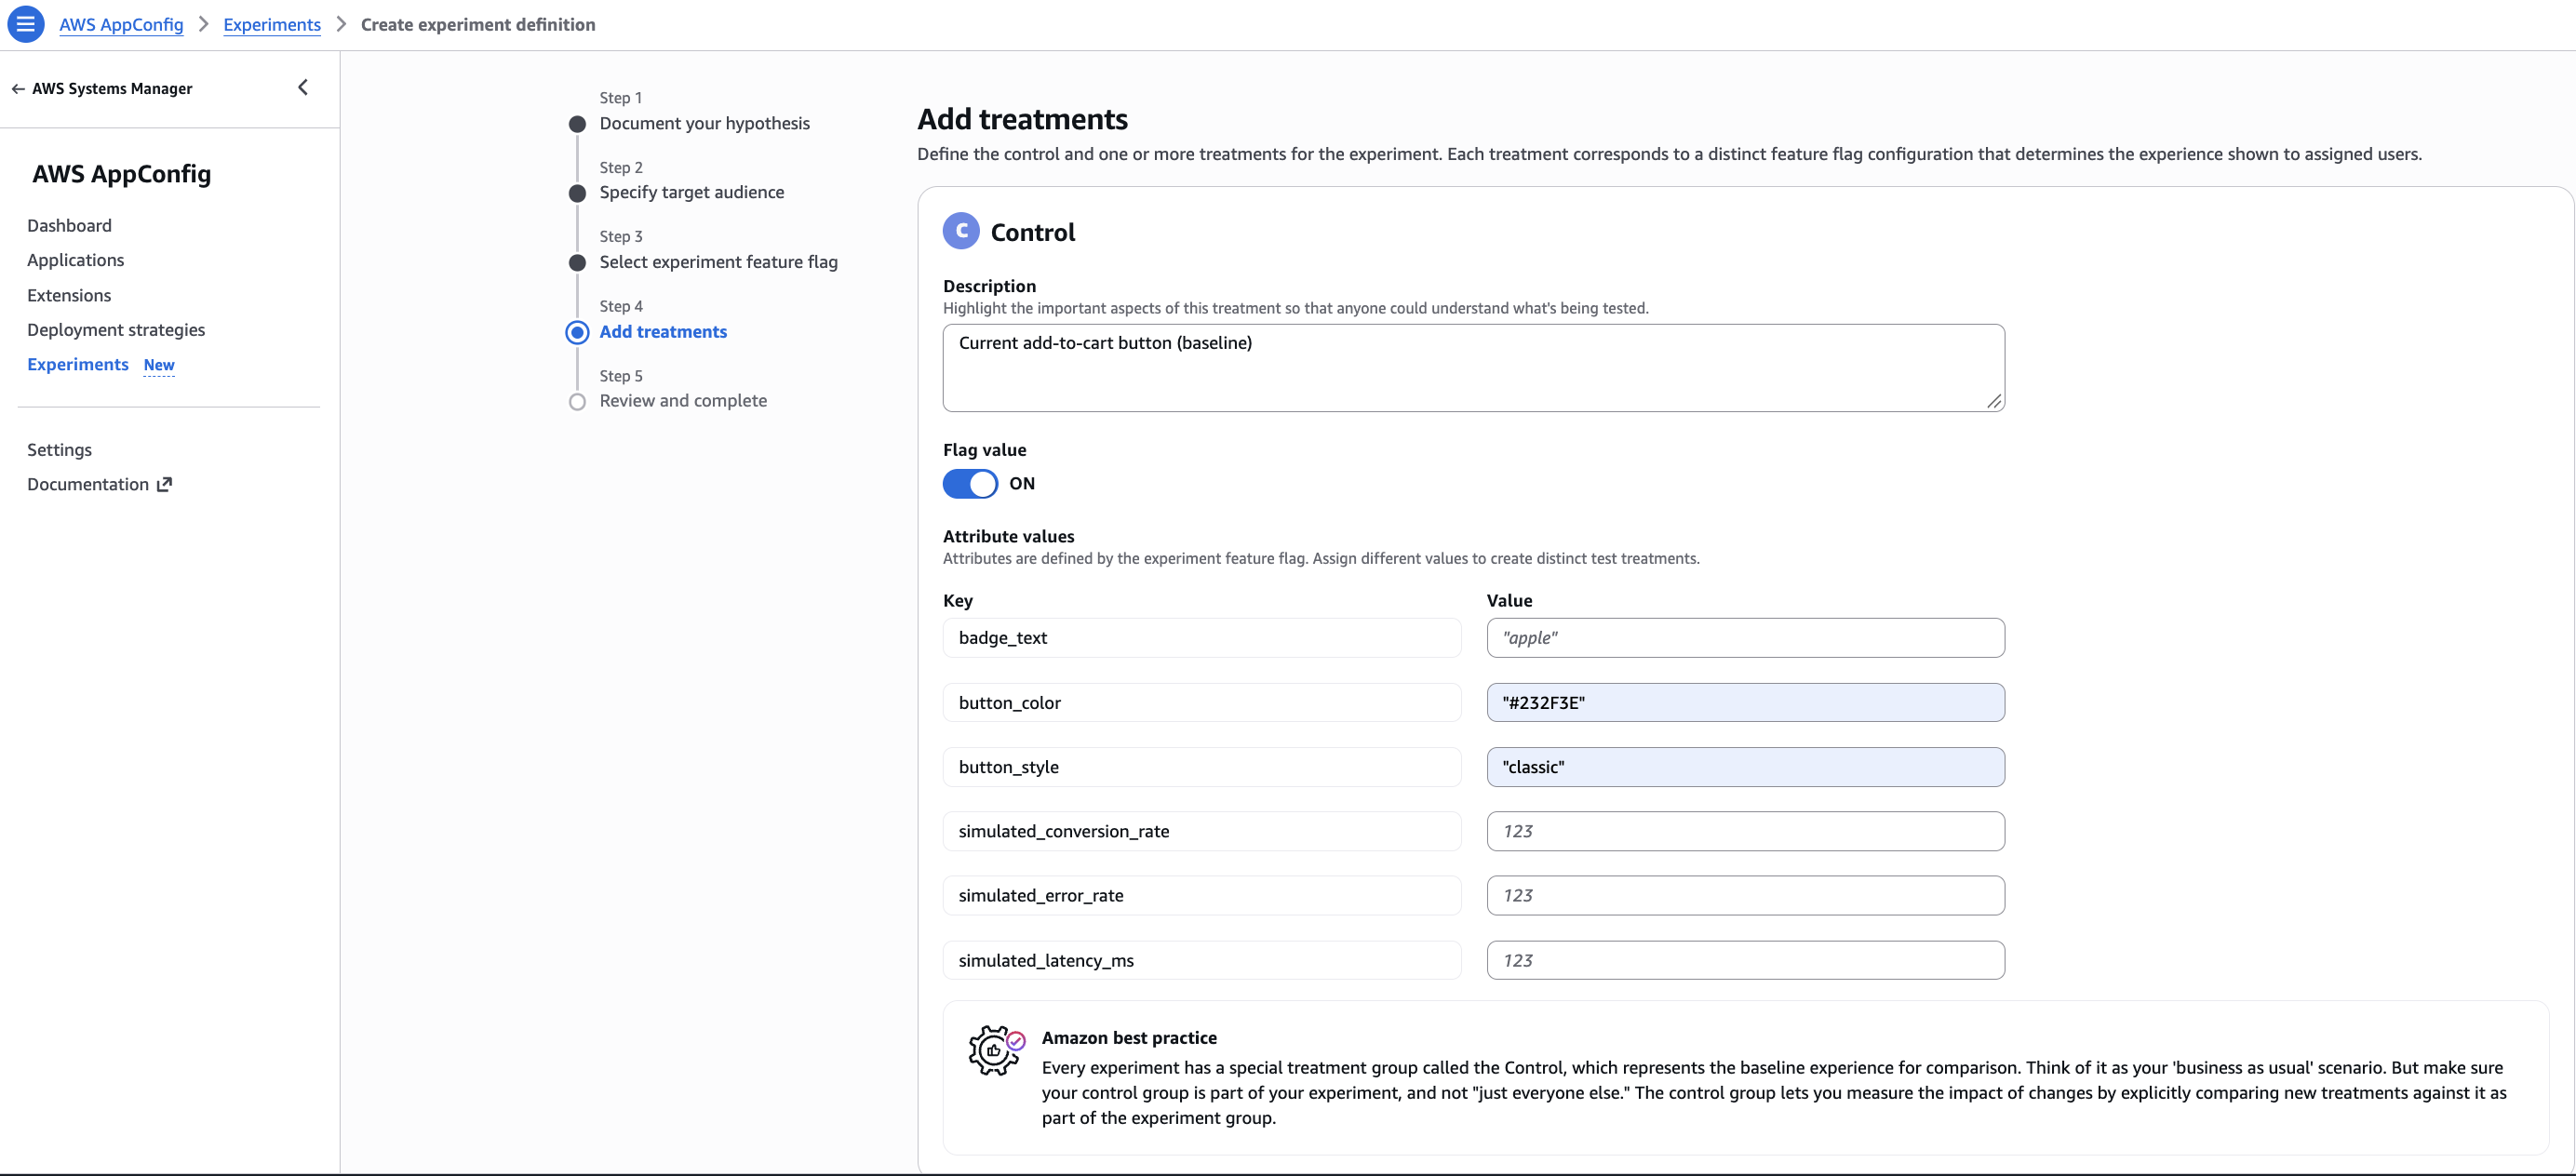 Figure 5: The control treatment, serving the current button
Then describe Treatment 1 the same way, setting button_style to prominent and button_color to #FF9900. Keep each treatment to a single change so the result stays interpretable. AppConfig allocates traffic evenly across treatments automatically — an even 50/50 here, which is also what maximizes statistical power. Advanced settings offers custom weights, but the even split is the recommended default.
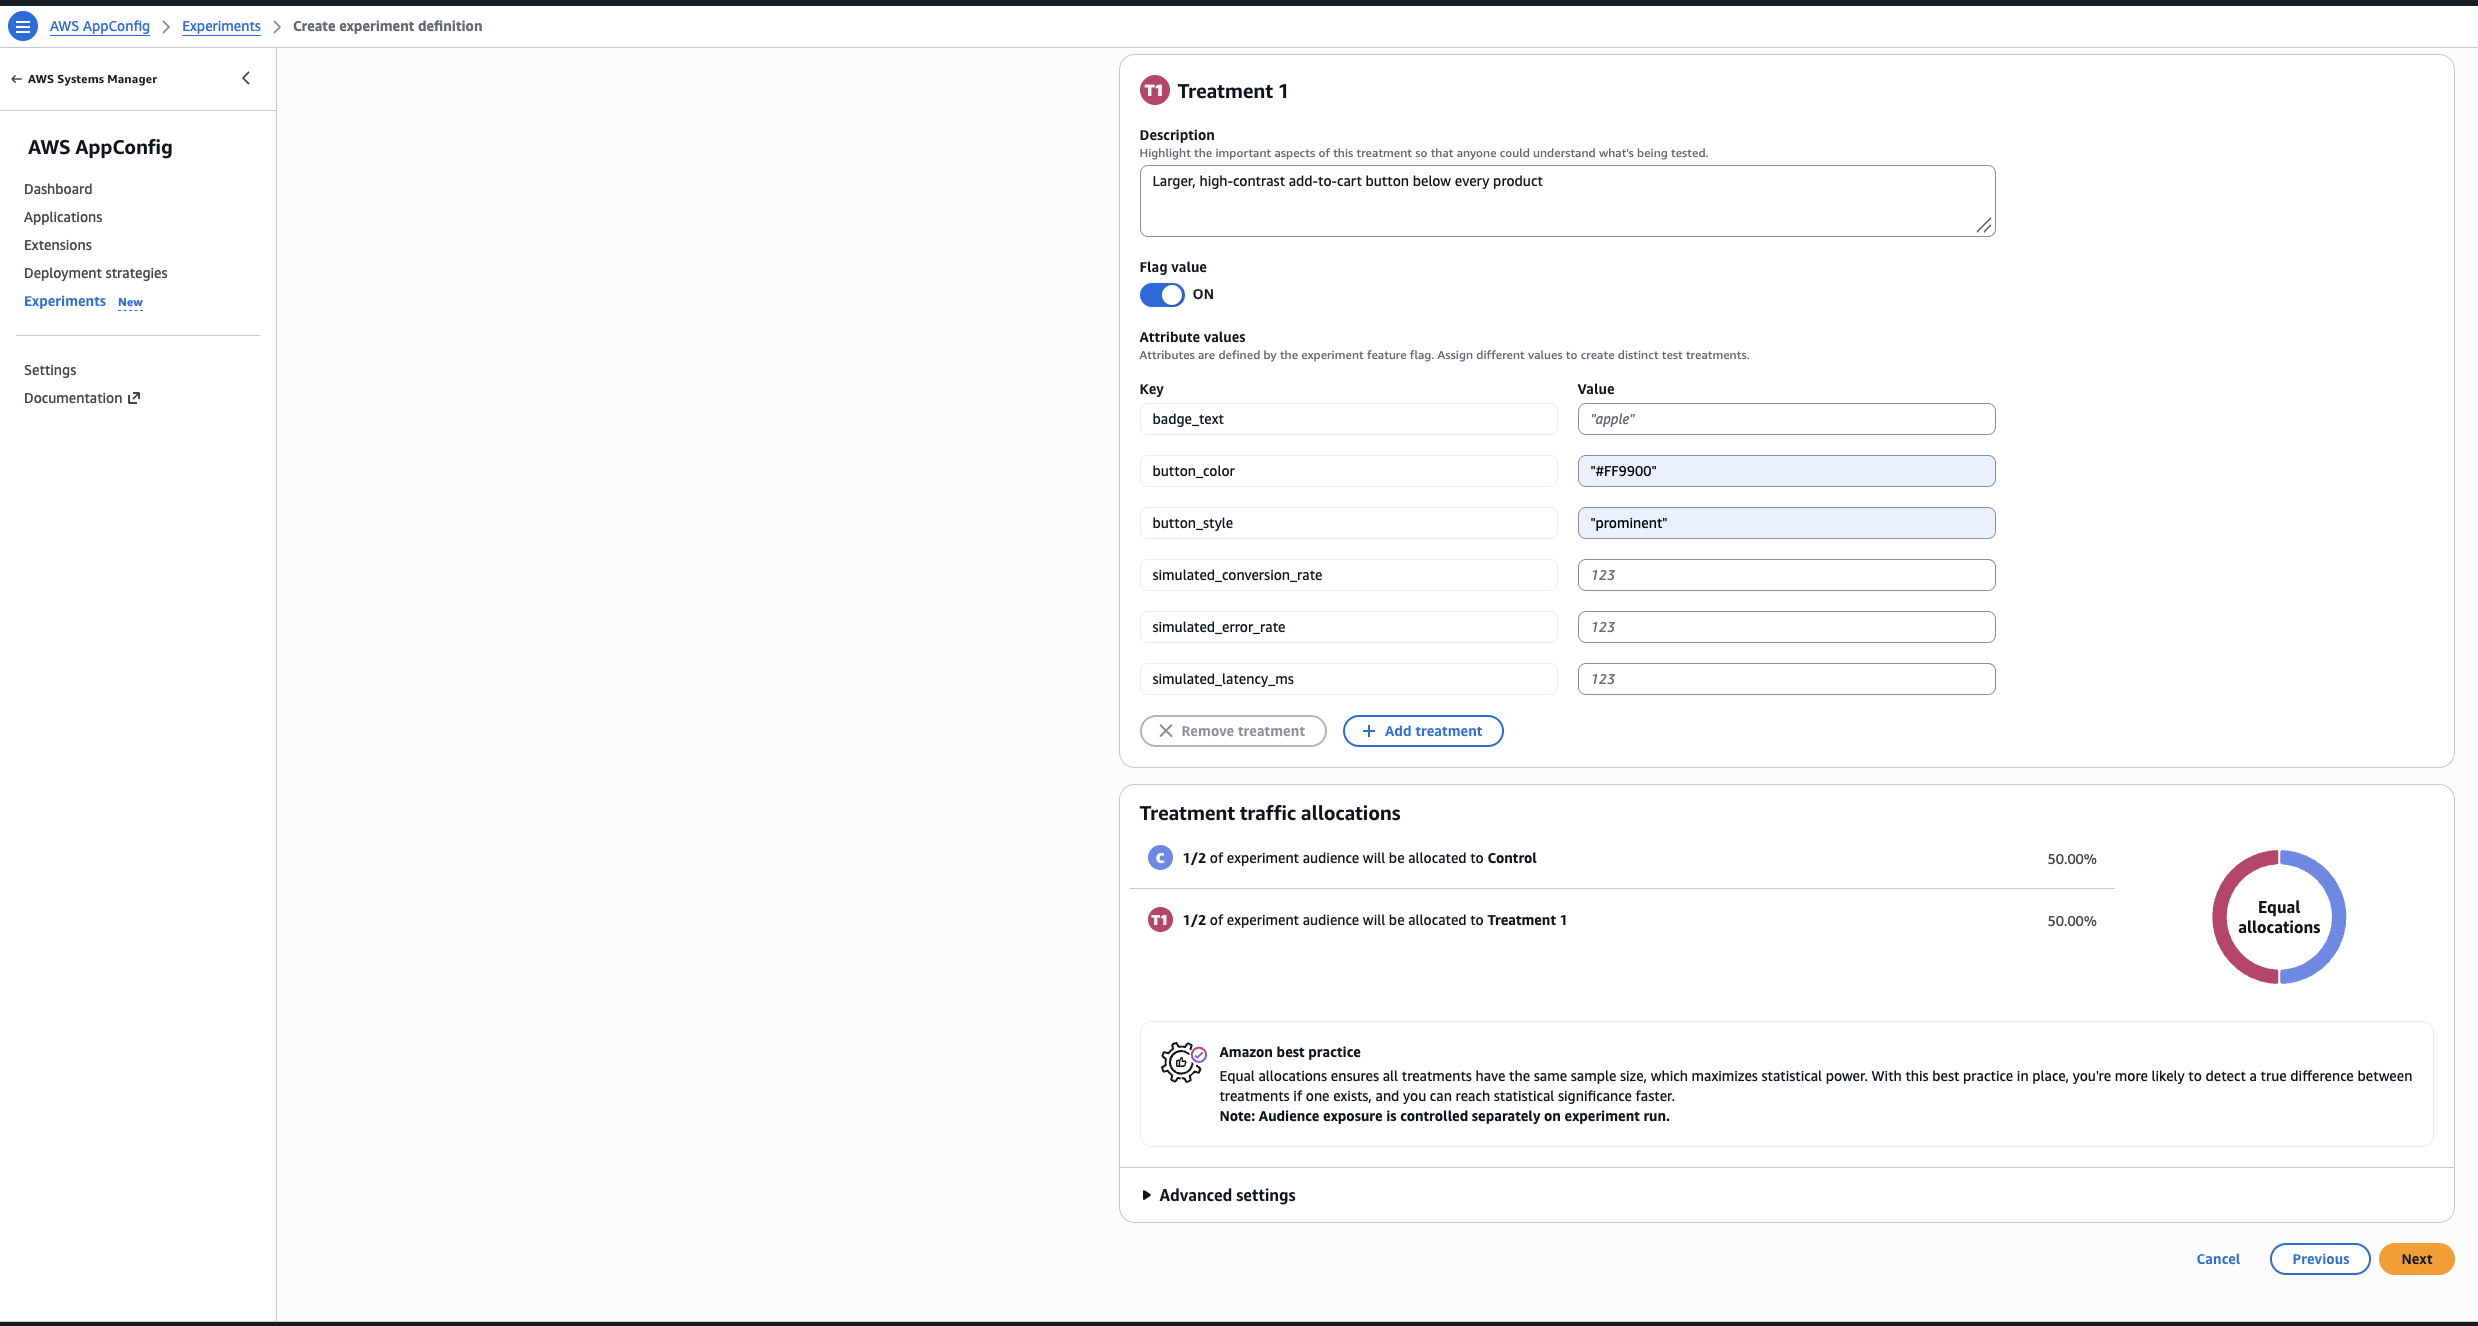 Figure 6: The treatment variant and the even traffic split
Step 5 — Review and complete. Check the summary and save. Users who aren’t assigned to the experiment continue to receive the default flag value deployed to their environment; only users in the control or a treatment are measured. AppConfig generates a treatment key for each treatment rather than deriving it from your description — it’s the value the Agent returns as _variant — and you use these keys later in treatment overrides and analysis queries.
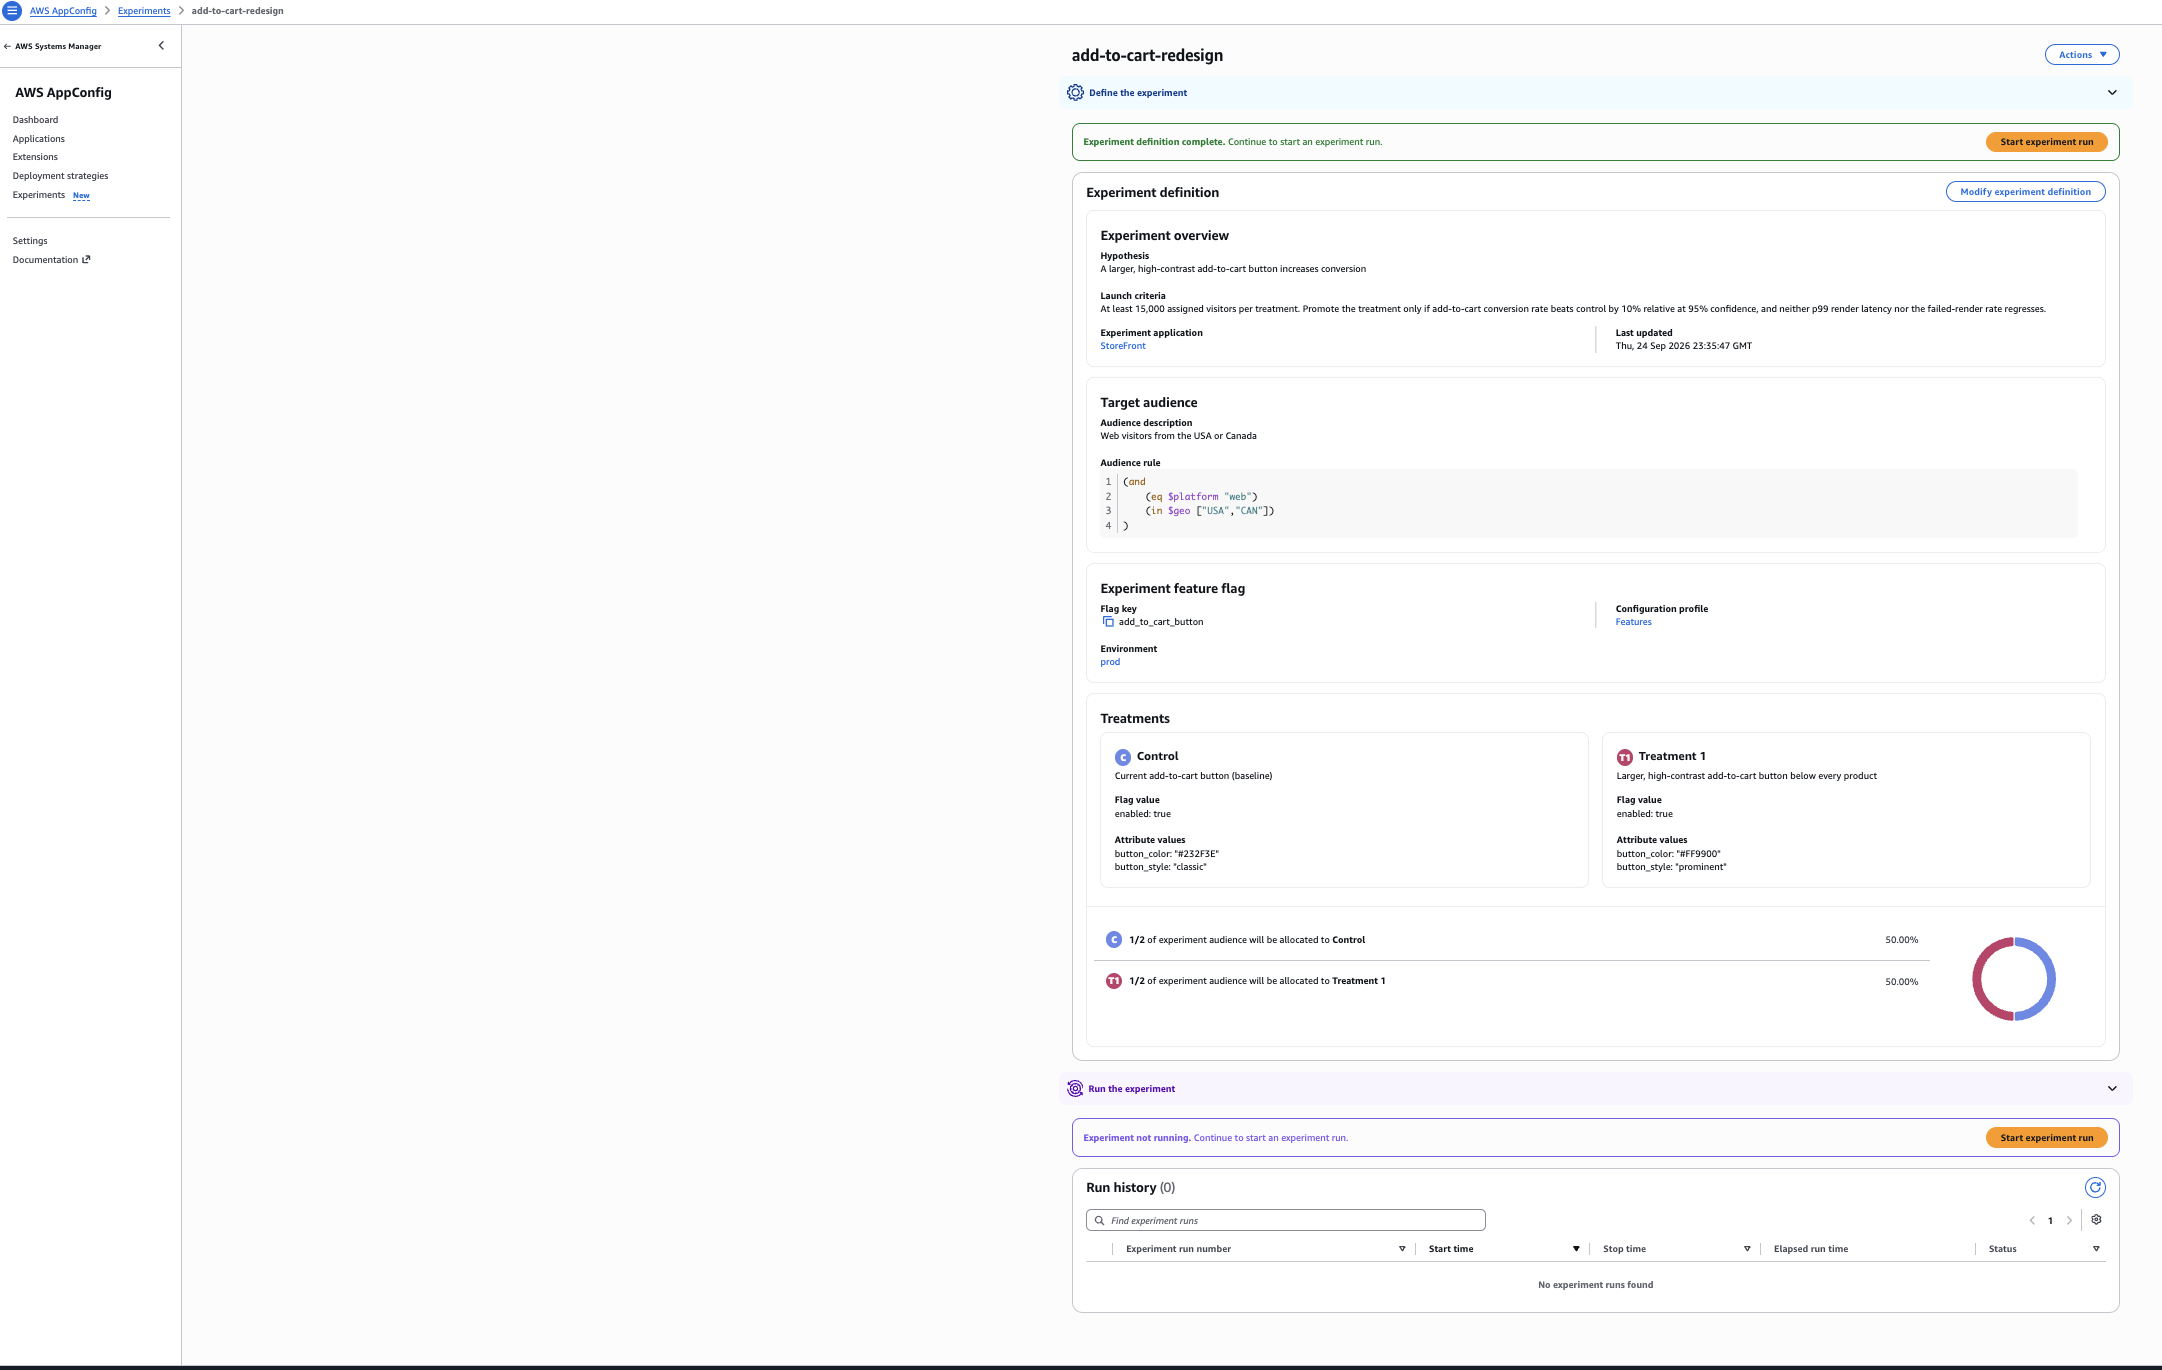 Figure 7: The saved experiment definition, ready to start a run
Retrieve the treatment (Node.js)
Your web tier asks the local AWS AppConfig Agent for the flag, passing the visitor identity as Entity-Id so the same visitor always gets the same experience, plus any context the audience rule needs. Request the flag by name with the flag parameter – if you request the whole configuration without it, no experiment assignment is recorded.
// Node.js 18 or later: fetch and Headers are globals, no imports needed.
const AGENT = "http://localhost:2772";
const PATH =
"/applications/StoreFront/environments/prod/configurations/Features";
export async function getButtonTreatment(visitorId, geo) {
// Multiple context values are sent as repeated "Context" headers,
// so use a Headers object with append (an object literal would drop
// all but the last "Context" entry).
const headers = new Headers();
headers.set("Entity-Id", visitorId); // consistent assignment for the run
headers.append("Context", "platform=web");
headers.append("Context", `geo=${geo}`);
const res = await fetch(`${AGENT}${PATH}?flag=add_to_cart_button`, {
headers,
});
// The request names a single flag, so the agent returns that flag’s
// object directly — there is no wrapper keyed by flag name:
// { "_variant": "__t1__", "enabled": true,
// "button_style": "prominent", "button_color": "#FF9900" }
return await res.json();
}
Capture treatment assignments (AWS AppConfig Agent)
The Agent logs each assignment for you – you don’t write the exposure-logging code. With EXPERIMENT_ASSIGNMENT_LOG_DESTINATION set to stderr, the Agent emits an assignment record the first time it assigns a visitor to a treatment, and that record’s timestamp is what makes clean post-exposure attribution possible later (see the Analyzing experiment results section). Your application’s job is narrower: keep producing the outcome data you already produce — add-to-cart clicks, checkouts, orders. The one thing to get right is the join key:as the Entity-Id, pass an identifier your outcomes dataset already carries — a customer ID, account ID, or session ID — so the records join with no change on your side.
# Amazon ECS, Amazon EKS, or Amazon EC2 - set this on the agent container
# or host. To collect the files yourself, use a base directory instead of
# "stderr", in the form file:/tmp/aws-appconfig/assignments/
EXPERIMENT_ASSIGNMENT_LOG_DESTINATION=stderr
# AWS Lambda - set this on the function. The extension reads the same
# setting under a prefixed name.
AWS_APPCONFIG_EXTENSION_EXPERIMENT_ASSIGNMENT_LOG_DESTINATION=stderr
# One record per assignment. Shown formatted for readability; the agent
# writes it on a single line so log shippers treat it as one event.
{
"type": "AWS.AppConfig.TreatmentAssignment",
"timestamp": "2026-07-29T16:27:55Z",
"region": "us-east-1",
"accountId": "111122223333",
"applicationId": "dn32rvt",
"experimentDefinitionId": "uioedbc",
"experimentRunNumber": "5",
"treatmentKey": "__t1__",
"entityId": "visitor-8f2c"
}
Note: The Agent’s ordinary application logs go to the same place as the assignment records, so your forwarder must match on type. Forward everything and you also forward application logs alongside the assignments and break the schema downstream.
Getting the assignment log from STDERR into Amazon S3
Three hops take you from the Agent’s standard error to something you can query. The runtime ships STDERR to Amazon CloudWatch Logs, which AWS Lambda and Amazon ECS do for you. A subscription filter forwards only the assignment records. Amazon Data Firehose writes them to Amazon S3. The first hop needs no work, so these two commands are the whole pipeline for the frontend example:
# 1. Firehose stream that lands assignment records in Amazon S3.
# The three processors are the step people miss - see the note below.
aws firehose create-delivery-stream \
--delivery-stream-name experiment-assignments \
--delivery-stream-type DirectPut \
--extended-s3-destination-configuration '{
"RoleARN": "arn:aws:iam::111122223333:role/FirehoseToS3",
"BucketARN": "arn:aws:s3:::my-experiment-data",
"Prefix": "assignments/",
"ProcessingConfiguration": {
"Enabled": true,
"Processors": [
{"Type": "Decompression",
"Parameters": [{"ParameterName": "CompressionFormat",
"ParameterValue": "GZIP"}]},
{"Type": "CloudWatchLogProcessing",
"Parameters": [{"ParameterName": "DataMessageExtraction",
"ParameterValue": "true"}]},
{"Type": "AppendDelimiterToRecord"}
]
}
}'
# 2. Forward only assignment records from the agent’s log group to that stream.
aws logs put-subscription-filter \
--log-group-name "/ecs/storefront" \
--filter-name "appconfig-treatment-assignments" \
--filter-pattern '{ $.type = "AWS.AppConfig.TreatmentAssignment" }' \
--destination-arn \
"arn:aws:firehose:us-east-1:111122223333:deliverystream/experiment-assignments" \
--role-arn "arn:aws:iam::111122223333:role/CWLtoFirehose"
Why the processors matter. CloudWatch Logs doesn’t forward events one at a time — it batches them, gzips each batch, and wraps it in an envelope. With no processing configured, your S3 objects hold compressed JSON, with each assignment record buried as an escaped string inside logEvents[].message.
Three built-in processors undo that. Decompression unzips the batch, CloudWatchLogProcessing with DataMessageExtraction discards the envelope and keeps only the message contents, and AppendDelimiterToRecord puts a newline between records so each lands on its own line. What arrives in Amazon S3 is then exactly the JSON the Agent emitted, one record per row. Leave Firehose compression off, because CloudWatch Logs has already gzipped the payload on the way in. To store Parquet, turn on Firehose data format conversion — it needs decompression enabled too.
Check it before you ramp. Treatment-assignment overrides produce no assignment records (overridden entities would pollute your results), so the 0% window can’t exercise this pipeline. Ramp to a small exposure instead, 1% is sufficient, let real assignments flow, and confirm a record lands under s3://my-experiment-data/assignments/. If the object is gzipped or the record is nested under logEvents, the processors are not configured correctly, and the analysis query later in this post will return nothing. Fix that before you ramp any further.
Amazon ECS without CloudWatch Logs. You can also skip the middle hop entirely. Run FireLens with Fluent Bit as the task’s log router, filter on the same type field, and write straight to Amazon S3. That is fewer moving parts and no envelope to unwrap, in exchange for owning the Fluent Bit configuration yourself.
Either route ends the same way: point an AWS Glue table at the S3 prefix, using the fields from the sample record above. That table is the treatment_assignments source the query in Analyzing experiment results reads, and joining it to your business data is then an ordinary SQL join on the identifier both sides already share. One naming detail to watch when you write that table definition: timestamp is a reserved word in Athena DDL, so the column has to be backtick-quoted there. Queries against the table need no quoting.
The same setup works for AI experiments. Prompt text is configuration rather than code, so a system prompt and its model parameters can live in flag attributes and be varied exactly like the button styling above — no redeploy to reword a prompt. Key the assignment on a session ID so a single conversation doesn’t switch prompts mid-thread, and treat token cost and latency as first-class guardrails, since a “better” prompt that quietly doubles spend isn’t a win.
Example 2 — Backend Cache TTL Experiment
Scenario. You suspect a longer cache TTL will cut database load without noticeably hurting freshness. This is a backend experiment, so the natural unit of assignment isn’t a user — it’s the service instance. Entity-Id set to the instance/task ID gives you stable, instance-level segmentation.
Example 1 used the console, which is the quickest way to get a first experiment running. This example uses the AWS CLI — the same definition expressed as JSON, which is what you’d reach for to script experiment creation or keep it in source control.
Create the experiment (CLI, instance-level segmentation)
aws appconfig create-experiment-definition \
--application-identifier "Catalog" \
--environment-identifier "prod" \
--configuration-profile-identifier "Features" \
--flag-key "cache_config" \
--name "cache-ttl-tuning" \
--hypothesis "A longer cache TTL reduces DB load without hurting freshness" \
--audience-rule '(eq $service "product-catalog")' \
--control file://control.json \
--treatments file://cache-treatments.json
Define the variations (JSON)
The control and each treatment are TreatmentInput objects: a FlagValue (the flag’s Enabled state plus its AttributeValues) and a Weight that sets traffic allocation. Where the console offered a plain Value field, the API takes a typed object — NumberValue for a number, StringValue for a string.
control.json:
{
"Description": "Current 60s cache TTL (baseline)",
"Weight": 50.0,
"FlagValue": { "Enabled": true, "AttributeValues": { "ttl_seconds": { "NumberValue": 60 } } }
}
cache-treatments.json:
[
{
"Description": "Increase cache TTL to 300s to reduce DB load",
"Weight": 50.0,
"FlagValue": { "Enabled": true, "AttributeValues": { "ttl_seconds": { "NumberValue": 300 } } }
}
]
Type numeric flag attributes deliberately. Define ttl_seconds as a number attribute on the feature flag with minimum and maximum constraints, and express it in whole seconds. AWS AppConfig validates attribute values when you save the configuration profile, so an out-of-range TTL fails there rather than in production.
Apply in an Amazon ECS service (Java / Spring Boot)
The AWS AppConfig Agent runs as a sidecar container in the same Amazon ECS task and is reachable at localhost:2772. Use the Amazon ECS task ID as the Entity-Id so each instance holds a consistent treatment for the whole run.
@Component
public class CacheConfigProvider {
private static final String AGENT_URL =
"http://localhost:2772/applications/Catalog/environments/prod"
+ "/configurations/Features?flag=cache_config";
private final HttpClient http = HttpClient.newHttpClient();
private final String entityId = resolveTaskId(); // instance-level unit
public CacheConfig getCacheConfig() throws Exception {
HttpRequest request = HttpRequest.newBuilder()
.uri(URI.create(AGENT_URL))
.header("Entity-Id", entityId)
.header("Context", "service=product-catalog")
.GET()
.build();
HttpResponse<String> response =
http.send(request, HttpResponse.BodyHandlers.ofString());
// single-flag request: no wrapper keyed by flag name
JsonNode flag = new ObjectMapper().readTree(response.body());
String treatment = flag.get("_variant").asText();
int ttl = flag.get("ttl_seconds").asInt();
emitMetrics(entityId, treatment); // the agent logs the assignment
return new CacheConfig(ttl, treatment);
}
private String resolveTaskId() {
// ECS injects ECS_CONTAINER_METADATA_URI_V4. A GET on
// $ECS_CONTAINER_METADATA_URI_V4/task returns the task metadata,
// whose TaskARN ends with the task ID.
try {
String metadataUri = System.getenv("ECS_CONTAINER_METADATA_URI_V4");
HttpRequest metadata = HttpRequest.newBuilder()
.uri(URI.create(metadataUri + "/task"))
.GET()
.build();
String body =
http.send(metadata, HttpResponse.BodyHandlers.ofString()).body();
String taskArn =
new ObjectMapper().readTree(body).get("TaskARN").asText();
return taskArn.substring(taskArn.lastIndexOf('/') + 1);
} catch (Exception e) {
// Fail fast. A hard-coded fallback would hand every task the same
// Entity-Id, put the whole fleet in one treatment, and quietly
// invalidate the experiment.
throw new IllegalStateException("Could not resolve the ECS task ID", e);
}
}
}
Your service then emits its guardrail metrics tagged with the same entity_id, so you can compare the 60s and 300s TTL directly.
Configuring Safety Guardrails
An experiment is a production change, so treat it like one: define what “bad” looks like before you ramp. Two controls limit the damage: gradual exposure keeps the exposure small, and Amazon CloudWatch alarms that tell you when to stop the run.
Start safe, ramp gradually. Start every run at 0% audience exposure. At 0%, no traffic is assigned unless you add treatment-assignment overrides — specific entity IDs pinned to a treatment. Use that window to validate the treatment before any real users are exposed: confirm the flag renders the expected experience for each treatment (including the control), confirm your outcome metric logging works, and share the overrides with stakeholders for a preview. For the full validation checklist, see About running and monitoring an experiment.
One thing that window can’t cover: overrides produce no assignment records, so the assignment log pipeline is only exercised once real traffic is being assigned. Clear the overrides, increase exposure in small steps, and treat that first step as the point to confirm assignment records are landing in your warehouse before you ramp further. Watch metrics at each level so a regression hits a small blast radius, not your full audience. Treat overrides as a validation tool, not audience targeting — leave production segmentation to the audience rule.
# Start the run at 0% exposure to validate before exposing any production users.
# Billing for the run begins with this call and continues until the run is stopped.
# The overrides pin named entities to a treatment so you can exercise the
# application path. Overridden entities are deliberately left out of the
# assignment log, so this window cannot validate that pipeline.
aws appconfig start-experiment-run \
--application-identifier "StoreFront" \
--experiment-definition-identifier "add-to-cart-redesign" \
--exposure-percentage 0 \
--treatment-overrides '[{"TreatmentKey": "__t1__",
"EntityIds": ["qa-jane", "qa-raj"]},
{"TreatmentKey": "__control__",
"EntityIds": ["qa-sam"]}]'
Define rollback triggers with Amazon CloudWatch alarms. Before you start a run, decide which metrics indicate unacceptable behavior and create Amazon CloudWatch alarms to watch them. Monitor those alarms throughout the run. If an alarm fires:
- Evaluate the impact and scope of the regression.
- Stop the experiment run — this ends audience exposure immediately and returns users to the currently deployed feature flag configuration.
Note that after you increase exposure, it cannot be decreased within the same run. This is intentional to prevent data corruption. To reduce exposure, stop the run and start a new one at a lower percentage.
# Example: alarm on elevated 5xx error rate to watch during the experiment.
# The dimension is not optional: without it the alarm watches a metric that
# never receives data, so it sits in INSUFFICIENT_DATA instead of firing.
aws cloudwatch put-metric-alarm \
--alarm-name "exp-add-to-cart-5xx" \
--namespace "AWS/ApplicationELB" \
--metric-name "HTTPCode_Target_5XX_Count" \
--statistic Sum \
--period 60 \
--evaluation-periods 3 \
--threshold 50 \
--comparison-operator GreaterThanThreshold \
--dimensions Name=LoadBalancer,Value=app/storefront-alb/50dc6c495c0c9188 \
--treat-missing-data notBreaching
A note on automatic rollback. AWS AppConfig environment monitors (alarms associated with an AppConfig environment) automatically roll back an unhealthy configuration deployment. They are scoped to deployments, not experiment runs:
- While a run is active, AWS AppConfig manages the flag value for assigned entities. Ending exposure requires an explicit stop-experiment-run call.
- Keep the monitors in place — you still deploy configurations during and after a run (promoting the winner is a deployment).
- Treat the alarm-and-stop-the-run pattern above as the guardrail for the experiment itself.
Choose guardrail metrics by experiment type. The right alarm depends on what you’re testing:
- Frontend/UI: page load time, client-side error rate, rendering failures, 5xx rate. A conversion lift means nothing if the page is throwing errors.
- Backend: p99 latency, throughput, error rate, and resource-specific signals (for the cache example, cache hit ratio and database load). A treatment can look neutral on business metrics while degrading system health.
Operational hygiene. Follow these rules to keep your results valid:
- Do not change treatment behavior mid-run — stop, modify, and start a new run instead, or you invalidate the data.
- Avoid shipping unrelated changes or overlapping experiments on the same audience while a run is active.
- Monitor operational metrics alongside your experiment metrics — a positive result on the headline metric can still hide a latency or error regression.
Analyzing Experiment Results
AWS AppConfig provides aggregate real-time metrics — exposure levels, treatment allocation, traffic distribution — but it doesn’t compute your results. Your metric definitions and raw data stay in your warehouse (Amazon S3 + Amazon Athena, Amazon Redshift, Snowflake, Databricks, or other) where you control exactly how success is measured.
The core principle: post-exposure attribution. Only count a user’s outcomes after the moment they were assigned to their treatment. Events before assignment don’t attribute to the experiment and bias your results. Concretely, you join your metric events to the Agent’s assignment records on entity ID, and keep only metric events whose timestamp is at or after that entity’s assignment timestamp.
Assuming the Agent’s assignment records and your metric events have landed in Amazon S3 and are queryable through Amazon Athena:
WITH assignments AS (
SELECT
entityid AS entity_id,
treatmentkey AS treatment,
MIN(from_iso8601_timestamp(timestamp)) AS assigned_at
FROM treatment_assignments -- AWS AppConfig Agent records from STDERR
WHERE type = 'AWS.AppConfig.TreatmentAssignment'
AND experimentdefinitionid = 'uioedbc'
AND experimentrunnumber = '5'
GROUP BY entityid, treatmentkey
),
attributed_conversions AS (
SELECT
a.treatment,
a.entity_id,
COUNT(m.entity_id) AS conversions
FROM assignments a
LEFT JOIN experiment_events m -- your existing outcomes table
ON m.entity_id = a.entity_id -- or m.customer_id, whichever column it already has
AND m.event_type = 'conversion'
-- post-exposure attribution: outcomes only count after assignment
AND from_iso8601_timestamp(m.timestamp) >= a.assigned_at
GROUP BY a.treatment, a.entity_id
)
SELECT
treatment,
COUNT(DISTINCT entity_id) AS assigned_users,
SUM(CASE WHEN conversions > 0 THEN 1 ELSE 0 END) AS converters,
ROUND(
SUM(CASE WHEN conversions > 0 THEN 1 ELSE 0 END) * 100.0
/ COUNT(DISTINCT entity_id), 2
) AS conversion_rate_pct
FROM attributed_conversions
GROUP BY treatment
ORDER BY conversion_rate_pct DESC;
This returns assigned users, converters, and conversion rate per treatment so you can compare each treatment against the control.
The only requirement on your outcomes data is that it carries the same identifier you passed as Entity-Id and a timestamp. Whatever table structure, column names, or warehouse you already use works — the join is on that shared identifier with a timestamp filter.
Adapting the query for other metrics. The assignments CTE and the post-exposure join are reusable; only the metric aggregation changes:
- Backend/cache experiments:
aggregate AVG(db_query_count), cache hit ratio, orapprox_percentile(latency_ms, 0.99)per treatment to confirm the longer TTL cut load without hurting p99. - Continuous metrics generally: replace the converter count with
AVG(...),SUM(...), orapprox_percentile(...)over the attributed rows.
Before you declare a winner, check three things. First, confirm each treatment reached the sample size you set in your launch criteria. Second, confirm the split matches the configured weights; a 50/50 experiment that lands at 46/54 points to an assignment or logging bug, not a result. Third, run a significance test in your statistics tooling, such as a two-proportion z-test for conversion rate. Act on the result only when all three checks pass.
Stopping an experiment and promoting a winner
Stop an experiment run when you have a clear result, when something goes wrong, or when priorities shift. Stopping ends exposure immediately. AWS AppConfig stops managing the flag and your application serves whatever configuration is currently deployed to the environment.
Promoting the winner without a gap. The order matters. If you stop first, users briefly revert to the pre-experiment default while you redeploy. To avoid that:
- While the experiment is still running, update the feature flag to match the winning treatment and deploy it. Assigned entities see no change — AWS AppConfig is still serving them their treatment.
- Stop the experiment. AppConfig releases the flag, and your application picks up the configuration you just deployed: the winner, at 100%, with no gap.
Mind what you change in step 1. Add the winning values as a variant gated by the same audience rule the experiment uses, and nobody sees a change until you stop the run. Change the flag’s default value instead and everyone outside the experiment’s audience picks up the winning value the moment the deployment lands — choose this when you want a full release.
Cost considerations and cleaning up
You pay for experiment-run hours. Billing starts when you call start-experiment-run until you stop the run. Defining experiments and treatments is free.
What drives your bill:
- Run duration. Stop the run once you have enough data to make a decision.
- Concurrent runs. Each active run bills independently. Three simultaneous experiments means three times the hourly rate.
- Your data pipeline. AWS AppConfig doesn’t charge for the assignment records the Agent emits; the pipeline that carries them does. CloudWatch Logs, Amazon Data Firehose, Amazon S3, Athena, and your guardrail alarms each bill at their normal rates — see each service’s pricing page, and AWS Systems Manager Pricing for experiment runs.
To keep costs down, estimate sample size upfront so you know roughly how long a run needs to last, and validate what you can in the 0% window before you ramp. The assignment-log pipeline is the exception: it produces records — and bills — only once real traffic is being assigned.
See AWS AppConfig experimentation pricing details here.
Clean up what you created. The run-hour charge stops only when you stop the run, and the assignment pipeline keeps billing for as long as it stays in place. When you have finished with the examples in this post, remove what you created in this order:
- Stop any running experiment run. Exposure ends immediately and the run-hour charge stops. If you are promoting a winner, deploy the winning flag value first, as described above.
- Delete the experiment definitions for both examples. ARCHIVE hides a definition but keeps its run history; DESTROY removes the definition and the history permanently.
- Take down the assignment pipeline and the alarms: the Amazon CloudWatch Logs subscription filter, the Amazon Data Firehose delivery stream, and the guardrail alarms. Then unset EXPERIMENT_ASSIGNMENT_LOG_DESTINATION on the Agent and redeploy so it stops writing assignment records.
- Decide what to do with the data. The assignment records in Amazon S3, the AWS Glue table over them, and your Athena query-results location all keep incurring storage charges. Delete them unless you want to keep the audit trail, along with the IAM roles and the log group you created only for this walkthrough.
Leave the feature flag and its configuration profile in place if your application still reads them — deleting the flag removes configuration your code depends on. Only the experiment definition has to go.
1. Stop the run – this ends exposure and the run-hour charge.
aws appconfig stop-experiment-run \
--application-identifier "StoreFront" \
--experiment-definition-identifier "add-to-cart-redesign" \
--run 5
2. Delete both definitions. Use ARCHIVE instead of DESTROY to keep the run history for future reference
# the run history for future reference.
aws appconfig delete-experiment-definition \
--application-identifier "StoreFront" \
--experiment-definition-identifier "add-to-cart-redesign" \
--delete-type DESTROY
aws appconfig delete-experiment-definition \
--application-identifier "Catalog" \
--experiment-definition-identifier "cache-ttl-tuning" \
--delete-type DESTROY
3. Remove the assignment pipeline and the guardrail alarm.
aws logs delete-subscription-filter \
--log-group-name "/ecs/storefront" \
--filter-name "appconfig-treatment-assignments"
aws firehose delete-delivery-stream \
--delivery-stream-name "experiment-assignments"
aws cloudwatch delete-alarms --alarm-names "exp-add-to-cart-5xx"
4. Optional and irreversible – drop the queryable copy of the assignment data. Substitute your own AWS Glue database name.
aws glue delete-table \
--database-name "experiments" \
--name "treatment_assignments"
aws s3 rm "s3://my-experiment-data/assignments/" --recursive
Conclusion
In this post, we took a single idea — “we have a theory, but no production evidence” — and turned it into two concrete experiments using AWS AppConfig experimentation: a frontend button redesign and a backend cache-TTL change. In each case, we created an experiment definition and expressed the control and treatments as feature-flag variants. We delivered them through the Agent with gradual exposure and alarm guardrails, and analyzed results with post-exposure attribution in our own data warehouse.
Experimentation becomes part of the AWS AppConfig workflow you already use, and you keep ownership of your metrics, analysis, and data. You pay per experiment-run hour, so your cost grows with how much you test.
To go deeper, start with the AWS AppConfig experimentation documentation, review running and monitoring an experiment for guardrail best practices and try the hands-on workshop.
If you have questions or feedback, leave a comment on this post. To get started, open the AWS AppConfig console and create your first experiment definition.