Post Syndicated from Adam Duffield original https://aws.amazon.com/blogs/compute/improving-network-observability-with-new-aws-outposts-racks-network-metrics/
With AWS Outposts racks, you can extend AWS infrastructure, services, APIs, and tools to on-premises locations. Providing performant, stable, and resilient network connections to both the parent AWS Region as well as the local network is essential to maintaining uninterrupted service.
The release of two new Amazon CloudWatch metrics, VifConnectionStatus and VifBgpSessionState, gives you greater visibility into the operational status of the Outpost network connections. In this post, we discuss how to use these metrics to quickly identify network disruptions, using additional data points that can help reduce time to resolution.
Outposts network connectivity overview
When connecting an Outposts rack to your chosen data center location, network connections are made between the Outpost Networking Devices (ONDs) and Customer Network Devices (CNDs). These network connections support both the Service Link connectivity back to the chosen anchor Region and connectivity to the on-premises local network through the Local Gateway. First-generation Outposts racks include a minimum of two network devices to provide resilience, with second-generation Outposts racks including four network devices.
Virtual interfaces (VIFs) are used to establish IP network connectivity between the Outpost and CNDs, using Border Gateway Protocol (BGP) for dynamic routing. You can view the details for these VIFs on the Outposts console by choosing Link aggregation groups (LAGs) in the navigation pane and drilling down to find the specific service link and local gateway VIF information. For each connection between an OND and CND, two BGP sessions are established: one to support service link traffic and the other to support local gateway traffic.
The following diagram shows an example of this connectivity for a first-generation Outposts rack.
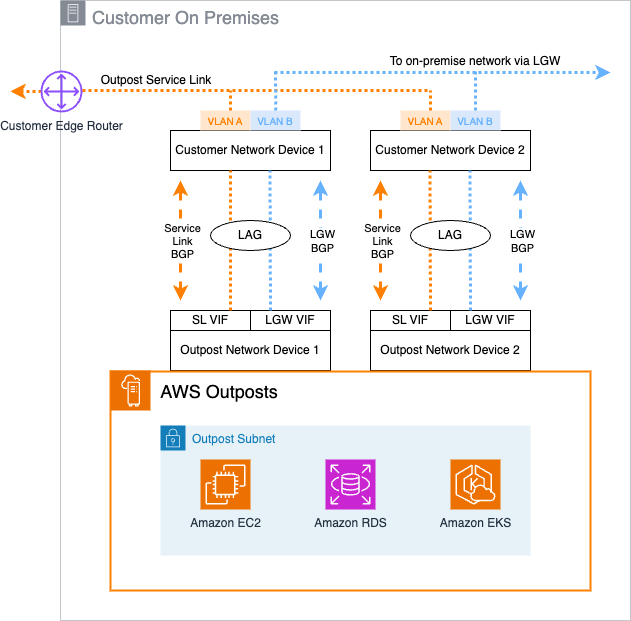
Figure 1: First-Generation Outposts Rack network connections
In this configuration, a total of four VIFs are configured into two link aggregation groups (LAGs): one on each OND for the service link and local gateway VIFs.
Understanding the new CloudWatch metrics for Outposts
Observability into the operational status of Outposts rack, including the status and performance of network connectivity, is important for you to be able to quickly identify and investigate potential issues. With the addition of the VifConnectionStatus and VifBgpSessionState Outposts metrics in CloudWatch, you have greater visibility into the connection status of the Outposts rack to your CNDs. The VifConnectionStatus metric is provided on a per-VIF level, available for both the local gateway and service link VIFs. It provides an indication on the status of the VIF using two possible values:
- A value of 1 indicates that the VIF is successfully connected to the CND with established BGP sessions and able to transmit traffic
- A value of 0 indicates that the VIF is not in an operational state due to an underlying issue
The VifBgpSessionState metric goes deeper into the BGP connectivity status between each Outposts VIF and CND. A BGP session can be in one of multiple states, each providing insight into where a potential issue might be. To reflect this, the CloudWatch metric value shown relates to the following BGP states:
- IDLE – The initial state; the ONDs are waiting for a start event
- Connect – The Outposts rack is waiting for the TCP connection to be complete
- Active – The Outposts rack is trying to initiate a TCP connection
- OpenSent – The router has sent an OPEN message and is waiting for a response
- OpenConfirm – The router has received an OPEN message and is waiting for a KEEPALIVE response
- Established – The BGP connection is fully established and the ONDs and CNDs can exchange routing information
With these metrics now available in CloudWatch, you can configure Amazon CloudWatch alarms to alert when the metric values indicate potential issues. You can combine existing CloudWatch metrics for Outposts racks with these new metrics to give additional context and visibility into network connectivity status.
Using CloudWatch metrics to investigate Outposts network connectivity issues
In the event of network connectivity issues, it’s important to understand how to use these metrics to assist with investigations and understand potential causes when seeing network impairment. To start with, the Configuration state of the VIFs should be checked. For each VIF, there are four possible states:
- Pending – A VIF is in this state from the time that it is created within a VIF group until the VIF becomes active on the OND
- Available – A VIF is active on ONDs
- Deleting – A VIF is in this state immediately after requesting deletion
- Deleted – A VIF is deleted
To check the state of an individual VIF on the Outposts console, choose Networking followed by Link aggregation groups (LAGS) in the navigation pane. The service link and local gateway VIFs associated with a specific LAG are shown, and when you choose a specific LAG, the configuration state of the associated VIFs are visible.
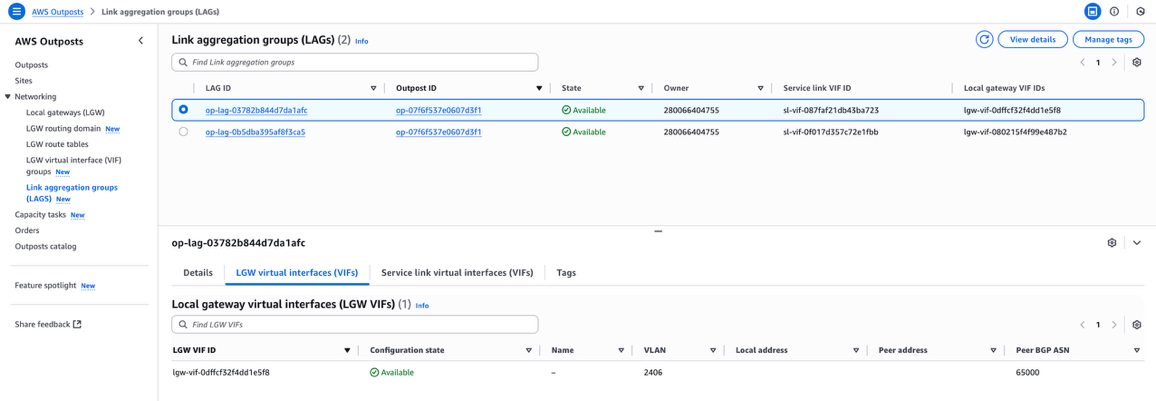
Figure 2: AWS Outposts console showing VIF configuration details
You can also retrieve these details programmatically. For example, use the following AWS Command Line Interface (AWS CLI) command to specifically check the configuration state of a service link VIF with ID sl-vif-087faf21db43ba723:
After confirming the Configuration state, you can use the VifConnectionStatus metric to determine the network connectivity status of individual VIFs. When operating and processing traffic in a healthy state, the value of this metric is 1. If this value changes to 0, it indicates a connectivity problem for that VIF between the Outpost and CNDs.
To further understand the potential cause of the VifConnectionStatus value, you can use the VifBgpSessionState metric. Under normal operational status, this metric value is 6, indicating that the BGP session is established and traffic can be sent and received. However, if this metric value changes to 1–5, then it is indicative of an issue. To start investigating the cause of this, you should review VIF configuration both on the Outposts console and programmatically. This includes the values set on the OND for VLAN, local and peer addresses, and BGP ASN. These values can be validated against the configuration on your on-premises CNDs if required. Furthermore, you can use the VifBgpSessionState metric value to determine the potential cause:
- If the value is 1, validate the values for BGP ASN and peer addresses
- If the value is 2, this might indicate port or IP address issues
- If the value is 3, this might indicate BGP version mismatches
- If the value is 4 or 5, this refers to networking path problems
By using a combination of these metrics, you can gain a clearer understanding of the potential network issue without having to engage with AWS or third-party support teams.
You can view and query these metrics on the CloudWatch console. In the navigation pane, choose All metrics, followed by Outposts under the AWS namespaces section. The Outposts namespace can only be viewed by the Outposts owner account, unless CloudWatch cross-account observability is configured. The new VifConnectionStatus and VifBgpSessionState metrics can be found under the OutpostsID, VirtualInterfaceGroupId, VirtualInterfaceId dimension.
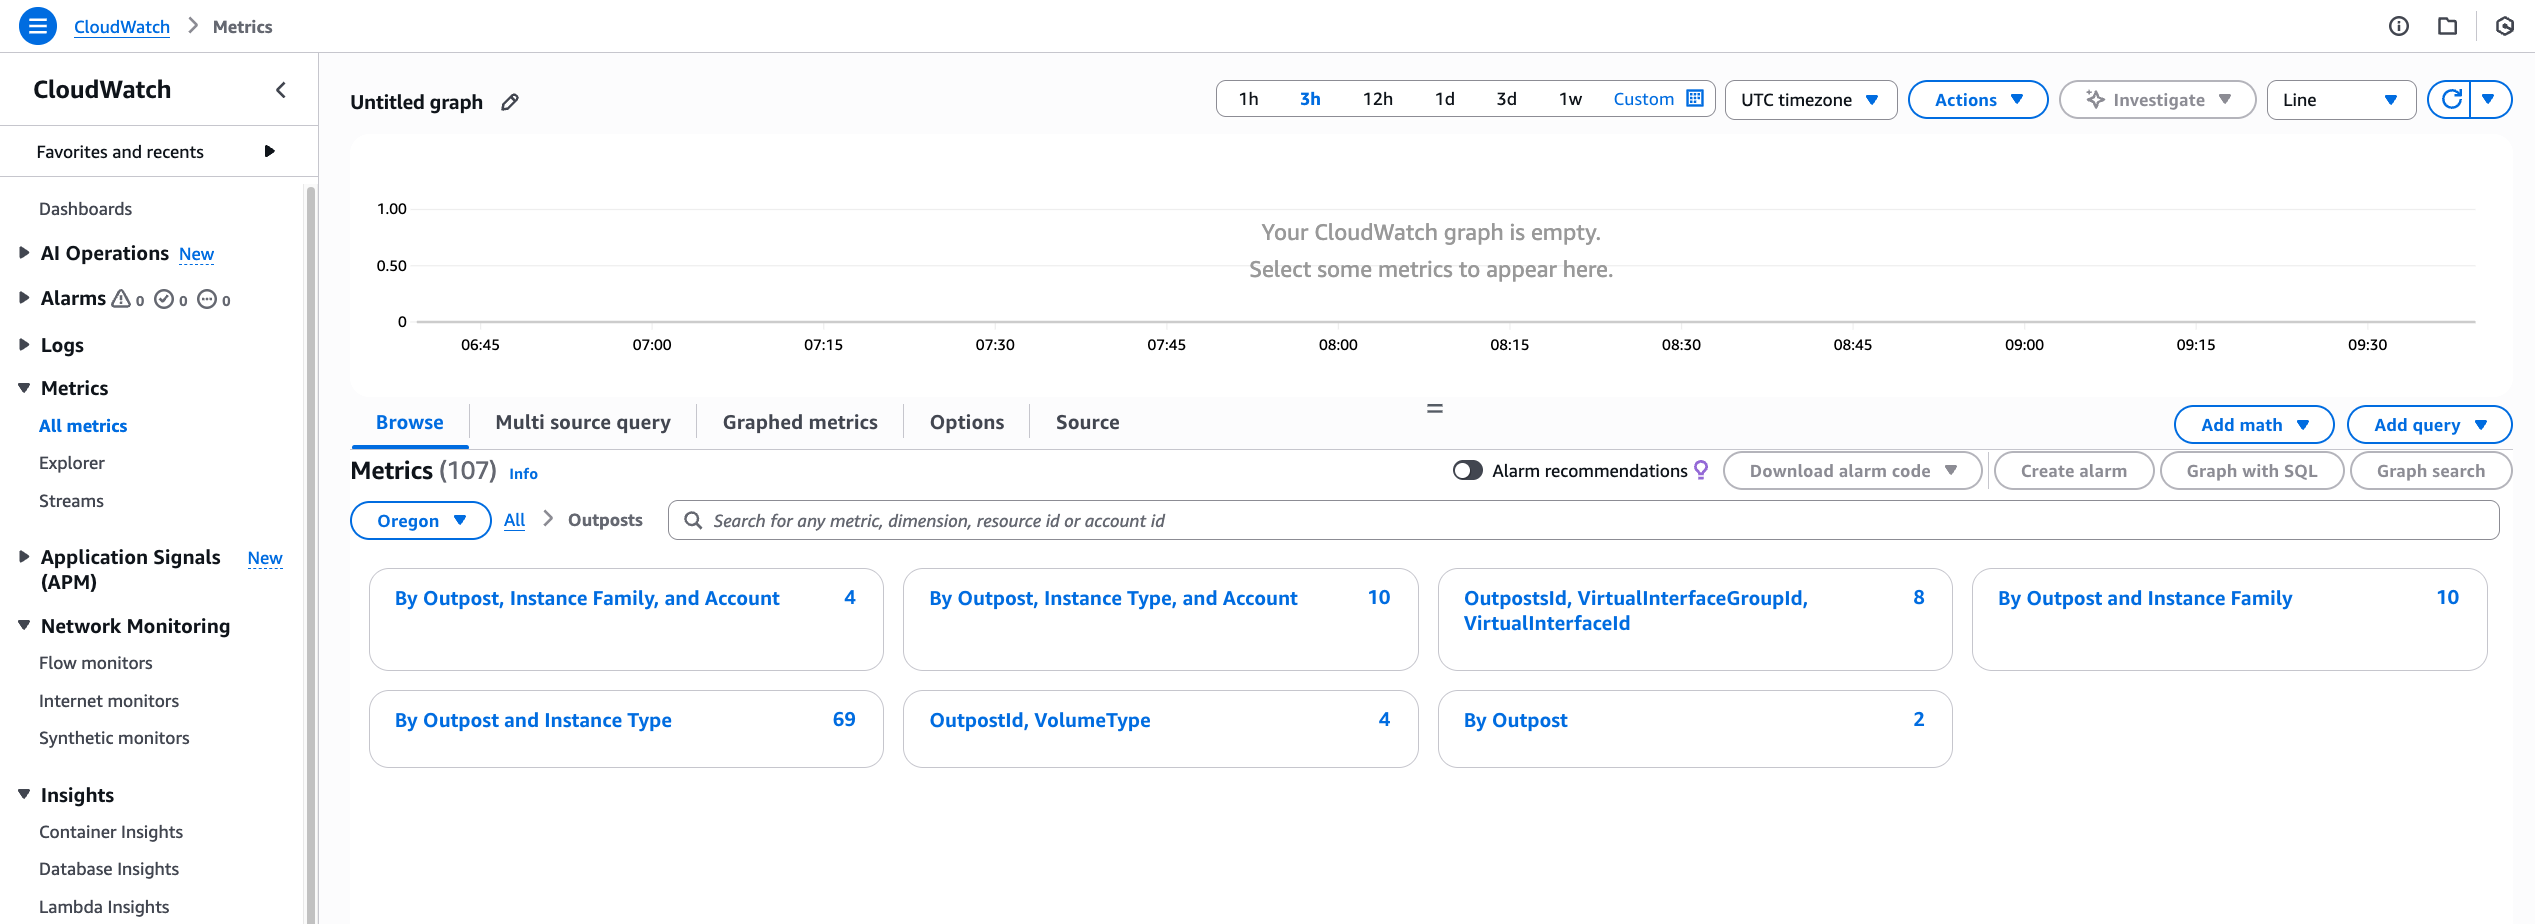
Figure 3: Amazon CloudWatch metrics for AWS Outposts
For more information on working with metrics, see Metrics in Amazon CloudWatch. For creating alerts based upon these new metrics and their values, refer to Using Amazon CloudWatch alarms.
The resilient design of using multiple ONDs for both service link and local gateway traffic allows workloads to continue to run in the event of connectivity issues for single VIFs. For example, a single service link VIF might report as being down, but the remaining service link VIFs might be unaffected and remain available. In this scenario, the service link itself would remain functional and connected, albeit with potentially lower resilience and capacity. This can be validated throught the ConnectedStatus metric which would have a value of 1.
Conclusion
This post provided details on the newly released CloudWatch metrics for Outposts racks, VifConnectionStatus and VifBgpSessionState, and how you can use them to investigate potential connectivity issues. For more information on Outposts rack networking patterns, see the Networking section of the Outposts High Availability Design and Architecture Considerations whitepaper. For more information about additional CloudWatch metrics that are available, check out the CloudWatch metrics for AWS Outposts documentation for second-generation Outposts racks and first-generation Outposts racks.
Reach out to your AWS account team, or fill out this form to learn more about observability for Outposts.


