All posts by Amit Chowdhury

Build and optimize real-time stream processing pipeline with Amazon Kinesis Data Analytics for Apache Flink, Part 2

Post Syndicated from Amit Chowdhury original https://aws.amazon.com/blogs/big-data/part2-build-and-optimize-real-time-stream-processing-pipeline-with-amazon-kinesis-data-analytics-for-apache-flink/

In Part 1 of this series, you learned how to calibrate Amazon Kinesis Data Streams stream and Apache Flink application deployed in Amazon Kinesis Data Analytics for tuning Kinesis Processing Units (KPUs) to achieve higher performance. Although the collection, processing, and analysis of spiky data stream in real time is crucial, reacting to the spiky data is equally important in many real-life situations as derived insights diminish with time.

In order to build a highly responsive scalable streaming application, we need to auto-scale both Kinesis Data Streams and Kinesis Data Analytics application based on incoming data streams. Refer this blog to know how to  easily monitor and automatically scale your Apache Flink application with Amazon Kinesis Data Analytics. Use Kinesis Scaling Utility, which is designed to give you the ability to scale Amazon Kinesis Streams in the same way that you scale EC2 Auto Scaling groups – up or down by a count or as a percentage of the total fleet. You can simply scale to an exact number of Shards.

In this post, we dive deep into important metrics to generate meaningful insights about the health and performance of the Amazon Kinesis Data Analytics for Apache Flink application. We will also walk you through steps to build a fully automated, scalable, and highly available pipeline to handle streaming data scaling in and out for both the Kinesis data stream (based on incoming records) and Kinesis data analytics application (by calibrating KPUs and parallelism). You use AWS Managed Services to reduce operational overhead compared to the manual approach of scaling the streaming application. Because this is a continuation of the previous post, make sure to walk through Part 1 as a prerequisite before deploying the automated pipeline code in this post.

Deploy the advanced monitoring and scaling architecture

This section uses an AWS CloudFormation template to build an advanced monitoring dashboard to capture vital metrics data. You also create an advanced scaling environment to auto scale the Kinesis data stream and Kinesis data analytics application, which scales both services in and out depending on the volume of spiky data. Furthermore, we use managed services for better operational efficiency. The template builds the following architecture.

The CloudFormation template includes the following components:

  • An advanced Amazon CloudWatch dashboard
  • Two CloudWatch alarms for scaling your Kinesis Data Analytics for Apache Flink application
  • Two CloudWatch alarms for scaling your Kinesis Data Streams
  • Accompanying auto scaling policy actions in these alarms
  • An Amazon API Gateway endpoint for triggering AWS Lambda
  • A Lambda function responsible for handling the scale-in and scale-out functions

These components work in tandem to monitor the metrics configured in the CloudWatch alarm and respond to metrics accordingly.

To provision your resources, complete the following steps:

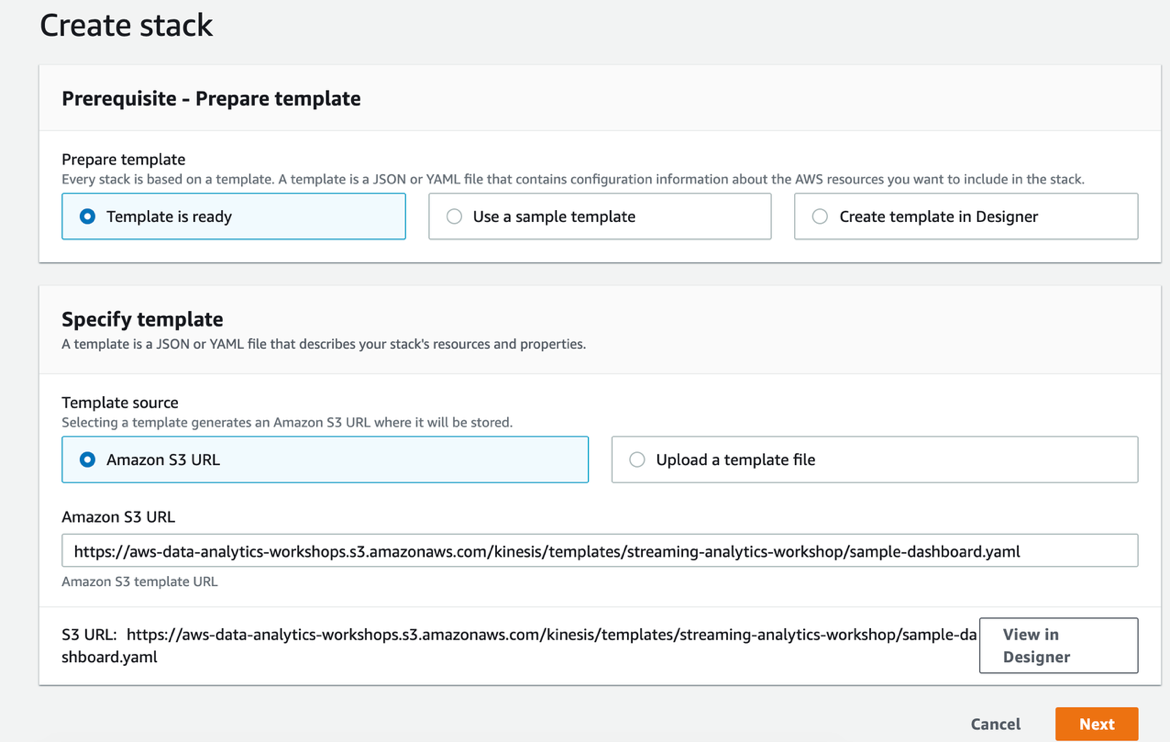
  1. Choose Launch Stack (right-click) to open a new tab to run the CloudFormation template. Make sure to choose us-east-1 (N. Virginia) region.
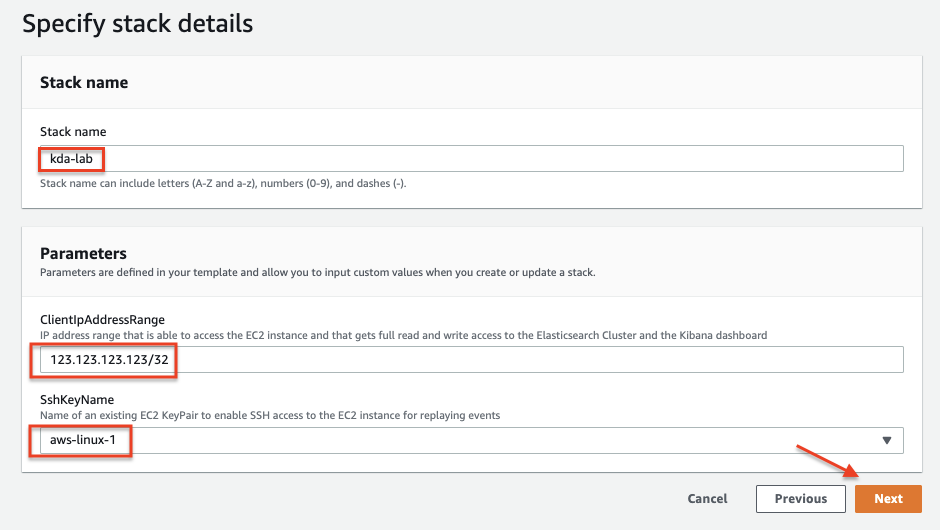
  2. Choose Next.

  1. For FlinkApplicationName, enter the name of your application.
  2. For KinesisStreamName, enter the name of your data stream.
  3. Make sure ShardCount is same as the current shard count of Kinesis Data Streams created in Part 1.

This information is available on the Outputs tab of the CloudFormation stack detailed in Part 1.

  1. Choose Next.

  1. Follow the remaining instructions and choose Create stack.

This dashboard should take a few minutes to launch.


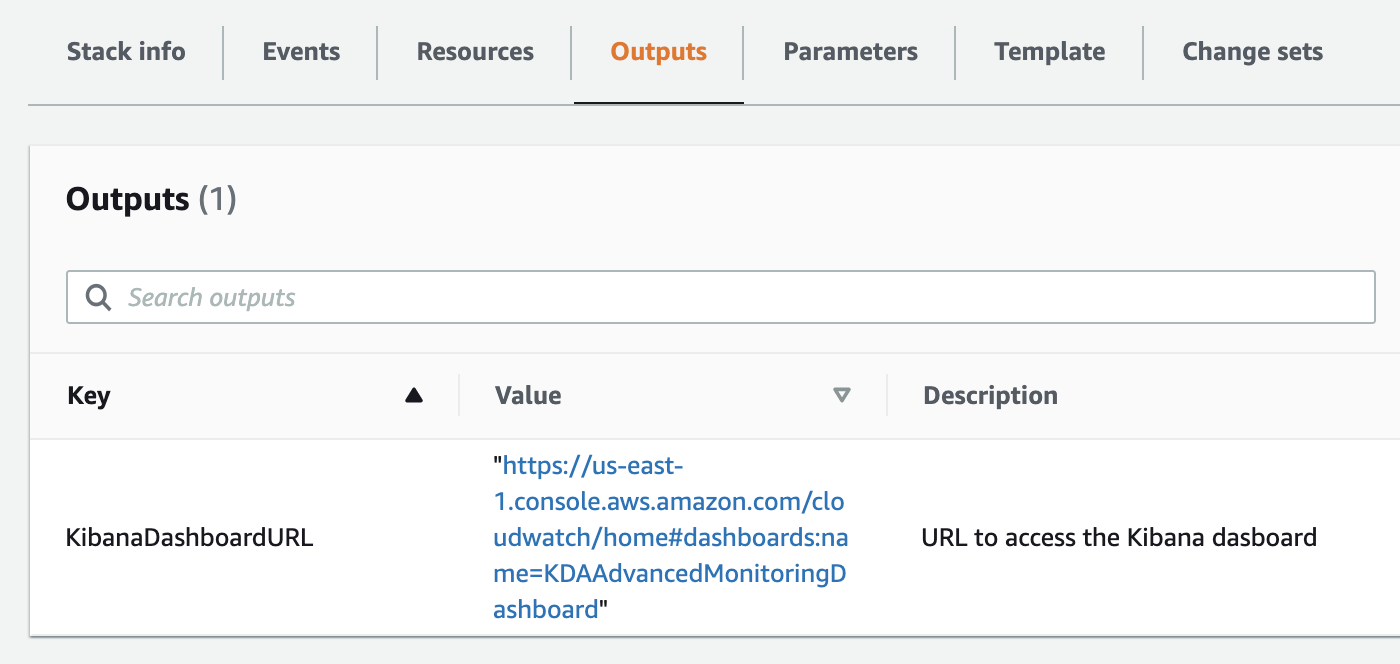
  1. When the stack is complete, go to the Outputs tab of the stack on the AWS CloudFormation console and choose the dashboard link.

Metrics deep dive

There are many critical operational metrics to measure when assessing the performance of a running Apache Flink application. This section looks at the essential CloudWatch metrics for Kinesis Data Analytics for Apache Flink applications, what they mean, and what appropriate alarms might be vital indicators for each. Let’s dive into how to monitor your application.

First, let’s look at the running application using our CloudWatch dashboard and point out potential issues with a given Apache Flink application indicated by our CloudWatch metrics.

The Application Health section of this dashboard can help identify fundamental issues with your application that are causing it to be inoperable. Let’s start with the first two cells: Uptime and Downtime. In an ideal state, this is precisely how your application should look—uptime measures the cumulative time in milliseconds that the application has been running without interruption, and downtime measures the time elapsed during an outage.

In an ideal state, your lastCheckpointSize and lastCheckpointDuration metrics should remain relatively stable over time. If you observe an increasing checkpoint size, this can indicate a state not being cleared within your application or a memory leak. Similarly, a longer and unexpected spike in checkpoint duration can cause backpressure of your application. Monitor these metrics for stability over time.

The resource utilization metrics section gives a glimpse into the resource usage of the running Flink application. In a healthy application, try to keep this metric under 75% usage. This is also the same metric that Kinesis Data Analytics for Apache Flink uses to auto scale your application if you have auto scaling enabled. Also, it’s normal to see CPU spikes during application startup or restart. HeapMemoryUtilization measures the memory taken up by the application, on-heap state, and any other operations that may take up memory space.

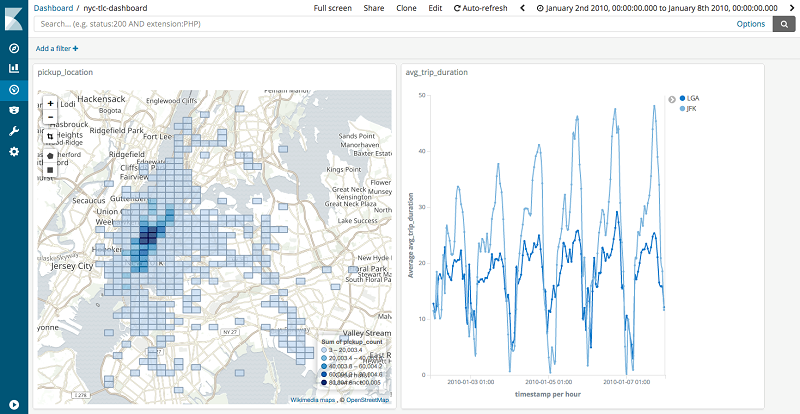
Let’s now evaluate our Flink application progress. Incoming and outgoing records per second are measured on an application level in this image. You can also measure them on a task or subtask level for finer granularity and visibility into the operators of your application. The ideal state for these depends on the use case, but if it’s a straight read, process, and write action without filtering the records, you can expect to see an equal amount of records in and out per second. If a deviation occurs on either end of these metrics, it’s a good indicator of where the bottleneck is. If numRecordsInPerSecond is lower, the source might be configured to read in less data, or it could be indicative of backpressure on the sink causing a slowdown. If numRecordsOutPerSecond is lower, it could be identifying a slow operator process in the middle of your application.

Next, let’s look at InputandOutputWatermark and EventTimeLatency. The watermarks indicate the eventTime with which data is arriving into the data stream. A large difference between these two values could indicate significantly late-arriving data into the stream. Your stream should handle this according to your use case, and EventTimeLatency measures the total latency, or OutputWatermark and InputWatermark, of the streaming workload.

The LateRecordsDropped metric measures the number of records dropped due to arriving late. If this number is spiking, there is an issue with data arriving late to the Flink application.

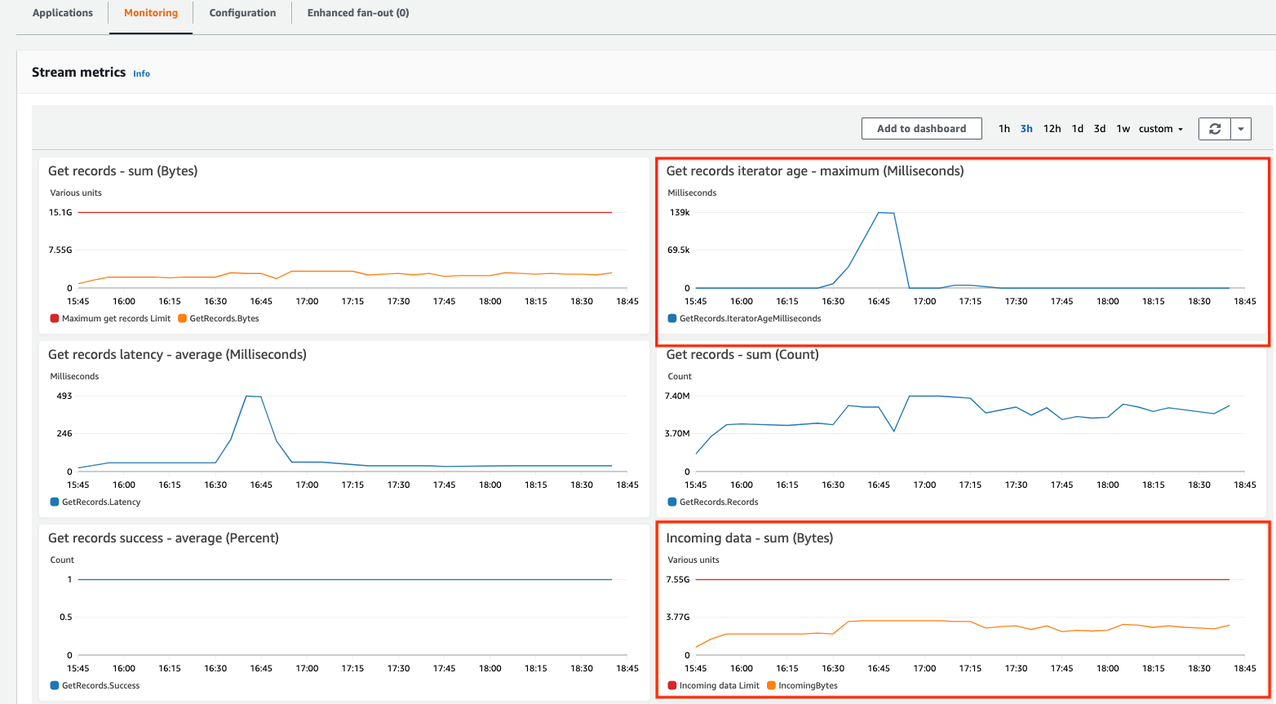
Now let’s dive into Kinesis source and sink metrics. The millisBehindLatest metric shows the time the consumer is behind the head of the stream, which is a good indicator of how far behind the consumer’s current time is. You can measure this metric on an application or a parallelism level—a value of 0 shows that the application is completely caught up with processing records. This is ideal; a higher value means that the application is falling behind. It could indicate that the consumer isn’t tuned to read records efficiently, backpressure, or some slowness in processing. Scale the application accordingly.

The RetriesPerRecord, UserRecordsPending, and BufferingTime metrics come from the Kinesis Producer Library (KPL), and in this case, is referring to our terminal script, which is writing to the Kinesis data stream. All applications that use the KPL report this metric, and it’s important to monitor in case of frequent retries or timeouts. The other metrics can grow exceedingly large if the data stream is under-provisioned.

Advanced scaling

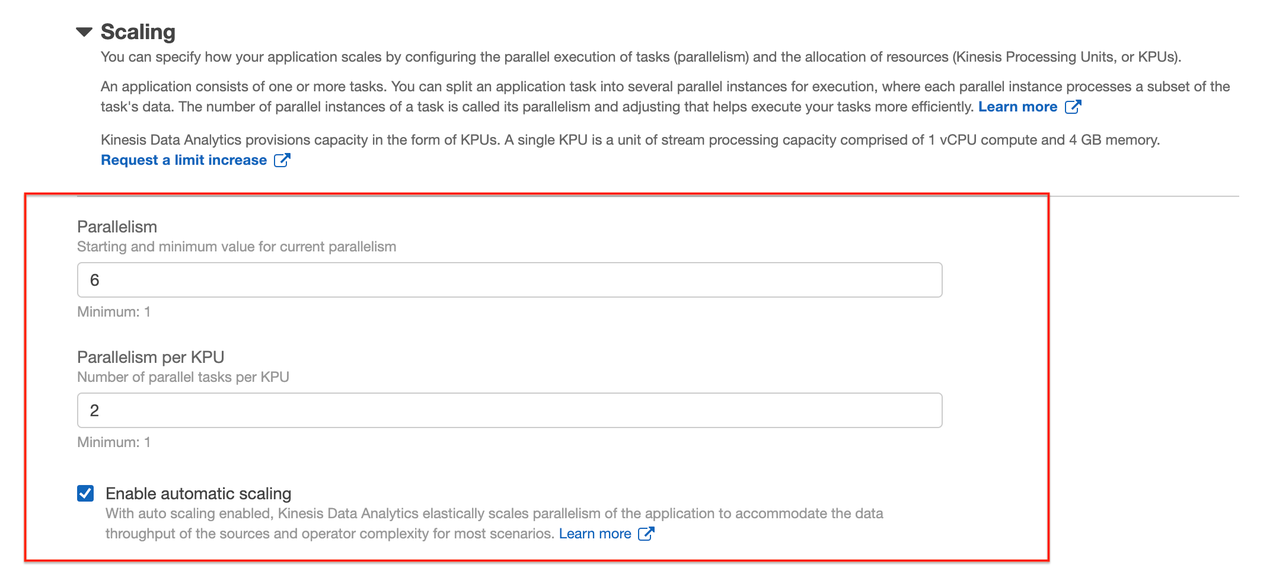
Let’s dive deep into how to scale your Kinesis data analytics application based on the previously discussed metrics. The only way to scale a Kinesis data analytics application automatically is to use the built-in auto scale feature. This feature monitors your application’s CPU usage over time, and if it remains at 75% or above for 15 minutes, it increases your application’s overall parallelism. You experience some downtime during this scale-up, and an application developer should take this into account when using the auto scaling feature. It’s an excellent and helpful feature of Kinesis Data Analytics for Apache Flink. However, some applications need to scale based on other factors, not just CPU usage. In this section, we look at an external way to scale your application based on IncomingRecords or millisBehindLatest metrics on the source Kinesis data stream.

To add the functionality of scaling based on other metrics, we utilize Application Auto Scaling to specify our scaling policy and other attributes, such as cooldown periods. We can also take advantage of any auto scaling types—step scaling, target tracking scaling, and schedule-based scaling. The CloudFormation template we launched already created the necessary resources covering step scaling. For a more detailed list, view the Resources tab on the AWS CloudFormation console or view the designer before launching.

Currently, the settings are tuned to the max throughput per KPU, which is ideal for a production workload. Let’s tune this setting down to a lower value to more quickly see results.

  1. On the CloudWatch console, choose Alarms in the navigation pane.
  2. Choose the alarm KDAScaleOutAlam.

The alarm has been preconfigured for you in CloudWatch to listen for specific metrics breaching a threshold. Optionally, you can adjust the alarm to trigger scale-out or scale-in events as needed.

  1. On the Actions menu, choose Edit.

  1. In the Conditions section, adjust the threshold value as needed.
  2. Choose Update alarm.

You can also use the speedup value in the ProducerCommand found in the outputs of the CloudFormation stack from Part 1 to increase and decrease data volume per second, replicating real-life scenarios of spiky data. Observe the CloudWatch alarms changing states between OK and In alarm. When in alarm, it triggers auto scaling of the Kinesis data stream scaling in or out many shards. Alarms also scale KPUs allocated to the Kinesis data analytics application.

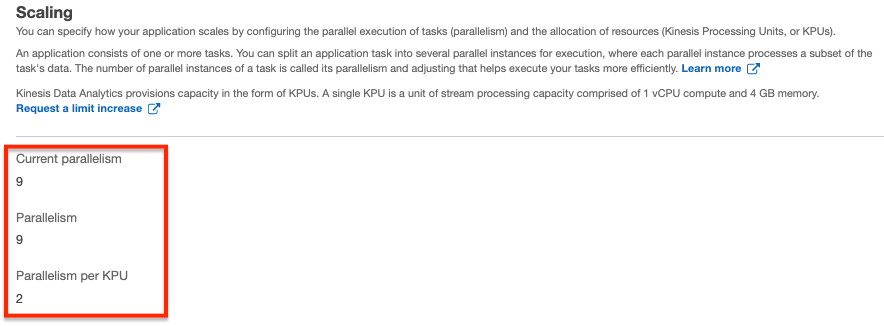
  1. Navigate back to your Kinesis data analytics application.
  2. On the Details tab, see in the Scaling section if this alarm has impacted the parallelism.

  1. Alternatively, stop the producer in the terminal.

Turning off the producer should show an inverse effect, causing the application to trigger the KDAScaleInAlarm, and the application parallelism should scale back down in a few minutes.

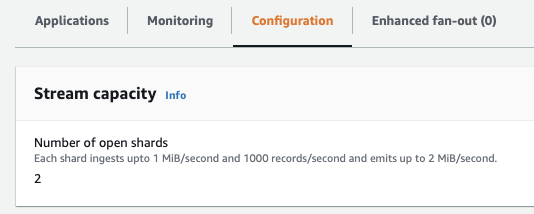
  1. On the Configuration tab of your data stream, observe the scaling operation of allocated shards.

You can open the Apache Flink dashboard from your Kinesis data analytics application, analyze the application performance, and troubleshoot by looking at Flink job-level insights, Flink task-level insights, Flink exceptions, and checkpoints. You can also calibrate your application by looking at the Flink dashboard metrics, which gives you additional granularity out of the box, and using the metrics for debugging purposes.

Conclusion

In this post, you built a reliable, scalable, and highly available advanced scaling mechanism for streaming applications based on Kinesis Data Analytics for Apache Flink and Kinesis Data Streams. The post also discussed how to auto scale your applications based on a metric other than CPU utilization and explored ways to extend observability of the application with advanced monitoring and error handling. This solution was largely enabled by using managed services, so you didn’t need to spend time provisioning and configuring the underlying infrastructure. The sources of the AWS CloudFormation templates used in this post are available from GitHub for your reference.

You should now have a good understanding of how to build, monitor and auto scale a real-time streaming application using Amazon Kinesis. You can also calibrate various components based on your application needs and volume of data by applying advanced monitoring and scaling techniques.


About the Authors

 Amit Chowdhury is a Partner Solutions Architect in the Global System Integrator (GSI) team at Amazon Web Services. He helps AWS GSI partners migrate customer workloads to the AWS Cloud, and provides guidance to build, design, and architect scalable, highly available, and secure solutions on AWS by applying AWS recommended best practices. He enjoys spending time with his family, outdoor adventures and traveling.


Saurabh Shrivastava is a solutions architect leader and analytics specialist working with global systems integrators. He works with AWS Partners and customers to provide them with architectural guidance for building scalable architecture in hybrid and AWS environments. He enjoys spending time with his family outdoors and traveling to new destinations to discover new cultures.

Build and optimize a real-time stream processing pipeline with Amazon Kinesis Data Analytics for Apache Flink, Part 1

Post Syndicated from Amit Chowdhury original https://aws.amazon.com/blogs/big-data/part1-build-and-optimize-a-real-time-stream-processing-pipeline-with-amazon-kinesis-data-analytics-for-apache-flink/

In real-time stream processing, it becomes critical to collect, process, and analyze high-velocity real-time data to provide timely insights and react quickly to new information. Streaming data velocity could be unpredictable, and volume could spike based on user demand at a given time of day. Real-time analysis needs to handle the data spike, because any delay in processing streaming data can cause a significant impact on the desired outcome. The value of insights and actions reduces over time, whereas real-time analysis can substantially improve the effectiveness of the analytics application.

A widespread use case is fleet management for vehicles, especially in the autonomous car industry. It’s essential to collect, process, and analyze high-velocity traffic data and react in real time to control and reroute traffic. Real-time stream processing is crucial in many other use cases, such as manufacturing production lines, robotics automation, analyzing high-volume web and application logs, website clickstreams or database event streams, aggregating social media feeds, and tracking financial transactions.

Amazon Kinesis Data Analytics reduces the complexity of building, managing, and integrating Apache Flink applications with other AWS services. Kinesis Data Analytics takes care of everything required to run streaming applications continuously and scales automatically to match your incoming data volume and throughput in a serverless manner.

In this post, you learn the required concepts to implement robust, scalable, and flexible real-time streaming extract, transform, and load (ETL) pipelines with Apache Flink and Kinesis Data Analytics. We demonstrate how to calibrate the Kinesis streaming analytics pipeline to achieve higher performance efficiency and better cost optimization with the right amount of Kinesis Processing Units (KPUs). Estimating the optimal number of KPUs to handle your streaming workload depends on several factors, including the type of stream processing involved. For instance, if you’re performing CPU-intensive statistical calculations, your application might need more CPU or memory. On the other hand, if your application is simply enriching records via external API calls as they flow through, you might be I/O bound. In Part 1 of this series, you learn various parameters such as Parallelism and ParallelismPerKPU for KPU calibration. In Part 2, you learn about applying auto scaling to add the right amount of KPUs based streaming data spike.

For this post, we analyze the telemetry data of a taxi fleet in New York City in real time to optimize fleet operation using Amazon Kinesis Data Analytics for Apache Flink. Kinesis Data Analytics helps process and analyze the data in real time to identify areas currently requesting a high number of taxi rides. The derived insights are visualized on a dashboard for operational teams to inspect.

Architecture

As shown in the following architecture diagram, every taxi in the fleet is capturing information about completed trips. The tracked information includes the pickup and drop-off locations, number of passengers, and generated revenue. This information is ingested into Amazon Kinesis Data Streams as a simple JSON blob. The application reads the timestamp attribute of the stored events and replays them as if they occurred in real time. From there, the data is processed and analyzed by a Flink application, which is deployed to Kinesis Data Analytics for Apache Flink.

The application  identifies areas that are currently requesting a high number of taxi rides. The derived insights are finally persisted into Amazon Elasticsearch Service, where they can be accessed and visualized using Kibana.

In this post, you build a fully managed infrastructure that can analyze the data in near-real time—within seconds—while being scalable and highly available. The architecture uses Kinesis Data Streams as a streaming store, Kinesis Data Analytics to run an Apache Flink application in a fully managed environment, and Amazon Elasticsearch Service (Amazon ES) and Kibana for visualization.

Additionally, we discuss basic Apache Flink concepts and common patterns for streaming analytics. We also cover how Kinesis Data Analytics for Apache Flink is different from a self-managed environment and how to effectively operate and monitor streaming architectures. You also calibrate KPUs in Kinesis Data Analytics to improve performance efficiency and cost optimization.

Deploy the real-time streaming and analysis workload

To replicate the real-life scenario, you connect to a preconfigured Amazon Elastic Compute Cloud (Amazon EC2) instance running Linux over SSH. Then you use a Java application to replay a historic set of taxi trips made in NYC stored in objects in Amazon Simple Storage Service (Amazon S3) into the data stream. The Java application is compiled and loaded onto the EC2 instance.

This section uses an AWS CloudFormation template to build a producer client program that sends NYC taxi trip data to our Kinesis data stream. The template creates the following resources:

  • An S3 bucket to house the data resources.
  • A new Kinesis data stream that we use to stream a dataset of NYC taxi trips.
  • Amazon ElasticSearch cluster with Kibana integration for displaying dashboard information.
  • A build pipeline and AWS CodeBuild project along with sources for a Flink Kinesis connector application.
  • An EC2 instance for running a Flink application to replay data onto the data stream. An Elastic IP is provisioned for the EC2 instance to allow SSH access.
  • A Java application hosted on the EC2 instance, which loads data from the EC2 instance.
  • A Kinesis data analytics application to continuously monitor and analyze data from the connected data stream and run the Apache Flink 1.11 application.
  • The necessary AWS Identity and Access Management (IAM) service roles, security groups, and policies to run and communicate between the resources you create.
  • An Amazon CloudWatch alarm when the application falls behind based on the millisBehindLatest metric.

To provision these resources, complete the following steps:

  1. Choose Launch Stack (right click) and open a new tab to run the CloudFormation template. Make sure to choose us-east-1 ( N. Virginia) region.
  2. Choose Next.

  1. For Stack name, enter a name.
  2. For ClientipAddressRange, enter the IP address from which the Kibana dashboard is accessed.

Use https://checkup.amazon.com to find IP and add /32 at the end.

  1. For SshKeyName¸ enter the SSH key name for the Linux-based EC2 instance you created.
  2. Choose Next.

  1. Select I acknowledge that AWS CloudFormation might create IAM resources with custom names and I acknowledge that AWS CloudFormation might require the following capability: CAPABILITY_AUTO_EXPAND.
  2. Choose Create stack.
  3. Wait until the CloudFormation template has been successfully created.

Connect to the new EC2 instance and run the producer client program

In this section, we connect to our new EC2 instance and run the producer client program.

  1. On the AWS CloudFormation console, choose the parent in which the stack was deployed.
  2. In the Outputs section, locate the AWS Systems Manager Session Manager URL for KinesisReplayInstance.
  3. Choose the Session Manager URL to connect to the EC2 instance.

  1. After the connection has been established, start ingesting events into the Kinesis data stream by running the JAR file that was downloaded to the EC2 instance.

The command with pre-populated parameters is available in the Outputs section of the CloudFormation template for ProducerCommand.

You have now successfully created the basic infrastructure and are ingesting data into the data stream.

  1. On the Kinesis Data Streams console, go to your data stream.
  2. On the Monitoring tab, locate the Incoming Data – Sum

You may need to wait 2–3 minutes and use the refresh button for the monitoring charts to see the metrics.

Visualize the data

To visualize the data, navigate to the Kibana dashboard. The dashboard URL is in the Outputs section of the CloudFormation stack for KibanaDashboard. You can inspect the preloaded dashboard or even create your visualizations. If no data shows up, choose the clock icon and change the timeframe to January 2010 – December 2011.

AWS CloudFormation automatically grants access to the IP address provided during stack creation. However, if you encounter access issues in the Kibana dashboard, modify your Amazon ES domain’s access policy and change your local IP address on the Amazon ES console.

To change your IP address, find and choose the Amazon ES domain that you provisioned. On the Actions menu, choose Modify access policy.

Replace the IP address (for example, 123.123.123.123) with your local IP. If you don’t know your local IP, use http://checkip.amazonaws.com.

Scale the Kinesis data stream to adapt to a spiky data stream

Now that the Kinesis Data Analytics for Apache Flink application is running and sending results to Amazon ES, we can look at operational aspects, such as monitoring and scaling. When you closely inspect the output of the producer application, you can observe that it’s experiencing write provisioned throughput that has exceeded exceptions and it can’t send data fast enough. If the resources of the Apache Flink application aren’t adapted accordingly, particularly for a spiky data stream, the application may fall substantially behind. It may then generate results that are no longer relevant because they’re already too old when the overloaded application can eventually produce them.

The Kinesis data stream was deliberately under-provisioned so that the Kinesis Replay Java application is completely saturating the data stream. When you closely inspect the output of the Java application, you can notice that the replay lag is continuously increasing. This means that the producer can’t ingest events as quickly as required according to the specified speedup parameter.

In this section, we scale the Kinesis data stream to accommodate the throughput generated by the Java application ingesting events into the data stream. We then observe how the Kinesis Data Analytics for Apache Flink application automatically scales to adapt to the increased throughput.

  1. On the Kinesis Data Streams console, navigate to the stream you created.
  2. In the Shards section, choose Edit.
  3. Double the throughput of the Kinesis stream by changing the number of open shards to 16.
  4. Choose Save changes to confirm the changes.

  1. While the service doubles the number of shards and therefore the throughput of the stream, examine the metrics of the data stream on the Monitoring

After few minutes, you should notice the effect of the scaling operation as the throughput of the stream substantially increases.

While we have scaled Kinesis Data Steams manually, Kinesis Scaling Utility is designed to give you the ability to auto-scale Amazon Kinesis Streams in the same way that you scale EC2 Auto Scaling groups – up or down by a count or as a percentage of the total fleet. You can simply scale to an exact number of Shards. In Part 2, you will learn more about auto-scaling Kinesis Data Streams based on incoming data stream.

Calibrate KPUs

Currently, Kinesis Data Analytics scales your application solely based on the underlying CPU usage. However, because not all applications are CPU bound, depending on your needs, you may want to use a different mechanism for sizing your application. In this section, we demonstrate how you can use the millisBehindLatest metric (available when consuming data from a Kinesis data stream) to responsively size your Kinesis data analytics application.

Kinesis Data Analytics provisions capacity in the form of Amazon Kinesis Processing Units (KPUs). One KPU provides you with 1 vCPU and 4 GB memory. The default limit for KPUs for your application is 32. You can also request an increase to this limit in AWS Service Limits.

We recommend that you test your application with production loads to get an accurate estimate of the number of KPUs required for your application. KPUs usage can vary considerably based on your data volume and velocity, code complexity, integrations, and more. This is especially true when using the Apache Flink runtime in Kinesis Data Analytics.

You can configure the parallel run of tasks and allocate resources for Kinesis Data Analytics for Apache Flink to implement scaling. We use the following properties:

  • Parallelism – Use this property to set the default Apache Flink application parallelism. All operators, sources, and sinks run with this parallelism unless overridden in the application code. The default is 1, and the default maximum is 256.
  • ParallelismPerKPU – Use this property to set the number of parallel tasks that can be scheduled per the of your application. The default is 1, and the maximum is 8. For applications that have blocking operations (for example, I/O), a higher value of ParallelismPerKPU leads to full utilization of KPU resources.

Kinesis Data Analytics calculates the KPUs needed to run your application as Parallelism/ParallelismPerKPU.

The following example request for the CreateApplication action sets parallelism when you create an application.

{
   "ApplicationName": "string",
   "RuntimeEnvironment":"FLINK-1_11",
   "ServiceExecutionRole":"arn:aws:iam::123456789123:role/myrole",
   "ApplicationConfiguration": { 
      "ApplicationCodeConfiguration":{
      "CodeContent":{
         "S3ContentLocation":{
            "BucketARN":"arn:aws:s3:::mybucket",
            "FileKey":"myflink.jar",
            "ObjectVersion":"AbCdEfGhIjKlMnOpQrStUvWxYz12345"
            }
         },
      "CodeContentType":"ZIPFILE"
   },   
      "FlinkApplicationConfiguration": { 
         "ParallelismConfiguration": { 
            "AutoScalingEnabled": "true",
            "ConfigurationType": "CUSTOM",
            "Parallelism": 4,
            "ParallelismPerKPU": 4
         }
      }
   }
}


For more examples and instructions for using request blocks with API actions, see Kinesis Data Analytics API Example Code.

The following example request for the UpdateApplication action sets parallelism for an existing application:

{
   "ApplicationName": "MyApplication",
   "CurrentApplicationVersionId": 4,
   "ApplicationConfigurationUpdate": { 
      "FlinkApplicationConfigurationUpdate": { 
         "ParallelismConfigurationUpdate": { 
            "AutoScalingEnabledUpdate": "true",
            "ConfigurationTypeUpdate": "CUSTOM",
            "ParallelismPerKPUUpdate": 4,
            "ParallelismUpdate": 4
         }
      }
   }
}

Scale the Kinesis Data Analytics for Apache Flink application

Because you increased the throughput of the Kinesis data stream by doubling the number of shards, more events are sent into the stream. However, as a direct result, more events need to be processed. Now the Kinesis data analytics application becomes overloaded and can no longer keep up with the increased number of incoming events. You can observe this through the millisBehindLatest metric, which is published to CloudWatch.

Kinesis Data Analytics natively supports auto scaling. After few minutes, you can see the effect of the auto scaling activities in the metrics. The millisBehindLatest metric starts to decrease until it reaches zero when the processing has caught up with the tip of the Kinesis data stream.

You can calibrate the scaling operation based on your application needs by adjusting the KPU.

  1. On the Kinesis Data Analytics console, navigate to your application.
  2. Under Scaling, choose Configure.
  3. Adjust Parallelism to 6 and Parallelism per KPU to 2.
  4. Choose Update.

The other method that you can apply to improve throughput is the AsyncIO function. You can make AsyncIO calls asynchronously to improve throughput while other requests are in progress. The two essential parameters when defining an AsyncFunction are Capacity (how many requests are in-flight concurrently per parallel sub-task) and Timeout (the timeout duration of an individual request to the external data source). It helps if you allocate enough capacity to account for the throughput, but not more than the external data source can handle. For example, application with a parallelism of 5 and a capacity of 10 sends 50 concurrent requests to your external data source. You can learn more about using the AsyncIO function with Kinesis Data Analytics for Apache Flink on the GitHub repo.

Conclusion

In this post, you built a reliable, scalable, and highly available streaming application based on Apache Flink and Kinesis Data Analytics. You also scaled the different components while ingesting and analyzing thousands of events per second in near-real time. The solution utilizes managed services without having to provision and configure underlying infrastructure. The post also discussed what it takes to auto scale your application based on metrics such as CPU utilization and millisBehindLatest. The sources of the AWS CloudFormation templates used in this post are available from GitHub for your reference.

You now know how to build a real-time streaming application using Kinesis Data Analytics on AWS. You can also calibrate KPUs based on your application needs and volume of data. Check out Part 2 of this post to explore advanced monitoring techniques and auto scale your real-time streaming application, adapting with streaming data.


About the Author

Amit Chowdhury is a Partner Solutions Architect in the Global System Integrator (GSI) team at Amazon Web Services. He helps AWS GSI partners migrate customer workloads to AWS, and provides guidance to build, design, and architect scalable, highly available, and secure solutions on AWS by applying AWS recommended best practices. He enjoys spending time with his family, outdoor adventures and traveling.


Saurabh Shrivastava is a solutions architect leader and analytics specialist working with global systems integrators. He works with AWS Partners and customers to provide them with architectural guidance for building scalable architecture in hybrid and AWS environments. He enjoys spending time with his family outdoors and traveling to new destinations to discover new cultures.