Post Syndicated from Dev Arora original https://aws.amazon.com/blogs/architecture/closing-the-ai-agent-trust-gap-with-graduated-autonomy/
How much to trust an AI agent is now a daily operational question. Agents read customer data, open tickets, process refunds, and delete accounts, yet most teams pick up a binary: full access or read-only. Full access is risky because agents fail unpredictably. Read-only leaves most of the agent’s value unused. The distance between what an agent could do and what an operator trusts it to do is the agent’s trust gap.
In this post, we describe graduated autonomy, an architectural pattern that closes the gap. Agents earn expanded permissions through sustained reliability and lose them when performance degrades. Amazon Bedrock AgentCore, a platform to build, connect, and optimize agents at scale with any framework or model, provides the runtime, gateway, policy, and evaluation capabilities. Amazon DynamoDB stores trust state. AWS CodePipeline gates delivery on evaluation results. We cover each layer’s responsibility and the key design decision behind it.
The agent trust gap
Identity and access management answers “who can do what?” once, at provisioning. That model assumes that the principal behaves consistently. A large language model agent breaks it: the same agent can be accurate Monday and hallucinated Tuesday after a prompt change or model update.
Closing the gap requires three capabilities raw API logs rarely provide:
- Visibility. API logs tell engineers what happened but tell a compliance officer nothing about whether an action was safe.
- Decision provenance. Tracing an action back to the signal that triggered it, the alternatives considered, and the confidence held.
- Reversibility. Pre-action state capture, so operators can recover from incorrect actions.
The framework that implements this pattern delivers all three through six architectural layers.
Solution overview
The six layers:
- Scoring engine computes trust from configurable dimensions.
- Tier system translates sustained scores into autonomy levels.
- Pre-execution layer blocks dangerous actions before they run.
- Enforcement layer applies tiers through Cedar policies at the infrastructure level.
- Post-execution layer evaluates outcomes, records of provenance, and feeds signals back to scoring.
- Delivery gate keeps degraded agent versions out of production.
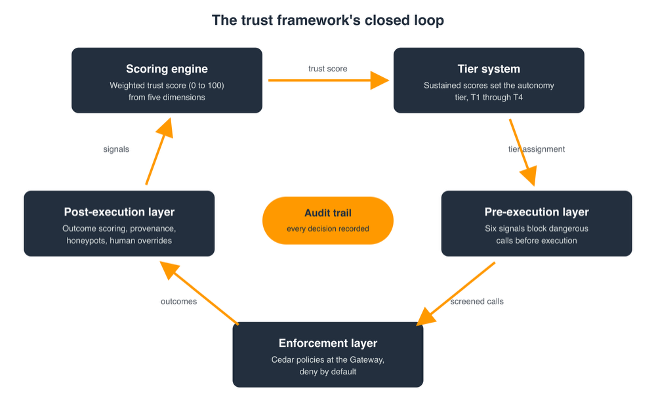
Figure 1: The trust framework’s closed loop.
Each layer is replaceable: the scoring model, tier thresholds, pre-execution signals, and evaluation criteria are configuration, not code. Each layer also embodies one deliberate design decision, developed in the following sections:
| Layer | Key design decision |
| Scoring engine | Safety is an independent floor, never averaged away by strong metrics |
| Tier system | Start every agent at T1. Promote slowly, demote immediately |
| Pre-execution layer | Fast in-process filters are backstopped, never solely trusted |
| Enforcement layer | Deny by default, enforced outside the agent’s process |
| Post-execution layer | Audit records capture pre-action state, making recovery possible |
| Delivery gate | One unauthorized tool call in adversarial tests blocks release |
The scoring engine
The scoring engine computes a weighted score from 0 to 100 per agent over a rolling window of 50 actions, from five dimensions:
| Dimension | Weight | What it measures |
| Accuracy | 25% | Task completion correctness against expected outcomes |
| Safety | 20% | Boundary respect, adversarial content detection, permitted tool adherence |
| Consistency | 20% | Behavioral predictability, inverse of tool-use pattern drift |
| Compliance | 20% | Reasoning quality before acting, guardrail adherence |
| Efficiency | 15% | Execution without unnecessary retries or resource waste |
The composite drives dashboards and tier assignment, but safety acts as an independent floor, so a dangerous individual metric never hides strength elsewhere.
The tier system
Every new agent starts at T1, regardless of test performance:
| Tier | Score range | Permissions |
| T1: Probation | 0 to 40 | Read and list only. Two tools visible. |
| T2: Supervised | 41 to 70 | Add write operations. Human approves high-risk. |
| T3: Trusted | 71 to 90 | Execute and modify. Anomalies flagged for review. |
| T4: Autonomous | 91 to 100 | Full access. Post-hoc audit only. |
Three rules govern transitions:
- Promotion requires sustained performance. The score must stay above the promotion threshold for the entire rolling window.
- Demotion is immediate. When safety drops below its floor or injection is detected, the agent moves down.
- Hysteresis prevents oscillation. Promotion into a tier requires a score 5 points above that tier range floor. Demotion happens at the range floor itself. An agent at a boundary cannot flap between tiers.
Trust state lives in Amazon DynamoDB as a current state record plus a time-series history per agent. Enforcement components read the current tier on every invocation, a lookup DynamoDB typically serves in single-digit milliseconds.
The pre-execution layer
Post-execution evaluation cannot undo damage, so the pre-execution layer evaluates every tool’s call and can block it before execution. It scores six signals independently:
- Adversarial injection detection. Pattern matching against known injection phrases. One match triggers an instant block and a trust penalty.
- Sensitive target detection. Regex matching credentials, tokens, and private keys in tool arguments.
- Dangerous tool detection. Flagging tools that match destructive operation patterns.
- Behavioral consistency. Comparing the current tool call against the agent’s historical tool-use distribution.
- Confidence calibration. Comparing stated confidence against historical accuracy. Overconfident failures are penalized at twice the normal rate.
- Reasoning quality. Checking whether the agent provided reasoning before acting.
These checks are fast first-pass filters, not a complete defense. The enforcement layer’s deny-by-default policies backstop anything they miss.
The enforcement layer
The pre-execution layer is application code inside the agent’s process. The enforcement layer operates outside the agent, at the infrastructure level.
AgentCore Gateway, a capability of Amazon Bedrock AgentCore, sits between the agent and its tools. It routes every MCP tool invocation through Policy in Amazon Bedrock AgentCore, which evaluates Cedar policies with forbid-wins semantics. One satisfied forbid overrides any number of permits. Tier maps to policy state:
- Probation: A forbid policy blocks write, execute, and delete tool actions.
- Promotion: The forbid policy is removed, and broader permits take effect.
- Demotion: The forbid policy is re-applied.
With the policy engine in enforce mode, the Gateway lists only tools that policy could permit, so the tier’s unconditional forbids keep blocked tools out of the listing. The agent is unlikely to call a tool it has never seen. Listing is a meta-action: each invocation is still evaluated separately with full request context, including input parameters. Cedar denies by default. Enforcement never depends on the agent’s choosing to behave. For model-level content safety, Amazon Bedrock Guardrails complements Policy in AgentCore, filtering harmful content and masking sensitive information independent of tier.
The post-execution layer
After every tool call, the system scores the outcome across eight signals, from confidence calibration and behavioral drift to human overrides and retry detection. Every action generates an audit record following the Think, Plan, Act, Observe, Score chain:
- Think: The agent’s reasoning chain.
- Plan: Tool selected, input prepared, pre-execution score.
- Act: Cedar policy matched, Gateway route processed.
- Observe: Success or failure, output data.
- Score: Trust impact, per-dimension scores, tier change.
The Plan and Act records capture pre-action state, which is what makes recovery from an incorrect action possible. Operators ask questions in plain English, and a provenance query endpoint returns a human-readable explanation of any decision. Audit entries persist to DynamoDB.
The delivery gate
Each change to the agent’s prompt, configuration, or tool definitions triggers an AWS CodePipeline run. The run deploys the candidate to staging and runs it against ground-truth fixtures with Amazon Bedrock AgentCore Evaluations, a capability of Amazon Bedrock AgentCore. The fixtures include adversarial cases such as prompt injection and data-exfiltration requests. A single unauthorized tool call in any adversarial case fails the gate. The version that passes becomes the last known stable version.
Production monitoring and recovery
The framework injects synthetic honeypot cases with known expected behavior into a small share of traffic. Validation checks the tool-call trajectory (expected tools, expected order, no forbidden tools) rather than nondeterministic natural-language output, so a mismatch signals a real anomaly. Honeypot results stay out of production metrics. When safety drops below the floor, demotion narrows the agent’s permissions, and the framework redeploys the last known stable version. Together they restore known-good code alongside a tighter permission set. The framework also alerts operators.
Operator judgment feeds directly: the rolling rate at which operators reject proposed actions caps the effective safety metric, so 30 percent rejections cap safety at 70. An emergency stop pushes a single Cedar deny-all policy. Once the policy is active, typically within seconds, the Gateway denies all tool invocations without a redeployment. In multi-agent systems, a delegated action’s effective tier is the minimum across the delegation chain, closing the delegation privilege-escalation path.
Conclusion
In this post, we described graduated autonomy, an architectural pattern for closing the agent trust gap. With this pattern in place, your agents hold the autonomy their track record supports.
To get started, take the dimension weights and tier boundaries from the two tables in this post as a starting template for one agent in your fleet. Start that agent at T1. Then follow the Amazon Bedrock AgentCore Evaluations documentation to build the delivery gate, and the Policy in Amazon Bedrock AgentCore documentation to write the tier policies. You can explore these capabilities in the Amazon Bedrock console and on the Amazon Bedrock AgentCore detail page.
For deeper dives into the building blocks this pattern uses, read Secure AI agents with Policy in Amazon Bedrock AgentCore and Build custom code-based evaluators in Amazon Bedrock AgentCore.