Post Syndicated from Yu-Ting Su original https://aws.amazon.com/blogs/big-data/enhance-amazon-emr-observability-with-automated-incident-mitigation-using-amazon-bedrock-and-amazon-managed-grafana/
Maintaining high availability and quick incident response for Amazon EMR clusters is important in data analytics environments. In this post, we show you how to build an automated observability system that combines Amazon Managed Grafana with Amazon Bedrock to detect and remediate EMR cluster issues. We demonstrate how to integrate real-time monitoring with AI-powered remediation suggestions, combining Amazon Managed Grafana for visualization, Amazon Bedrock for intelligent response recommendations, and AWS Systems Manager for automated remediation actions on Amazon Web Services (AWS).
Solution overview
This solution helps you improve EMR cluster observability through a comprehensive four-layer architecture—comprising monitoring, notification, remediation, and knowledge management—to provide the following features:
- Real-time monitoring of EMR clusters using Amazon Managed Service for Prometheus and Amazon Managed Grafana
- Automated first-aid remediation through Systems Manager
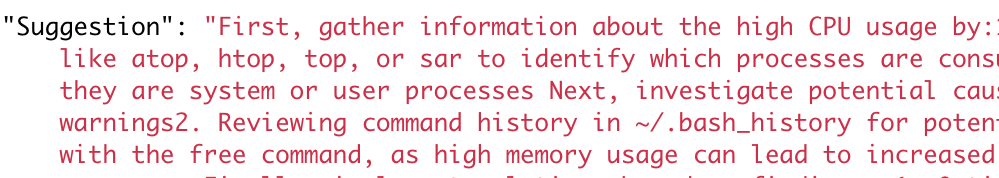
- AI-powered incident response suggestions using Amazon Bedrock
- Integration with the AWS Premium Support knowledge base
- Historical incident data archival and analysis
The implementation of this architecture delivers the following key benefit:
- Reduced Mean time to resolution (MTTR)
- Proactive incident prevention
- Automated first-response actions
- Knowledge base enrichment through machine learning
The following diagram illustrates the solution architecture.
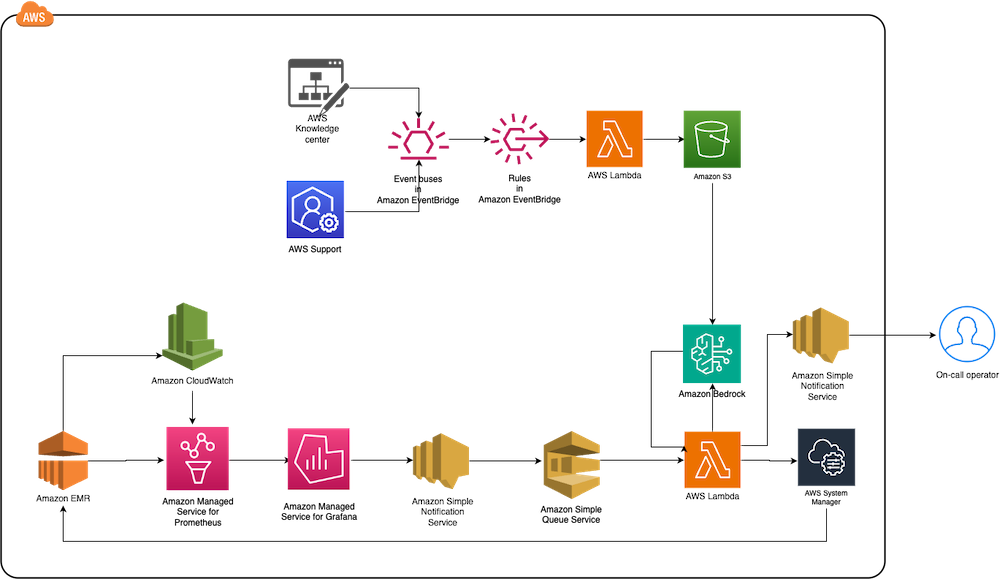
The architecture comprises the following core components:
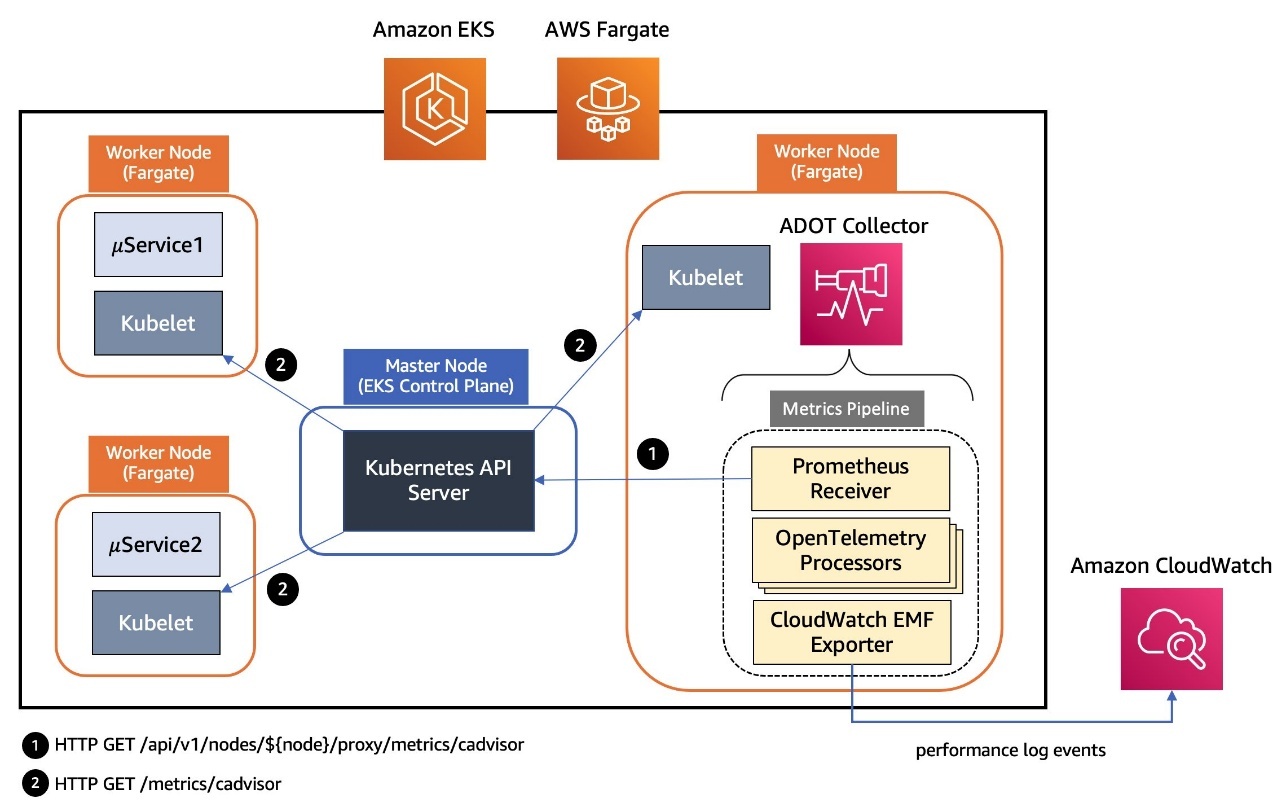
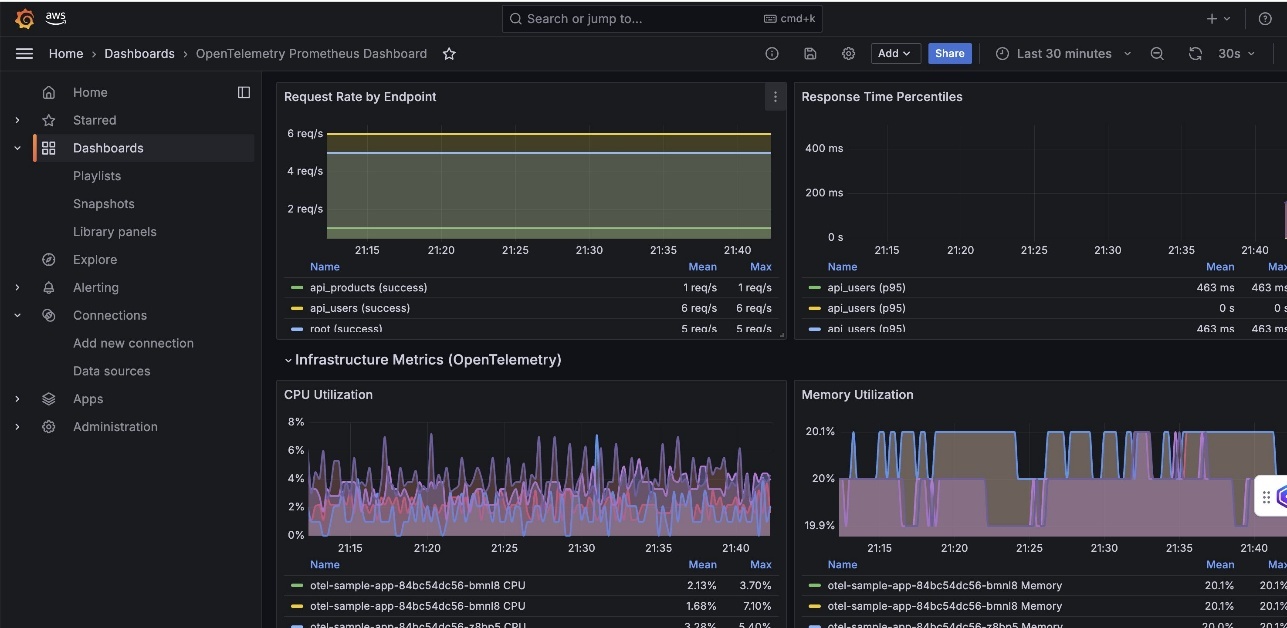
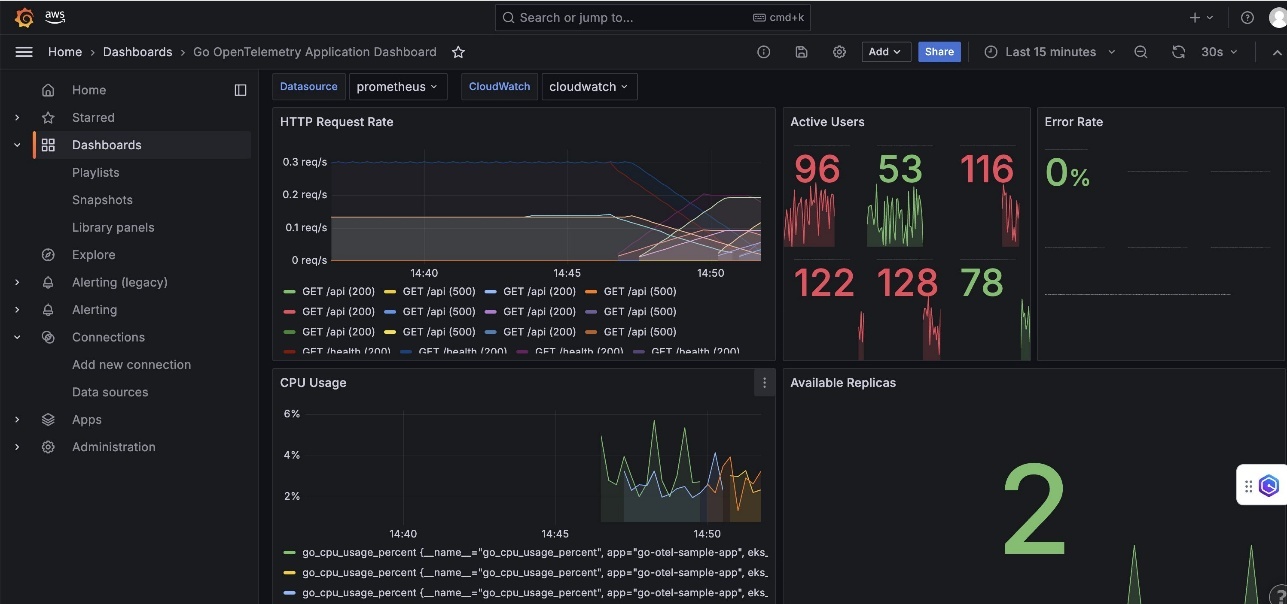
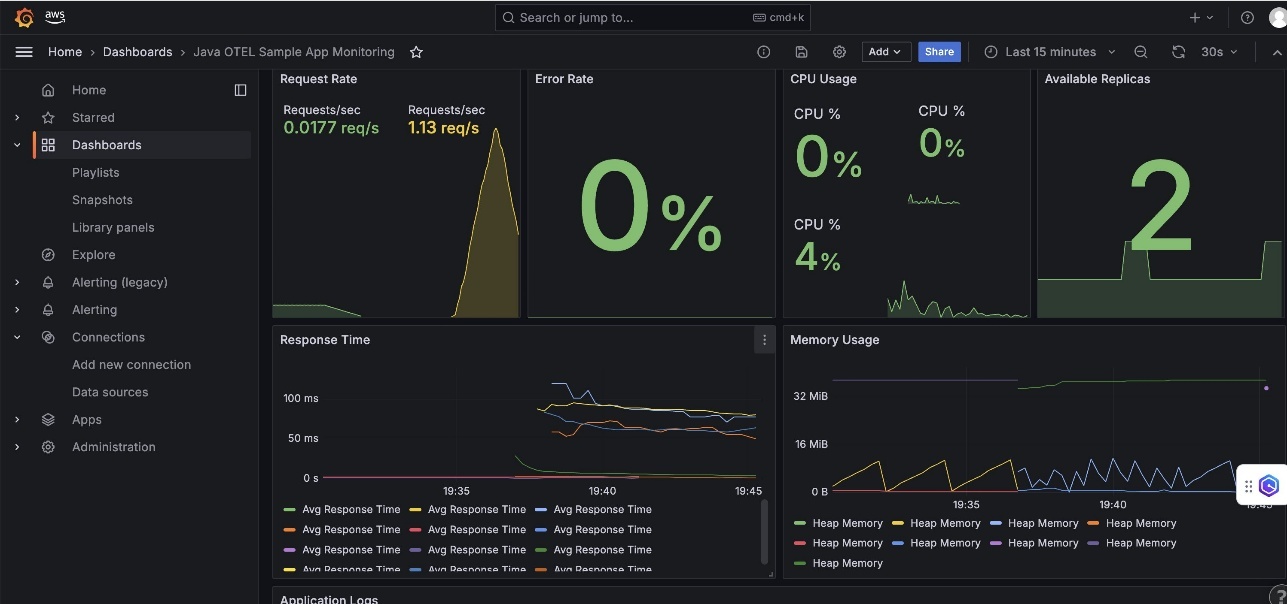
- Monitoring layer – The monitoring layer uses Amazon Managed Service for Prometheus and Amazon CloudWatch to capture real-time metrics from EMR clusters. Amazon Managed Grafana serves as the visualization layer, offering comprehensive dashboards for Apache YARN, HDFS, Apache HBase, and Apache Hudi performance monitoring. Advanced alerting mechanisms trigger notifications based on predefined query results.
- Notification layer – To provide timely and reliable alert delivery, the notification layer uses Amazon Simple Notification Service (Amazon SNS) for distribution and Amazon Simple Queue Service (Amazon SQS) for message queuing. This architecture prevents message delays and provides a robust trigger mechanism for AWS Lambda functions.
- Remediation layer – The remediation layer enables automatic issue resolution through:
- Lambda functions for orchestration
- Systems Manager for script execution
- Amazon Bedrock (amazon.nova-lite-v1:0) for generating intelligent response recommendations
- Knowledge management layer – To maintain an up-to-date knowledge base, the solution:
- Archives technical articles in Amazon Simple Storage Service (Amazon S3)
- Implements periodic data synchronization using Amazon EventBridge
- Integrates with an Amazon Bedrock knowledge base for enhanced insights
We provide an AWS CloudFormation template to deploy the solution resources.
Prerequisites
Before starting this walkthrough, make sure you have access to the following AWS resources and configurations:
- An AWS account
- Access to the US East (N. Virginia) AWS Region
- Add access to Amazon Bedrock foundation models (amazon.nova-lite-v1:0)
- Add access to Amazon Bedrock foundation models (amazon.nova-lite-v1:0)
- Amazon EMR version 6.15.0 (used in this demo)
- Archived technical or troubleshooting articles
- AWS IAM Identity Center enabled with at least one role that can become a Grafana administrator
- (Optional) AWS Premium Support with a business support plan or higher for enhanced troubleshooting capabilities
Throughout this walkthrough, we provide detailed instructions to set up and configure these prerequisites if you haven’t already done so.
Configure resources using AWS CloudFormation
Complete the following steps to configure your resources:
- Launch the CloudFormation stack:
![]()
- Provide
emrobservabilityas the stack name. - Select a virtual private cloud (VPC) and assign a public subnet.
- For EMRClusterName, enter a name for your cluster (default:
emrObservability). - Enter an existing Amazon S3 location as the Apache HBase root directory location (for example,
s3://mybucket/my/hbase/rootdir/). - For MasterInstanceType and CoreInstanceType, enter your instance types (default: m5.xlarge for both).
- For CoreInstanceCount, enter your instance count (default: 2).
- For SSHIPRange, use CheckIp and enter your IP (for example, 10.1.10/32).
- Choose the release label (default: 6.15.0).
- For KeyName, enter a key name to SSH to Amazon Elastic Compute Cloud (Amazon EC2) instances.
- For LatestAmiId, enter your AMI (default:
/aws/service/ami-amazon-linux-latest/amzn2-ami-hvm-x86_64-gp2). - For KBS3Bucket, enter a name for your S3 bucket (for example,
mykbbucket). - For SubscriptionEndpoint, enter an email address to receive notifications and responses (for example,
[email protected]).
Accept subscription confirmation
Accept the subscription confirmation sent to the email address you specified in the CloudFormation stack parameters. The following screenshot shows an example of the email you receive.

Prepare the knowledge base
Complete the following steps to populate the S3 bucket with archived technical articles and cases:
- On the Lambda console, choose Functions in the navigation pane.
- Choose the function
CustomFunctionCopyKCArticlesToS3Bucket.
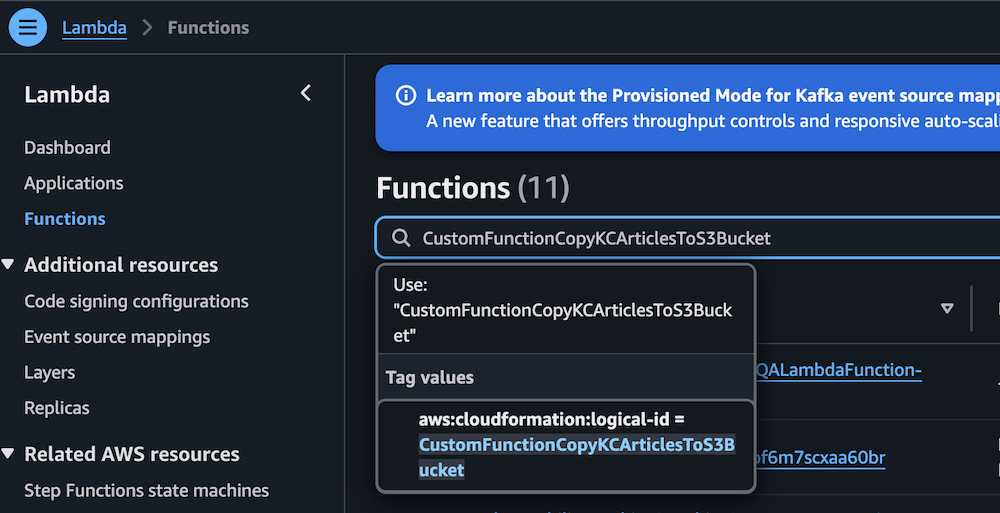
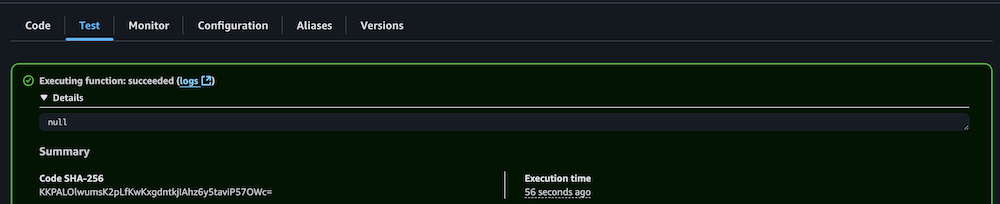
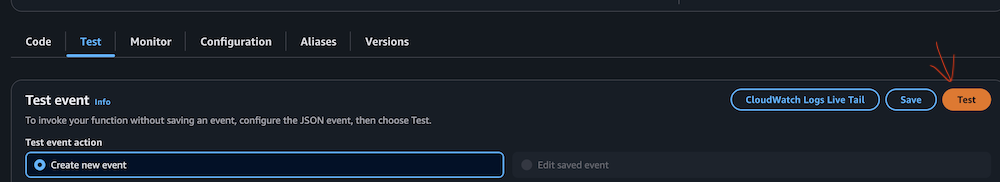
- Manually invoke the function by choosing Test on the Test tab.
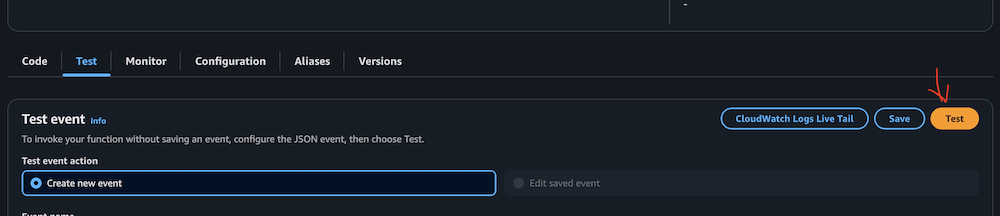
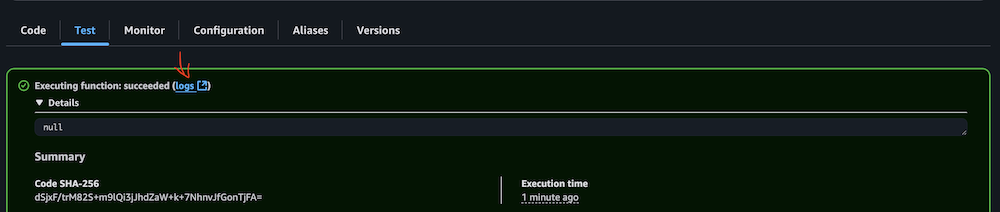
- Verify successful execution by checking the CloudWatch logs.
- Repeat the process for the Lambda function
CustomFunctionCopyCasesToS3Bucket.
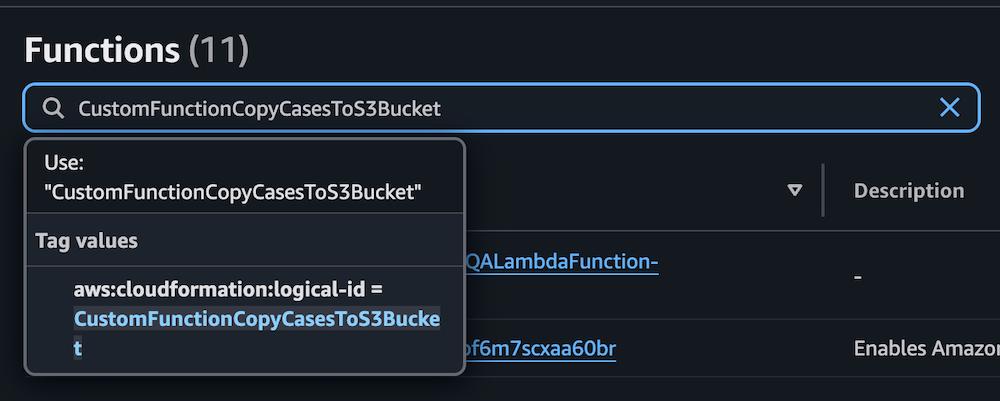
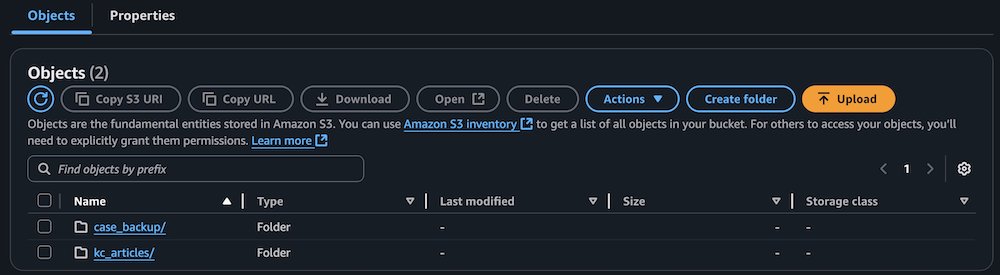
- Confirm the S3 bucket has been populated with archived technical articles and cases.
Sync data to the Amazon Bedrock knowledge base
Complete the following steps to sync the data to your knowledge base:
- On the Lambda console, choose Functions in the navigation pane.
- Choose the function
KBDataSourceSync.
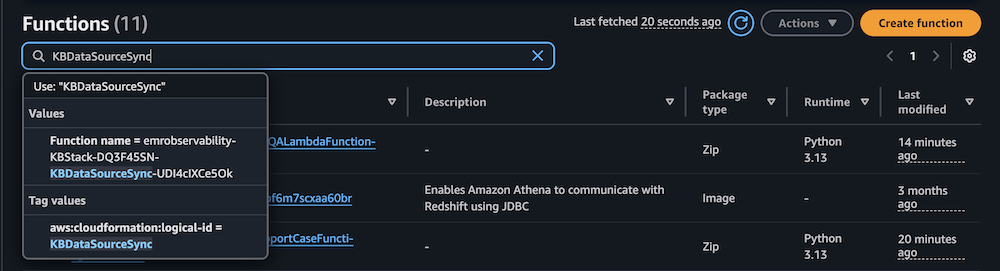
- Manually invoke the function by choosing Test on the Test tab.
This task might take 10–15 minutes to complete.

- Verify successful execution by checking the CloudWatch logs.

Configure your Amazon Managed Grafana workspace
Complete the following steps to configure your Amazon Managed Grafana workspace:
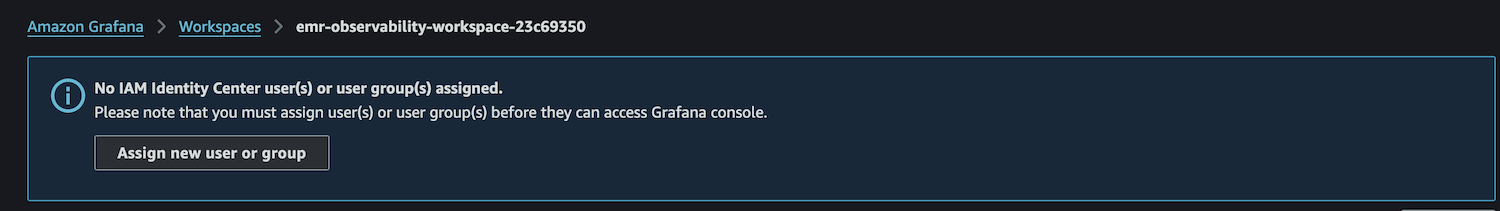
- On the Amazon Managed Grafana console, choose Workspaces in the navigation pane.
- Open your workspace.
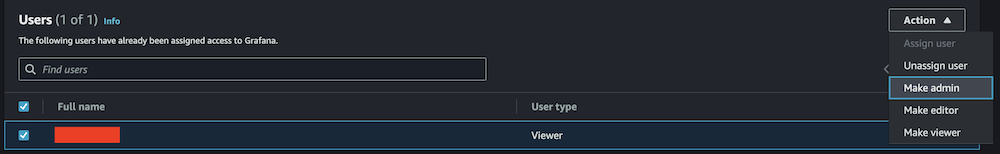
- Choose Assign new user or group.
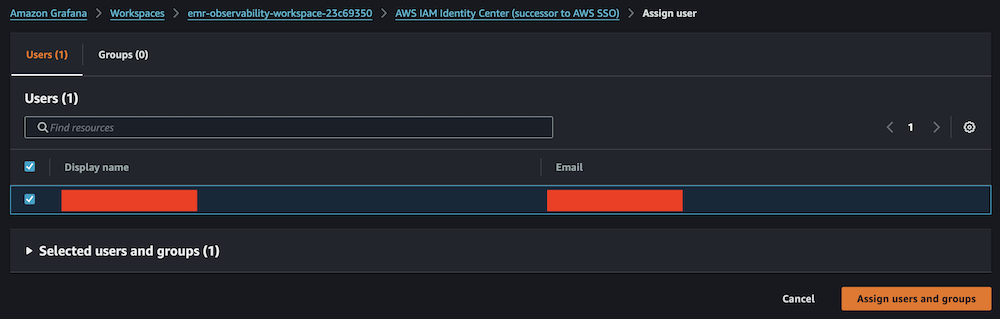
- Select your IAM Identity Center role and choose Assign users and groups.
- On the Admin dropdown menu, choose Make admin.
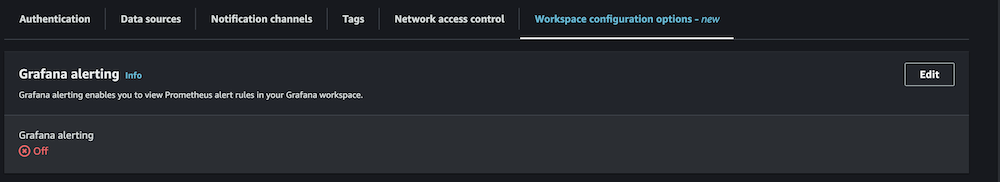
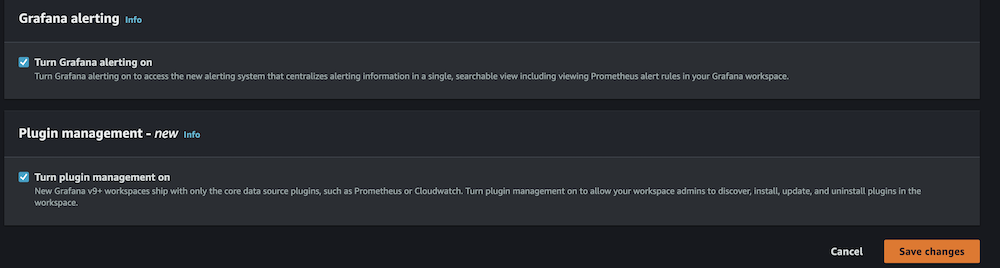
- Enable Grafana alerting, then choose Save changes.
- Wait 10 minutes for the workspace to become active.
- When it’s active, sign in to the Grafana workspace. (For more information, refer to Connect to your workspace.)
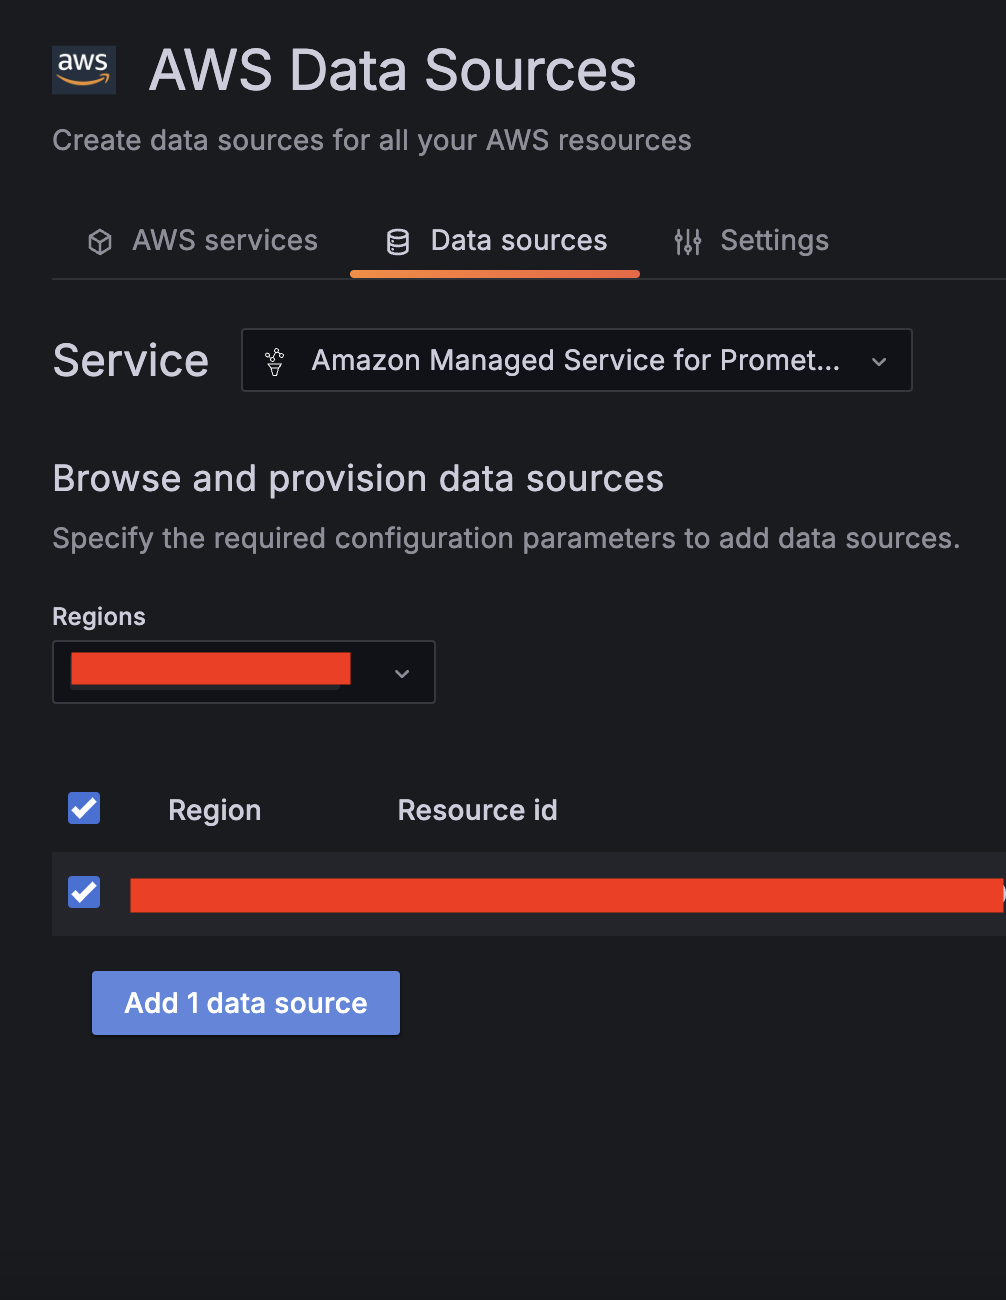
Configure data sources
Add and configure the following data sources:
- For Service, choose CloudWatch, then select your Region and add CloudWatch as a data source.
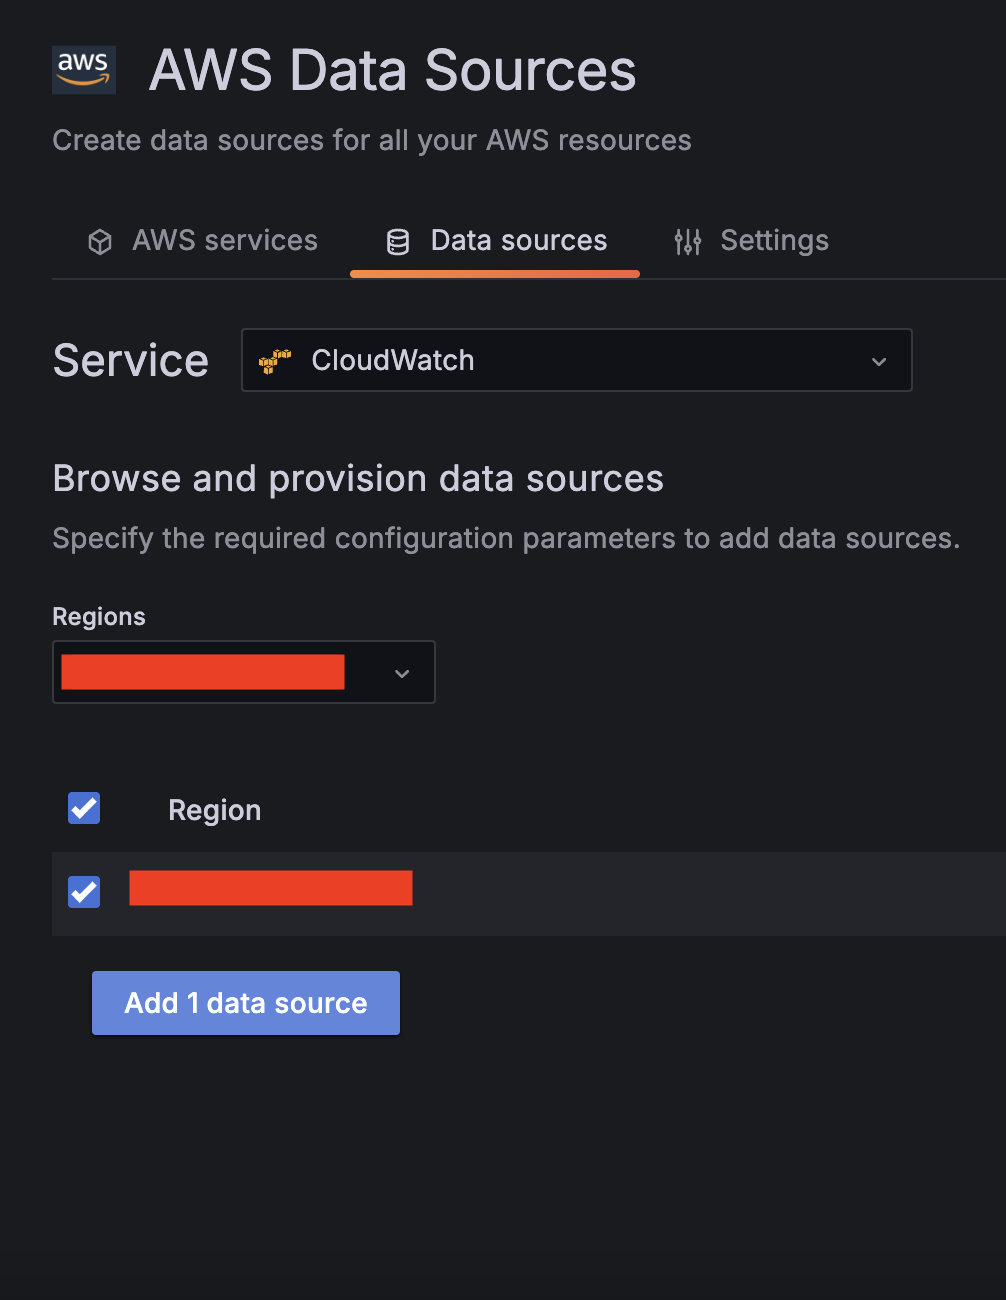
- Choose Amazon Managed Service for Prometheus as a second data source and select your Region.
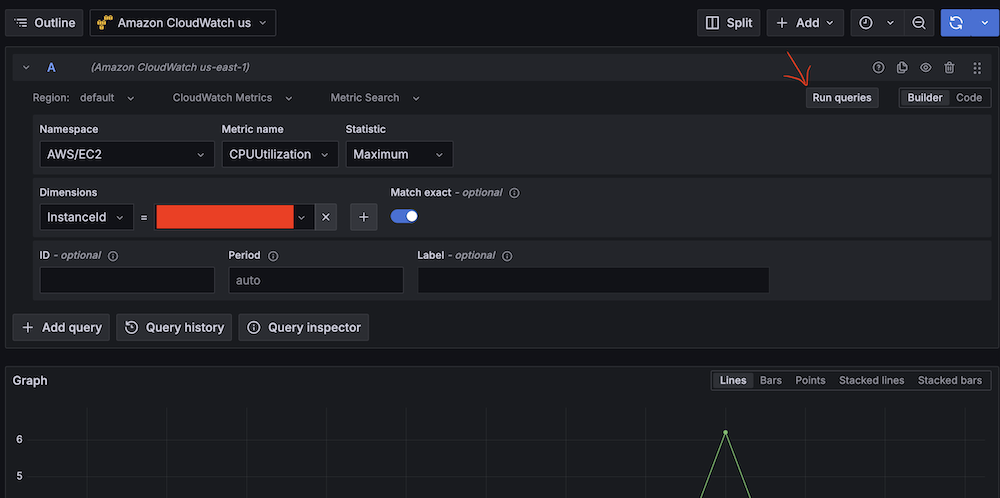
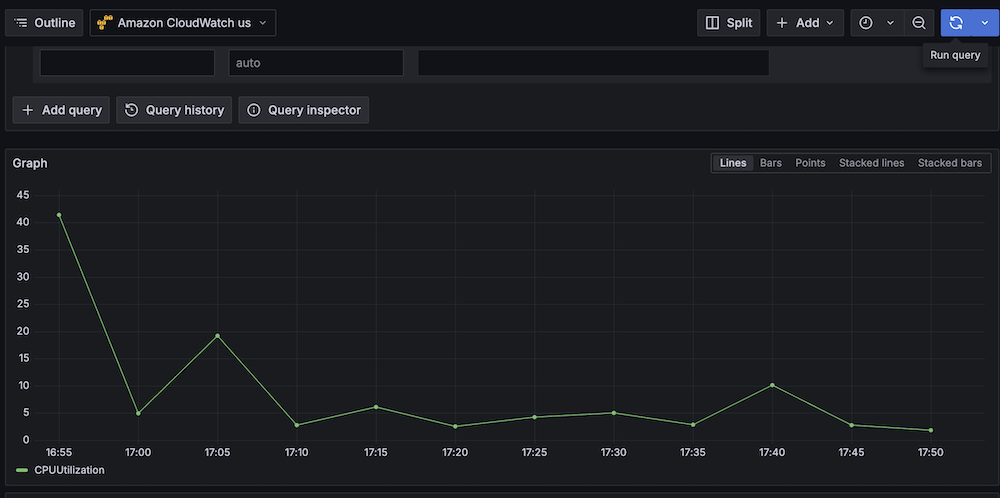
- Validate CloudWatch connectivity:
- Run test queries (for example, Namespace:
AWS/EC2, Metric name:CPUUtilization, Statistic:Maximum).

- Verify CloudWatch metric retrieval.
- Run test queries (for example, Namespace:
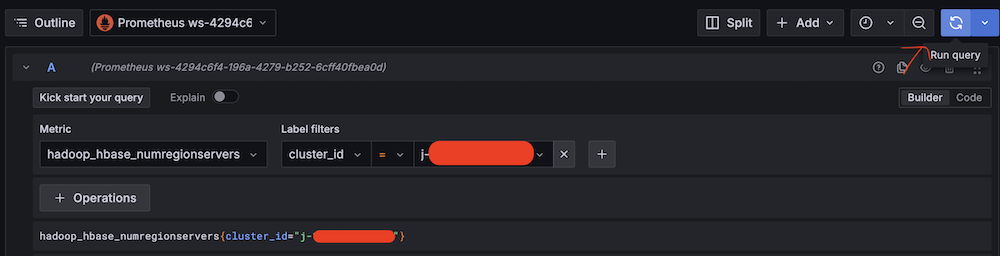
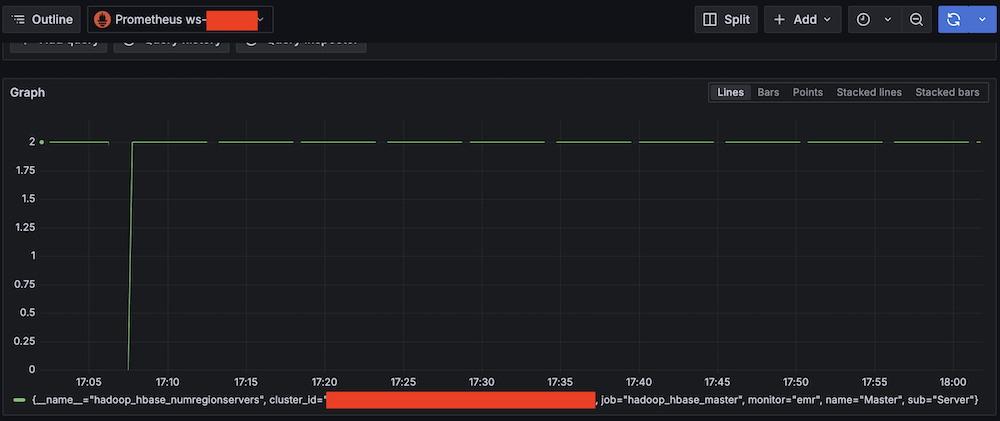
- Validate Amazon Managed Service for Prometheus connectivity:
- Run test queries (for example, Metric:
hadoop_hbase_numregionservers, Label filters:cluster_id = <Amazon EMR cluster ID>).

- Verify Prometheus metric retrieval.

- Run test queries (for example, Metric:
Confirm SNS notification channels
Complete the following steps to confirm your SNS notification is set up:
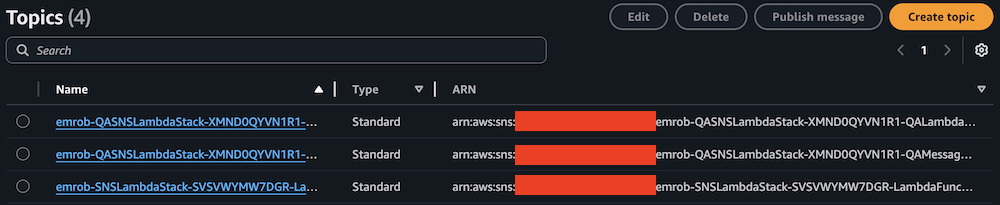
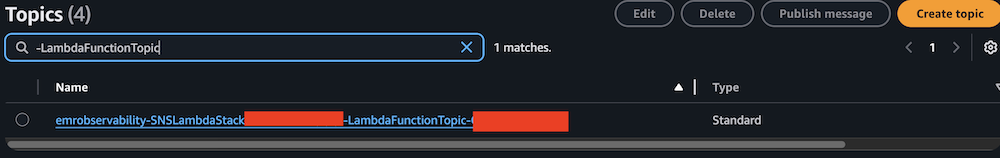
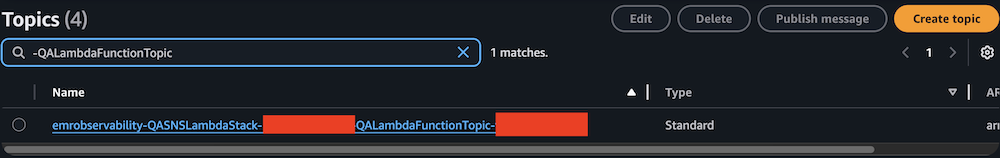
- On the Amazon SNS console, choose Topics in the navigation pane.
- Locate and note the ARNs for
-LambdaFunctionTopicand-QALambdaFunctionTopic.
- Choose Contact points under Alerting.
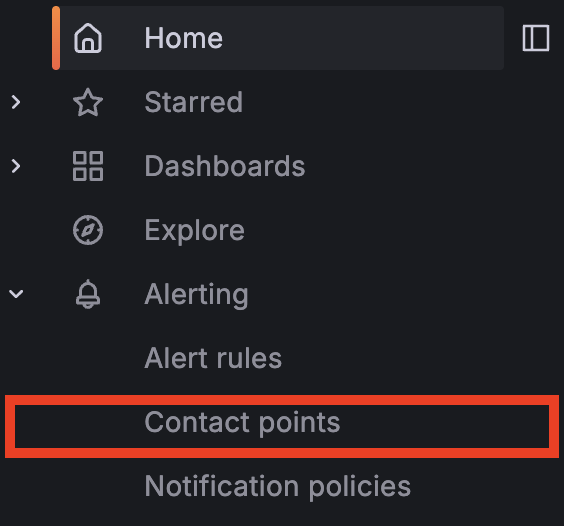
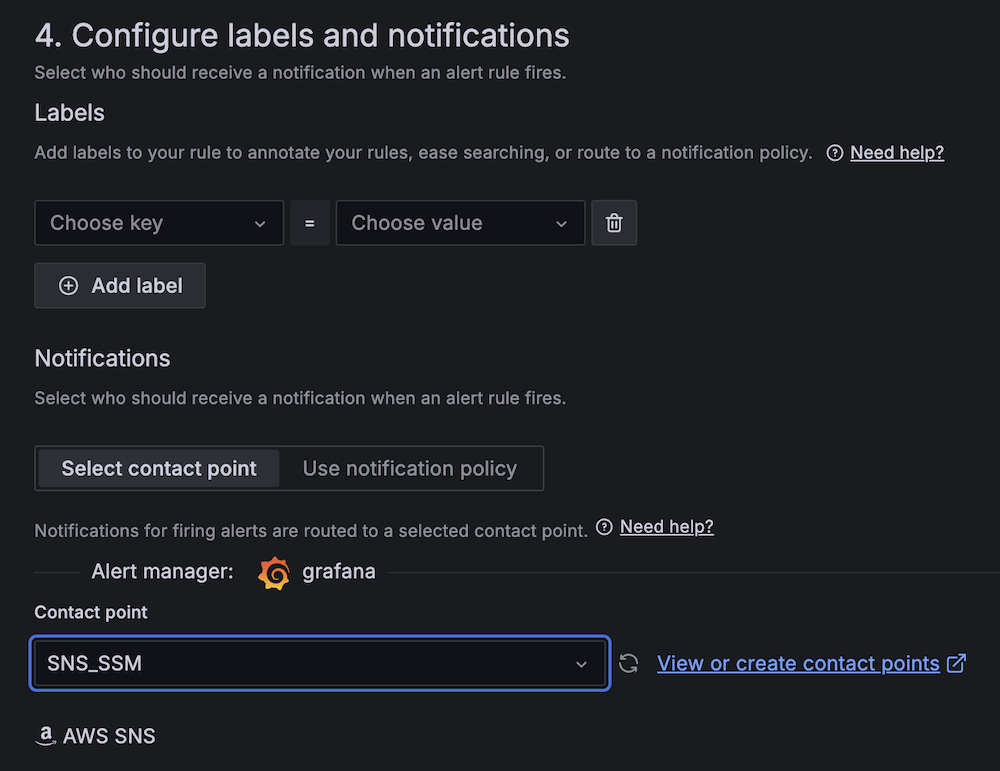
- Create the first contact point:
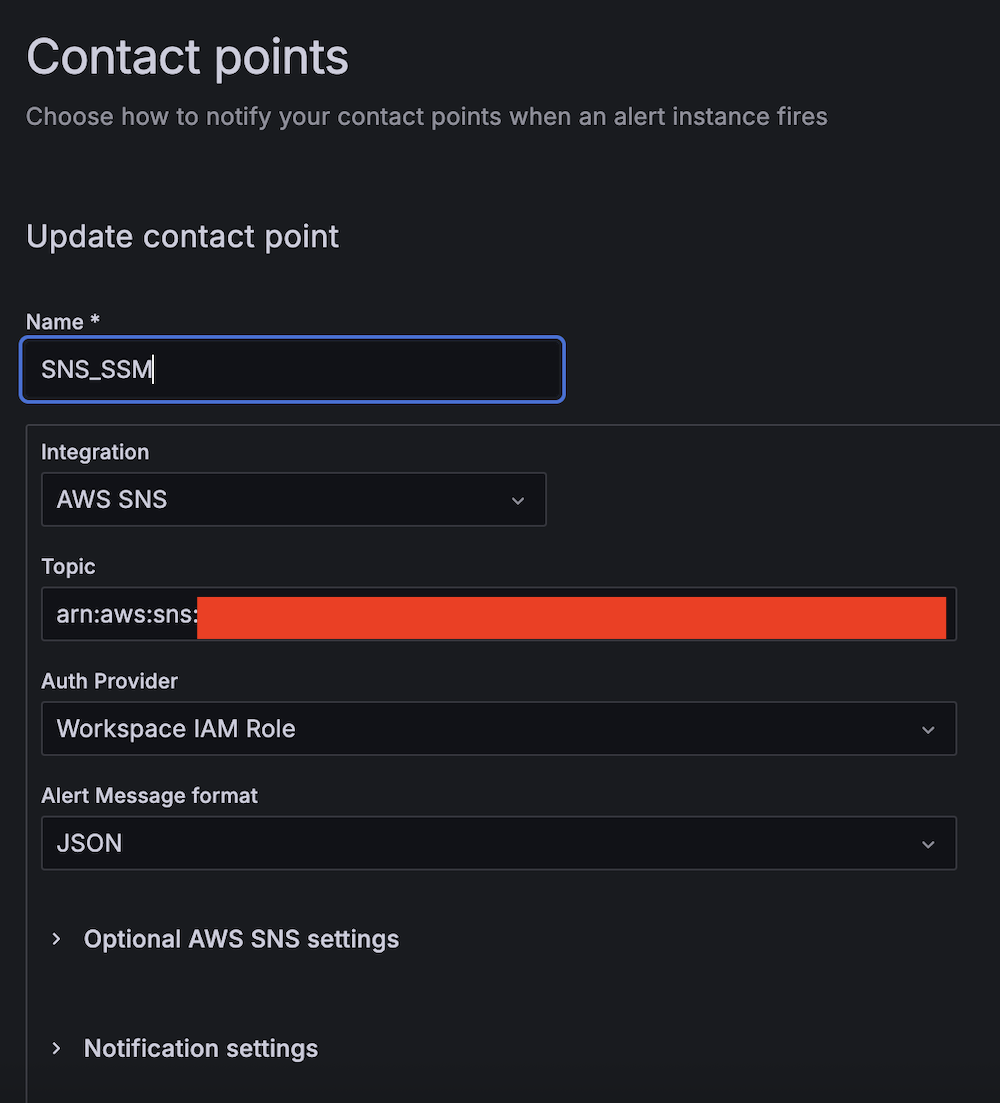
- For Name, enter SNS_SSM.
- For Integration, choose AWS SNS.
- For Topic, enter the ARN for LambdaFunctionTopic.
- For Auth Provider, choose Workspace IAM role.
- For Alert Message format, choose JSON.
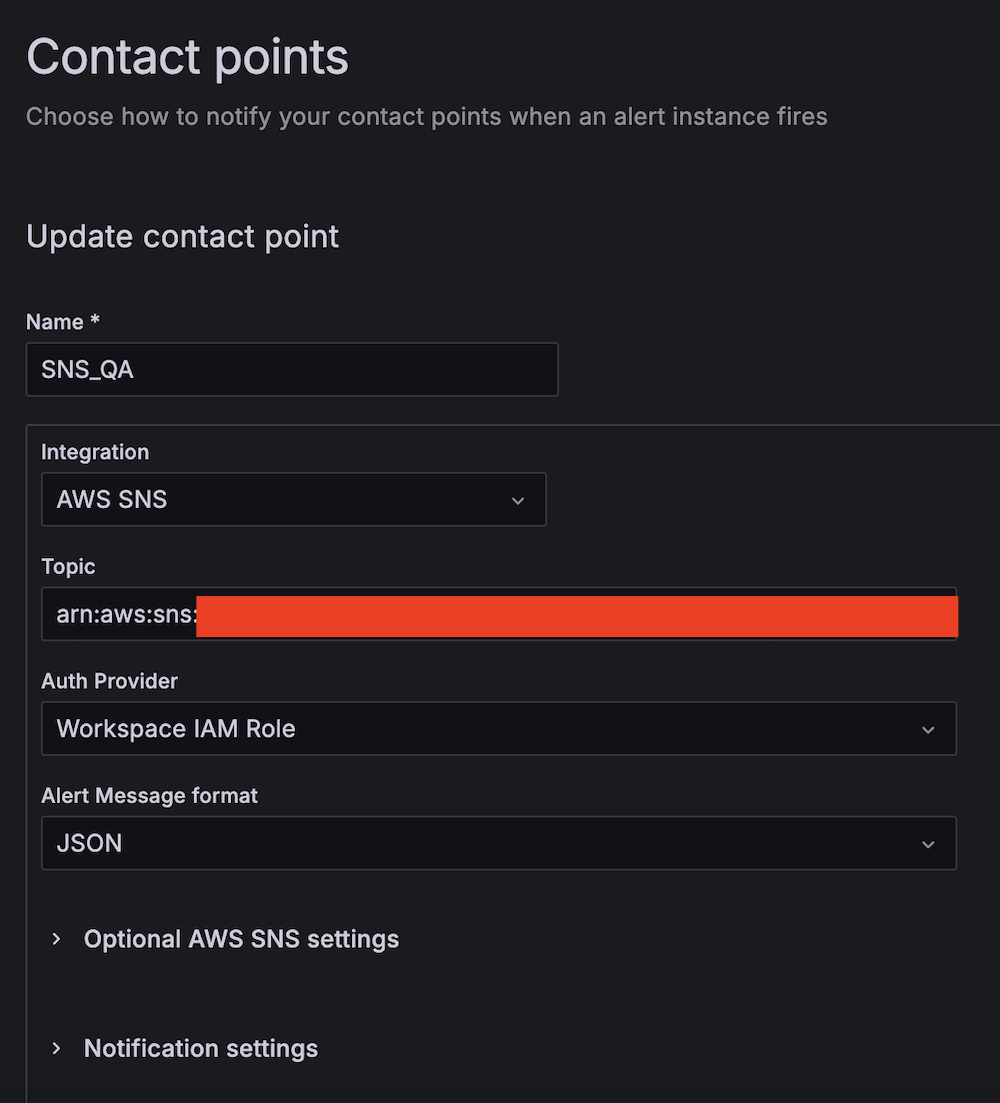
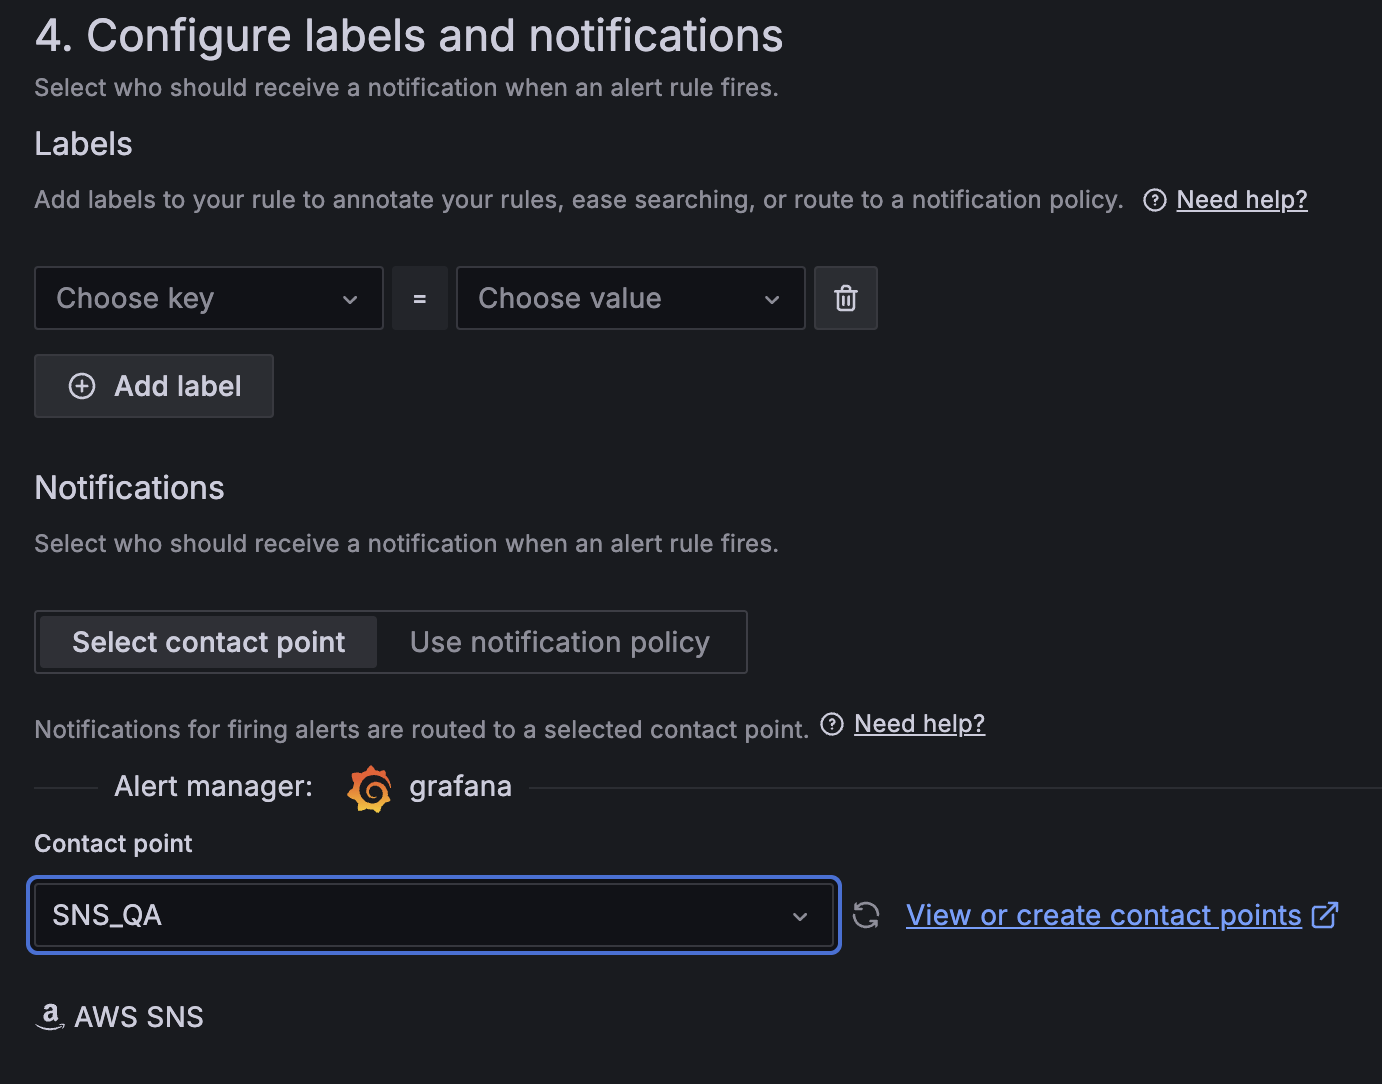
- Create the second contact point:
- For Name, enter SNS_QA.
- For Integration, choose AWS SNS.
- For Topic, enter the ARN for QALambdaFunctionTopic.
- For Auth Provider, choose Workspace IAM role.
- For Alert Message format, choose JSON.
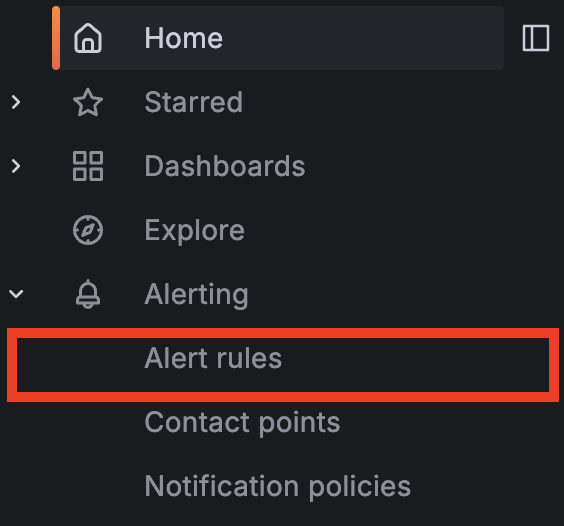
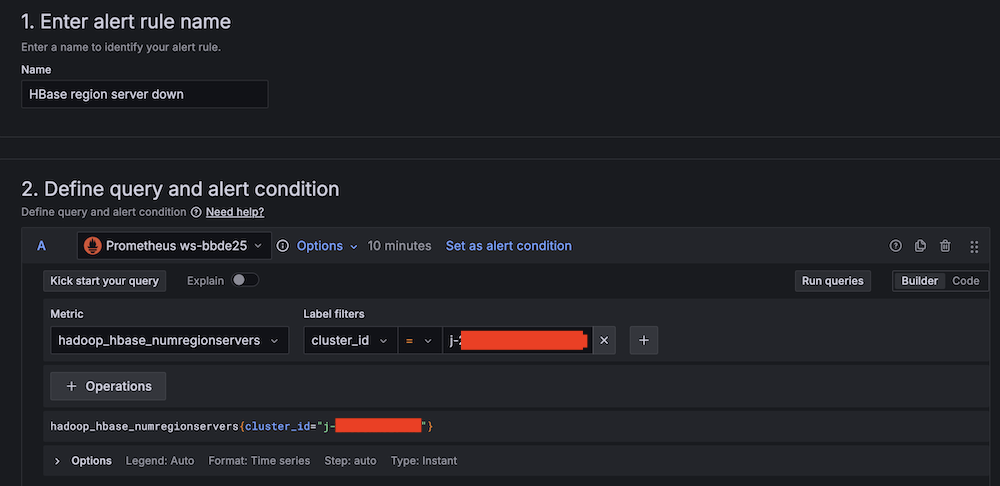
Create alert rules
Complete the following steps to set up two critical alert rules:
- Choose Alert rules under Alerting.
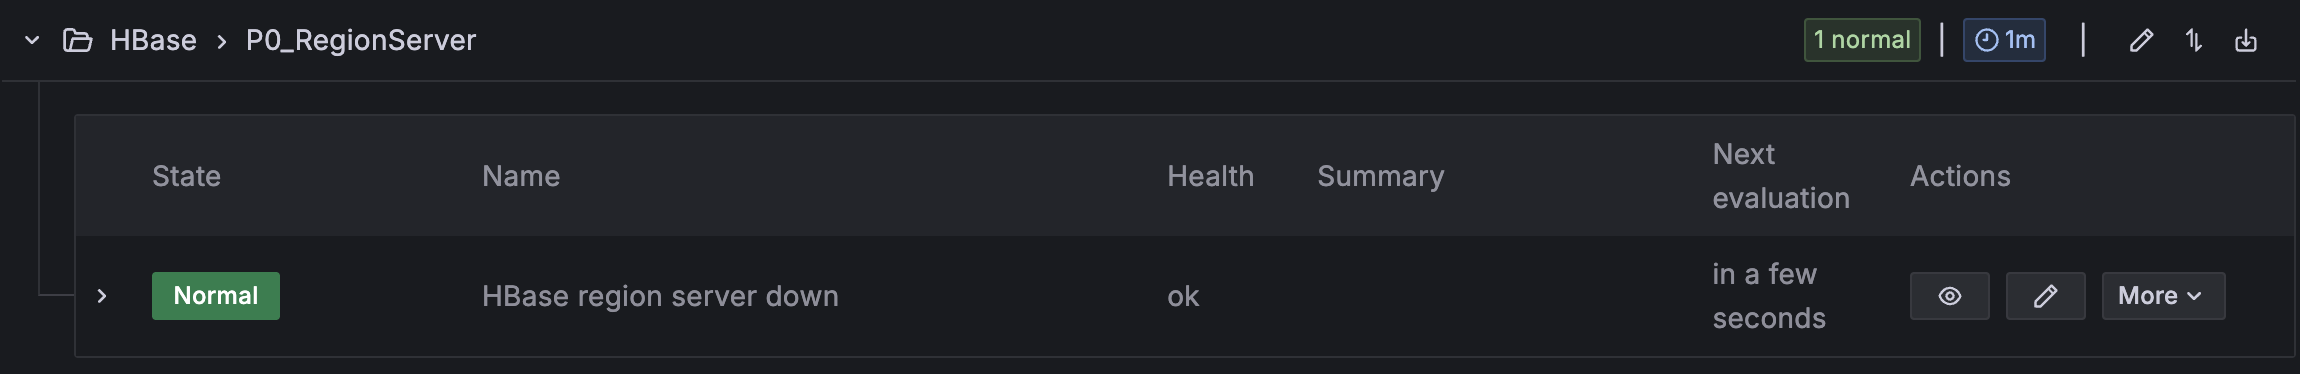
- Set up alerting if the Apache HBase region server status is abnormal:
- For Alert name, enter HBase region server down.
- For Data source, choose Amazon Managed Service for Prometheus.
- For Metric, choose
hadoop_hbase_numregionservers.

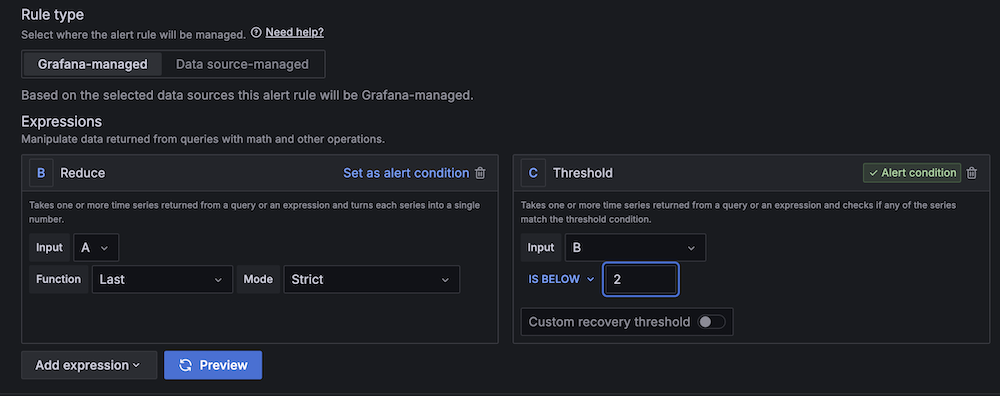
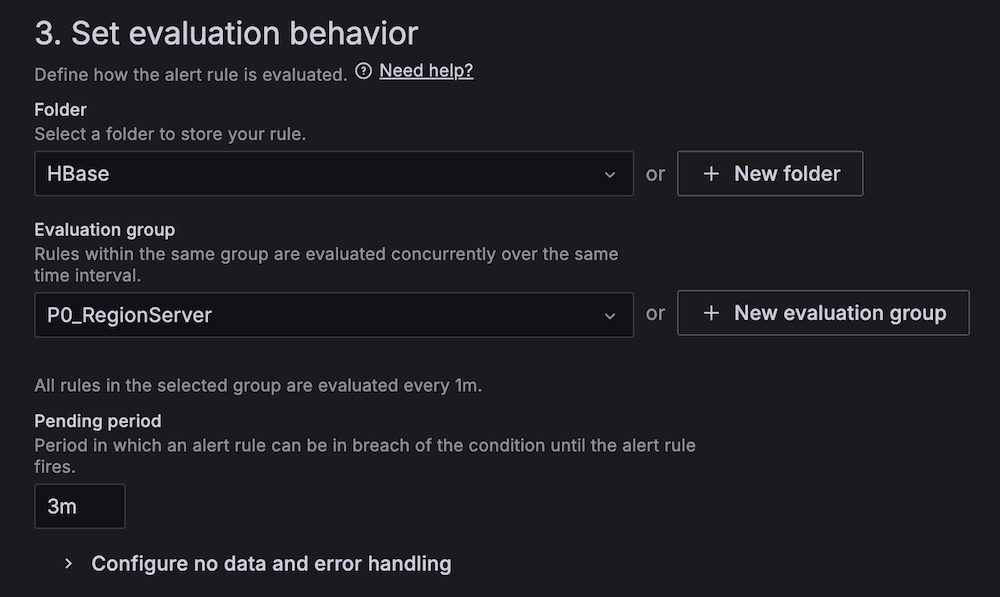
- For Threshold, configure to alert if the region server count is less than 2 for 3 minutes.

- For Evaluation interval, set to 1 minute.


- For Contact point, choose
SNS_SSM.


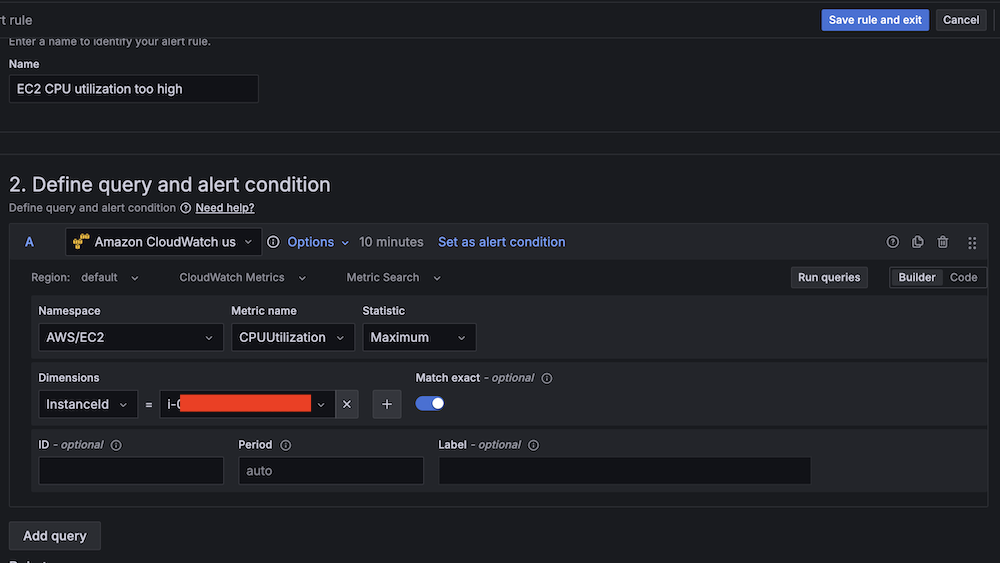
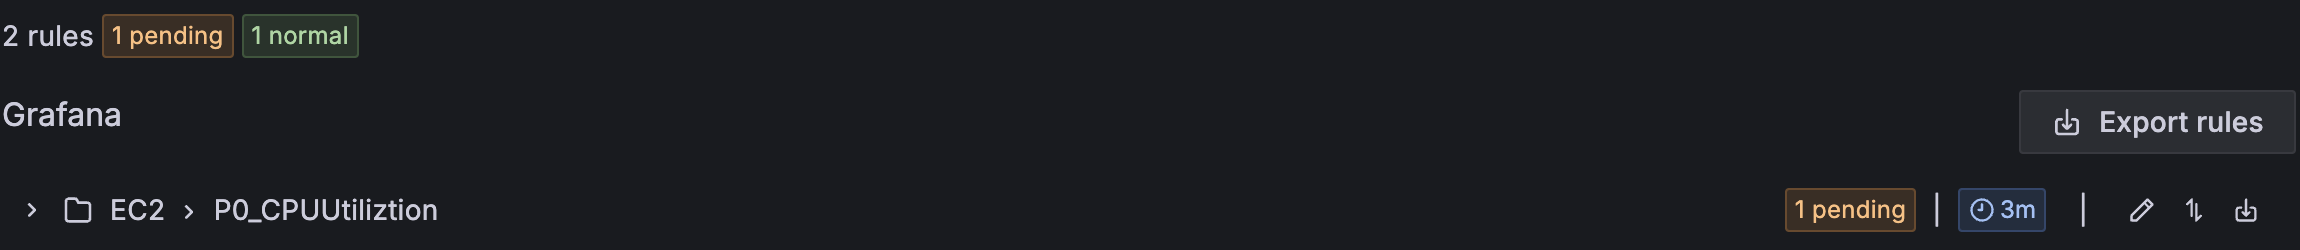
- Create a second alert for if Amazon EC2 CPU utilization is abnormal:
- For Alert name, enter EC2 CPU utilization too high.
- For Data source, choose Amazon CloudWatch.
- For Namespace, choose AWS/EC2.
- For Metric name, choose CPUUtilization
- For Statistic, choose Maximum.

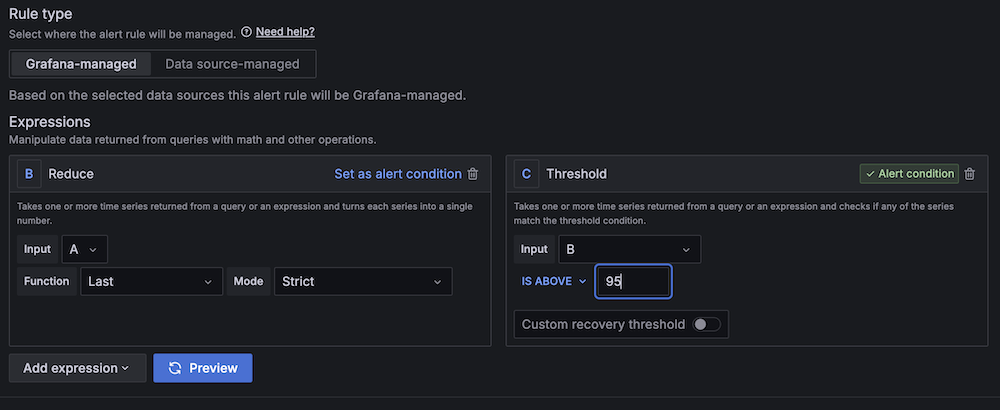
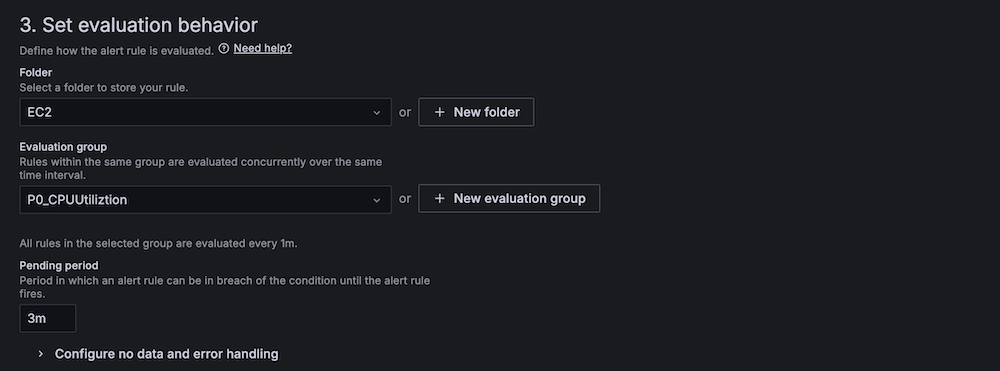
- For Threshold, configure to alert if CPU utilization is more than 95% for 3 minutes.

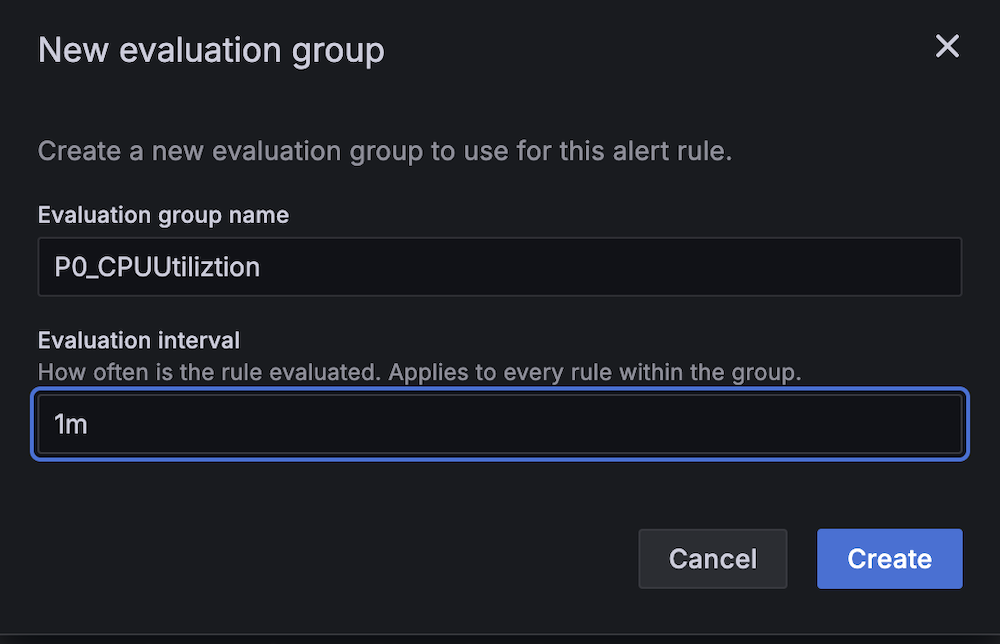
- For Evaluation interval, configure to 1 minute.

- For Contact point, choose
SNS_QA.
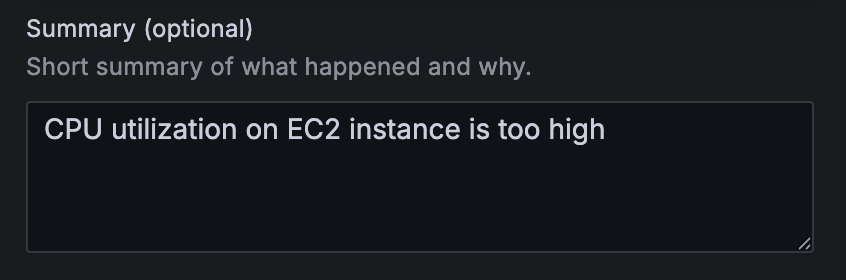
- On the alert rule creation page, scroll to 5. Add annotations and for Summary, add a clear description of the alert, for example, CPU utilization on EC2 instance is too high.
Apache HBase region server incident test
To confirm the system is working as expected, complete the following Apache HBase region server incident test:
- SSH into an EMR core instance.
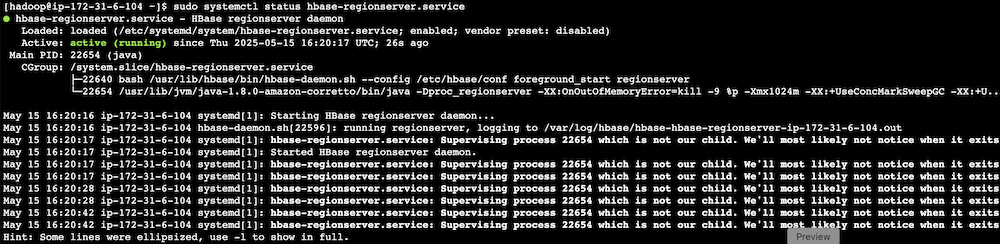
- Stop the Apache HBase region server using systemctl:
- Verify the service status:
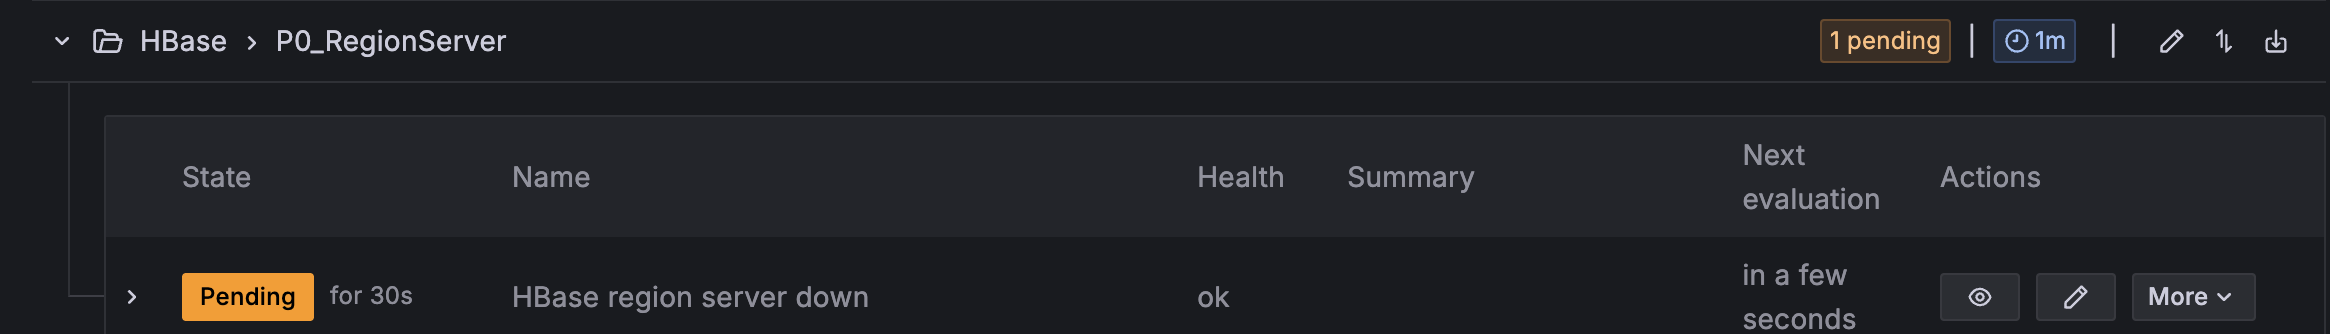
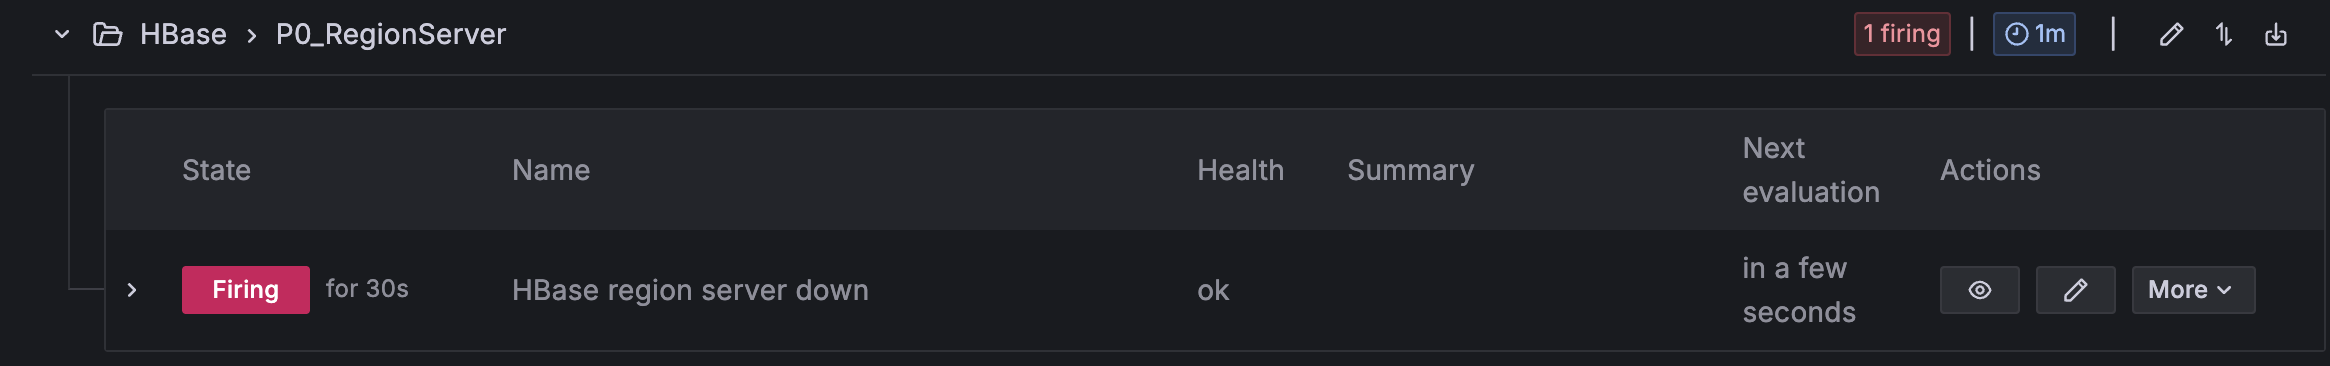
- Observe Amazon Managed Grafana alert progression:
- Monitor alert status changes.


- Verify SNS message generation.
- Confirm SQS message queuing.
- Track the Lambda function triggered for remediation.
- Monitor alert status changes.
CPU utilization stress test
Complete the following CPU utilization stress test:
- SSH into the EMR primary instance.
- Install stress testing tools:
- Verify the installation:
- Generate high CPU load using the stress command and the following command structure:
For our Amazon EMR test, use the following command:
-c 4 in the command creates 4 CPU-bound processes (one for each vCPU).The following are instance type vCPUs for your reference:
- m5.xlarge: 4 vCPUs
- m5.2xlarge: 8 vCPUs
- m5.4xlarge: 16 vCPUs
- Monitor system response:
- Observe Amazon Managed Grafana alert status changes.

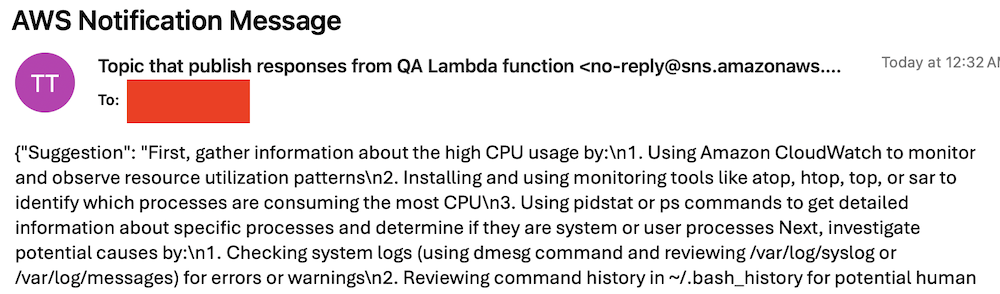
- Verify Amazon Bedrock recommendation generation.
- Check SNS email notification delivery.


- Observe Amazon Managed Grafana alert status changes.
Best practices and considerations
Monitoring infrastructure requires precise alert prioritization and threshold configuration. Alert aggregation techniques prevent notification overload by consolidating event streams and reducing redundant alerts. Operational teams must maintain dashboards through consistent updates and metric integration, providing real-time visibility into system performance and health.
Security implementations focus on least-privilege AWS Identity and Access Management (IAM) roles, restricting access to critical resources and minimizing potential breach vectors. Data protection strategies involve encryption protocols for information at rest and in transit, using AES-256 standards. Automated security audit processes scan automation scripts, identifying potential vulnerabilities through code analysis and runtime inspection.
Performance optimization in serverless architectures uses Lambda extensions to cache knowledge base content, reducing latency and improving response times. Retry mechanisms for API calls implement exponential backoff strategies, mitigating transient network exceptions and enhancing system resilience. Execution time monitoring of Lambda functions enables detection of anomalies through statistical analysis, providing insights into potential system-wide incidents or performance degradations.
Clean up
To avoid incurring future charges, delete the resources by deleting the parent stack on the AWS CloudFormation console.
Conclusion
This solution provides a robust framework for automated EMR cluster monitoring and incident response. By combining real-time monitoring with AI-powered remediation suggestions and automated execution, organizations can significantly reduce MTTR for common Amazon EMR issues while building a knowledge base for future incident response.
Try out this solution for your own use case, and leave your feedback in the comments section.
About the authors
 Yu-ting Su, Sr. Hadoop System Engineer, AWS Support Engineering. Yu-Ting is a Sr. Hadoop Systems Engineer at Amazon Web Services (AWS). Her expertise is in Amazon EMR and Amazon OpenSearch Service. She’s passionate about distributing computation and helping people to bring their ideas to life.


 Lorenzo Nicora works as Senior Streaming Solution Architect at AWS, helping customers across EMEA. He has been building cloud-centered, data-intensive systems for over 25 years, working across industries both through consultancies and product companies. He has used open-source technologies extensively and contributed to several projects, including Apache Flink, and is the maintainer of the Flink Prometheus connector.
 Francisco Morillo is a Senior Streaming Solutions Architect at AWS. Francisco works with AWS customers, helping them design real-time analytics architectures using AWS services, supporting Amazon MSK and Amazon Managed Service for Apache Flink. He is also a main contributor to the Flink Prometheus connector.


 Balaji Mohan is a Senior Delivery Consultant specializing in application and data modernization to the cloud. His business-first approach provides seamless transitions, aligning technology with organizational goals. Using cloud-centered architectures, he delivers scalable, agile, and cost-effective solutions, driving innovation and growth.
 Senthil Ramasamy is a Senior Database Consultant at Amazon Web Services. He works with AWS customers to provide guidance and technical assistance on database services, helping them with database migrations to the AWS Cloud and improving the value of their solutions when using AWS.
 Muthu Pitchaimani is a Search Specialist with Amazon OpenSearch Service. He builds large-scale search applications and solutions. Muthu is interested in the topics of networking and security, and is based out of Austin, Texas.


 Ajit Puthiyavettle is a Solution Architect working with enterprise clients, architecting solutions to achieve business outcomes. He is passionate about solving customer challenges with innovative solutions. His experience is with leading DevOps and security teams for enterprise and SaaS (Software as a Service) companies. Recently he is focussed on helping customers with Security, ML and HCLS workload.