All posts by Landon Dalke

Method to an Old Consultant’s Madness with Site Design

Post Syndicated from Landon Dalke original https://blog.rapid7.com/2023/12/04/method-to-an-old-consultants-madness-with-site-design/

Method to an Old Consultant's Madness with Site Design

If it’s your first time purchasing and setting up InsightVM – or if you are a seasoned veteran – I highly recommend a ‘less is more’ strategy with site design. After many thousands of health checks performed by security consultants for InsightVM customers, the biggest challenge most consultants agree on is site designs with too many sites not healthy. When you have too many sites, it also means you have too many scan schedules, which are the most complex elements of a deployment. Simplifying your site structure and scan schedules will allow you to better optimize your scan templates, leading to faster scanning and fewer potential issues from overlapping scans.

Weekly scanning cadence is the best practice.

The main goal is to use sites to bring data into the database as efficiently as possible and not to use sites to organize assets (data). For data organization, you will want to exclusively use Dynamic Asset Groups (DAGs) or Query Builder, then use these DAGs as your organized scope point for all reporting and remediation projects. Using Dynamic Asset Groups for all data organization will reduce the need for sites and their respective scan schedules, making for a much smoother, automatable, maintenance-free site experience.

For example, if you have a group of locations accessible by the same scan engine:

Site A, managed by the Desktop team using IP scope 10.10.16.0/20

Site B, managed by the Server team using 10.25.10/23

Site C, managed by the Linux team using 10.40.20.0/22

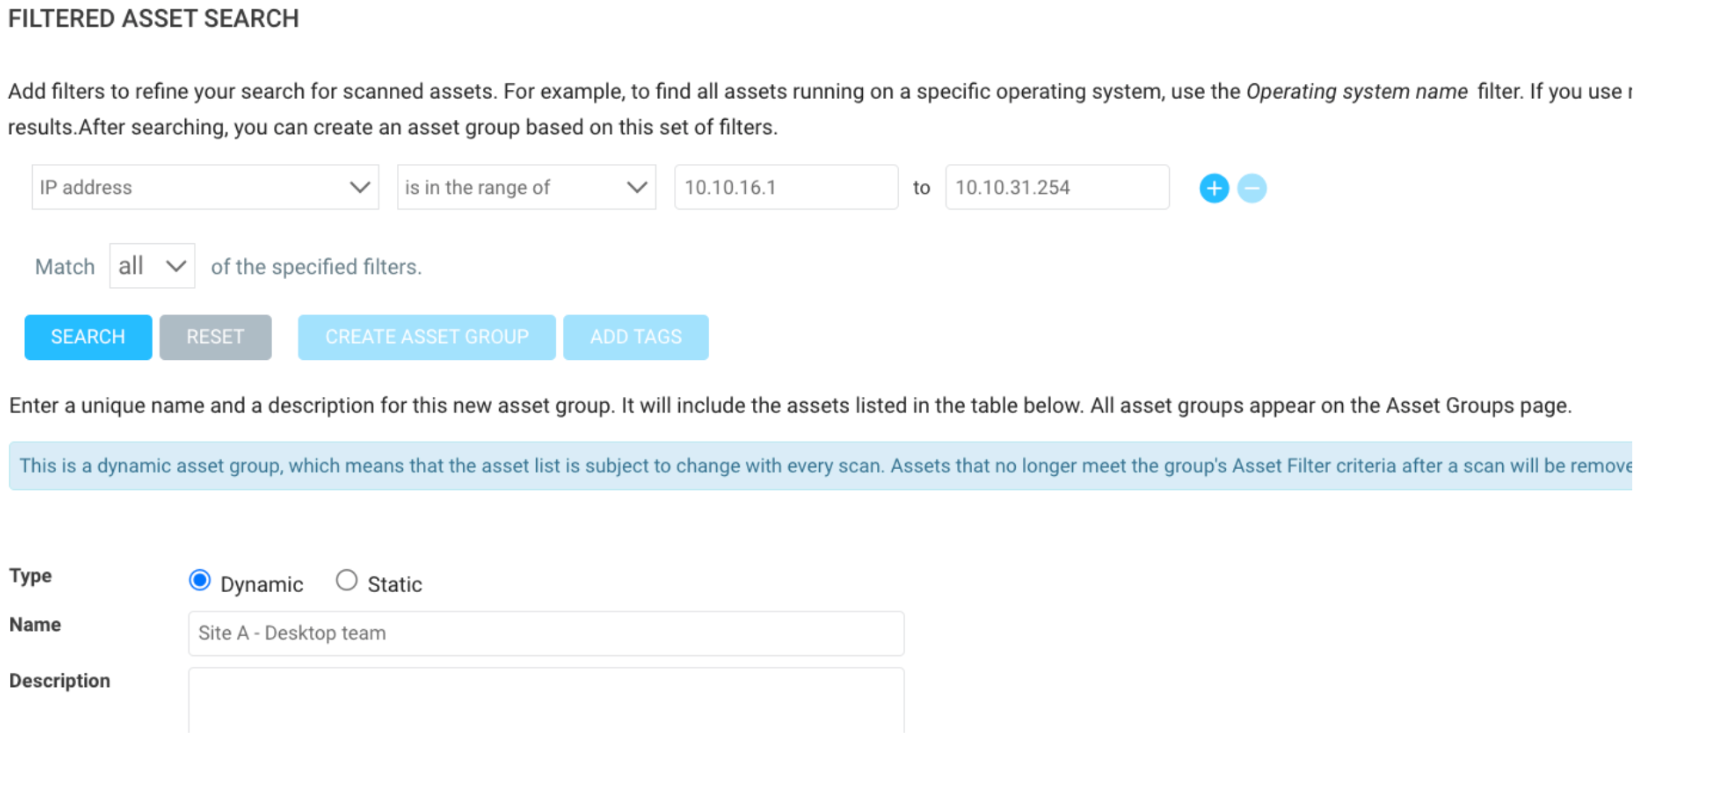
Instead of creating three separate sites for each location, which would require three separate schedule points, it would be better to put all three ranges in a single site (as long as they are using the same scan engine and same scan template), then create three Dynamic Asset Groups based on IP Address: ‘is in the range of’ filtering. This way, we can still use the DAGs to scope the reports and a single combined site with a single scan schedule. Example DAG:

Method to an Old Consultant's Madness with Site Design

Another reason why this is important is that over the last 10 years, scanning has become extremely fast and is way more efficient when it comes to bulk scanning. For example, 10 years ago, InsightVM (or Nexpose at the time) could only scan 10 assets at the same time using a 16GB Linux scan engine, whereas today, with the same scan engine, InsightVM can scan 400 assets at the same time. Nmap has also significantly increased in speed; it used to take a week to scan a class A network range, but now it should take less than a day, if not half a day. More information about scan template tuning can be found on this Scan template tuning blog.

Depending on your deployment size, it is okay to have more than one site per scan engine; the above is a guideline – not a policy – for a much easier-to-maintain experience. Just keep these recommendations in mind when creating your sites. Also, keep in mind that you’ll eventually want to get into Policy scanning. For that, you’ll need to account for at least 10 more policy-based sites, unless you use agent-based policy scanning. Keeping your site design simple will allow for adding these additional sites in the future without really feeling like it’s adding to the complexity. Check out my Policy Scanning blog for more insight into Policy scanning techniques:

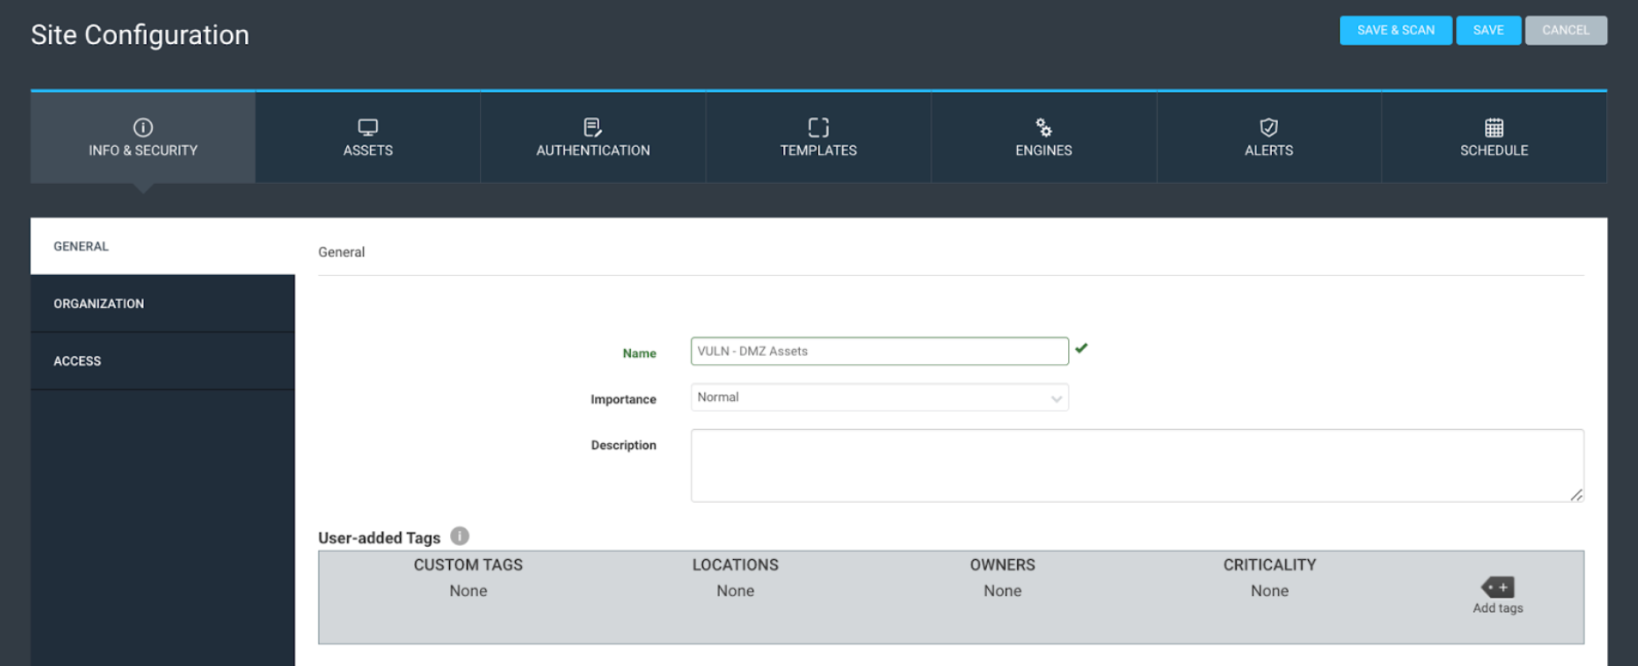
Next, let’s quickly walk through a site and its components. The first tab is the ‘Info and Security’ tab. It contains the site name, description, importance, tagging options, organization options, and access options. Most companies only set a name on this page. I generally don’t recommend using tags with sites and only tagging DAGs. The ‘importance’ option is essentially obsolete, and the organization and access are optional. The only requirement in this section is the site Name.

Method to an Old Consultant's Madness with Site Design

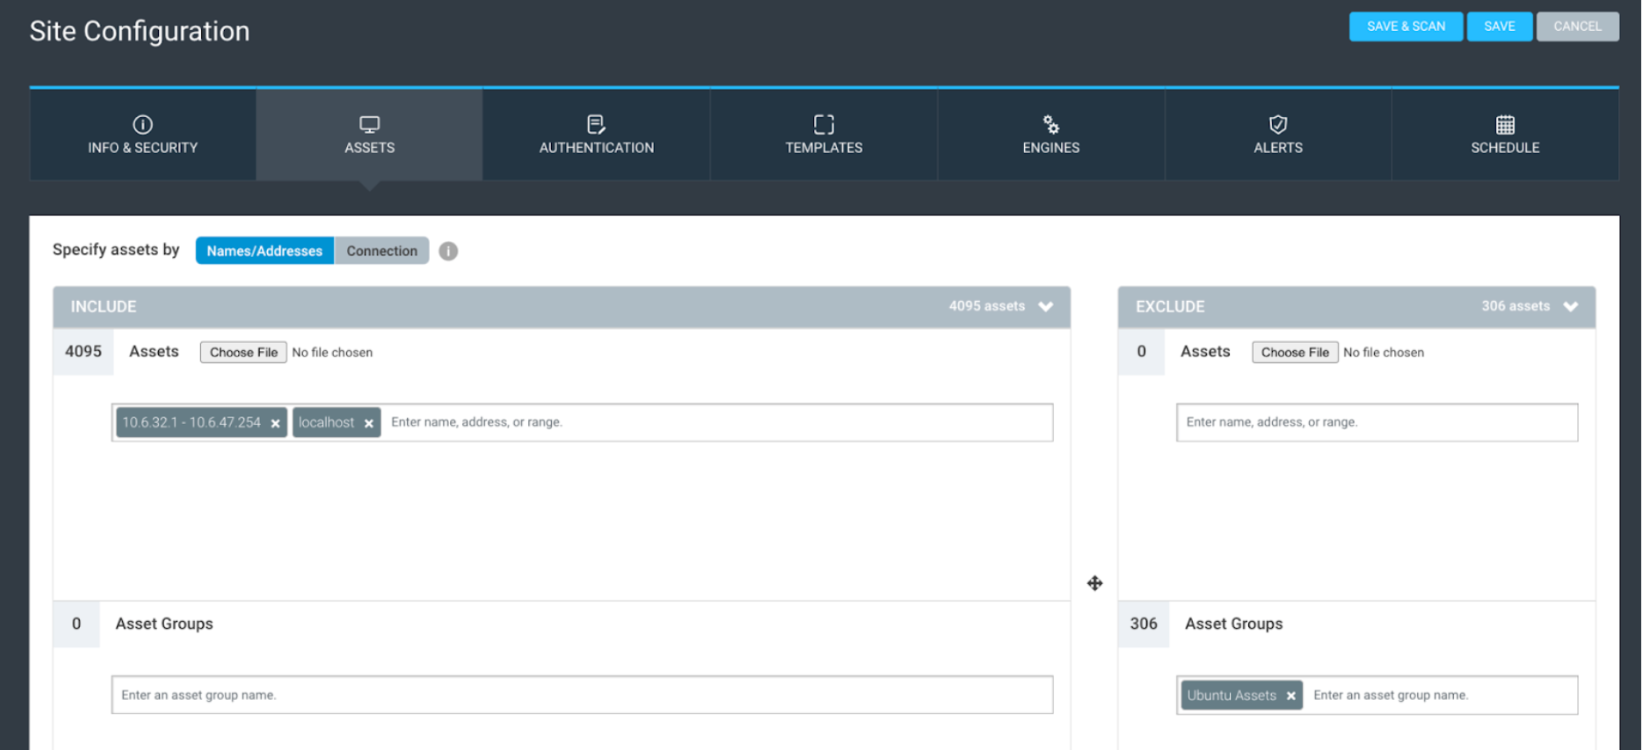
The Assets tab is next, where you can add your site scope and exclusions. Assets can be added using IP address ranges, CIDR (slash notation), or hostname. If you have a large CSV of assets, you can copy them all and paste them in, and the tool should account for them. You can also use DAGs to scope and exclude assets. There are many fun strategies for scoping sites via DAGs, such as running a discovery scan against your IP ranges, populating the DAGs with the results, and vulnerability scanning those specific assets.

The last part of the assets tab is the connection option, where you can add dynamic scope elements to convert the site into a dynamic site. You can find additional information regarding dynamic site scoping here.

Method to an Old Consultant's Madness with Site Design

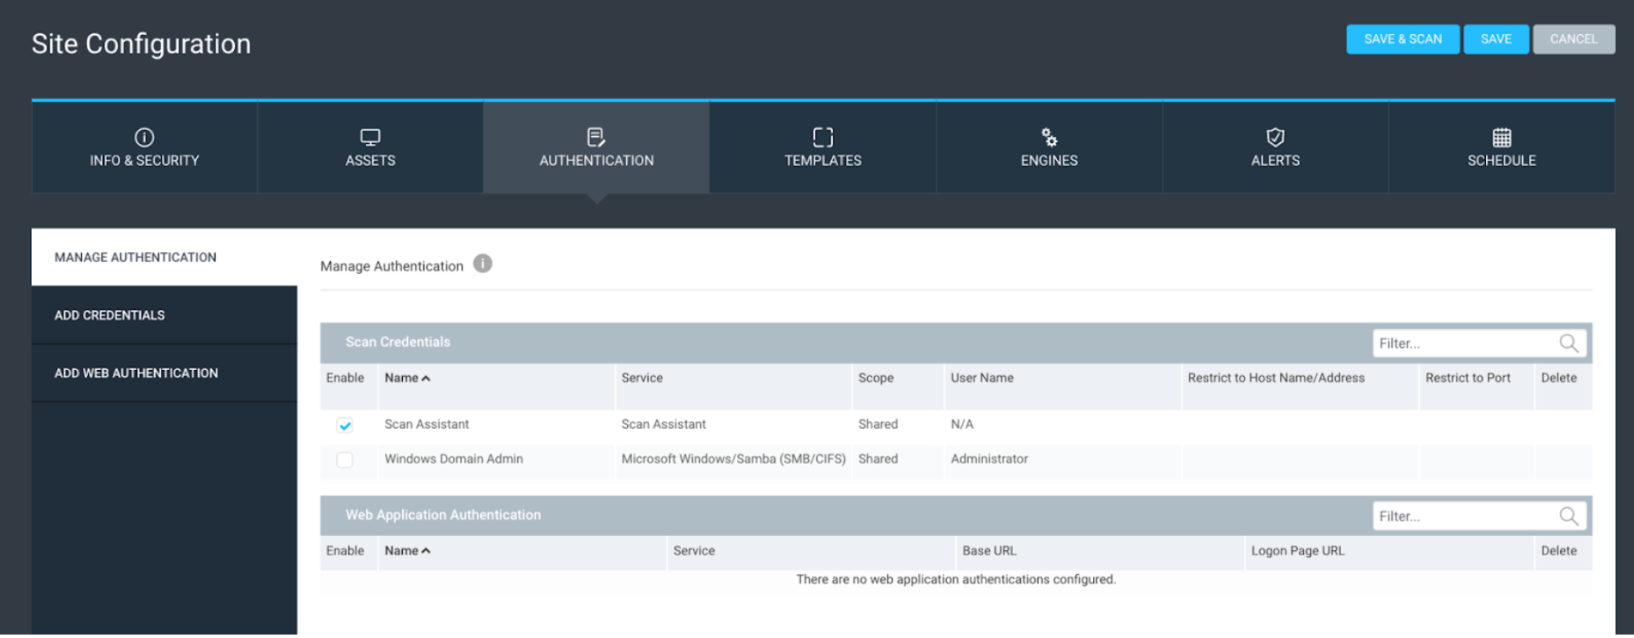
The authentication tab should only validate that you have the correct shared credentials for the site scope. You should always use shared credentials over credentials created within the site.

Method to an Old Consultant's Madness with Site Design

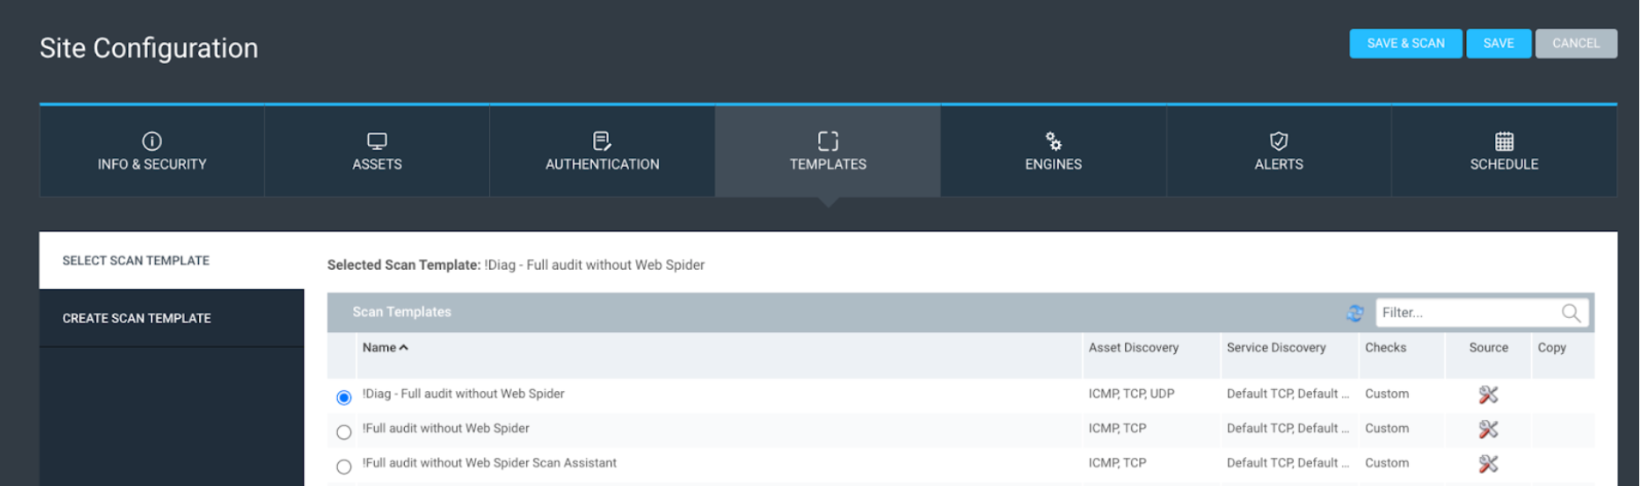
For the scan template section, I recommend using either the ‘full audit without web spider,’ discovery scan, or a custom-built scan template using recommendations from the scan template blog mentioned above.

Method to an Old Consultant's Madness with Site Design

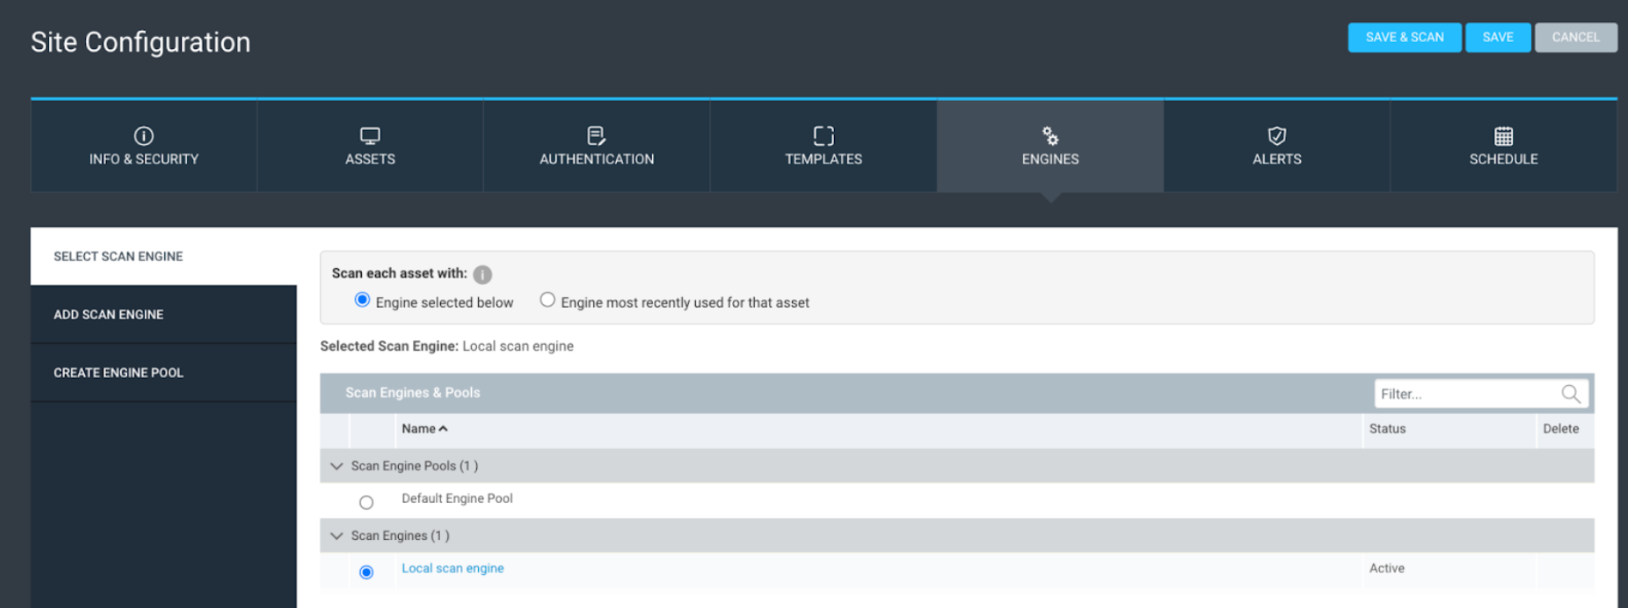
In the scan engine tab, select the scan engine or pool you plan to use. Do not use the local scan engine if you’re scanning more than 1500 assets across all sites.

Method to an Old Consultant's Madness with Site Design

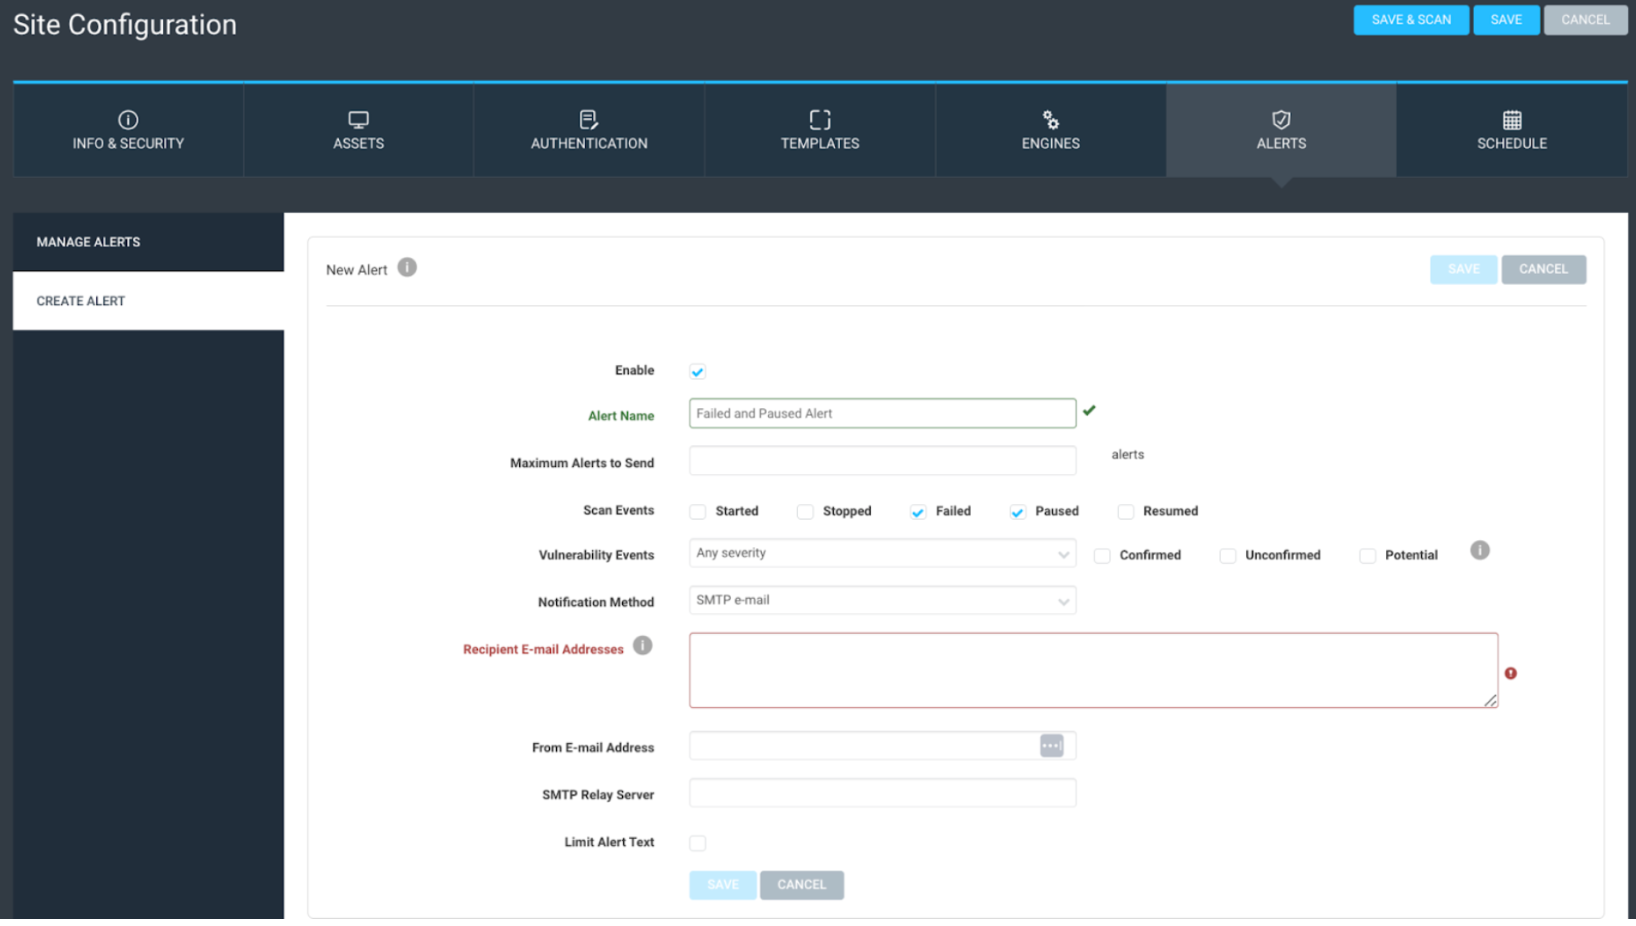
Mostly, I don’t use or recommend using site alerts. If you set up alerts based on vulnerability results, you could end up spamming your email. Two primary use cases for alerts are alerting based on the scan status of ‘failed’ or ‘paused’ or if you want additional alerting when scanning public-facing assets. You can read this blog for additional information on configuring public-facing scanning.

Method to an Old Consultant's Madness with Site Design

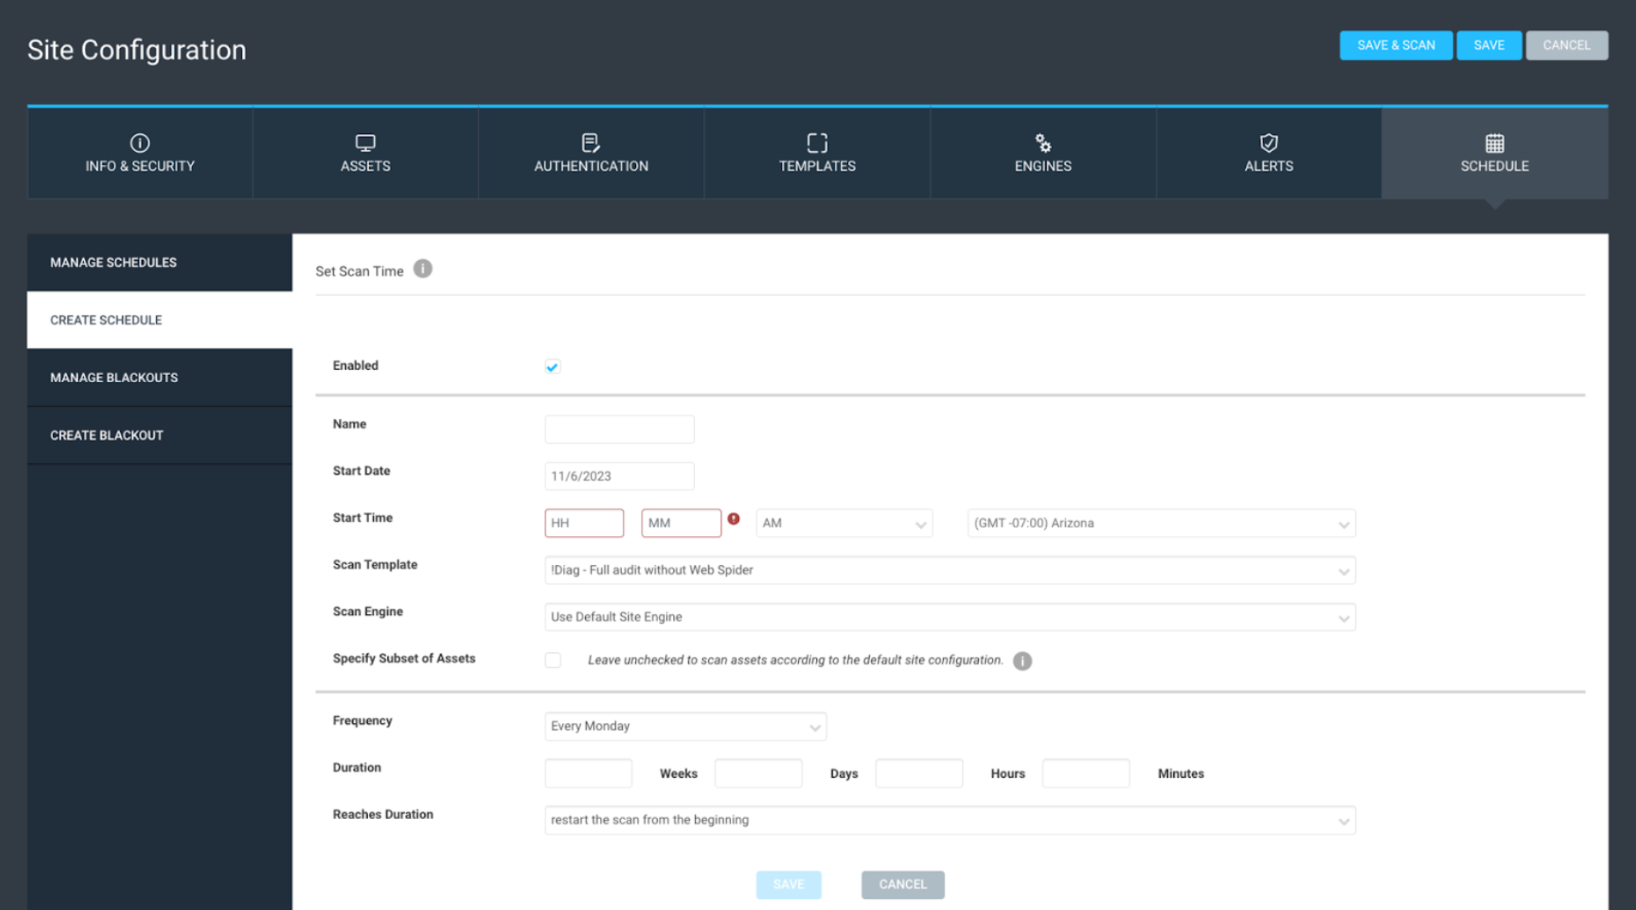
Next, we have schedules. For the most part, schedules are pretty easy to figure out; just note the “frequency” is context-sensitive based on what you choose for a start date. Also, note that sub-scheduling can be used to hide complexity within the schedule. I do not recommend using this option; if you do, only use it sparingly. This setting can add additional complexity, potentially causing problems for other system users if they’re not aware it is configured. You can also set a scan duration, which is a nice feature if you end up with too many sites. It lets you control how long the scan runs before pausing or stopping. If your site design is simple enough, for example, seven total sites for seven days of the week, one site can be scheduled for each day, and there would be no need for a scan duration to be set. Just let the scan run as long as it needs.

Site-level blackouts can also be used, although they’re rarely configured. 10 years ago, it was a great feature if you could only scan in a small window each day, and you wanted to continue scanning the next day in that same scan window. However, scanning is so fast these days that it is almost never used anymore.

Method to an Old Consultant's Madness with Site Design

Lastly, a weekly scanning cadence is a recommended best practice. Daily scanning is unnecessary and creates a ton of excess data – filling your hard drive – and monthly scanning is too far between scans, leading to reduced network visibility. Weekly scanning also allows you to set a smaller asset data retention interval of 30 days, or 4 times your scan cycle, before deleting assets with ‘last scan dates’ older than 30 days. Data retention can be set up in the Maintenance section of the Administration page, which you can read about here.

I am a big advocate of the phrase ‘Complexity is the enemy of security’; complexity is the biggest thing I recommend avoiding with your site design. Whether scanning a thousand assets or a hundred thousand, keep your sites set as close as possible to a 1:1 with your scan engines. Try to keep sites for data collection, not data organization. If you can use DAGs for your data organization, they can be easily used in the query builder, where they can be leveraged to scope dashboards and even projects. Here is a link with more information reporting workflows.

In the end, creating Sites can be easier than creating DAGs. If, however, you put in the extra effort upfront to create DAGs for all of your data organization and keep Sites simple, it will pay off big time. You’ll experience fewer schedules, less maintenance, and hopefully a reduction of that overwhelming feeling seen with so many customers when they have more than 100 sites in their InsightVM deployment.

Additional Reading: https://www.rapid7.com/blog/post/2022/09/12/insightvm-best-practices-to-improve-your-console/

Using InsightVM Remediation Projects To Ensure Accountability

Post Syndicated from Landon Dalke original https://blog.rapid7.com/2023/04/05/using-insightvm-remediation-projects-to-ensure-accountability/

Using InsightVM Remediation Projects To Ensure Accountability

One benefit of InsightVM reporting is that it enables security teams to build accountability into remediation projects. There are a number of ways this can be accomplished and the approach you take will be dictated by your organization’s specific structure and needs.

In this blog, we’ll look at two types of console-driven reports and two types of cloud-driven reports (projects). Depending on who will be conducting remediations, you may choose one over the others. We’ll explore why in detail below.

Reporting Prerequisites

Before we can get too deep into reporting, some prerequisites need to be met. Mainly, we need scan data in the InsightVM console. To get scan data, we need to perform at least one site run against at least one asset (preferably with credentials or Scan Assistant) or at least one Insight Agent deployed. Whether agent-driven or traditionally scanned, the data will be in the form of a Site in InsightVM.

We can then organize the Site data into logical filters called Dynamic Asset Groups, or DAGs. We can create DAGs based on numerous filters; the most common filters are ‘OS’ or ‘IP address in the range of.’ Using these types of Dynamic Asset Groups allows us to create both OS and location-based organization of our scan data, which can later be used to scope both reports and query builder.

Remember: Use Sites and Agents to obtain asset and vulnerability data.  Use DAGs and Tags to organize the data.

Console reports are run from the Reporting link  in the left-hand menu of the InsightVM console. There are two console reports that I recommend to customers. The first is called Top Remediation w/ details.

Using InsightVM Remediation Projects To Ensure Accountability

Top Remediation w/ details reports include a variety of actionable information, such as:

Real Risk Prioritization: Real Risk is great because it factors in CVSSv2 base metrics, potential malware kits and exploit kits, and the publish date (aka how long the vulnerability has been exposed to hackers).

Using InsightVM Remediation Projects To Ensure Accountability

The Risk score value is not the important metric, but instead, how that number compares to the other risk score numbers in the report. Prioritizing the biggest risk score first for maximum impact is a really good way to prioritize.

Solution Driven Remediation: Remediations, also known as Solutions, are the second primary reason to use this report. Solutions are usually cumulative and allow many vulnerabilities to be remediated with a single solution. The Top Remediation report only shows solutions, and when combined with risk, it enables you to see the maximum impact solutions, that will have the most significant impact on reducing risk in your environment.

Ability to change the total number of solutions: The number of solutions can be changed using the reports Advanced Options, so the report is not so intimidating. 25 Solutions is very intimidating/overwhelming, but 5 or 10 solutions are much more consumable by the remediation team.

Details show the Solution and the Assets affected: Details, being the last attribute, allows you to see the solutions for each of the Top Remediations and the assets affected.

The second console-driven report type I like to call out is called a SQL Query Export report. These reports allow customers to use the SQL Query data model to create custom CSV reports that meet their needs. Rapid7 maintains a repository of over 100 example queries on Github.

Both of these reports are highly impactful, however, there is one fundamental question I always ask before recommending them:

Is the security team performing the remediation, or will the reports be sent to another team?

If the security team is responsible for remediation, these console-driven reports are amazing because of self-accountability. However, if reports are going to another team, then one of the cloud-driven reports, aka Remediation Projects, are a better fit. Why? Remediation Projects provide the built-in accountability necessary to make progress. The key word is: Accountability

Accountability is the number one reason I recommend using Remediation Projects over the Top Remediation or SQL Query Export reports. If you generate a Top Remediation report and send it over to say, Bob, Bob may say ‘thanks’, walk around the corner, and throw it in the trash. A month goes by, and you ask, ‘so Bob, how are things going? I’m not seeing much progress’, to which Bob might answer, “prove it”.

If this sounds familiar, that’s because I hear it from many customers I work with that send reports to other teams. With PDF-based, it can be very hard to “prove it”—and then nothing ever gets done.

This is where remediation projects come in. With Remediation Projects, you can track whenever a solution is resolved, and the number cannot be manually manipulated. This means the only way to increase the  ‘solutions resolved’ number is to actually fix the vulnerabilities and validate them with either a scan or an agent assessment. Now when Bob responds with ‘prove it’ you can simply reply with ‘sure, let’s loop in your manager’.

I know this sounds harsh, but it’s a reality many security practitioners have to work with daily.

Built-in accountability makes remediation projects the number one choice for businesses that send reports to other teams for remediation.
So, how do you create the best possible Remediaiton Projects? I usually recommend creating projects by using Dashboards. My personal favorite Dashboard is the Threat Feed Dashboard. This Dashboard can be found by clicking on “See more in the R7 Library”

Using InsightVM Remediation Projects To Ensure Accountability

Then search for Threat, and Add the ‘Threat Feed Dashboard’.

Using InsightVM Remediation Projects To Ensure Accountability

Once this Dashboard comes up, there are three cards that I like to focus on:

Using InsightVM Remediation Projects To Ensure Accountability

First, let’s talk about the ‘Most Common Actively Targeted Vulnerabilities card. This card is driven by Project Heisenberg, which has deployed over 150 honeypots worldwide across five continents.

Using InsightVM Remediation Projects To Ensure Accountability
From: https://www.rapid7.com/blog/post/2017/06/13/live-threat-driven-prioritization/

Prioritization utilizes CVSS, or the Common Vulnerability Scoring System. We also have Real Risk, which enhances CVSS prioritization using additional metrics (exploits, malware, publish age). Lastly, Threat feed, in my opinion, is the next level of Prioritization and should be prioritized highly within your vulnerability remediation program.

How to use Dashboard Cards to create team-based or location-based (scoped) Remediation Projects

Before we dive any further into the Most Common Actively Targeted Vulnerabilities card, I first recommend clicking on the Query Builder. The query builder link can be found in the upper right of the page:

Using InsightVM Remediation Projects To Ensure Accountability

Query Builder is a way to see all of your data, and create filters for that data and save those filters in the form of queries. If you have been following along, then we should already have some DAGs created within the console for data organization. We can use one of those DAG’s to create a filter in Query Builder. For example we can Add a filter for “asset.groups IN” and select one of your asset groups, in my example, I am using Windows Devices:

Using InsightVM Remediation Projects To Ensure Accountability

On my test console, this filters only Windows devices, and I can now Save that query so I can use it to scope my Dashboards and Projects based on the Windows Team.

Using InsightVM Remediation Projects To Ensure Accountability

Once it is saved, hit the X in the upper right corner to exit out of Query Builder.

Now that we have a Saved Query, we can Load that query into our Threat Feed Dashboard by clicking on ‘Load Dashboard Query’:

Using InsightVM Remediation Projects To Ensure Accountability

Once the query is loaded, our Threat Feed Dashboard will now only show assets defined by the Windows Devices query, which is scoped by the Windows Devices DAG within the Console.

This can be helpful if you want to create a custom team-based Dashboard for each team.

Next, if we click on the ‘<Expand Card>’ option within the Most Common Actively Targeted Vulnerability card we can see that the card is also scoped with our Dashboard query. We can then select All of the solutions (Or just the top 10 sorted by risk) and click on ‘Create a Static Remediation Project’ to use the scoped threat feed dashboard card to create a static project. For more information on reating a remediation project, click here.

Using InsightVM Remediation Projects To Ensure Accountability

Lastly, I like to focus on the following two cards with or without a query loaded into the Dashboard:

Using InsightVM Remediation Projects To Ensure Accountability

The above screenshot is lab data by the way, hopefully this doesn’t look familiar. The Most Common Actively Targeted card is amazing and should be prioritized, but I also really like this card as it focuses on Exploitable vulnerabilities by Severity.

Based on the card labeled ‘Exploitable Assets by Skill Level’, we can see in my test environment that 72% of exploitable assets can be exploited by a novice. This should be a very scary number, and we should prioritize reducing this number as quickly as we can.

If we look at the ‘Exploitable Vulnerability Discovery Date by Severity’ card, we can see how long we have known about exploitable vulnerabilities in our environment. The Discovery date is the same as the find date in our own personal environments. Based on the example above, we have over 35,000 critical exploitable vulnerabilities that we have known about for over 90 days and have not fixed. This environment is all test data, but if your environment looks similar this should be a very scary thing to be seeing.

For example, as security practitioners, we should ask the fundamental question, ‘What if I get breached?’. One answer might be to determine the vulnerability that caused the breach. Another might be, how long have we known about the vulnerability and not fixed it? If the answer to that second statement is less than 60 days, hopefully, you can already start thinking about the many excuses we could use; however, if it’s over 90 days, the excuses start to get pretty difficult to come up with.

To prevent not only a breach but also to prevent being in a situation where you need to explain why the breach happened on a vulnerability that has been known about for over 90 days, I highly recommend using this card as a source of data for additional Remediation Projects.

Conclusion

To summarize our journey: We created some sites to bring in vulnerability data into our console. We then organized that data using Dynamic Asset Groups (DAGs). We then used those DAGs to scope query’s (in Query Builder) so we could scope Dashboards. With the scoped dashboard, we get scoped cards which we used to create Projects.

With the Query Builder we get organization. Combining the query with the Threat Feed Dashboard, we get Organized Prioritization. If we then use this data to create Projects we get Organized Prioritization with Accountability. This is a perfect combo to get some work done in reducing vulnerabilities using Reporting.

Remember that the number one reason to use projects is Accountability.

To learn more about InsightVM remediation capabilities, check out the following blog posts:

InsightVM Release Update: Let’s Focus on Remediation for Just a Minute

Decentralize Remediation Efforts to Gain More Efficiency with InsightVM

NEVER MISS A BLOG

Get the latest stories, expertise, and news about security today.