Post Syndicated from Manikanta Gona original https://aws.amazon.com/blogs/big-data/automatically-detect-personally-identifiable-information-in-amazon-redshift-using-aws-glue/
With the exponential growth of data, companies are handling huge volumes and a wide variety of data including personally identifiable information (PII). PII is a legal term pertaining to information that can identify, contact, or locate a single person. Identifying and protecting sensitive data at scale has become increasingly complex, expensive, and time-consuming. Organizations have to adhere to data privacy, compliance, and regulatory requirements such as GDPR and CCPA, and it’s important to identify and protect PII to maintain compliance. You need to identify sensitive data, including PII such as name, Social Security Number (SSN), address, email, driver’s license, and more. Even after identification, it’s cumbersome to implement redaction, masking, or encryption of sensitive data at scale.
Many companies identify and label PII through manual, time-consuming, and error-prone reviews of their databases, data warehouses and data lakes, thereby rendering their sensitive data unprotected and vulnerable to regulatory penalties and breach incidents.
In this post, we provide an automated solution to detect PII data in Amazon Redshift using AWS Glue.
Solution overview
With this solution, we detect PII in data on our Redshift data warehouse so that the we take and protect the data. We use the following services:
- Amazon Redshift is a cloud data warehousing service that uses SQL to analyze structured and semi-structured data across data warehouses, operational databases, and data lakes, using AWS-designed hardware and machine learning (ML) to deliver the best price/performance at any scale. For our solution, we use Amazon Redshift to store the data.
- AWS Glue is a serverless data integration service that makes it straightforward to discover, prepare, and combine data for analytics, ML, and application development. We use AWS Glue to discover the PII data that is stored in Amazon Redshift.
- Amazon Simple Storage Services (Amazon S3) is a storage service offering industry-leading scalability, data availability, security, and performance.
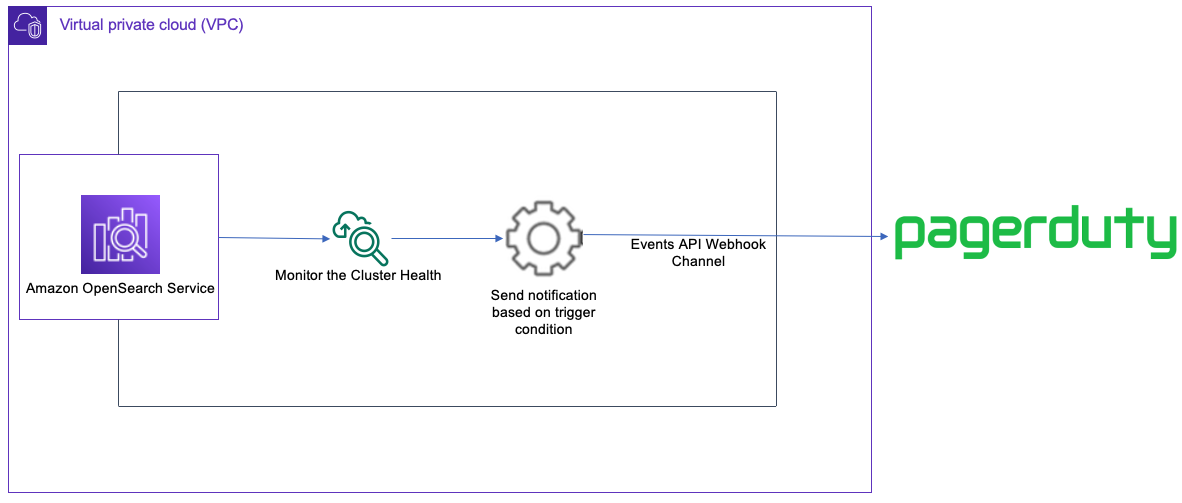
The following diagram illustrates our solution architecture.

The solution includes the following high-level steps:
- Set up the infrastructure using an AWS CloudFormation template.
- Load data from Amazon S3 to the Redshift data warehouse.
- Run an AWS Glue crawler to populate the AWS Glue Data Catalog with tables.
- Run an AWS Glue job to detect the PII data.
- Analyze the output using Amazon CloudWatch.
Prerequisites
The resources created in this post assume that a VPC is in place along with a private subnet and both their identifiers. This ensures that we don’t substantially change the VPC and subnet configuration. Therefore, we want to set up our VPC endpoints based on the VPC and subnet we choose to expose it in.
Before you get started, create the following resources as prerequisites:
- An existing VPC
- A private subnet in that VPC
- A VPC gateway S3 endpoint
- A VPC STS gateway endpoint
Set up the infrastructure with AWS CloudFormation
To create your infrastructure with a CloudFormation template, complete the following steps:
- Open the AWS CloudFormation console in your AWS account.
- Choose Launch Stack:

- Choose Next.
- Provide the following information:
- Stack name
- Amazon Redshift user name
- Amazon Redshift password
- VPC ID
- Subnet ID
- Availability Zones for the subnet ID
- Choose Next.

- On the next page, choose Next.
- Review the details and select I acknowledge that AWS CloudFormation might create IAM resources.
- Choose Create stack.
- Note the values for
S3BucketNameandRedshiftRoleArnon the stack’s Outputs tab.

Load data from Amazon S3 to the Redshift Data warehouse
With the COPY command, we can load data from files located in one or more S3 buckets. We use the FROM clause to indicate how the COPY command locates the files in Amazon S3. You can provide the object path to the data files as part of the FROM clause, or you can provide the location of a manifest file that contains a list of S3 object paths. COPY from Amazon S3 uses an HTTPS connection.
For this post, we use a sample personal health dataset. Load the data with the following steps:
- On the Amazon S3 console, navigate to the S3 bucket created from the CloudFormation template and check the dataset.
- Connect to the Redshift data warehouse using the Query Editor v2 by establishing a connection with the database you creating using the CloudFormation stack along with the user name and password.

After you’re connected, you can use the following commands to create the table in the Redshift data warehouse and copy the data.
- Create a table with the following query:
- Load the data from the S3 bucket:
Provide values for the following placeholders:
- RedshiftRoleArn – Locate the ARN on the CloudFormation stack’s Outputs tab
- S3BucketName – Replace with the bucket name from the CloudFormation stack
- aws region – Change to the Region where you deployed the CloudFormation template
- To verify the data was loaded, run the following command:

Run an AWS Glue crawler to populate the Data Catalog with tables
On the AWS Glue console, select the crawler that you deployed as part of the CloudFormation stack with the name crawler_pii_db, then choose Run crawler.

When the crawler is complete, the tables in the database with the name pii_db are populated in the AWS Glue Data Catalog, and the table schema looks like the following screenshot.

Run an AWS Glue job to detect PII data and mask the corresponding columns in Amazon Redshift
On the AWS Glue console, choose ETL Jobs in the navigation pane and locate the detect-pii-data job to understand its configuration. The basic and advanced properties are configured using the CloudFormation template.

The basic properties are as follows:
- Type – Spark
- Glue version – Glue 4.0
- Language – Python
For demonstration purposes, the job bookmarks option is disabled, along with the auto scaling feature.

We also configure advanced properties regarding connections and job parameters.
To access data residing in Amazon Redshift, we created an AWS Glue connection that utilizes the JDBC connection.

We also provide custom parameters as key-value pairs. For this post, we sectionalize the PII into five different detection categories:
- universal –
PERSON_NAME,EMAIL,CREDIT_CARD - hipaa –
PERSON_NAME,PHONE_NUMBER,USA_SSN,USA_ITIN,BANK_ACCOUNT,USA_DRIVING_LICENSE,USA_HCPCS_CODE,USA_NATIONAL_DRUG_CODE,USA_NATIONAL_PROVIDER_IDENTIFIER,USA_DEA_NUMBER,USA_HEALTH_INSURANCE_CLAIM_NUMBER,USA_MEDICARE_BENEFICIARY_IDENTIFIER - networking –
IP_ADDRESS,MAC_ADDRESS - united_states –
PHONE_NUMBER,USA_PASSPORT_NUMBER,USA_SSN,USA_ITIN,BANK_ACCOUNT - custom – Coordinates
If you’re trying this solution from other countries, you can specify the custom PII fields using the custom category, because this solution is created based on US regions.
For demonstration purposes, we use a single table and pass it as the following parameter:
--table_name: table_nameFor this post, we name the table personal_health_identifiable_information.

You can customize these parameters based on the individual business use case.
Run the job and wait for the Success status.
The job has two goals. The first goal is to identify PII data-related columns in the Redshift table and produce a list of these column names. The second goal is the obfuscation of data in those specific columns of the target table. As a part of the second goal, it reads the table data, applies a user-defined masking function to those specific columns, and updates the data in the target table using a Redshift staging table (stage_personal_health_identifiable_information) for the upserts.
Alternatively, you can also use dynamic data masking (DDM) in Amazon Redshift to protect sensitive data in your data warehouse.
Analyze the output using CloudWatch
When the job is complete, let’s review the CloudWatch logs to understand how the AWS Glue job ran. We can navigate to the CloudWatch logs by choosing Output logs on the job details page on the AWS Glue console.

The job identified every column that contains PII data, including custom fields passed using the AWS Glue job sensitive data detection fields.

Clean up
To clean up the infrastructure and avoid additional charges, complete the following steps:
- Empty the S3 buckets.
- Delete the endpoints you created.
- Delete the CloudFormation stack via the AWS CloudFormation console to delete the remaining resources.

Conclusion
With this solution, you can automatically scan the data located in Redshift clusters using an AWS Glue job, identify PII, and take necessary actions. This could help your organization with security, compliance, governance, and data protection features, which contribute towards the data security and data governance.
About the Authors
 Manikanta Gona is a Data and ML Engineer at AWS Professional Services. He joined AWS in 2021 with 6+ years of experience in IT. At AWS, he is focused on Data Lake implementations, and Search, Analytical workloads using Amazon OpenSearch Service. In his spare time, he love to garden, and go on hikes and biking with his husband.
 Denys Novikov is a Senior Data Lake Architect with the Professional Services team at Amazon Web Services. He is specialized in the design and implementation of Analytics, Data Management and Big Data systems for Enterprise customers.
 Anjan Mukherjee is a Data Lake Architect at AWS, specializing in big data and analytics solutions. He helps customers build scalable, reliable, secure and high-performance applications on the AWS platform.


 Vivek Shrivastava is a Principal Data Architect, Data Lake in AWS Professional Services. He is a Bigdata enthusiast and holds 14 AWS Certifications. He is passionate about helping customers build scalable and high-performance data analytics solutions in the cloud. In his spare time, he loves reading and finds areas for home automation
 Ravikiran Rao is a Data Architect at AWS and is passionate about solving complex data challenges for various customers. Outside of work, he is a theatre enthusiast and an amateur tennis player.
 Hari Krishna KC is a Data Architect with the AWS Professional Services Team. He specializes in AWS Data Lakes & AWS OpenSearch Service and have helped numerous client migrate their workload to Data Lakes and Search data stores