All posts by Marwan Fayed

The tricky science of Internet measurement

Post Syndicated from Marwan Fayed original https://blog.cloudflare.com/tricky-internet-measurement/

Measurement is critical to our understanding not just of the world and the universe, but also the systems we design and deploy. The Internet is no exception but the challenges of measuring the Internet are unique.

The Internet is remarkably opaque, which is counter-intuitive given its open and multi-stakeholder model. It’s opaque because ultimately the Internet joins many networks and services that are each owned and operated by unrelated entities, and that rarely share or report about their systems. Every network may carry and forward what other systems produce, but each system is entirely independent — which, to be honest, is the magic of the Internet. It’s in this opaque-yet-critical context that Internet measurement must exist as a scientific practice, with all the associated rigor, repeatability, and reproduction.

Measurement as a scientific practice can be exciting — for what it gets right as well as wrong. The following statement encapsulates some of the subtleties:

5 out of 6 scientists say that Russian Roulette is safe.”

The statement is absurd! Laugh as we might, the statement is also logical. It’s trivially easy to design an experiment that leads to the above statement. However, the only way this experiment could succeed is if the “actor” — that is, whoever conducts the experiment — ignores every aspect of measurement science that makes the practice credible, as follows.

  • Methodology: a cycle consisting of data curation, modeling, and validation. Here, the experiment (data curation) could only succeed if each participant is prevented from seeing others’ injuries. More importantly, no measurement is needed because the actor can calculate probabilities with available numbers, without the experiment!

  • Ethics: the way we measure can have undue, undesirable consequences. A bare minimum principle is do no harm.

  • Representation: clear and complete statements or visualizations should be at least informative and ideally actionable; otherwise, they can be misleading. Say each participant answered with yes to the question, “are you safe?” They are answering a different question than “is the game safe?”

In this blog we look at each of the above aspects of measurement, describe how they manifest in the Internet space, and relate them to examples from work that will be featured throughout the week. Let’s first start with some background.

Preface: A motivating example from inside Cloudflare

High quality measurements help to identify, understand, even explain our experiences, environments, and systems. However, observation in isolation, without context, can be perilous. The following is a time series from an internal graph of HTTP requests from Lviv, Ukraine, leading up to the evening of 28 February 2022:


On that day, traffic from the region increased by 3-4X. For context, the Russian incursion into Ukraine began four days earlier. The world was watching events closely. Cloudflare was no exception, helping both to report and to mitigate network effects.

Upon observing that abnormal spike, we at Cloudflare could have mistakenly reported the increase as a potential DoS attack. However, there were counter-indications. First, no attack was flagged by the DoS defense and mitigation systems. In addition, the profile was atypical of attack traffic, which tends to be either single source from a single location or multiple sources from multiple locations. In this instance the increase came from multiple source networks but in a single location (Lviv).

Cloudflare had the tools to avoid erroneous reporting and later correctly reported that the increase was due to a mass of people converging in Lviv, the city with the last train station on the westward journey out of Ukraine. But — and this is important in a measurement context — nothing visible from Cloudflare’s perspective could provide an explanation. In the end, an employee saw a report on BBC about the massive movement of people in that part of Ukraine, which enabled us to better explain the traffic shift.

This example is an important reminder to always look for alternative explanations. It also shows how observations alone can lead to wrong conclusions, due to missing information or unrecognized biases. But good numbers without bias can be misunderstood, too.

Measurement vocabulary and jargon

In the measurement context there is a vocabulary of common words with specific meanings that are useful to know before diving into practice and examples.

Active and passive measurement 

These describe the “how.” In an active measurement, an actor initiates some action designed to trigger a response. The response may be data, such as latency returned from a ping or a DNS answer in response to a query. The response may be an observable change in a mechanism or system triggered by an action, such as well-crafted probe packets that prompt reactions from and expose middleboxes.

In a passive measurement, the actor only observes. No action is taken. As a result, no response is triggered; the system and its behaviour are unaltered. Logs are typically compiled from passive observations, and Cloudflare’s own are no exception. The vast majority of data shown in Cloudflare Radar derives from those logs.

Each has its trade-offs. Active measurements are targeted and can be controlled. They are also exceptionally difficult (and often costly) to scale and, as a result, are only able to observe the parts of a system where they are deployed. Conversely, passive measurements tend to be lighter weight, but only succeed if the observer is at the right place at the right time. 

Effectively, the two methods complement each other, and that makes them most powerful when orchestrated so that the knowledge from one feeds into the other. For example, in our own prior attempts to understand performance across CDNs, we interrogated the (passive) request logs to get insights, which helped inform later (active) pings using RIPE’s Atlas that we used to confirm our insights and results. In the opposite direction, our efforts to (passively) detect and understand connection failures was informed by, and arguably only possible because of, a large body of (active) measurements in the research community to understand wide-scale connection tampering.

For more on the interplay between active and passive, you can read about the experience of a researcher who was equipped to dig deep into Cloudflare’s vast troves of data because of insights from prior active measurements in the research community.

Direct and indirect measurement 

It is possible to gain insights about something without directly observing it. Consider, for example, the capacity of a path, better known as the bandwidth. The common method to directly observe bandwidth is to launch a speed test. It’s a simple test, but it has two problems.

The first is that it works by consuming as much of the bandwidth as it can (which creates an ethical dilemma we later revisit). The second is that it actually measures throughput from a sender to a receiver, which is the available bandwidth (or, alternately, the residual capacity) of the bottleneck link. If two speed tests share a bottleneck then each might observe throughput that is ½ of the actual bandwidth. The evidence is in the numbers, as seen below, where observations of a speed test range from 69-85Mbps — that’s a +/- range of nearly 20% from the median, and far from a fixed value!


There is instead a 25+ year-old indirect alternative to speed tests called the packet pair, or packet train. It works by first transmitting pairs of packets with no delay between them and recording their transmission times, then recording their arrival times. The change between transmission and arrival times of the two packets gives an indication of the bottleneck bandwidth. Repeat the packet pair probes and, with some statistical analysis, a good estimate of the true bottleneck bandwidth emerges. Instead of directly observing bandwidth by pushing and counting bytes over time, the packet pair technique uses the time between two packets to indirectly calculate — or infer — the metric.


The (Network) Measurement Lifecycle

Measurements are most powerful when they lead to reasonable predictions. Sometimes the predictions confirm our understanding of the world and systems we deploy into it. Occasionally, the predictions reveal something new. Either way, predictive measurements emerge by following a simple pattern: curate data, construct a model based on the data, then validate the model with (ideally) different data. Together, these create a measurement lifecycle.


Ideally a measurement exercise encompasses the lifecycle from beginning to end, but there can be extremely valuable contributions and advances within each in isolation. Individual high-quality datasets are so difficult to curate that each can be a valid contribution. Similarly, with modeling techniques, or tools for validation. Measurement spans expert domains, and benefits from diverse skill sets.

Let’s look at each step in order, beginning with data curation.

Data curation

The most common and familiar measurement exercise — often synonymous with measurement — is data gathering and curation. Data on its own can be fascinating and useful; Cloudflare Radar is clear evidence of that! Simple counting in many contexts can help us relate to and place our environments in context.

Data gathering and curation consumes more energy, time, and resources than modeling or validation. The explanation is implied by the cyclical measurement pattern: validation requires a preceding model, and models are constructed using data. No data, no model, no validation, no insight nor prediction nor learning. The quality of each step in the cycle depends on the quality of the previous step — high-quality data is the linchpin in measurement practices. The Large Hadron Collider and the James Webb Telescope are great examples of how much we can, and need, to do — they operate relentlessly in pursuit of high-quality data. Similar “always-on” tools in the Internet measurement community are much less glamorous, but no less important. CAIDA and RIPE’s Atlas are just two examples of longstanding projects that gather telemetry and curate datasets.

Make no mistake: High-quality data gathering and curation is hard.

Luckily, “high-quality” does not mean perfect; it does mean representative. For example, if we’re counting distance or time, the accuracy must reflect the true value. Large populations can be reasonably studied using much smaller numbers of samples. For example, our global assessment of connection tampering revealed valuable insights with a sample of 1 in 10,000 (or 0.0001%). The low sampling rate works at Cloudflare in part because of the immense diversity of Cloudflare’s customers, which attracts traffic for all kinds of content and purposes. Later this week, we’ll share in a blog post how imperfect signals used to find a sample of around 180,000 carrier-grade NATs in Cloudflare’s request logs are “good enough” to identify more than 12,000,000 others that cannot be directly observed.

Another important, and arguably counterintuitive, misconception is that more data naturally reveals more detail and answers to more questions. As Ram Sundaran writes in a guest post, sometimes there is so much noise that finding answers in large datasets can seem like a small miracle.

Modeling

Models may be conceptual, and describe aspects of an environment or system. The most useful can be expressed as simple statements about our understanding or our assumptions. In effect, they encapsulate a hypothesis that can be tested. For example, we might believe or assume that an ISP or network will typically prefer a direct no-cost peering path to a CDN over transit network paths that incur a cost, even when the direct path is longer. This forms a model that can be validated.


Predictive models push beyond our boundaries of understanding to help identify, explain, or understand aspects of systems that are not obvious or directly observable, or are difficult to ascertain. Predictive models often use statistical techniques to, for example, identify underlying stochastic processes or to create machine learning classifiers. A more common use of the statistical tools is to characterize the curated data itself. Remarkably powerful models can be simple probability distributions with means, medians, variance, and confidence indicators.

One aspect of the Internet that attracted a lot of attention was how networks on the Internet choose to connect to other networks. Understanding how the Internet forms and grows is crucial for simulation, but also helps to predict ways in which networks might fail. The equation below on the left comes from the Barabási–Albert (B-A) model, an early model that assumes preferential connectivity or, in more familiar terms, “rich get richer.”

In its simplest version, a new network in the BA model chooses to connect to an existing network with a probability that is proportional to the number of connections of the existing networks. Later models did away with ‘intelligent’ selection mechanisms. The equation below on the right is based on the sizes of networks, a more general mechanism similar to the way celestial bodies form in the universe.


Sometimes knowing which tool to use and when is a skill in itself. One such example is throwing ML and AI at problems that are tractable with mechanisms that are simpler and far more transparent. This guest blog, for example, explains that ML was ruled out to understand anomalous TCP behaviour because TCP is tightly specified, which suggested that a full enumeration of various packet sequences was possible—and proved correct.

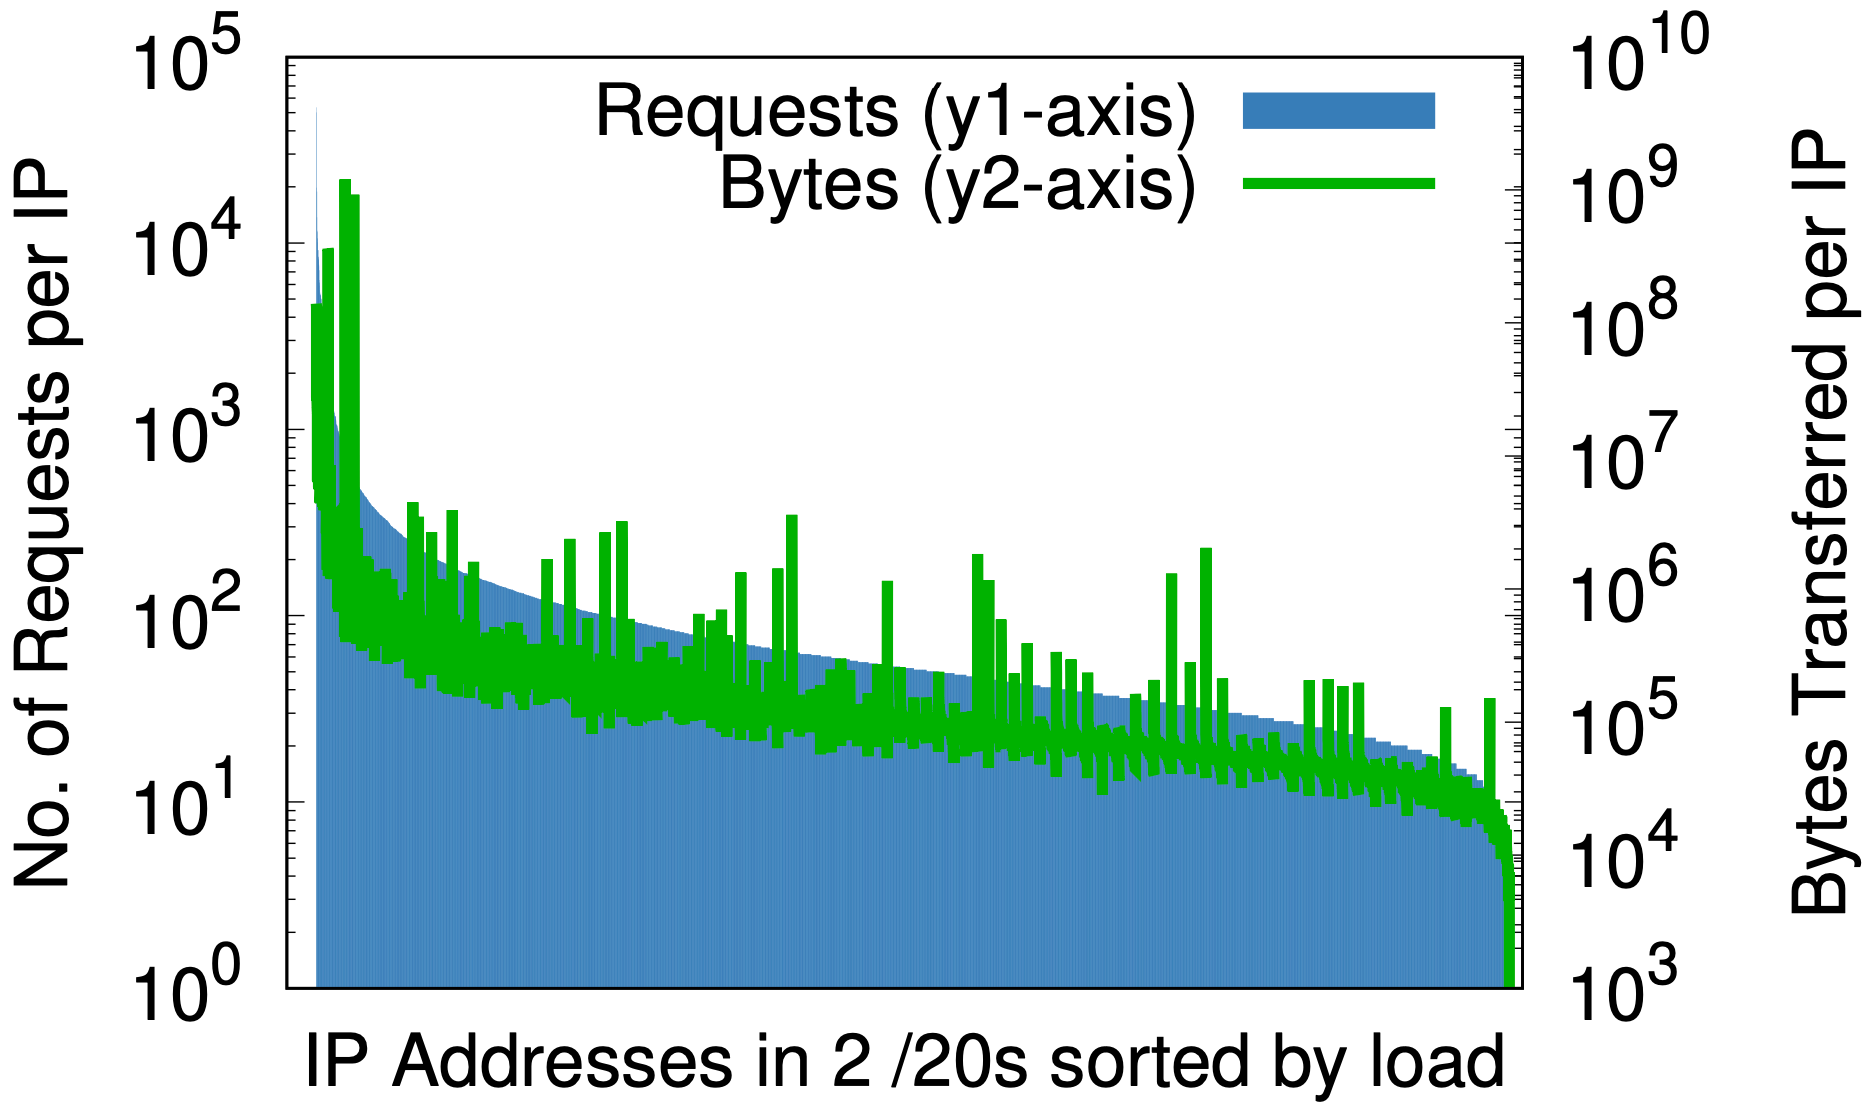
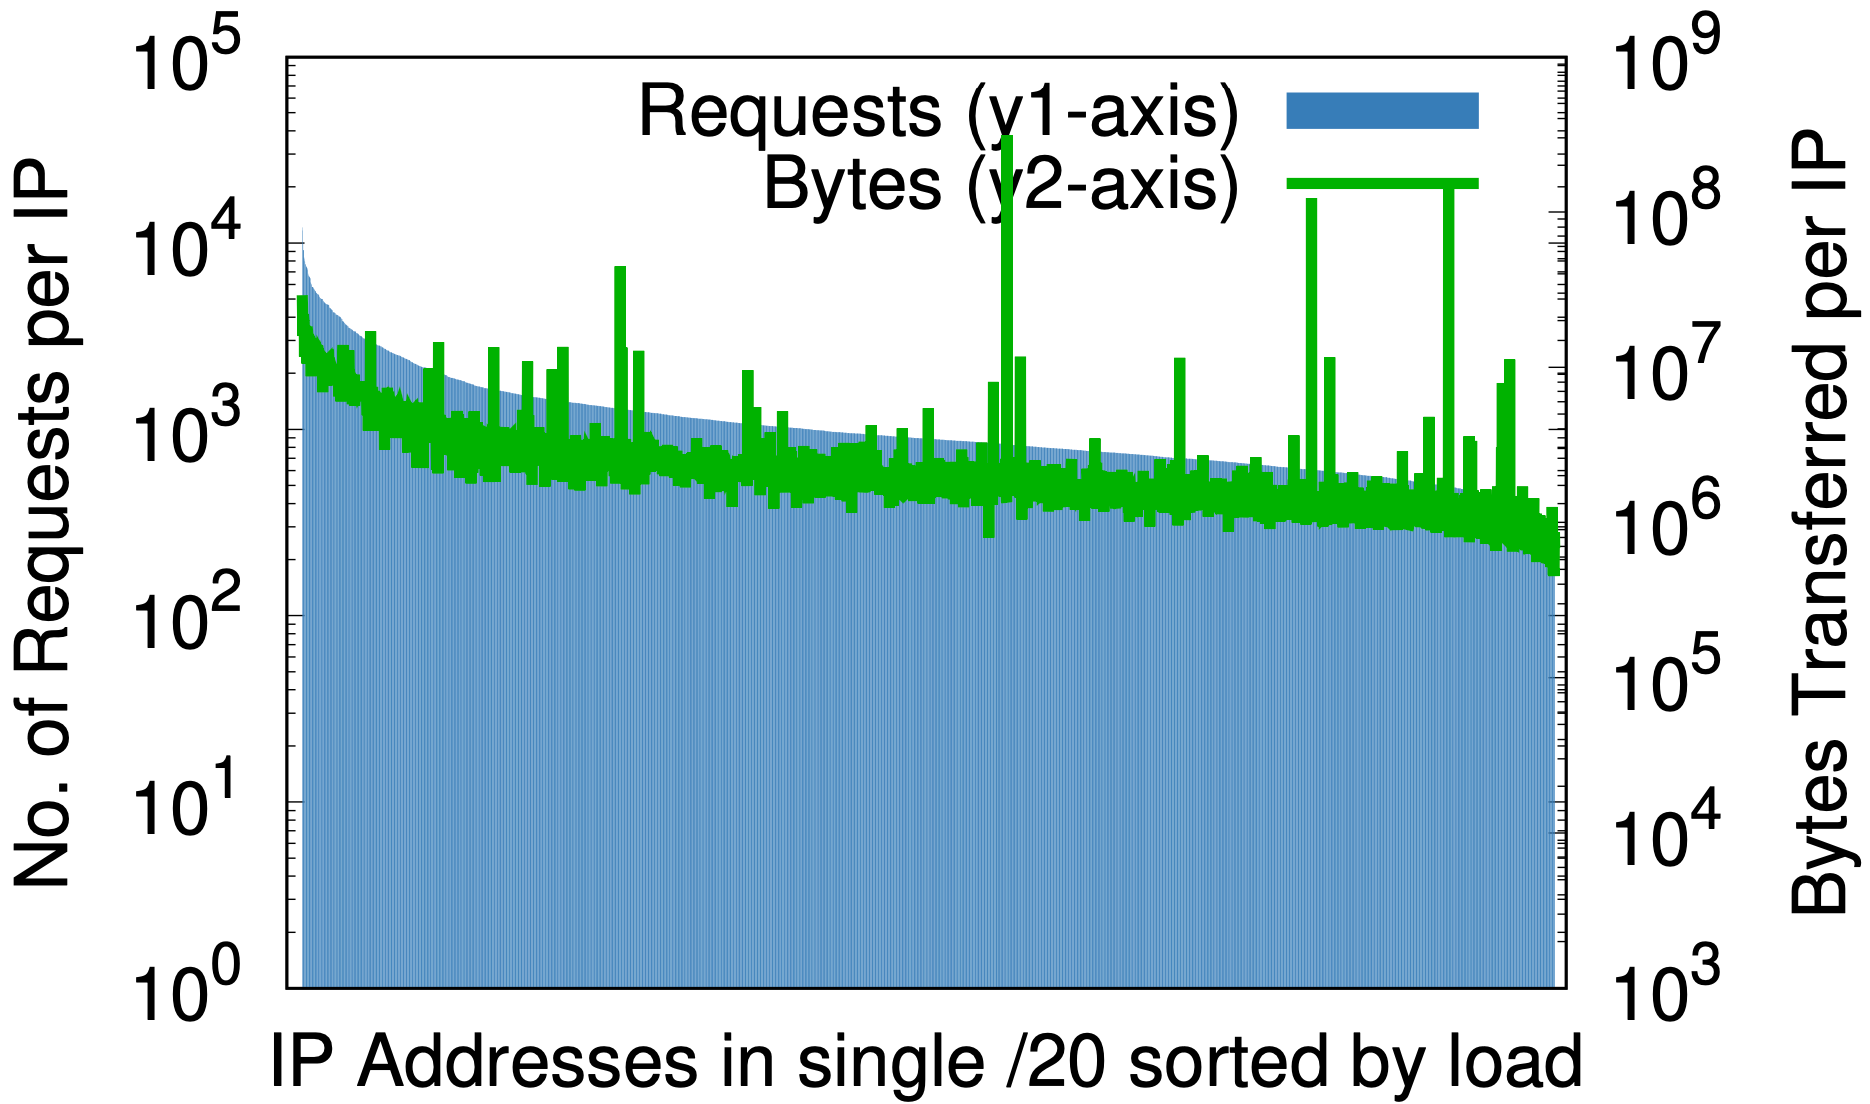
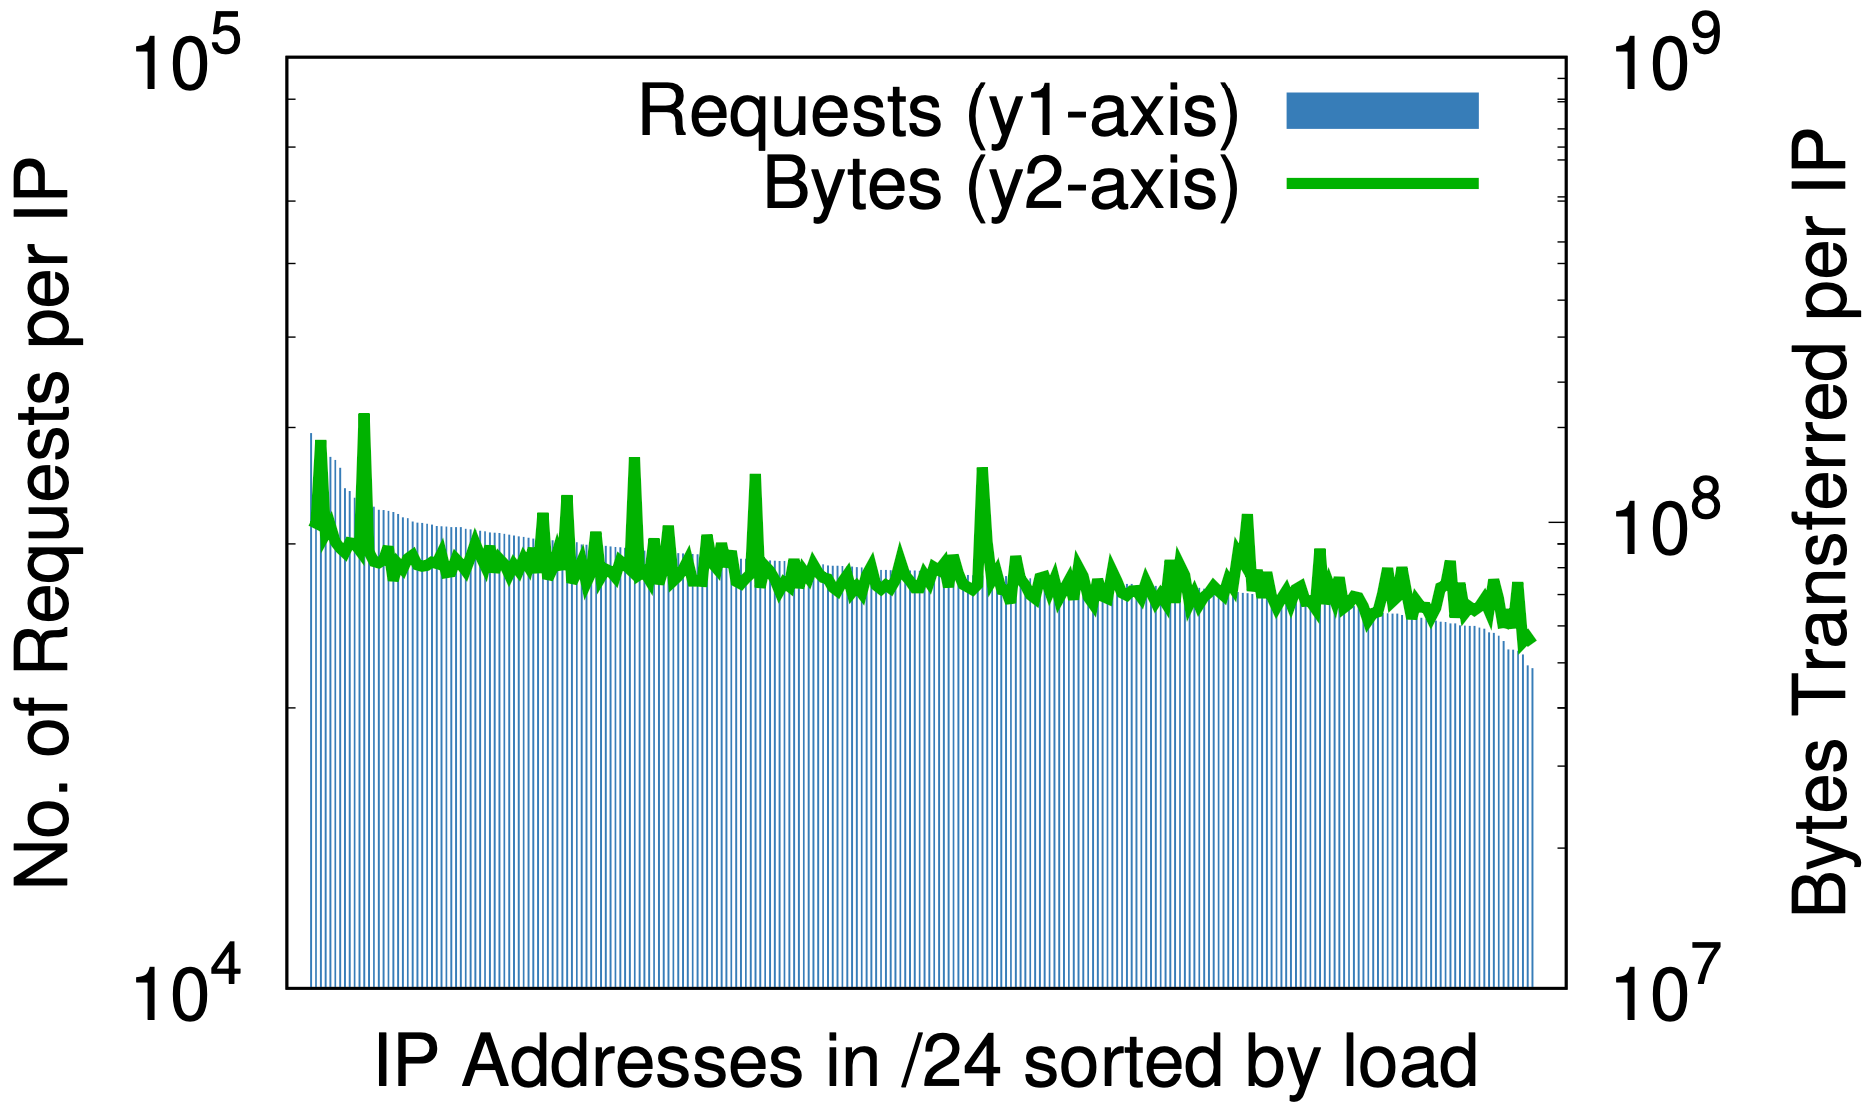
An understanding of the domain is often critical to our ability to construct accurate models. Machine learning, for example, is a useful tool to help make sense of large unstructured data, but can be remarkably powerful with some domain expertise. Our work featured later this week on detection of multi-user IPs provides one such example. In particular, we sought to detect carrier-grade NAT devices (CGNATs). They are unique among large-scale multiuser IPs because, unlike VPNs and proxies, users neither choose to use CGNATs nor are aware of their existence.

The ML models successfully identified multiuser IPs, but disambiguating CGNATs proved elusive until we applied domain knowledge. For example, CGNATs are typically deployed across a range of contiguous IPs (e.g. in a /24 block) and, as shown below, turns out to be a very important feature in the model.


Validation

The validation phase almost singularly determines the value of the whole measurement exercise, by testing the output of the model against data. If the model makes predictions that are reflected in the data, then the model has validity. Predictions that contrast or conflict with the validation data indicate that either the model is flawed or is biased by the curated data.

Validation is where great measurement can fall apart — primarily in one of two ways. First, just like in the initial data curation phase, validation data must be representative of the population. For example, it would be a mistake to curate data about traffic during the day, build a model about that data, and then validate using data about traffic at night. There is also no point in using QUIC data to validate measurements about, say, TCP (unless the measurement’s hypothesis is that they have attributes in common). Care must always be taken to ensure that measurement cannot be corrupted by the differences between validation and initial data.

Validation also risks being misleading when using the curated data, directly. Certainly this approach mitigates differences between datasets. However, the only conclusion that can be drawn when validating with the same data, is that the model reasonably describes the data —not whatever the data represents. Consider, for example, machine learning. At its core, machine learning is a measurement in so much as it follows the lifecycle: curate data, (feed it into a machine learning algorithm to) build a model, then validate the output against data. An early common practice in the machine learning community was to partition a single dataset into 70% for training and 30% for validation. This is a setup that leads to a higher likelihood of a positive evaluation of the model that is not warranted, and potentially misleading. The best case for an ML model trained on a dataset that amplifies or omits important characteristics is a model that reflects those biases — which becomes a potential source of algorithmic bias

Naturally we have greater confidence in models that prove valid with unrelated data. The validation dataset can describe the same attributes from a different source, for example, models constructed from passive RTT log data and validated against active pings. Alternatively, models may be validated using entirely different data or signals, such as confirming connection tampering with distributions and header values that were ignored in the model’s construction. 

The ethics of network measurement

The importance of ethics in network measurement is hard to overstate. It’s easy to perceive network measurement as risk-free, removed from and having little effect on humans—a perception far from truth. Recall the speed tests and the packet pair technique for bandwidth estimation described above. In a speed test, an actor estimates bandwidth by consuming all the available bottleneck capacity that may or may not be within the actor’s network. The cost of resource consumption might be borne by others, and certainly reduces the potential performance of the network for its users. The risks of that type of bandwidth measurement prompted the packet pair technique and its use of only a few pairs of packets and a little math to infer bandwidth—albeit with some orchestration between a sender and receiver.

Best practice in network measurement scrutinizes risks and effects before the measurement exercise. This might seem like a burden, but the ethical considerations often spark creativity and are the reasons that novel methodology emerge. Looking for alternatives to JavaScript injection is what prompted Cloudflare’s own efforts to estimate the performance of other CDNs using passive data. For more information, see “Ethical Considerations in Network Measurement Papers” published in the Communications of the ACM (2016).

Visualization and representation

Visualization and representation are invaluable at every stage of the measurement lifecycle. Representations should at least improve our understanding; ideally, they also make follow-up actions clear. Statements without context are poor representations. For example, “30% greater chance” sounds like a lot but has no value without a reference point—30% of 0.5% is likely less a concern than 30% of 20% chance.

One example of representation is Cloudflare’s “closeness” statement: Cloudflare is “approximately 50 ms from 95% of the Internet-connected population globally.” The statement encapsulates a “survey” of our logs: From among all connections from each IP address that connects to Cloudflare, half of the minimum-RTT is a “worst approximation” of the latency from the IP address to Cloudflare; in 95% of cases, the minRTT/2 is at or below 50ms.

Visualizations, meanwhile, can be so powerful as to lead to misleading conclusions — a notion that features prominently later this week in a blog post about routing resilience evaluations. One example on that subject appears below, with two bar charts that order individual US states by the number of interconnection facilities in each state, from most to least. On the left, states are ordered according to raw count facilities; the top-ranked state has more than 140 interconnection facilities. On the right, the raw counts are normalized (in this case divided by) the population of each state.


These representations demonstrate that our models are shaped, and can be misinformed, by how we evaluate data. In this case we have purposefully omitted the state names on the x-axis because they are a distraction. Instead, each bar is coloured to indicate whether it is above (green) or below (yellow) the median of facilities per person in the right-hand graph. What becomes immediately obvious is that the two states with the highest number of facilities fall below the median, i.e., they are in the bottom half of states when ordered by facilities per person.

Sometimes a visualization can be so powerful as to leave no doubt. The image below is a personal favourite, because it gives strong evidence that the data and models were correct. In this visualization, each column represents a single type of connection anomaly that we observed. Inside each column, the anomaly’s occurrence is divided proportionally into the country where the connection was initiated. As an example, look at the left-most column for SYN→∅ anomalies (a type of timeout). It shows that connections from China, India, Iran, and the United States dominated this specific anomaly type. Organizing the visualization this way put the data first, which helped mitigate any bias we might have had about explanations, underlying mechanisms, or locations.


By organizing the anomalies this way, the visualization immediately answered one question: “Are the failures expected behaviour?”  If they were expected, or normal across the Internet, then the anomalies would appear in roughly similar proportions rather than so different. The visualization was a strong validation (but not the only one) of our approach and intuition—and opened up further avenues of investigation as a result.

What’s next?

Cloudflare continues to think deeply about new and novel ways to use available (passive) data, and welcomes ideas. Measurement helps us understand the Internet we all depend on, value, and love, and is a community-wide endeavour.

We encourage new entrants into the measurement space, and hope this blog serves as both an introduction to its challenges, and a map with which to evaluate measurement work published at Cloudflare or anywhere else.

Data at Cloudflare scale: some insights on measurement for 1,111 interns

Post Syndicated from Marwan Fayed original https://blog.cloudflare.com/experience-of-data-at-scale/

Cloudflare recently announced our goal to hire 1,111 interns in 2026 — that’s equivalent to about 25% of our full-time workforce. This means countless opportunities to develop and ship working code into production. It also creates novel opportunities to measure aspects of the Internet that are otherwise hard to observe — and more difficult still to understand.

Measurement is hard, even at Cloudflare, despite the vast amount of data generated by our traffic (much of it published via Cloudflare Radar). A common misconception we often hear is, “Cloudflare has so much data that it must have all the answers.” Having a huge amount of data is great — but it also means much more noise to filter out, and lots of additional work to rule out alternative explanations.

Ram Sundara Raman was an intern at Cloudflare in 2022 as he pursued his PhD. He’s now an assistant professor at University of California, Santa Cruz, and we’ve invited him back to share his insights about working with data at Cloudflare.

Ram’s project is a great example of how insights that researchers shared and brought from their  university research lab can lay the groundwork for a valuable project at Cloudflare — in this case, detecting and explaining connection failures to customers. One tip for prospective interns: If you’re applying and thinking about data and measurement ideas to work on at Cloudflare, a good question to ponder is if, how, or why, your idea might matter to Cloudflare. We love hearing your ideas!

Without further ado, here’s Ram. We hope his insights are as informative and refreshing to future interns — and practitioners — as they are to us here at Cloudflare.

Insights from data at large scale might just be a small miracle  

by Ram Sundara Raman, Assistant Professor of Computer Science and Engineering, UC Santa Cruz

Before joining Cloudflare as a research intern in the summer of 2022, I’d worked on multiple network security and privacy research problems as a PhD student at the University of Michigan. My previous experience involved active measurements, in which probes were carefully crafted and transmitted to detect and quantify security issues such as HTTPS interception and connection tampering. These attacks, performed by powerful network middleboxes between users and Internet servers, can block Internet content and services for numerous users in various regions, and can also reduce their security. For example, the HTTPS Interception Man-in-the-Middle Attack in Kazakhstan in 2019 was detected in 7-24% of all measurements we performed in the country. 

Detecting such attacks is challenging. The underlying mechanisms are diverse, with both geographic and temporal variations — and they’re entirely opaque. Moreover, the Internet has no technical mechanisms to report to users when their traffic is being manipulated, and third party actors rarely, if ever, are transparent with affected users. 

My active measurement work before Cloudflare helped resolve these challenges. Along with my PI and team at the University of Michigan, I helped develop Censored Planet, one of the largest active Internet censorship observatories, detecting connection tampering in more than 200 countries. However, active measurements face barriers on scale, resources, and real-world view. For instance, Censored Planet is only able to measure blocking and connection tampering for the 2,000 most popular websites, simply because of limits on time and resources. 

While working on projects like Censored Planet, I’d often look at large network operators or cloud providers and think: “If only I had my hands on the data they collect, I could solve this problem so easily. They have a global view of real-world traffic from nearly every network, and probably enough resources and telemetry to scale analysis to that level of data. How hard could it be to use this data, for example, to detect when middleboxes interfere?” 

As we learned through our research published at ACM SIGCOMM’23 — it can be very hard.

My perspectives on censorship evolved as a direct result of my experience at Cloudflare, which taught me that detection at scale is hard, even with large-scale data. The research I did during my internship helped reveal that network middleboxes block or otherwise interfere with certain connections not only in limited places, but also at various scales around the world.

An internship project built on real insights, using production data

In this research, we built upon insights gathered by the wider active measurement community, namely that middleboxes interfere with Internet TCP connections by dropping packets, or injecting RST packets to cause connections to abort. The same insights revealed that the patterns of packet drops and RSTs are deterministic  —  and, as a result, potentially detectable. Such is the flexibility of active measurement: craft a custom request, or ‘probe,’ that elicits a response from the environment. However, such a targeted approach would be difficult to scale and maintain, even for Cloudflare: What probes should be crafted? Where should they be sent? What motivation would Cloudflare have to even try, if the risk of missing so much is so high?  

The goal of my internship was to see if we could instead flip the approach: to be passive instead of active. Everything Cloudflare does must be both scalable and sustainable. However, it was entirely uncertain whether a system restricted to passive observation could be constructed, even if the tampering events could be detected. The requirement was clear: Only observe and use data that comes to Cloudflare naturally. No mixing in other datasets, no running our own active measurements. Either would have made life easier: we could have controlled the variables, maybe even obtained ground truth that would help us confirm our observations. But where’s the fun in that? Besides, Cloudflare has all the data anyway… right? 

Yes, maybe — if it is sampled appropriately, can be teased out reliably, and correctly interpreted.

Here’s a useful insight: I’ve often heard people say that finding middleboxes that tamper with Internet connections using active measurements is like finding a needle in a haystack — rare, finicky, and hard to pin down. When we started looking at this problem from the lens of Cloudflare’s passive dataset, we quickly realized we were still looking for the same needle — and in some ways, it was now even harder to find.

That’s because as a passive observer we lose the ability to choose where to look. Also, the haystack now stretches across continents, millions of users, and — I’m not exaggerating here — thousands of ways connections can be made and broken. Not only did we have to identify tampering from millions of real-world data points, we had to do it with data that was full of obstacles and pitfalls. It felt a lot like working with unseen traps and their tripwires. 

The traps and tripwires of large-scale passive data

There were multiple challenges that I only truly understood once faced with them. Let’s start with the obvious one: scale.

First, there was a glut of large-scale datasets, primarily associated with incoming connections to Cloudflare. For example, at the time of my internship, Cloudflare was serving more than 45 million HTTP requests per second globally, across more than 285 data centers. Cloudflare also gets TCP connections to its 1.1.1.1 DNS server. We also explored Network Error Logging (NEL) data, primarily from Firefox users. Usually, in measurement research, we’re dealing with the issue of too little scale. Here, we had the opposite problem: too much of a good thing. In practice, each of these datasets had their own independent sampling methods, making it all but impossible to utilize them all together. Moreover, datasets like NEL are biased since only some clients support it, and because only some websites enable it. After evaluating these biases, NEL did not make the final cut. 

To manage the scale, we constructed special IPTABLES rules to log and store incoming TCP connections across all of Cloudflare’s points of presence — every server in each of 285 datacenters. However, due to the extremely large scale of the data, we had to limit ourselves to work with a uniformly random sample of one in every 10,000 connections. For each sample, we only logged the first 10 inbound packets of each connection. That meant we could not detect certain infrequent types of tampering, or any tampering that occurs later in a flow, after the first 10 packets. 

Still, within those constraints, we managed to develop tampering signatures — distinctive packet patterns that reveal when middleboxes interfere. However, developing these signatures was anything but straightforward, due to the second tripwire: noisy data. 

It’s difficult to imagine that we could have anticipated all the different sources of noise. For example, the resolution of time-keeping in event records was milliseconds, but many packets could arrive in a single millisecond, which meant we could not trust the ordering of logged packets. We eventually learned that some denial-of-service attack traffic, as well as port scans, can look eerily like tampering events, and certain “best practices” designed to help improve the Internet, such as Happy Eyeballs, became quirks that messed with our detection. We spent a lot of time analyzing these sources of noise and iterating on our signatures to understand them. We accepted events as tampering only if supported by other sources of evidence that we identified, including but not limited to inconsistent changes in the Time-To-Live (TTL) field in the IP header.

That brings me to our last tripwire: a lack of ground truth.

Without active, controlled experiments, it would have been extremely difficult for us to confirm when something we detected was indeed tampering, and not one of the thousand other phenomena on the Internet. Fortunately, thanks to the amazing work of many researchers in the censorship measurement space, we were able to recognize at least some known signals and patterns in the data, and these helped us confirm many cases of tampering. 

There were plenty more tripwires. But the key realization for me was this: While providers have lots of data that can tell you things, it’s incredibly hard to know which thing, how much of it, and about what. Large infrastructure operators see a filtered, sampled, and often partial view of the Internet. For example,

  • Services like Cloudflare can see only which connections were affected and where the connections were initiated, but not who did the tampering;

  • It was sometimes possible to understand which domains were blocked, but not always, because the necessary packets can be dropped before they get to Cloudflare;

  • As a passive observer, it’s possible only to see users’ activity that is affected, not what could be affected.

For a company that handles a double-digit percentage of Internet websites and services, these were surprising — but understandable –  limitations.

It may seem like the exercise is impossible, but it’s not. It’s just more challenging than I expected it to be. Despite all that, we found ways to extract meaning from chaos. For example, we carefully and painstakingly enumerated all common packet sequences Cloudflare observed, and extracted from them those that might indicate tampering, based on prior work. Moreover, we used signals like the TTL field mentioned above as supporting evidence that these packet signatures did indeed show tampering. 

All of this adds up to a simple but important conclusion: large infrastructure providers are not omniscient. Having a global view can be powerful, but doesn’t automatically translate into easy observations. You can have all the data in the world and still struggle to tell the difference between a middlebox, a security filter, a confused IoT device, and even regular users closing tabs and browsers. 

But that dichotomy is also the beauty of the problem space. Working with imperfect data forces us to be creative, to find patterns in the noise, and to design methods that work despite what’s missing. And no, before you ask, you can’t just throw machine learning at the problem, nor do you need to — even with all the noise, the protocols are tightly specified, meaning patterns can be enumerated easily but must still be debated manually. 

An internship project built on real insights, using production data

Using our packet-level samples and 19 tampering signatures, we saw distinctive tampering behaviors across hundreds of networks, including being able to track large increases in tampering rates (Figure 1). And it worked because, despite the data’s limits, Cloudflare’s networks let us see the real-world effects of tampering. Also, thanks to the tireless efforts of Luke Valenta and the Cloudflare Radar team, the data from our project is continuously being published on Cloudflare Radar (Figure 2).


Figure 1: Increase in mach rates of our 19 tampering signatures during a period of nationwide protests in Iran in late-2022.


Figure 2: Data from our connection tampering research is available live on Radar.

In the future, though, I think solving challenges like these will require a combination of passive and active probing, using the scale of providers like Cloudflare together with targeted, controlled measurements to paint the full picture of Internet tampering. My team at  UCSC’s RANDLab and the research group at Censored Planet continue to work on this problem, especially asking how we can automatically identify tampering when attacks happen or networks change. 

While collaborations between academia and industry aren’t always straightforward, they hold strong potential to help build a better Internet. If you’re interested in an internship adventure like the one I described, apply today!

Unbuckling the narrow waist of IP: Addressing Agility for Names and Web Services

Post Syndicated from Marwan Fayed original https://blog.cloudflare.com/addressing-agility/

Unbuckling the narrow waist of IP: Addressing Agility for Names and Web Services

Unbuckling the narrow waist of IP: Addressing Agility for Names and Web Services

At large operational scales, IP addressing stifles innovation in network- and web-oriented services. For every architectural change, and certainly when starting to design new systems, the first set of questions we are forced to ask are:

  • Which block of IP addresses do or can we use?
  • Do we have enough in IPv4? If not, where or how can we get them?
  • How do we use IPv6 addresses, and does this affect other uses of IPv6?
  • Oh, and what careful plan, checks, time, and people do we need for migration?

Having to stop and worry about IP addresses costs time, money, resources. This may sound surprising, given the visionary and resilient advent of IP, 40+ years ago. By their very design, IP addresses should be the last thing that any network has to think about. However, if the Internet has laid anything bare, it’s that small or seemingly unimportant weaknesses — often invisible or impossible to see at design time — always show up at sufficient scale.

One thing we do know: “more addresses” should never be the answer. In IPv4 that type of thinking only contributes to their scarcity, driving up further their market prices. IPv6 is absolutely necessary, but only one part of the solution. For example, in IPv6, the best practice says that the smallest allocation, just for personal use, is /56 — that’s 272 or about 4,722,000,000,000,000,000,000 addresses. I certainly can’t reason about numbers that large. Can you?

In this blog post, we’ll explain why IP addressing is a problem for web services, the underlying causes, and then describe an innovative solution that we’re calling Addressing Agility, alongside the lessons we’ve learned. The best part of all may be the kinds of new systems and architectures enabled by Addressing Agility. The full details are available in our recent paper from ACM SIGCOMM 2021. As a preview, here is a summary of some of the things we learned:

Unbuckling the narrow waist of IP: Addressing Agility for Names and Web Services

It’s true! There is no limit to the number of names that can appear on any single address; the address of any name can change with every new query, anywhere; and address changes can be made for any reason, be it service provisioning or policy or performance evaluation, or others we’ve yet to encounter…

Explained below are the reasons this is all true, the way we get there, and the reasons these lessons matter for HTTP and TLS services of any size. The key insight on which we build: On the Internet Protocol (IP) design, much like the global postal system, addresses have never been, should never be, and in no way are ever, needed to represent names. We just sometimes treat addresses as if they do. Instead, this work shows that all names should share all of their addresses, any set of their addresses, or even just one address.

The narrow waist is a funnel, but also a choke point

Decades-old conventions artificially tie IP addresses to names and resources. This is understandable since the architecture and software that drive the Internet evolved from a setting in which one computer had one name and (most often) one network interface card. It would be natural, then, for the Internet to evolve such that one IP address would be associated with names and software processes.

Among end clients and network carriers, where there is little need for names and less need for listening processes, these IP bindings have little impact. However, the name and process conventions create strong limitations on all content hosting, distribution, and content-service providers (CSPs). Once assigned to names, interfaces, and sockets, addresses become largely static and require effort, planning, and care to change if change is possible at all.

The “narrow waist” of IP has enabled the Internet, but much like TCP has been to transport protocols and HTTP to application protocols, IP has become a stifling bottleneck to innovation. The idea is depicted by the figure below, in which we see that otherwise separate communication bindings (with names) and connection bindings (with interfaces and sockets) create transitive relationships between them.

Unbuckling the narrow waist of IP: Addressing Agility for Names and Web Services

The transitive lock is hard to break, because changing either can have an impact on the other. Moreover, service providers often use IP addresses to represent policies and service levels that themselves exist independently of names. Ultimately the IP bindings are one more thing to think about — and for no good reason.

Let’s put this another way. When thinking of new designs, new architectures, or just better resource allocations, the first set of questions should never be “which IP addresses do we use?” or “do we have IP addresses for this?” Questions like these and their answers slow development and innovation.

We realised that IP bindings are not only artificial but, according to the original visionary RFCs and standards, also incorrect. In fact, the notion of IP addresses as being representative of anything other than reachability runs counter to their original design. In the original RFC and related drafts, the architects are explicit, “A distinction is made between names, addresses, and routes. A name indicates what we seek. An address indicates where it is. A route indicates how to get there.” Any association to IP of information like SNI or HTTP host in higher-layer protocols is a clear violation of the layering principle.

Of course none of our work exists in isolation. It does, however, complete a long-standing evolution to decouple IP addresses from their conventional use, an evolution that consists of standing on the shoulders of giants.

The Evolving Past…

Looking backwards over the last 20 years, it’s easy to see that a quest for addressing agility has been ongoing for some time, and one in which Cloudflare has been deeply invested.

The decades-old one-to-one binding between IP and network card interfaces was first broken a few years ago when Google’s Maglev combined Equal Cost MultiPath (ECMP) and consistent hashing to disseminate traffic from one ‘virtual’ IP address among many servers. As an aside, according to the original Internet Protocol RFCs, this use of IP is proscribed and there is nothing virtual about it.

Many similar systems have since emerged at GitHub, Facebook, and elsewhere, including our very own Unimog. More recently, Cloudflare designed a new programmable sockets architecture called bpf_sk_lookup to decouple IP addresses from sockets and processes.

But what about those names? The value of ‘virtual hosting’ was cemented in 1997 when HTTP 1.1 defined the host field as mandatory. This was the first official acknowledgement that multiple names can coexist on a single IP address, and was necessarily reproduced by TLS in the Server Name Indication field. These are absolute requirements since the number of possible names is greater than the number of IP addresses.

…Indicates an Agile Future

Looking ahead, Shakespeare was wise to ask, “What’s in a Name?” If the Internet could speak then it might say, “That name which we label by any other address would be just as reachable.”

If Shakespeare instead asked, “What is in an address?” then the Internet would similarly answer, “That address which we label by any other name would be just as reachable, too.”

A strong implication emerges from the truth of those answers: The mapping between names and addresses is any-to-any. If this is true then any address can be used to reach a name as long as a name is reachable at an address.

In fact, a version of many addresses for a name has been available since 1995 with the introduction of DNS-based load-balancing. Then why not all addresses for all names, or any addresses at any given time for all names? Or — as we’ll soon discover — one address for all names! But first let’s talk about the manner in which addressing agility is achieved.

Achieving Addressing Agility: Ignore names, map policies

The key to addressing agility is authoritative DNS — but not in the static name-to-IP mappings stored in some form of a record or lookup table. Consider that from any client’s perspective, the binding only appears `on-query’. For all practical uses of the mapping, the query’s response is the last possible moment in the lifetime of a request where a name can be bound to an address.

This leads to the observation that name mappings are actually made, not in some record or zone file, but at the moment the response is returned. It’s a subtle, but important distinction. Today’s DNS systems use a name to look up a set of addresses, and then sometimes use some policy to decide which specific address to return. The idea is shown in the figure below. When a query arrives, a lookup reveals the addresses associated with that name, and then returns one or more of those addresses. Often, additional policy or logic filters are used to narrow the address selection, such as service level or geo-regional coverage. The important detail is that addresses are identified with a name first, and policies are only applied afterwards.

Unbuckling the narrow waist of IP: Addressing Agility for Names and Web Services

(a) Conventional Authoritative DNS

Unbuckling the narrow waist of IP: Addressing Agility for Names and Web Services

(b) Addressing Agility

Addressing agility is achieved by inverting this relationship. Instead of IP addresses pre-assigned to a name, our architecture begins with a policy that may (or in our case, not) include a name. For example, a policy may be represented by attributes such as location and account type and ignore the name (which we did in our deployment). The attributes identify a pool of addresses that are associated with that policy. The pool itself may be isolated to that policy or have elements shared with other pools and policies. Moreover, all the addresses in the pool are equivalent. This means that any of the addresses may be returned — or even selected at random — without inspecting the DNS query name.

Now pause for a moment because there are two really noteworthy implications that fall out  to per-query responses:

i. IP addresses can be, and are, computed and assigned at runtime or query-time.

ii. The lifetime of the IP-to-name mapping is the larger of the ensuing connection lifetime and the TTL in downstream caches.

The outcome is powerful and means that the binding itself is otherwise ephemeral and can be changed without regard to previous bindings, resolvers, clients, or purpose. Also, scale is no issue, and we know because we deployed it at the edge.

IPv6 — new clothes, same emperor

Before talking about our deployment, let’s first address the proverbial elephant in the room: IPv6. The first thing to make clear is that everything — everything — discussed here in the context of IPv4 applies equally in IPv6. As is true of the global postal system, addresses are addresses, whether in Canada, Cambodia, Cameroon, Chile, or China — and that includes their relatively static, inflexible nature.

Despite equivalence, the obvious question remains: Surely all the reasons to pursue Addressing Agility are satisfied simply by changing to IPv6? Counter-intuitive as the answer may be, the answer is a definite, absolute no! IPv6 may mitigate against address exhaustion, at least for the lifetimes of everyone alive today, but the abundance of IPv6 prefixes and addresses makes reasoning difficult about its bindings to names and resources.

The abundance of IPv6 addresses also risks inefficiencies because operators can take advantage of the bit length and large prefix sizes to embed meaning into the IP address. This is a powerful feature of IPv6, but also means many, many, addresses in any prefix will go unused.

To be clear, Cloudflare is demonstrably one of the biggest advocates of IPv6, and for good reasons, not least that the abundance of addresses ensures longevity. Even so, IPv6 changes little about the way addresses are tied to names and resources, whereas an address’ agility ensures flexibility and responsiveness for their lifetimes.

A Side-note: Agility is for Everyone

One last comment on the architecture and its transferability — Addressing Agility is usable, even desirable, for any service that operates authoritative DNS. Other content-oriented service providers are obvious contenders, but so too are smaller operators. Universities, enterprises, and governments are just a few examples of organizations that can operate their own authoritative services. So long as the operators are able to accept connections on the IP addresses that are returned, all are potential beneficiaries of addressing agility as a result.

Policy-based randomized addresses — at scale

We’ve been working with Addressing Agility live at the edge, with production traffic, since June 2020, as follows:

  • More than 20 million hostnames and services
  • All data centers in Canada (giving a reasonable population and multiple time zones)
  • /20 (4096 addresses) in IPv4 and /44 in IPv6
  • /24 (256 addresses) in IPv4 from January 2021 to June 2021
  • For every query, generate a random host-portion within the prefix.

After all, the true test of agility is most extreme when a random address is generated for every query that hits our servers. Then we decided to truly put the idea to the test. In June 2021, in our Montreal data center and soon after in Toronto, all 20+ million zones were mapped to one-single address.

Over the course of one year, every query for a domain captured by the policy received an address selected at random — from a set of as few as 4096 addresses, then 256, and then one. Internally, we refer to the address set of one as Ao1, and we’ll return to this point later.

The measure of success: “Nothing to see here”

There may be a number of questions our readers are quietly asking themselves:

  • What did this break on the Internet?
  • What effect did this have on Cloudflare systems?
  • What would I see happening if I could?

The short answer to each question above is nothing. But — and this is important — address randomization does expose weaknesses in the designs of systems that rely on the Internet. The weaknesses always, every one, occurs because the designers ascribe meaning to IP addresses beyond reachability. (And, if only incidentally, every one of those weaknesses are circumvented by the use of one address, or ‘Ao1.’)

To better understand the nature of “nothing”, let’s answer the above questions starting from the bottom of the list.

What would I see if I could?

The answer is shown by the example in the figure below. From all data centers in the “Rest of World” outside our deployment, a query for a zone returns the same addresses (such is Cloudflare’s global anycast system). In contrast, every query that lands in a deployment data center receives a random address. These can be seen below in successive dig commands to two different data centers.

Unbuckling the narrow waist of IP: Addressing Agility for Names and Web Services

For those who may be wondering about subsequent request traffic, yes, this means that servers are configured to accept connection requests for any of the 20+ million domains on all addresses in the address pool.

Ok, but surely Cloudflare’s surrounding systems needed modification?

Nope. This is a drop-in transparent change to the data pipeline for authoritative DNS. Each of routing prefix advertisements in BGP, DDoS, load balancers, distributed cache, … no changes were required.

There is, however, one fascinating side effect: randomization is to IP addresses as a good hash function is to a hash table — it evenly maps an arbitrary size input to a fixed number of outputs. The effect can be seen by looking at measures of load-per-IP before and after randomization as in the graphs below, with data taken from 1% samples of requests at one data center over seven days.

Unbuckling the narrow waist of IP: Addressing Agility for Names and Web Services
Before Addressing Agility
Unbuckling the narrow waist of IP: Addressing Agility for Names and Web Services
Randomization on /20
Unbuckling the narrow waist of IP: Addressing Agility for Names and Web Services
Randomization on /24

Before randomization, for only a small portion of Cloudflare’s IP space, (a) the difference between greatest and least requests per IP (y1-axis on the left) is three orders of magnitude; similarly, bytes per IP (y2-axis on the right) is almost six orders of magnitude. After randomization, (b) for all domains on a single /20 that previously occupied multiple /20s, these reduce to 2 and 3 orders of magnitude, respectively. Taking this one step further down to /24 in (c), per-query randomization of 20+ million zones onto 256 addresses reduces differences in load to small constant factors.

This might matter to any content service provider that might think about provisioning resources by IP address. A priori predictions of load generated by a customer can be hard. The above graphs are evidence that the best path forward is to give all the addresses to all the names.

Surely this breaks something on the wider Internet?

Here, too, the answer is no! Well, perhaps more precisely stated as, “no, randomization breaks nothing… but it can expose weaknesses in systems and their designs.”

Any systems that might be affected by address randomization appears to have a prerequisite: some meaning is ascribed to the IP address beyond just reachability. Addressing Agility keeps and even restores the semantics of IP addresses and the core Internet architecture, but it will break software systems that make assumptions about their meaning.

Let’s first cover a few examples, why they don’t matter, and then follow with a small change to addressing agility that bypasses weaknesses (by using one single IP address):

  • HTTP Connection Coalescing enables a client to re-use existing connections to request resources from different origins. Clients such as Firefox that permit coalescing when the URI authority matches the connection are unaffected. However, clients that require a URI host to resolve to the same IP address as the given connection will fail.
  • Non-TLS or HTTP-based services may be affected. One example is ssh, which maintains a hostname-to-IP mapping in its known_hosts. This association, while understandable, is outdated and already broken given that many DNS records presently return more than one IP address.
  • Non-SNI TLS certificates require a dedicated IP address. Providers are forced to charge a premium because each address can only support a single certificate without SNI. The bigger issue, independent of IP, is the use of TLS without SNI. We have launched efforts to understand non-SNI to hopefully end this unfortunate legacy.
  • DDoS protections that rely on destination IPs may be hindered, initially. We would argue that addressing agility is beneficial for two reasons. First, IP randomization distributes the attack load across all addresses in use, effectively serving as a layer-3 load-balancer. Second, DoS mitigations often work by changing IP addresses, an ability that is inherent in Addressing Agility.

All for on One, and One for All

We started with 20+ million zones bound to addresses across tens of thousands of addresses, and successfully served them from 4096 addresses in a /20 and then 256 addresses in a /24. Surely this trend begs the following question:

If randomization works over n addresses, then why not randomization over 1 address?

Indeed, why not? Recall from above the comment about randomization over IPs as being equivalent to a perfect hash function in a hash table. The thing about well-designed hash-based structures is that they preserve their properties for any size of the structure, even a size of 1. Such a reduction would be a true test of the foundations on which Addressing Agility is constructed.

So, test we did. From a /20 address set, to a /24 and then, from June 2021, to an address set of one /32, and equivalently a /128 (Ao1). It doesn’t just work. It really works. Concerns that might be exposed by randomization are resolved by Ao1. For example, non-TLS or non-HTTP services have a reliable IP address (or at least non-random and until there is a policy change on the name). Also, HTTP connection coalescing falls out as if for free and, yes, we see increased levels of coalescing where Ao1 is being used.

But why in IPv6 where there are so many addresses?

One argument against binding to a single IPv6 address is that there is no need, because address exhaustion is unlikely. This is a pre-CIDR position that, we claim, is benign at best and irresponsible at worst. As mentioned above, the number of IPv6 addresses makes reasoning about them difficult. In lieu of asking why use a single IPv6 address, we should be asking, “why not?”

Are there upstream implications? Yes, and opportunities!

Ao1 reveals an entirely different set of implications from IP randomization that, arguably, gives us a window into the future of Internet routing and reachability by amplifying the effects that seemingly small actions might have.

Why? The number of possible variable-length names in the universe will always exceed the number of fixed-length addresses. This means that, by the pigeonhole principle, single IP addresses must be shared by multiple names, and different content from unrelated parties.

The possible upstream effects amplified by Ao1 are worth raising and are described below. So far, though, we’ve seen none of these in our evaluations, nor have they come up in communications with upstream networks.

  • Upstream Routing Errors are Immediate and Total. If all traffic arrives on a single address (or prefix), then upstream routing errors affect all content equally. (This is the reason Cloudflare returns two addresses in non-contiguous address ranges.) Note, however, the same is true of threat blocking.
  • Upstream DoS Protections could be triggered. It is conceivable that the concentration of requests and traffic on a single address could be perceived upstream as a DoS attack and trigger upstream protections that may exist.

In both cases, the actions are mitigated by Addressing Agility’s ability to change addresses en masse so quickly. Prevention is also possible, but requires open communication and discourse.

One last upstream effect remains:

  • Port exhaustion in IPv4 NAT might be accelerated, and is solved by IPv6! From the client-side, the number of permissible concurrent connections to one-address is upper-bounded by the size of a transport protocol’s port field, for example about 65K in TCP.

For example, in TCP on Linux this was an issue until recently. (See this commit and SO_BIND_ADDRESS_NO_PORT in ip(7) man page.)  In UDP the issue remains. In QUIC, connection identifiers can prevent port exhaustion, but they have to be used. So far, though, we have yet to see any evidence that this is an issue.

Even so — and here is the best part — to the best of our knowledge this is the only risk to one-address uses, and is also immediately resolved by migrating to IPv6. (So, ISPs and network administrators, go forth and implement IPv6!)

We’re just getting started!

And so we end as we began. With no limit to the number of names on any single IP address, the ability to change the address per-query, for any reason, what could you build?

Unbuckling the narrow waist of IP: Addressing Agility for Names and Web Services

We are, indeed, just getting started! The flexibility and future-proofing enabled by Addressing Agility is enabling us to imagine, design, and build new systems and architectures. We’re planning BGP route leak detection and mitigation for anycast systems, measurement platforms, and more.

Further technical details on all the above, as well as acknowledgements to so many who helped make this possible, can be found in this paper and short talk. Even with these new possibilities, challenges remain. There are many open questions that include, but are in no way limited to the following:

  • What policies can be reasonably expressed or implemented?
  • Is there an abstract syntax or grammar with which to express them?
  • Could we use formal methods and verification to prevent erroneous or conflicting policies?

Addressing Agility is for everyone, even necessary for these ideas to succeed more widely. Input and ideas are welcomed at [email protected].

If you are a student enrolled in a PhD or equivalent research program and looking for an internship for 2022 in the USA or Canada and the EU or UK.

If you’re interested in contributing to projects like this or helping Cloudflare develop its traffic and address management systems, our Addressing Engineering team is hiring!

Announcing Project Pangea: Helping Underserved Communities Expand Access to the Internet For Free

Post Syndicated from Marwan Fayed original https://blog.cloudflare.com/pangea/

Announcing Project Pangea: Helping Underserved Communities Expand Access to the Internet For Free

Announcing Project Pangea: Helping Underserved Communities Expand Access to the Internet For Free

Half of the world’s population has no access to the Internet, with many more limited to poor, expensive, and unreliable connectivity. This problem persists despite large levels of public investment, private infrastructure, and effort by local organizers.

Today, Cloudflare is excited to announce Project Pangea: a piece of the puzzle to help solve this problem. We’re launching a program that provides secure, performant, reliable access to the Internet for community networks that support underserved communities, and we’re doing it for free1 because we want to help build an Internet for everyone.

What is Cloudflare doing to help?

Project Pangea is Cloudflare’s project to help bring underserved communities secure connectivity to the Internet through Cloudflare’s global and interconnected network.

Cloudflare is offering our suite of network services — Cloudflare Network Interconnect, Magic Transit, and Magic Firewall — for free to nonprofit community networks, local networks, or other networks primarily focused on providing Internet access to local underserved or developing areas. This service would dramatically reduce the cost for communities to connect to the Internet, with industry leading security and performance functions built-in:

  • Cloudflare Network Interconnect provides access to Cloudflare’s edge in 200+ cities across the globe through physical and virtual connectivity options.
  • Magic Transit acts as a conduit to and from the broader Internet and protects community networks by mitigating DDoS attacks within seconds at the edge.
  • Magic Firewall gives community networks access to a network-layer firewall as a service, providing further protection from malicious traffic.

We’ve learned from working with customers that pure connectivity is not enough to keep a network sustainably connected to the Internet. Malicious traffic, such as DDoS attacks, can target a network and saturate Internet service links, which can lead to providers aggressively rate limiting or even entirely shutting down incoming traffic until the attack subsides. This is why we’re including our security services in addition to connectivity as part of Project Pangea: no attacker should be able to keep communities closed off from accessing the Internet.

Announcing Project Pangea: Helping Underserved Communities Expand Access to the Internet For Free

What is a community network?

Community networks have existed almost as long as commercial subscribership to the Internet that began with dial-up service. The Internet Society, or ISOC, describes community networks as happening “when people come together to build and maintain the necessary infrastructure for Internet connection.”

Most often, community networks emerge from need, and in response to the lack or absence of available Internet connectivity. They consistently demonstrate success where public and private-sector initiatives have either failed or under-deliver. We’re not talking about stop-gap solutions here, either — community networks around the world have been providing reliable, sustainable, high-quality connections for years.

Many will operate only within their communities, but many others can grow, and have grown, to regional or national scale. The most common models of governance and operation are as not-for-profits or cooperatives, models that ensure reinvestment within the communities being served. For example, we see networks that reinvest their proceeds to replace Wi-Fi infrastructure with fibre-to-the-home.

Cloudflare celebrates these networks’ successes, and also the diversity of the communities that these networks represent. In that spirit, we’d like to dispel myths that we encountered during the launch of this program — many of which we wrongly assumed or believed to be true — because the myths turn out to be barriers that communities so often are forced to overcome.  Community networks are built on knowledge sharing, and so we’re sharing some of that knowledge, so others can help accelerate community projects and policies, rather than rely on the assumptions that impede progress.

Myth #1: Only very rural or remote regions are underserved and in need. It’s true that remote regions are underserved. It is also true that underserved regions exist within 10 km (about six miles) of large city centers, and even within the largest cities themselves, as evidenced by the existence of some of our launch partners.

Myth #2: Remote, rural, or underserved is also low-income. This might just be the biggest myth of all. Rural and remote populations are often thriving communities that can afford service, but have no access. In contrast, the need for urban community networks are often egalitarian, and emerge because the access that is available is unaffordable to many.

Myth #3: Service is necessarily more expensive. This myth is sometimes expressed by statements such as, “if large service providers can’t offer affordable access, then no one can.”  More than a myth, this is a lie. Community networks (including our launch partners) use novel governance and cost models to ensure that subscribers pay rates similar to the wider market.

Myth #4: Technical expertise is a hard requirement and is unavailable. There is a rich body of evidence and examples showing that, with small amounts of training and support, communities can build their own local networks cheaply and reliably with commodity hardware and non-specialist equipment.

These myths aside, there is one truth: the path to sustainability is hard. The start and initial growth of community networks often consists of volunteer time or grant funding, which are difficult to sustain in the long-term. Eventually the starting models need to transition to models of “willing to charge and willing to pay” — Project Pangea is designed to help fill this gap.

What is the problem?

Communities around the world can and have put up Wi-Fi antennas and laid their own fibre. Even so, and however well-connected the community is to itself, Internet services are prohibitively expensive — if they can be found at all.

Two elements are required to connect to the Internet, and each incurs its own cost:

  • Backhaul connections to an interconnection point — the connection point may be anything from a local cabinet to a large Internet exchange point (IXP).
  • Internet Services are provided by a network that interfaces with the wider Internet, and agrees to route traffic to and from on behalf of the community network.

These are distinct elements. Backhaul service carries data packets along a physical link (a fibre cable or wireless medium). Internet service is separate and may be provided over that link, or at its endpoint.

The cost of Internet service for networks is both dominant and variable (with usage), so in most cases it is cheaper to purchase both as a bundle from service providers that also own or operate their own physical network. Telecommunications and energy companies are prime examples.

However, the operating costs and complexity of long-distance backhaul is significantly lower than the costs of Internet service. If reliable, high capacity service were affordable, then community networks could extend their knowledge and governance models sustainably to also provide their own backhaul.

For all that community networks can build, establish, and operate, the one element entirely outside their control is the cost of Internet service — a problem that Project Pangea helps to solve.

Why does the problem persist?

On this subject, I — Marwan — can only share insights drawn from prior experience as a computer science professor, and a co-founder of HUBS c.i.c., launched with talented professors and a network engineer. HUBS is a not-for-profit backhaul and Internet provider in Scotland. It is a cooperative of more than a dozen community networks — some that serve communities with no roads in or out — across thousands of square kilometers along Scotland’s West Coast and Borders regions. As is true of many community networks, not least some of Pangea’s launch partners, HUBS’ is award-winning, and engages in advocacy and policy.

During that time my co-founders and I engaged with research funders, economic development agencies, three levels of government, and so many communities that I lost track. After all that, the answer to the question is still far from clear. There are, however, noteworthy observations and experiences that stood out, and often came from surprising places:

  • Cables on the ground get chewed by animals that, small or large, might never be seen.
  • Burying power and Ethernet cables, even 15 centimeters below soil, makes no difference because (we think) animals are drawn by the electrical current.
  • Property owners sometimes need to be convinced that 8 to 10 square meters to build a small tower in exchange for free Internet and community benefit is a good thing.
  • The raising of small towers, even that no one will see, is sometimes blocked by legislation or regulation that assumes private non-residential structures can only be a shed, or never taller than a shed.
  • Private fibre backbone installations installed with public funds are often inaccessible, or are charged by distance even though the cost to light 100 meters of fibre is identical to the cost of lighting 1 km of fibre.
  • Civil service agencies may be enthusiastic, but are also cautious, even in the face of evidence. Be patient, suffer frustration, be more patient, and repeat. Success is possible.
  • If and where possible, it’s best to avoid attempts to deliver service where national telecommunications companies have plans to do so.
  • Never underestimate tidal fading — twice a day, wireless signals over water will be amazing, and will completely disappear. We should have known!

All anecdotes aside, the best policies and practices are non-trivial — but because of so many prior community efforts, and organizations such as ISOC, the APC, the A4AI, and more, the challenges and solutions are better understood than ever before.

How does a community network reach the Internet?

First, we’d like to honor the many organisations we’ve learned from who might say that there are no technical barriers to success. Connections within the community networks may be shaped by geographical features or regional regulations. For example, wireless lines of sight between antenna towers on personal property are guided by hills or restricted by regulations. Similarly, Ethernet cables and fibre deployments are guided by property ownership, digging rights, and the presence or migration of grazing animals that dig into soil and gnaw at cables — yes, they do, even small rabbits.

Once the community establishes its own area network, the connections to meet Internet services are more conventional, more familiar. In part, the choice is influenced or determined by proximity to Internet exchanges, PoPs, or regional fibre cabinet installations. The connections with community networks fall into three broad categories.

Colocation. A community network may be fortunate enough to have service coverage that overlaps with, or is near to, an Internet eXchange Point (IXP), as shown in the figure below. In this case a natural choice is to colocate a router within the exchange, near to the Internet service provider’s router (labeled as Cloudflare in the figure). Our launch partner NYC Mesh connects in this manner. Unfortunately, being that exchanges are most often located in urban settings, colocation is unavailable to many, if not most, community networks.

Announcing Project Pangea: Helping Underserved Communities Expand Access to the Internet For Free

Conventional point-to-point backhaul. Community networks that are remote must establish a point-to-point backhaul connection to the Internet exchange. This connection method is shown in the figure below in which the community network in the previous figure has moved to the left, and is joined by a physical long-distance link to the Internet service router that remains in the exchange on the right.

Announcing Project Pangea: Helping Underserved Communities Expand Access to the Internet For Free

Point-to-point backhaul is familiar. If the infrastructure is available — and this is a big ‘if’ — then backhaul is most often available from a utility company, such as a telecommunications or energy provider, that may also bundle Internet service as a way to reduce total costs. Even bundled, the total cost is variable and unaffordable to individual community networks, and is exacerbated by distance. Some community networks have succeeded in acquiring backhaul through university, research and education, or publicly-funded networks that are compelled or convinced to offer the service in the public interest. On the west coast of Scotland, for example, Tegola launched with service from the University of Highlands and Islands and the University of Edinburgh.

Start a backhaul cooperative for point-to-point and colocation. The last connection option we see among our launch partners overcomes the prohibitive costs by forming a cooperative network in which the individual subscriber community networks are also members. The cooperative model can be seen in the figure below. The exchange remains on the right. On the left the community network in the previous figure is now replaced by a collection of community networks that may optionally connect with each other (for example, to establish reliable routing if any link fails). Either directly or indirectly via other community networks, each of these community networks has a connection to a remote router at the near-end of the point-to-point connection. Crucially, the point-to-point backhaul service — as well as the co-located end-points — are owned and operated by the cooperative. In this manner, an otherwise expensive backhaul service is made affordable by being a shared cost.

Announcing Project Pangea: Helping Underserved Communities Expand Access to the Internet For Free

Two of our launch partners, Guifi.net and HUBS c.i.c., are organised this way and their 10+ years in operation demonstrate both success and sustainability. Since the backhaul provider is a cooperative, the community network members have a say in the ways that revenue is saved, spent, and — best of all — reinvested back into the service and infrastructure.

Why is Cloudflare doing this?

Cloudflare’s mission is to help build a better Internet, for everyone, not just those with privileged access based on their geographical location. Project Pangea aligns with this mission by extending the Internet we’re helping to build — a faster, more reliable, more secure Internet — to otherwise underserved communities.

How can my community network get involved?

Check out our landing page to learn more and apply for Project Pangea today.

The ‘community’ in Cloudflare

Lastly, in a blog post about community networks, we feel it is appropriate to acknowledge the ‘community’ at Cloudflare: Project Pangea is the culmination of multiple projects, and multiple peoples’ hours, effort, dedication, and community spirit. Many, many thanks to all.
______

1For eligible networks, free up to 5Gbps at p95 levels.