All posts by Mikhail Vaynshteyn

Enable cost-efficient operational analytics with Amazon OpenSearch Ingestion

Post Syndicated from Mikhail Vaynshteyn original https://aws.amazon.com/blogs/big-data/enable-cost-efficient-operational-analytics-with-amazon-opensearch-ingestion/

As the scale and complexity of microservices and distributed applications continues to expand, customers are seeking guidance for building cost-efficient infrastructure supporting operational analytics use cases. Operational analytics is a popular use case with Amazon OpenSearch Service. A few of the defining characteristics of these use cases are ingesting a high volume of time series data and a relatively low volume of querying, alerting, and running analytics on ingested data for real-time insights. Although OpenSearch Service is capable of ingesting petabytes of data across storage tiers, you still have to provision capacity to migrate between hot and warm tiers. This adds to the cost of provisioned OpenSearch Service domains.

The time series data often contains logs or telemetry data from various sources with different values and needs. That is, logs from some sources need to be available in a hot storage tier longer, whereas logs from other sources can tolerate a delay in querying and other requirements. Until now, customers were building external ingestion systems with the Amazon Kinesis family of services, Amazon Simple Queue Service (Amazon SQS), AWS Lambda, custom code, and other similar solutions. Although these solutions enable ingestion of operational data with various requirements, they add to the cost of ingestion.

In general, operational analytics workloads use anomaly detection to aid domain operations. This assumes that the data is already present in OpenSearch Service and the cost of ingestion is already borne.

With the addition of a few recent features of Amazon OpenSearch Ingestion, a fully managed serverless pipeline for OpenSearch Service, you can effectively address each of these cost points and build a cost-effective solution. In this post, we outline a solution that does the following:

  • Uses conditional routing of Amazon OpenSearch Ingestion to separate logs with specific attributes and store those, for example, in Amazon OpenSearch Service and archive all events in Amazon S3 to query with Amazon Athena
  • Uses in-stream anomaly detection with OpenSearch Ingestion, thereby removing the cost associated with compute needed for anomaly detection after ingestion

In this post, we use a VPC flow logs use case to demonstrate the solution. The solution and pattern presented in this post is equally applicable to larger operational analytics and observability use cases.

Solution overview

We use VPC flow logs to capture IP traffic and trigger processing notifications to the OpenSearch Ingestion pipeline. The pipeline filters the data, routes the data, and detects anomalies. The raw data will be stored in Amazon S3 for archival purposes, then the pipeline will detect anomalies in the data in near-real time using the Random Cut Forest (RCF) algorithm and send those data records to OpenSearch Service. The raw data stored in Amazon S3 can be inexpensively retained for an extended period of time using tiered storage and queried using the Athena query engine, and also visualized using Amazon QuickSight or other data visualization services. Although this walkthrough uses VPC flow log data, the same pattern applies for use with AWS CloudTrail, Amazon CloudWatch, any log files as well as any OpenTelemetry events, and custom producers.

The following is a diagram of the solution that we configure in this post.

In the following sections, we provide a walkthrough for configuring this solution.

The patterns and procedures presented in this post have been validated with the current version of OpenSearch Ingestion and the Data Prepper open-source project version 2.4.

Prerequisites

Complete the following prerequisite steps:

  1. We will be using a VPC for demonstration purposes for generating data. Set up the VPC flow logs to publish logs to an S3 bucket in text format. To optimize S3 storage costs, create a lifecycle configuration on the S3 bucket to transition the VPC flow logs to different tiers or expire processed logs. Make a note of the S3 bucket name you configured to use in later steps.
  2. Set up an OpenSearch Service domain. Make a note of the domain URL. The domain can be either public or VPC based, which is the preferred configuration.
  3. Create an S3 bucket for storing archived events, and make a note of S3 bucket name. Configure a resource-based policy allowing OpenSearch Ingestion to archive logs and Athena to read the logs.
  4. Configure an AWS Identity and Access Management (IAM) role or separate IAM roles allowing OpenSearch Ingestion to interact with Amazon SQS and Amazon S3. For instructions, refer to Configure the pipeline role.
  5. Configure Athena or validate that Athena is configured on your account. For instructions, refer to Getting started.

Configure an SQS notification

VPC flow logs will write data in Amazon S3. After each file is written, Amazon S3 will send an SQS notification to notify the OpenSearch Ingestion pipeline that the file is ready for processing.

If the data is already stored in Amazon S3, you can use the S3 scan capability for a one-time or scheduled loading of data through the OpenSearch Ingestion pipeline.

Use AWS CloudShell to issue the following commands to create the SQS queues VpcFlowLogsNotifications and VpcFlowLogsNotifications-DLQ that we use for this walkthrough.

Create a dead-letter queue with the following code

export SQS_DLQ_URL=$(aws sqs create-queue --queue-name VpcFlowLogsNotifications-DLQ | jq -r '.QueueUrl')

echo $SQS_DLQ_URL 

export SQS_DLQ_ARN=$(aws sqs get-queue-attributes --queue-url $SQS_DLQ_URL --attribute-names QueueArn | jq -r '.Attributes.QueueArn') 

echo $SQS_DLQ_ARN

Create an SQS queue to receive events from Amazon S3 with the following code:

export SQS_URL=$(aws sqs create-queue --queue-name VpcFlowLogsNotification --attributes '{
"RedrivePolicy": 
"{\"deadLetterTargetArn\":\"'$SQS_DLQ_ARN'\",\"maxReceiveCount\":\"2\"}", 
"Policy": 
  "{\"Version\":\"2012-10-17\",\"Statement\":[{\"Effect\":\"Allow\",\"Principal\":{\"Service\":\"s3.amazonaws.com\"}, \"Action\":\"SQS:SendMessage\",\"Resource\":\"*\"}]}" 
}' | jq -r '.QueueUrl')

echo $SQS_URL

To configure the S3 bucket to send events to the SQS queue, use the following code (provide the name of your S3 bucket used for storing VPC flow logs):

aws s3api put-bucket-notification-configuration --bucket __BUCKET_NAME__ --notification-configuration '{
     "QueueConfigurations": [
         {
             "QueueArn": "'$SQS_URL'",
             "Events": [
                 "s3:ObjectCreated:*"
             ]
         }
     ]
}'

Create the OpenSearch Ingestion pipeline

Now that you have configured Amazon SQS and the S3 bucket notifications, you can configure the OpenSearch Ingestion pipeline.

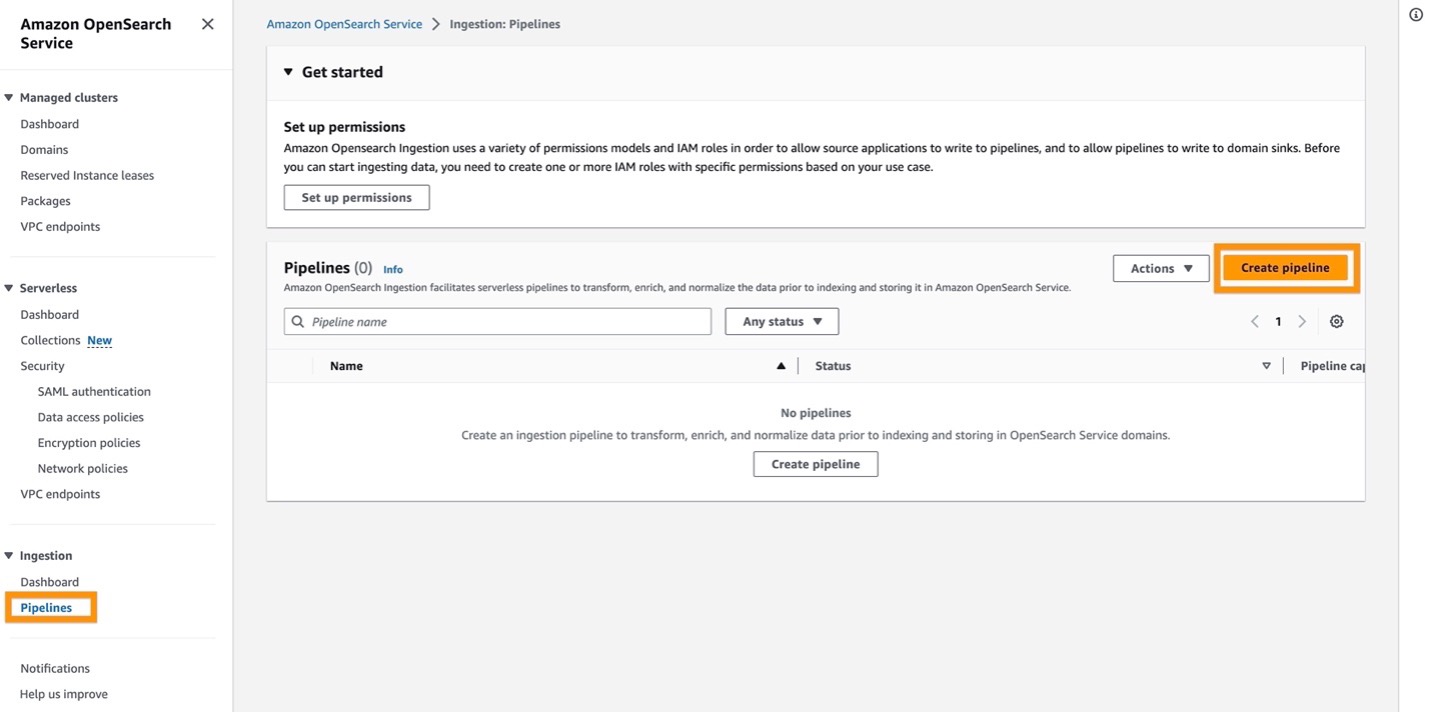
  1. On the OpenSearch Service console, choose Pipelines under Ingestion in the navigation pane.
  2. Choose Create pipeline.

  1. For Pipeline name, enter a name (for this post, we use stream-analytics-pipeline).
  2. For Pipeline configuration, enter the following code:
version: "2"
entry-pipeline:
  source:
     s3:
       notification_type: sqs
       compression: gzip
       codec:
         newline:
       sqs:
         queue_url: "<strong>__SQS_QUEUE_URL__</strong>"
         visibility_timeout: 180s
       aws:
        region: "<strong>__REGION__</strong>"
        sts_role_arn: "<strong>__STS_ROLE_ARN__</strong>"
  
  processor:
  sink:
    - pipeline:
        name: "archive-pipeline"
    - pipeline:
        name: "data-processing-pipeline"

data-processing-pipeline:
    source: 
        pipeline:
            name: "entry-pipeline"
    processor:
    - grok:
        tags_on_match_failure: [ "grok_match_failure" ]
        match:
          message: [ "%{VPC_FLOW_LOG}" ]
    route:
        - icmp_traffic: '/protocol == 1'
    sink:
        - pipeline:
            name : "icmp-pipeline"
            routes:
                - "icmp_traffic"
        - pipeline:
            name: "analytics-pipeline"
    

archive-pipeline:
  source:
    pipeline:
      name: entry-pipeline
  processor:
  sink:
    - s3:
        aws:
          region: "<strong>__REGION__</strong>"
          sts_role_arn: "<strong>__STS_ROLE_ARN__</strong>"
        max_retries: 16
        bucket: "<strong>__AWS_S3_BUCKET_ARCHIVE__</strong>"
        object_key:
          path_prefix: "vpc-flow-logs-archive/year=%{yyyy}/month=%{MM}/day=%{dd}/"
        threshold:
          maximum_size: 50mb
          event_collect_timeout: 300s
        codec:
          parquet:
            auto_schema: true
      
analytics-pipeline:
  source:
    pipeline:
      name: "data-processing-pipeline"
  processor:
    - drop_events:
        drop_when: "hasTags(\"grok_match_failure\") or \"/log-status\" == \"NODATA\""
    - date:
        from_time_received: true
        destination: "@timestamp"
    - aggregate:
        identification_keys: ["srcaddr", "dstaddr"]
        action:
          tail_sampler:
            percent: 20.0
            wait_period: "60s"
            condition: '/action != "ACCEPT"'
    - anomaly_detector:
        identification_keys: ["srcaddr","dstaddr"]
        keys: ["bytes"]
        verbose: true
        mode:
          random_cut_forest:
  sink:
    - opensearch:
        hosts: [ "<strong>__AMAZON_OPENSEARCH_DOMAIN_URL__</strong>" ]
        index: "flow-logs-anomalies"
        aws:
          sts_role_arn: "<strong>__STS_ROLE_ARN__</strong>"
          region: "<strong>__REGION__</strong>"
          
icmp-pipeline:
  source:
    pipeline:
      name: "data-processing-pipeline"
  processor:
  sink:
    - opensearch:
        hosts: [ "<strong>__AMAZON_OPENSEARCH_DOMAIN_URL__</strong>" ]
        index: "sensitive-icmp-traffic"
        aws:
          sts_role_arn: "<strong>__STS_ROLE_ARN__</strong>"
          region: "<strong>__REGION__</strong>"</code>

Replace the variables in the preceding code with resources in your account:

    • __SQS_QUEUE_URL__ – URL of Amazon SQS for Amazon S3 events
    • __STS_ROLE_ARN__AWS Security Token Service (AWS STS) roles for resources to assume
    • __AWS_S3_BUCKET_ARCHIVE__ – S3 bucket for archiving processed events
    • __AMAZON_OPENSEARCH_DOMAIN_URL__ – URL of OpenSearch Service domain
    • __REGION__ – Region (for example, us-east-1)
  1. In the Network settings section, specify your network access. For this walkthrough, we are using VPC access. We provided the VPC and private subnet locations that have connectivity with the OpenSearch Service domain and security groups.
  2. Leave the other settings with default values, and choose Next.
  3. Review the configuration changes and choose Create pipeline.

It will take a few minutes for OpenSearch Service to provision the environment. While the environment is being provisioned, we’ll walk you through the pipeline configuration. Entry-pipeline listens for SQS notifications about newly arrived files and triggers the reading of VPC flow log compressed files:

…
entry-pipeline:
  source:
     s3:
…

The pipeline branches into two sub-pipelines. The first stores original messages for archival purposes in Amazon S3 in read-optimized Parquet format; the other applies analytics routes events to the OpenSearch Service domain for fast querying and alerting:

…
  sink:
    - pipeline:
        name: "archive-pipeline"
    - pipeline:
        name: "data-processing-pipeline"
… 

The pipeline archive-pipeline aggregates messages in 50 MB chunks or every 60 seconds and writes a Parquet file to Amazon S3 with the schema inferred from the message. Also, a prefix is added to help with partitioning and query optimization when reading a collection of files using Athena.

…
sink:
    - s3:
…
        object_key:
          path_prefix: " vpc-flow-logs-archive/year=%{yyyy}/month=%{MM}/day=%{dd}/"
        threshold:
          maximum_size: 50mb
          event_collect_timeout: 300s
        codec:
          parquet:
            auto_schema: true
…

Now that we have reviewed the basics, we focus on the pipeline that detects anomalies and sends only high-value messages that deviate from the norm to OpenSearch Service. It also stores Internet Control Message Protocols (ICMP) messages in OpenSearch Service.

We applied a grok processor to parse the message using a predefined regex for parsing VPC flow logs, and also tagged all unparsable messages with the grok_match_failure tag, which we use to remove headers and other records that can’t be parsed:

…
    processor:
    - grok:
        tags_on_match_failure: [ "grok_match_failure" ]
        match:
          message: [ "%{VPC_FLOW_LOG}" ]
…

We then routed all messages with the protocol identifier 1 (ICMP) to icmp-pipeline and all messages to analytics-pipeline for anomaly detection:

…
   route:
        - icmp_traffic: '/protocol == 1'
    sink:
        - pipeline:
            name : "icmp-pipeline"
            routes:
                - "icmp_traffic"
        - pipeline:
            name: "analytics-pipeline"
…

In the analytics pipeline, we dropped all records that can’t be parsed using the hasTags method based on the tag that we assigned at the time of parsing. We also removed all records that don’t contains useful data for anomaly detection.

…
  - drop_events:
        drop_when: "hasTags(\"grok_match_failure\") or \"/log-status\" == \"NODATA\""		
…

Then we applied probabilistic sampling using the tail_sampler processor for all accepted messages grouped by source and destination addresses and sent those to the sink with all messages that were not accepted. This helps reduce the volume of messages within the selected cardinality keys, with a focus on all messages that weren’t accepted, and keeps a sample representation of messages that were accepted.

…
aggregate:
        identification_keys: ["srcaddr", "dstaddr"]
        action:
          tail_sampler:
            percent: 20.0
            wait_period: "60s"
            condition: '/action != "ACCEPT"'
…

Then we used the anomaly detector processor to identify anomalies within the cardinality key pairs or source and destination addresses in our example. The anomaly detector processor creates and trains RCF models for a hashed value of keys, then uses those models to determine whether newly arriving messages have an anomaly based on the trained data. In our demonstration, we use bytes data to detect anomalies:

…
anomaly_detector:
        identification_keys: ["srcaddr","dstaddr"]
        keys: ["bytes"]
        verbose: true
        mode:
          random_cut_forest:
…

We set verbose:true to instruct the detector to emit the message every time an anomaly is detected. Also, for this walkthrough, we used a non-default sample_size for training the model.

When anomalies are detected, the anomaly detector returns a complete record and adds

"deviation_from_expected":value,"grade":value attributes that signify the deviation value and severity of the anomaly. These values can be used to determine routing of such messages to OpenSearch Service, and use per-document monitoring capabilities in OpenSearch Service to alert on specific conditions.

Currently, OpenSearch Ingestion creates up to 5,000 distinct models based on cardinality key values per compute unit. This limit is observed using the anomaly_detector.RCFInstances.value CloudWatch metric. It’s important to select a cardinality key-value pair to avoid exceeding this constraint. As development of the Data Prepper open-source project and OpenSearch Ingestion continues, more configuration options will be added to offer greater flexibility around model training and memory management.

The OpenSearch Ingestion pipeline exposes the anomaly_detector.cardinalityOverflow.count metric through CloudWatch. This metric indicates a number of key value pairs that weren’t run by the anomaly detection processor during a period of time as the maximum number of RCFInstances per compute unit was reached. To avoid this constraint, a number of compute units can be scaled out to provide additional capacity for hosting additional instances of RCFInstances.

In the last sink, the pipeline writes records with detected anomalies along with deviation_from_expected and grade attributes to the OpenSearch Service domain:

…
sink:
    - opensearch:
        hosts: [ "__AMAZON_OPENSEARCH_DOMAIN_URL__" ]
        index: "anomalies"
…

Because only anomaly records are being routed and written to the OpenSearch Service domain, we are able to significantly reduce the size of our domain and optimize the cost of our sample observability infrastructure.

Another sink was used for storing all ICMP records in a separate index in the OpenSearch Service domain:

…
sink:
    - opensearch:
        hosts: [ "__AMAZON_OPENSEARCH_DOMAIN_URL__" ]
        index: " sensitive-icmp-traffic"
…

Query archived data from Amazon S3 using Athena

In this section, we review the configuration of Athena for querying archived events data stored in Amazon S3. Complete the following steps:

  1. Navigate to the Athena query editor and create a new database called vpc-flow-logs-archive-database using the following command:
CREATE DATABASE `vpc-flow-logs-archive`
  1. 2. On the Database menu, choose vpc-flow-logs-archive.
  2. In the query editor, enter the following command to create a table (provide the S3 bucket used for archiving processed events). For simplicity, for this walkthrough, we create a table without partitions.
CREATE EXTERNAL TABLE `vpc-flow-logs-data`(
  `message` string)
ROW FORMAT SERDE 
  'org.apache.hadoop.hive.ql.io.parquet.serde.ParquetHiveSerDe' 
STORED AS INPUTFORMAT 
  'org.apache.hadoop.hive.ql.io.parquet.MapredParquetInputFormat' 
OUTPUTFORMAT 
  'org.apache.hadoop.hive.ql.io.parquet.MapredParquetOutputFormat'
LOCATION
  's3://__AWS_S3_BUCKET_ARCHIVE__'
TBLPROPERTIES (
  'classification'='parquet', 
  'compressionType'='none'
)
  1. Run the following query to validate that you can query the archived VPC flow log data:
SELECT * FROM "vpc-flow-logs-archive"."vpc-flow-logs-data" LIMIT 10;

Because archived data is stored in its original format, it helps avoid issues related to format conversion. Athena will query and display records in the original format. However, it’s ideal to interact only with a subset of columns or parts of the messages. You can use the regexp_split function in Athena to split the message in the columns and retrieve certain columns. Run the following query to see the source and destination address groupings from the VPC flow log data:

SELECT srcaddr, dstaddr FROM (
   SELECT regexp_split(message, ' ')[4] AS srcaddr, 
          regexp_split(message, ' ')[5] AS dstaddr, 
          regexp_split(message, ' ')[14] AS status  FROM "vpc-flow-logs-archive"."vpc-flow-logs-data" 
) WHERE status = 'OK' 
GROUP BY srcaddr, dstaddr 
ORDER BY srcaddr, dstaddr LIMIT 10;

This demonstrated that you can query all events using Athena, where archived data in its original raw format is used for the analysis. Athena is priced per data scanned. Because the data is stored in a read-optimized format and partitioned, it enables further cost-optimization around on-demand querying of archived streaming and observability data.

Clean up

To avoid incurring future charges, delete the following resources created as part of this post:

  • OpenSearch Service domain
  • OpenSearch Ingestion pipeline
  • SQS queues
  • VPC flow logs configuration
  • All data stored in Amazon S3

Conclusion

In this post, we demonstrated how to use OpenSearch Ingestion pipelines to build a cost-optimized infrastructure for log analytics and observability events. We used routing, filtering, aggregation, and anomaly detection in an OpenSearch Ingestion pipeline, enabling you to downsize your OpenSearch Service domain and create a cost-optimized observability infrastructure. For our example, we used a data sample with 1.5 million events with a pipeline distilling to 1,300 events with predicted anomalies based on source and destination IP pairs. This metric demonstrates that the pipeline identified that less than 0.1% of events were of high importance, and routed those to OpenSearch Service for visualization and alerting needs. This translates to lower resource utilization in OpenSearch Service domains and can lead to provisioning of smaller OpenSearch Service environments.

We encourage you to use OpenSearch Ingestion pipelines to create your purpose-built and cost-optimized observability infrastructure that uses OpenSearch Service for storing and alerting on high-value events. If you have comments or feedback, please leave them in the comments section.


About the Authors

Mikhail Vaynshteyn is a Solutions Architect with Amazon Web Services. Mikhail works with healthcare and life sciences customers to build solutions that help improve patients’ outcomes. Mikhail specializes in data analytics services.

Muthu Pitchaimani is a Search Specialist with Amazon OpenSearch Service. He builds large-scale search applications and solutions. Muthu is interested in the topics of networking and security, and is based out of Austin, Texas.

Patterns for updating Amazon OpenSearch Service index settings and mappings

Post Syndicated from Mikhail Vaynshteyn original https://aws.amazon.com/blogs/big-data/patterns-for-updating-amazon-opensearch-service-index-settings-and-mappings/

Amazon OpenSearch Service is used for a broad set of use cases like real-time application monitoring, log analytics, and website search at scale. As your domain ages and you add additional consumers, you need to reevaluate and change the domain’s configuration to handle additional storage and compute needs. You want to minimize downtime and performance impact as you make these changes.

Customers have been seeking guidance on best practices and patterns for changing index settings without an index maintenance window or affecting overall performance of the OpenSearch Service domain. This is part one of a two-part series, in which we show how to make settings changes to OpenSearch Service indexes with little to no downtime while supporting active producers and consumers of the data.

Indexes in OpenSearch Service

In OpenSearch Service, data must be indexed before it can be queried. Indexing is the method by which search engines organize data for fast retrieval. The resulting structure is called, fittingly, an index. All operations performed on an index are done via index APIs. Also, each index contains index mappings, which define field names and data types in the index. Data producers can add new fields with data types to an index. Index mappings can’t change throughout the index lifecycle.

OpenSearch Service indexes have two types of settings that periodically need adjustments as the profile of your workload changes:

  • Dynamic – Settings that can be changed on the index at any time
  • Static – Settings that can only be defined at the index creation time and can’t be changed throughout the index lifecycle

Dynamic index settings can be changed at any time using the update settings API. While the OpenSearch Service domain is performing instructed operations on dynamic index settings, the index doesn’t require a downtime. Changes to most dynamic index settings won’t trigger background tasks that affect the overall utilization of domain resources; however, some settings such as increasing the number of replicas via index.number_of_replicas or index.auto_expand_replicas, and depending on the domain’s configuration, can cause a temporary increase in resource utilization while the domain adds replicas. We recommend maintaining at least one replica for redundancy reasons, and multiple replicas for high query throughput use cases.

Static index settings such as mapping and shard count are defined at index creation time and can’t be changed throughout the index lifecycle. In this post, we focus on patterns and best practices for working with static index settings, such as changing shard count and patterns for updating index mappings.

All operations and procedures that we cover in this post are issued directly to the OpenSearch REST API or via the Dev Tools in OpenSearch Dashboards.

As with any use case, there is a spectrum of solutions and constraints to be considered. We start with a few simple foundational patterns and build on them, accounting for use cases with more operational constraints and working with large datasets.

Solution overview

OpenSearch Service has a default sharding strategy of 5:1, where each index is divided into five primary shards. Within each index, each primary shard also has its own replica. OpenSearch Service automatically assigns primary shards and replica shards to separate data nodes.

It’s not possible to increase the primary shard number of an existing index, meaning an index must be recreated if you want to increase the primary shard count.

The _reindex operation is ideal for creating destination indexes with updated shards and mapping settings. The _reindex operation is resource intensive. We recommend disabling replicas in your destination index by setting number_of_replicas to 0 and re-enable replicas when the reindex process is complete. If you have your data in a second, durable store, the simplest thing to do is pause updates and reindex from the source. But that’s not always possible. In this post, we share several patterns that enable you to update even static index settings like shard count.

One the major advantages of using the _reindex operation is that it doesn’t require placing the source index in a read-only mode (data producers may continue to write the data while reindexing is in progress). Also, the _reindex operation enables reprocessing, transformation, and reindexing a subset of documents and even selectively combining documents from multiple indexes. With the _reindex operation, you can copy all or a subset of documents that you select through a query to another index. In its most basic form, the _reindex operation requires you to specify a source and a destination index and configuration parameters.

The following are the some of the use cases supported by the reindex API:

  • Reindexing all documents
  • Reindexing from a remote cluster when transferring data between clusters
  • Reindexing a subset of documents that match a search query
  • Combining one or more indexes
  • Transforming documents during reindexing

To increase the shard count, you create a new index, set number_of_shards to your desired primary shard count, set number_of_replicas to 0, update the new index mapping based on your requirement, and run the reindex API operation. After the _reindex operation is complete, we recommend updating number_of_replicas in the destination index settings to achieve your desired level of replica shards.

In the following sections, we provide a walkthrough of the reindex API operation. Note that the patterns and procedures presented in this post have been validated on Amazon OpenSearch Service version 1.3.

Prerequisites

The source of the documents must be stored in the index (the “_source” setting at the index mappings level must be set to “enabled”:true, which is the default). The _reindex operation can’t be used without source documents.

Create the destination index with your desired mapping (field or data type). For demonstration purposes, our source index has a field ratings defined as long, and we want the same field to use the float data type in the destination index:

GET /source_index_name/mappings
{  
  "source_index_name": {
    "mappings" : {
      "properties" : {
        "ratings " : {
          "type" : "long"
        },
…
      }
    }
  }
}

PUT /destination_index_name
{
  "settings": {
    "index": {
      "number_of_shards": <DESIRED_NUMBER_OF_PRIMARY_SHARDS>,
      "number_of_replicas": 0
    }
  },
  "mappings": {
    "properties" : {
      "ratings" : {
          "type" : "float"
        },
…
    }
  }
}

Ensure that you have sufficient disk space on each hot tier data node to house the new index primary shards and, depending on your configuration, replica shards. If disk space is insufficient, perform an update operation on the OpenSearch Service domain to add the required storage capacity. Depending on storage requirements, you may need to migrate the OpenSearch Service domain to a different instance type, because nodes have constraints on the EBS volume size that can be mounted to each instance type. Issue the following operation to validate available disk space:

GET _cat/allocation?v

The following screenshot shows the output.

Check the disk.avail metric for hot storage tier nodes to validate your available disk space.

Use the reindex API operation

The _reindex operation snapshots the index at the beginning of its run and performs processing on a snapshot to minimize impact on the source index. The source index can still be used for querying and processing the data. Although the _reindex operation can run both synchronously and asynchronously, we recommend using an asynchronous run. You can monitor the progress of the _reindex operation, cancel its run, or throttle its run using the _task, _cancel, and _rethrottle operations, respectively.

Because the _reindex operation doesn’t require the source index placed in a read-only mode, query and index update operations are free to continue.

Use the reindex API with the following command:

POST _reindex?wait_for_completion=false
{
  "source": {
	"index": "source_index_name"
  },
  "dest": {
	"index": "destination_index_name",
	"op_type" : "index"
  }
}

The source indexes as part of the _reindex API operation can be supplemented with a query for reindexing a subset of documents and storing them in the destination index. Progress of the re-indexing operation can be monitored via tasks API operation:

GET _tasks

Note that the _reindex operation can be throttled via a _rethrottle API or settings passed as a parameter. You can cancel the task with the _cancel operation:

POST _tasks/TASK_ID/_cancel

The following screenshot shows the output of the _reindex operation for reindexing from source_index_name to destination_index_name.

When the operation is complete, both consumers and producers of the source indexes or aliases need to re-point to the destination index and the same _reindex operation needs to run again to catch up on any create, update, or delete operations performed on the source indexes while the initial _reindex operation was running. This step is required because the _reindex operation is running on a snapshot of the index. At this time, the _reindex operation needs to run with “op_type”:”create” to realign missing and out-of-version documents. See the following API command:

POST _reindex?wait_for_completion=false
{
"conflicts":"proceed",
  "source": {
	"index": "source_index_name"
  },
  "dest": {
	"index": "destination_index_name",
	"op_type" : "create"
  }
}

After the operation is complete and data integrity in the destination index is confirmed, you can delete the source index to reclaim disk space.

Increase index shard count using the split index API

The split index API and shrink index API cover a large array of use cases and present with low resource utilization in the domain. However, these APIs require closing the index for write operations and don’t address use cases that require changes to the mapping settings.

In OpenSearch Service, the number_of_shards index setting is immutable and defined at the time when the index is created. However, although this setting is immutable, there are several patterns to increase or decrease index shard count without needing to explicitly reindex the data. You can alternatively use the split index API to increase index shard count in the environments that can suspend write operations. The split index API provides a simplified way of creating a new index with a different shard setting and without reindexing your data. The split index API operation creates a new index based off of a read-only index with a desired number of primary shards.

In OpenSearch Service, an index alias is a virtual index name that can point to one or more indexes. Referencing to indexes using aliases in your applications allows you to avoid index name changes. Index aliases are used to point consumers and producers to a new index after the split index API operation is complete.

Although the majority of use cases focus on increasing a number of shards on an existing index due to data growth, there are also instances where you need to reduce the number of shards on an existing index. Such cases occasionally happen when an actual index size is less than what was anticipated when the index was created, and you want to align with a shard strategy for operational best practices for OpenSearch Service. In cases where you need to reduce a number of shards on an index, you can use the shrink index API to achieve this task.

Conclusion

In this post, we reviewed best practices when reindexing data for making changes in OpenSearch Service static index settings and mappings that require little or no index downtime. We also covered use of the split index and shrink index APIs for changing the primary index shard count for use cases where the index can be placed in a read-only state.

In our next post, we’ll explore patterns for remote indexing to alleviate load and resource utilization on the source OpenSearch Service domain.


About the Authors

Mikhail Vaynshteyn is a Solutions Architect with Amazon Web Services. Mikhail works with healthcare and life sciences customers to build solutions that help improve patients’ outcomes. Mikhail specializes in data analytics services.

Sukhomoy Basak is a Solutions Architect at Amazon Web Services, with a passion for data and analytics solutions. Sukhomoy works with enterprise customers to help them architect, build, and scale applications to achieve their business outcomes.