Post Syndicated from Ranjit Kalidasan original https://aws.amazon.com/blogs/big-data/deliver-decompressed-amazon-cloudwatch-logs-to-amazon-s3-and-splunk-using-amazon-data-firehose/
You can use Amazon Data Firehose to aggregate and deliver log events from your applications and services captured in Amazon CloudWatch Logs to your Amazon Simple Storage Service (Amazon S3) bucket and Splunk destinations, for use cases such as data analytics, security analysis, application troubleshooting etc. By default, CloudWatch Logs are delivered as gzip-compressed objects. You might want the data to be decompressed, or want logs to be delivered to Splunk, which requires decompressed data input, for application monitoring and auditing.
AWS released a feature to support decompression of CloudWatch Logs in Firehose. With this new feature, you can specify an option in Firehose to decompress CloudWatch Logs. You no longer have to perform additional processing using AWS Lambda or post-processing to get decompressed logs, and can deliver decompressed data to Splunk. Additionally, you can use optional Firehose features such as record format conversion to convert CloudWatch Logs to Parquet or ORC, and dynamic partitioning to automatically group streaming records based on keys in the data (for example, by month) and deliver the grouped records to corresponding Amazon S3 prefixes.
In this post, we look at how to enable the decompression feature for Splunk and Amazon S3 destinations. We start with Splunk and then Amazon S3 for new streams, then we address migration steps to take advantage of this feature and simplify your existing pipeline.
Decompress CloudWatch Logs for Splunk
You can use subscription filter in CloudWatch log groups to ingest data directly to Firehose or through Amazon Kinesis Data Streams.
Note: For the CloudWatch Logs decompression feature, you need a HTTP Event Collector (HEC) data input created in Splunk, with indexer acknowledgement enabled and the source type. This is required to map to the right source type for the decompressed logs. When creating the HEC input, include the source type mapping (for example, aws:cloudtrail).

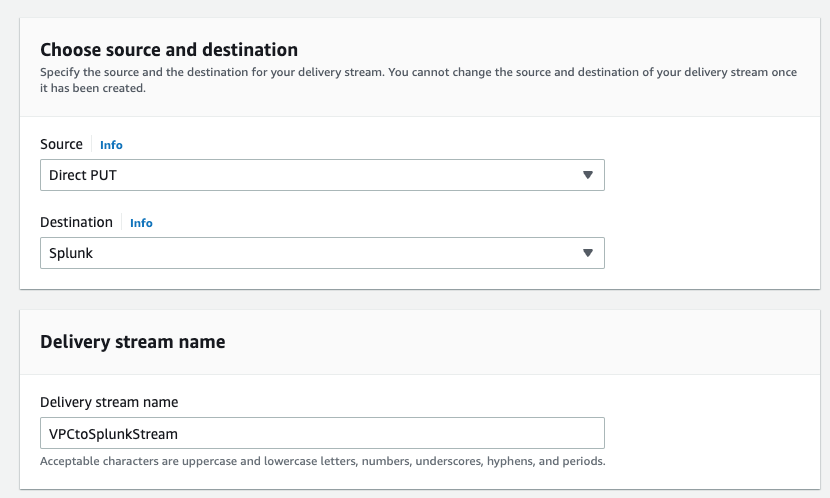
To create a Firehose delivery stream for the decompression feature, complete the following steps:
- Provide your destination settings and select Raw endpoint as endpoint type.
You can use a raw endpoint for the decompression feature to ingest both raw and JSON-formatted event data to Splunk. For example, VPC Flow Logs data is raw data, and AWS CloudTrail data is in JSON format.
- Enter the HEC token for Authentication token.

- To enable decompression feature, deselect Transform source records with AWS Lambda under Transform records.
- Select Turn on decompression and Turn on message extraction for Decompress source records from Amazon CloudWatch Logs.
- Select Turn on message extraction for the Splunk destination.


Message extraction feature
After decompression, CloudWatch Logs are in JSON format, as shown in the following figure. You can see the decompressed data has metadata information such as logGroup, logStream, and subscriptionFilters, and the actual data is included within the message field under logEvents (the following example shows an example of CloudTrail events in the CloudWatch Logs).

When you enable message extraction, Firehose will extract just the contents of the message fields and concatenate the contents with a new line between them, as shown in following figure. With the CloudWatch Logs metadata filtered out with this feature, Splunk will successfully parse the actual log data and map to the source type configured in HEC token.

Additionally, If you want to deliver these CloudWatch events to your Splunk destination in real time, you can use zero buffering, a new feature that was launched recently in Firehose. You can use this feature to set up 0 seconds as the buffer interval or any time interval between 0–60 seconds to deliver data to the Splunk destination in real time within seconds.

With these settings, you can now seamlessly ingest decompressed CloudWatch log data into Splunk using Firehose.
Decompress CloudWatch Logs for Amazon S3
The CloudWatch Logs decompression feature for an Amazon S3 destination works similar to Splunk, where you can turn off data transformation using Lambda and turn on the decompression and message extraction options. You can use the decompression feature to write the log data as a text file to the Amazon S3 destination or use with other Amazon S3 destination features like record format conversion using Parquet or ORC, or dynamic partitioning to partition the data.
Dynamic partitioning with decompression
For Amazon S3 destination, Firehose supports dynamic partitioning, which enables you to continuously partition streaming data by using keys within data, and then deliver the data grouped by these keys into corresponding Amazon S3 prefixes. This enables you to run high-performance, cost-efficient analytics on streaming data in Amazon S3 using services such as Amazon Athena, Amazon EMR, Amazon Redshift Spectrum, and Amazon QuickSight. Partitioning your data minimizes the amount of data scanned, optimizes performance, and reduces costs of your analytics queries on Amazon S3.
With the new decompression feature, you can perform dynamic partitioning without any Lambda function for mapping the partitioning keys on CloudWatch Logs. You can enable the Inline parsing for JSON option, scan the decompressed log data, and select the partitioning keys. The following screenshot shows an example where inline parsing is enabled for CloudTrail log data with a partitioning schema selected for account ID and AWS Region in the CloudTrail record.

Record format conversion with decompression
For CloudWatch Logs data, you can use the record format conversion feature on decompressed data for Amazon S3 destination. Firehose can convert the input data format from JSON to Apache Parquet or Apache ORC before storing the data in Amazon S3. Parquet and ORC are columnar data formats that save space and enable faster queries compared to row-oriented formats like JSON. You can use the features for record format conversion under the Transform and convert records settings to convert the CloudWatch log data to Parquet or ORC format. The following screenshot shows an example of record format conversion settings for Parquet format using an AWS Glue schema and table for CloudTrail log data. When the dynamic partitioning settings are configured, record format conversion works along with dynamic partitioning to create the files in the output format with a partition folder structure in the target S3 bucket.

Migrate existing delivery streams for decompression
If you want to migrate an existing Firehose stream that uses Lambda for decompression to this new decompression feature of Firehose, refer to the steps outlined in Enabling and disabling decompression.
Pricing
The Firehose decompression feature decompress the data and charges per GB of decompressed data. To understand decompression pricing, refer to Amazon Data Firehose pricing.
Clean up
To avoid incurring future charges, delete the resources you created in the following order:
- Delete the CloudWatch Logs subscription filter.
- Delete the Firehose delivery stream.
- Delete the S3 buckets.
Conclusion
The decompression and message extraction feature of Firehose simplifies delivery of CloudWatch Logs to Amazon S3 and Splunk destinations without requiring any code development or additional processing. For an Amazon S3 destination, you can use Parquet or ORC conversion and dynamic partitioning capabilities on decompressed data.
For more information, refer to the following resources:
- Record Transformation and Format Conversion
- Enabling and disabling decompression
- Message extraction after decompression of CloudWatch Logs
About the Authors
 Ranjit Kalidasan is a Senior Solutions Architect with Amazon Web Services based in Boston, Massachusetts. He is a Partner Solutions Architect helping security ISV partners co-build and co-market solutions with AWS. He brings over 25 years of experience in information technology helping global customers implement complex solutions for security and analytics. You can connect with Ranjit on LinkedIn.
 Phaneendra Vuliyaragoli is a Product Management Lead for Amazon Data Firehose at AWS. In this role, Phaneendra leads the product and go-to-market strategy for Amazon Data Firehose.