Post Syndicated from Shilpa Mohan original https://aws.amazon.com/blogs/big-data/7-most-common-data-preparation-transformations-in-aws-glue-databrew/
For all analytics and ML modeling use cases, data analysts and data scientists spend a bulk of their time running data preparation tasks manually to get a clean and formatted data to meet their needs. We ran a survey among data scientists and data analysts to understand the most frequently used transformations in their data preparation workflow. AWS Glue DataBrew provides more than 250 built-in transformations which will make most of these tasks 80% faster. This blog covers use case based walkthroughs of how we can achieve the top 7 among those transformations in AWS Glue DataBrew.
#1 Handling/Imputing missing values
Missing data is predominant in all datasets and can have a significant impact on the analytics or ML models using the data. Missing values in datasets can skew or bias the data and result in invalid conclusions. Handling missing values is one of the most frequently used data preparation steps.
In DataBrew project you can get a quick view of missing values in your sample data under Data quality in the Schema view and the Column statistics.

For any data column you can choose to either remove the missing rows or fill it with an empty string, null, last valid value, most frequent value or a custom value. For numerical data columns you can also fill missing values with numerical aggregates of values like average, mode, sum or median of values.
Here’s an example of how we filled missing values in column “sub-product” with the custom values “None” for the Consumer complaints dataset.

#2 Combining datasets
Data analysis is often performed on a single dataset, however the key information required to arrive at useful insights might be spread throughout multiple datasets. Joins are a predominantly used data preparation step to bring together information from multiple different datasets together. In many large data scenarios, the information in a single dataset can be split or partitioned into multiple files, Union is a data preparation step used in this case to consolidate all parts of the dataset together. DataBrew supports Union and Join to combine data from multiple datasets. You can union multiple files into one at the beginning of a project or as a recipe step or join a dataset based on one or more join keys.
Multiple files as an input dataset
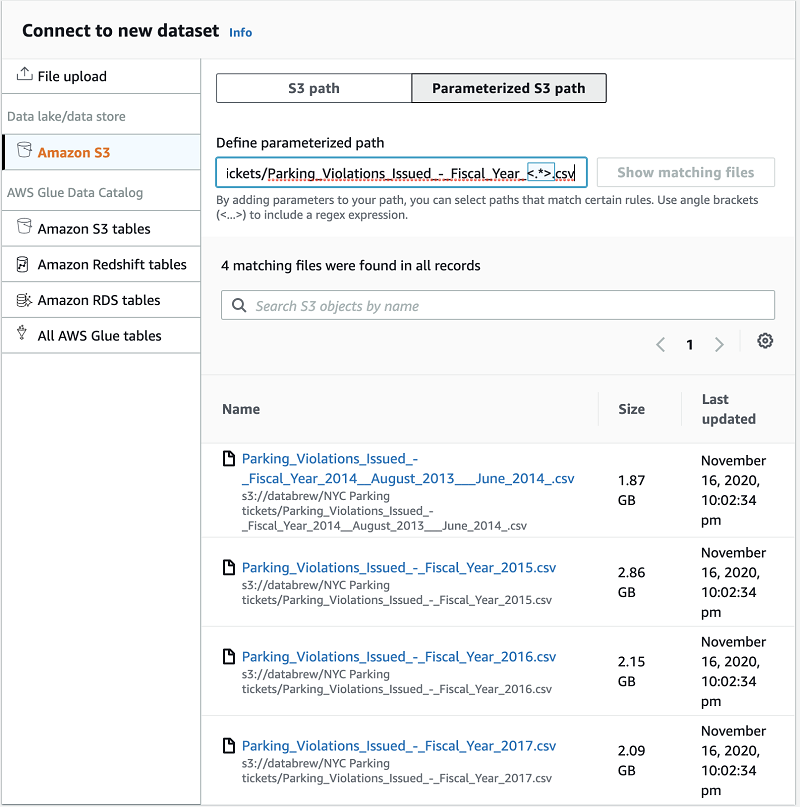
You can union multiple files together as a single input for any DataBrew project. Here is an example of how we union four files for NYC Parking tickets dataset.
You can select all files in a folder as an input for your project to union all the data in the files. DataBrew supports parameterized input path to customize the files you would like to combine.
Union as a transformation
In a project, you can add the union as a recipe step to combine multiple files. You will need to pre-create all the required datasets in DataBrew to perform this as a recipe step. Union is available as a transformation in the project toolbar.

You can select multiple datasets with preview for the Union transform. You can then specify whether to map column by names or position in the dataset and also order the datasets to control the order of rows in the data after union.
Detailed column mapping allows you to customize the columns mapping, resulting column name and column type.
You can preview the resulting dataset before applying the transformation, which is then added to your recipe.
Joining datasets
The Join transform allows you to bring in data from a secondary dataset. The example covers joining of UN General Assembly Votes – Resolutions data with UN General Assembly Votes – States data using “resolution session” as the join key.
You can choose from the different Join types, the visual representation helps you identify the right type of join for your scenario. You can add one or more join keys.
The columns list allows you to search the entire list of columns from both the datasets and choose which columns you want to retain as part of the Join operation.
You can also preview your joined table before you complete the transform.
#3 Creating columns
Often data available in a dataset might not be represented as the values you may need for downstream data analysis or data modeling. As part of data prep, data analyst and data scientist create these custom data columns in a format that would suit their data analysis needs.
You can create columns with extracted values or flagged values from existing column. DataBrew also provides a collection of functions that help you create new columns. It covers math, aggregate, text, date, windows, web and other functions.
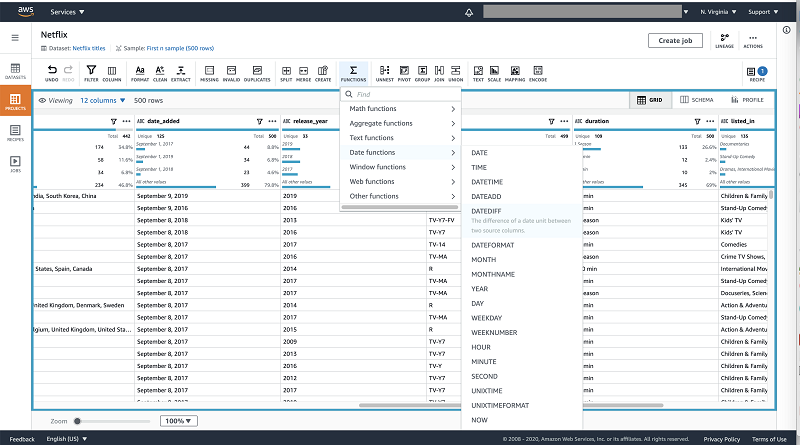
For example in a Netflix Movies and TV Shows dataset you can create a column that tell you how many years the title has been available on Netflix but using a DATEDIFF function on the “date_added” column.
Create a column using a function
You can select the DATEDIFF from the date functions from the toolbar. You can calculate the number of years by doing calculating the difference of the “date_added” value and current date. You can set the output to be calculated in years.
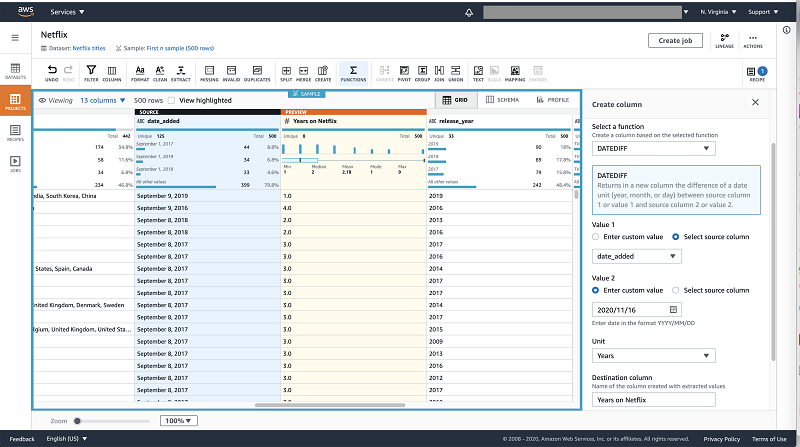
As all transformations, you can preview the transform before applying it.
Creating a Flag column
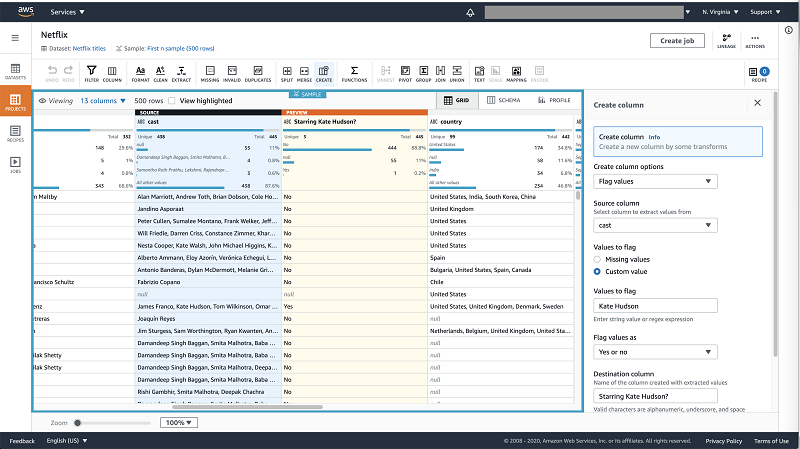
From the same Netflix Movies and TV Shows dataset, you can create a flag column from the create column option in the toolbar.
You can flag titles that starred Kate Hudson by flagging a custom value “Kate Hudson” in the “Cast” column. You have different options for values of the flag column, in this case we will go with Yes and No.
#4 Filtering data
You can filter values in a dataset as a transformation or as a filter the data in your grid view.
If you select “Apply as a step”, the filter is added to your recipe as a step.
You can “Filter values” to filter values in view of the project. All applied filters are shown in the toolbar. You can choose to apply all the filters as a step from the toolbar at any time.
You can conditionally apply transformations on the conditionally filtered values.
For example, in the Netflix Movies and TV Shows dataset, we can replace the word “deformed” with “physically different” but only for Kids related titles.
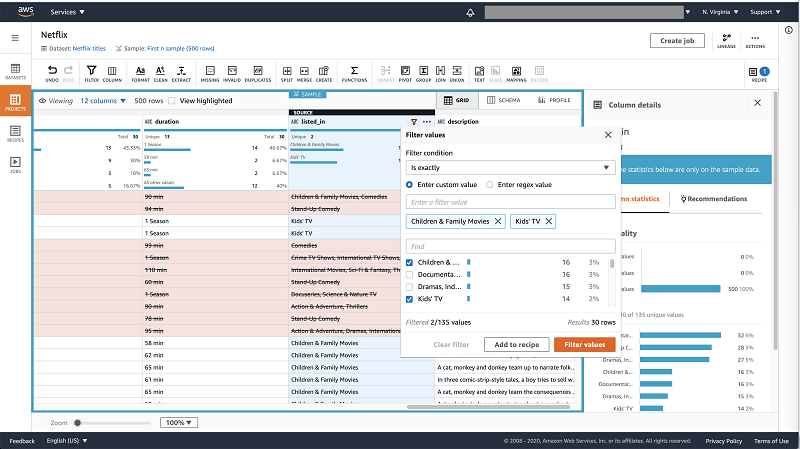
We can filter the “listed_on” column by “Kid’s TV” and “Children & Family Movies”. Now on the “description” column we can replace values from the clean menu on the toolbar. On the transformation panel, under “Apply transform to” you can choose to apply the transformations only to the filtered rows. This will replace the term “deformed” with “physically different” only for Kids titles in the entire dataset.

#5 Aggregating data
You can aggregate data in DataBrew by using the Group by transformation. For the example dataset of New York City Airbnb Open Data, we can create an aggregated minimum and maximum price by neighborhood.
You can select Group By transformation from the toolbar. We first select the column to group by “Neighborhood”. We can then add two aggregated columns based on column “Price” for “min” and “max” of the values in the column.
By default the columns are added as new columns in the existing dataset. You can choose to create a table with only the specified columns above.
#6 Handling Categorical values
For most ML modeling algorithms with categorical values like Gender, Product category or Education level need to be converted to numerical formats. DataBrew supports Categorical mapping and One-Hot Encoding.
Categorical or label mapping
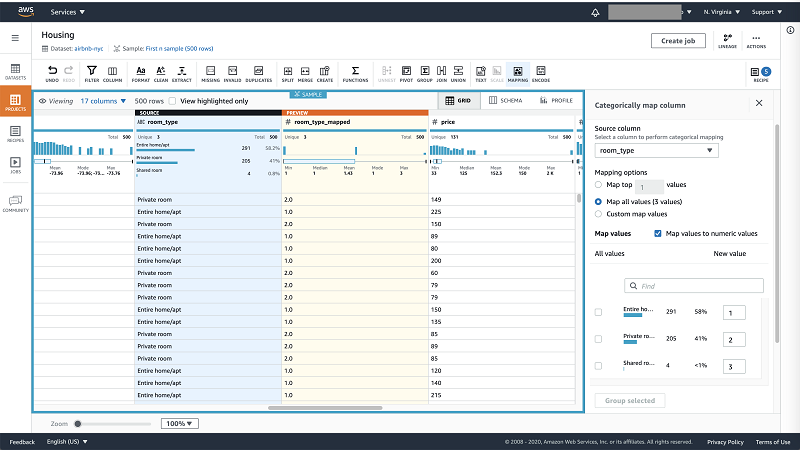
Ordinal categorical values are ordered or hierarchical like Education level or T-shirt sizes e.g: Large is greater than Small so small can be labeled as 1 and large as 2 in numerical format. Easiest way to handle such variables is by using Categorical mapping in DataBrew. It can be accessed from the toolbar under Mapping.
For the example dataset of New York City Airbnb Open Data the “room_type” has values that are ordered. On the Categorical mapping form, you can choose to “Map all values” under mapping options. You can then select the checkbox “Map values to numeric values” or custom enter the values as required. Apply and you have new column with numerical values mapped to the original column.
One-Hot Encoding
For all non-ordinal categorical values like gender or product category, One-hot encoding is the most common way to convert them to numerical format. It can be accessed in a DataBrew project in the toolbar under Encoding.
For the column “neighborhood_group” in the New York City Airbnb Open Data, all you have to do is open the one-hot encoding form and click apply. All the required columns with the encoded numerical values are generated instantly. This would usually take a Data Scientist hours to perform manually.

#7 Handling Numerical values
Columns with numerical values are often not streamlined enough to be processed by an ML algorithm. A dataset may have columns with numerical values that are on very different scales for e.g: capacity would have a range of values from 0 to 100 but price could have a range of 10 to 10000. For such instances the columns would need to be rescaled to a common scale like 0 to 1. Along with scaling issues, we may also have data with outliers that need to be handled, hence scaling, normalizing and standardizing are some common transformations performed on numerical values on datasets used for ML models.
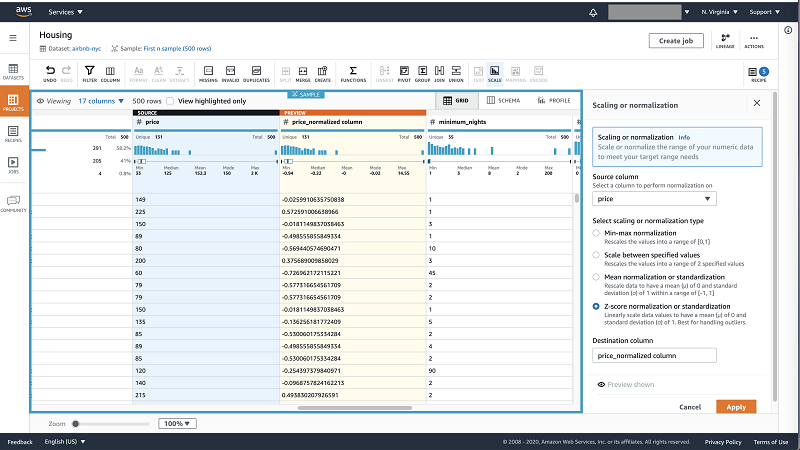
You can handle a column with numerical values like “Price” in New York City Airbnb Open Data using any of the transformations under Scale in the toolbar.
DataBrew provides you multiple techniques to rescale you data like Min-max normalization, Scaling between specified values, Mean normalization or standardization, and Z-score normalization or standardization. In this use case, as price has an outlier you can select Z-score normalization or standardization to best scale the values for your ML model.
These are some of the most frequently used Data preparation transformations demonstrated in AWS Glue DataBrew. With more than 250 built-in transformation, you can find one that meets your data preparation use case and reduce the time and effort that goes into cleaning data.
Jump in and try out AWS Glue DataBrew today.
Datasets used in this blog:
Consumer complaints : https://www.consumerfinance.gov/data-research/consumer-complaints/
NYC Parking tickets : https://www.kaggle.com/new-york-city/nyc-parking-tickets
UN General Assembly Votes – Resolutions: Sample dataset available in AWS Glue DataBrew
UN General Assembly Votes – States: Sample dataset available in AWS Glue DataBrew
Netflix Movies and TV Shows : https://www.kaggle.com/shivamb/netflix-shows
New York City Airbnb Open Data – https://www.kaggle.com/dgomonov/new-york-city-airbnb-open-data
About the Authors
 Shilpa Mohan is a Sr. UX designer at AWS and leads the design of AWS Glue DataBrew. With over 13 years of experience across multiple enterprise domains, she is currently crafting products for Database, Analytics and AI services for AWS. Shilpa is a passionate creator, she spends her time creating anything from content, photographs to crafts
 Romi Boimer is a Sr. Software Development Engineer at AWS and a technical lead for AWS Glue DataBrew. She designs and builds solutions that enable customers to efficiently prepare and manage their data. Romi has a passion for aerial arts, in her spare time she enjoys fighting gravity and hanging from fabric.