Post Syndicated from Suneel Joshi original https://aws.amazon.com/blogs/devops/define-application-boundary-using-aws-resources-tags-in-amazon-devops-guru/
Amazon DevOps Guru is an ML powered service that makes it easy to improve an application’s operational performance and availability. By analyzing application metrics, logs, events and traces, DevOps Guru identifies behaviors that deviate from normal operating patterns and creates insights that you can use to improve your application.
At re:Invent 2021, we announced a new tagging feature in DevOps Guru. This feature allows you to organize resources into logical applications, using AWS resources tags so that you can have more control over how applications are defined. Well-defined applications enable DevOps Guru to group related anomalies together to better identify problems and to provide more meaningful recommendations. A tag is a label consisting of a user-defined key and a value. Previously, the coverage boundary consisted of an entire AWS account or specific resources defined by AWS CloudFormation stacks.
Getting Started
Define Resources to analyze using AWS resources tags
An AWS resource tag is a label that consists of a key and a value. A key-value pair can create useful grouping of resources into different applications. For DevOps Guru, you specify one tag key across all your applications. Resources with the same tag value are grouped together into a logical application. The tag key needs to be prefixed with the string “devops-guru-”. Note that the prefix string is not case sensitive. The tag value can be any value you define. The next section describes how you can use tag values to define coverage boundary for your applications.
You can add tags to your resources using the AWS service to which each resource belongs, or use the Tag Editor. To manage tags using your resource’s service, you can use the console, AWS CLI or SDK of the service.
Define Application boundary using AWS resources tag values
For DevOps Guru, we define an application as a group of instantiated AWS resources (Amazon EC2, AWS Lambda, Amazon RDS, etc.) that your workload is running on. You assign the same tag value to all resources that make up your application. DevOps Guru will analyze each resource separately, and will also look at metrics and events across all resources in your application to detect anomalies and generate insights. For example, see the diagram below.
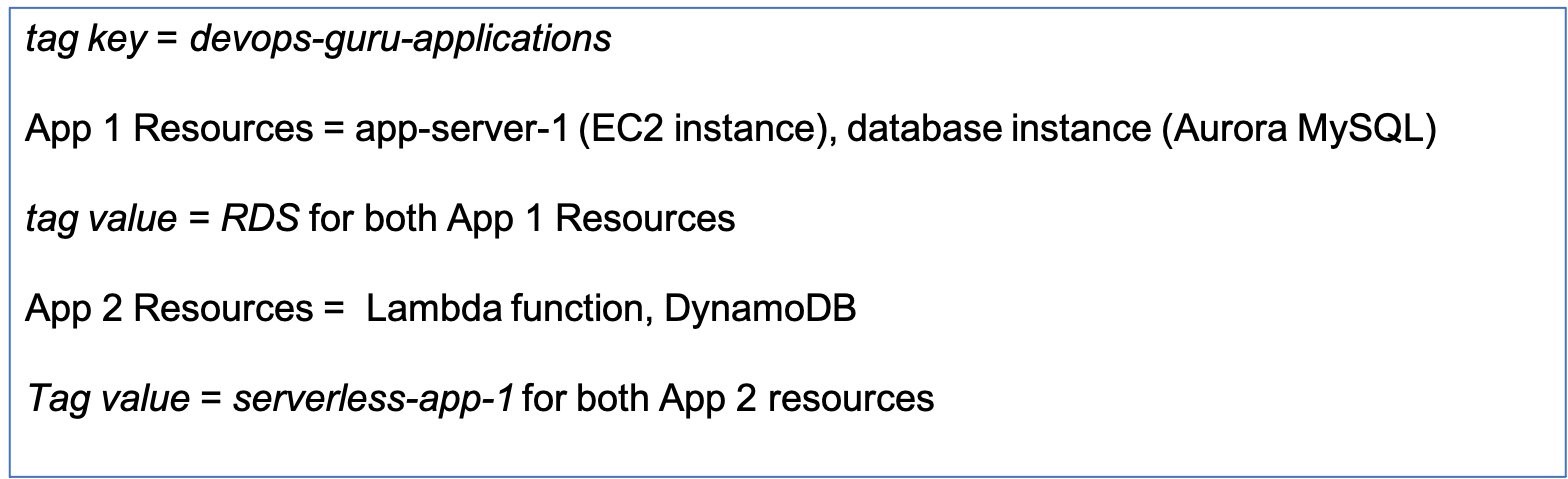
App 1 consists of 2 different resources for a database application – an EC2 instance and a database instance. Assigning the same tag value of RDS to both of the resources. I have another serverless application in App 2, which has a Lambda function and a DynamoDB instance. I assign a different tag value of serverless-app-1 to both of the App 2 resources.
Example Test Scenario
I am going to create a test scenario with an application server running in an EC2 instance. The application server is connected to an Aurora MySQL-Compatible database instance. I will instrument my application to introduce a misbehaving SQL query to create a performance anomaly.
In my example below, I tagged my EC2 instance and database instance with the tag value of RDS. I am interested in detecting performance issues in my Database instance and I want DevOps Guru to provide recommendations to fix those issues.
Manage DevOpsGuru Analysis Coverage
Next, I define the coverage boundary in DevOps Guru Console. In the Settings options in navigation pane, I select Analyzed resources and choose Edit.
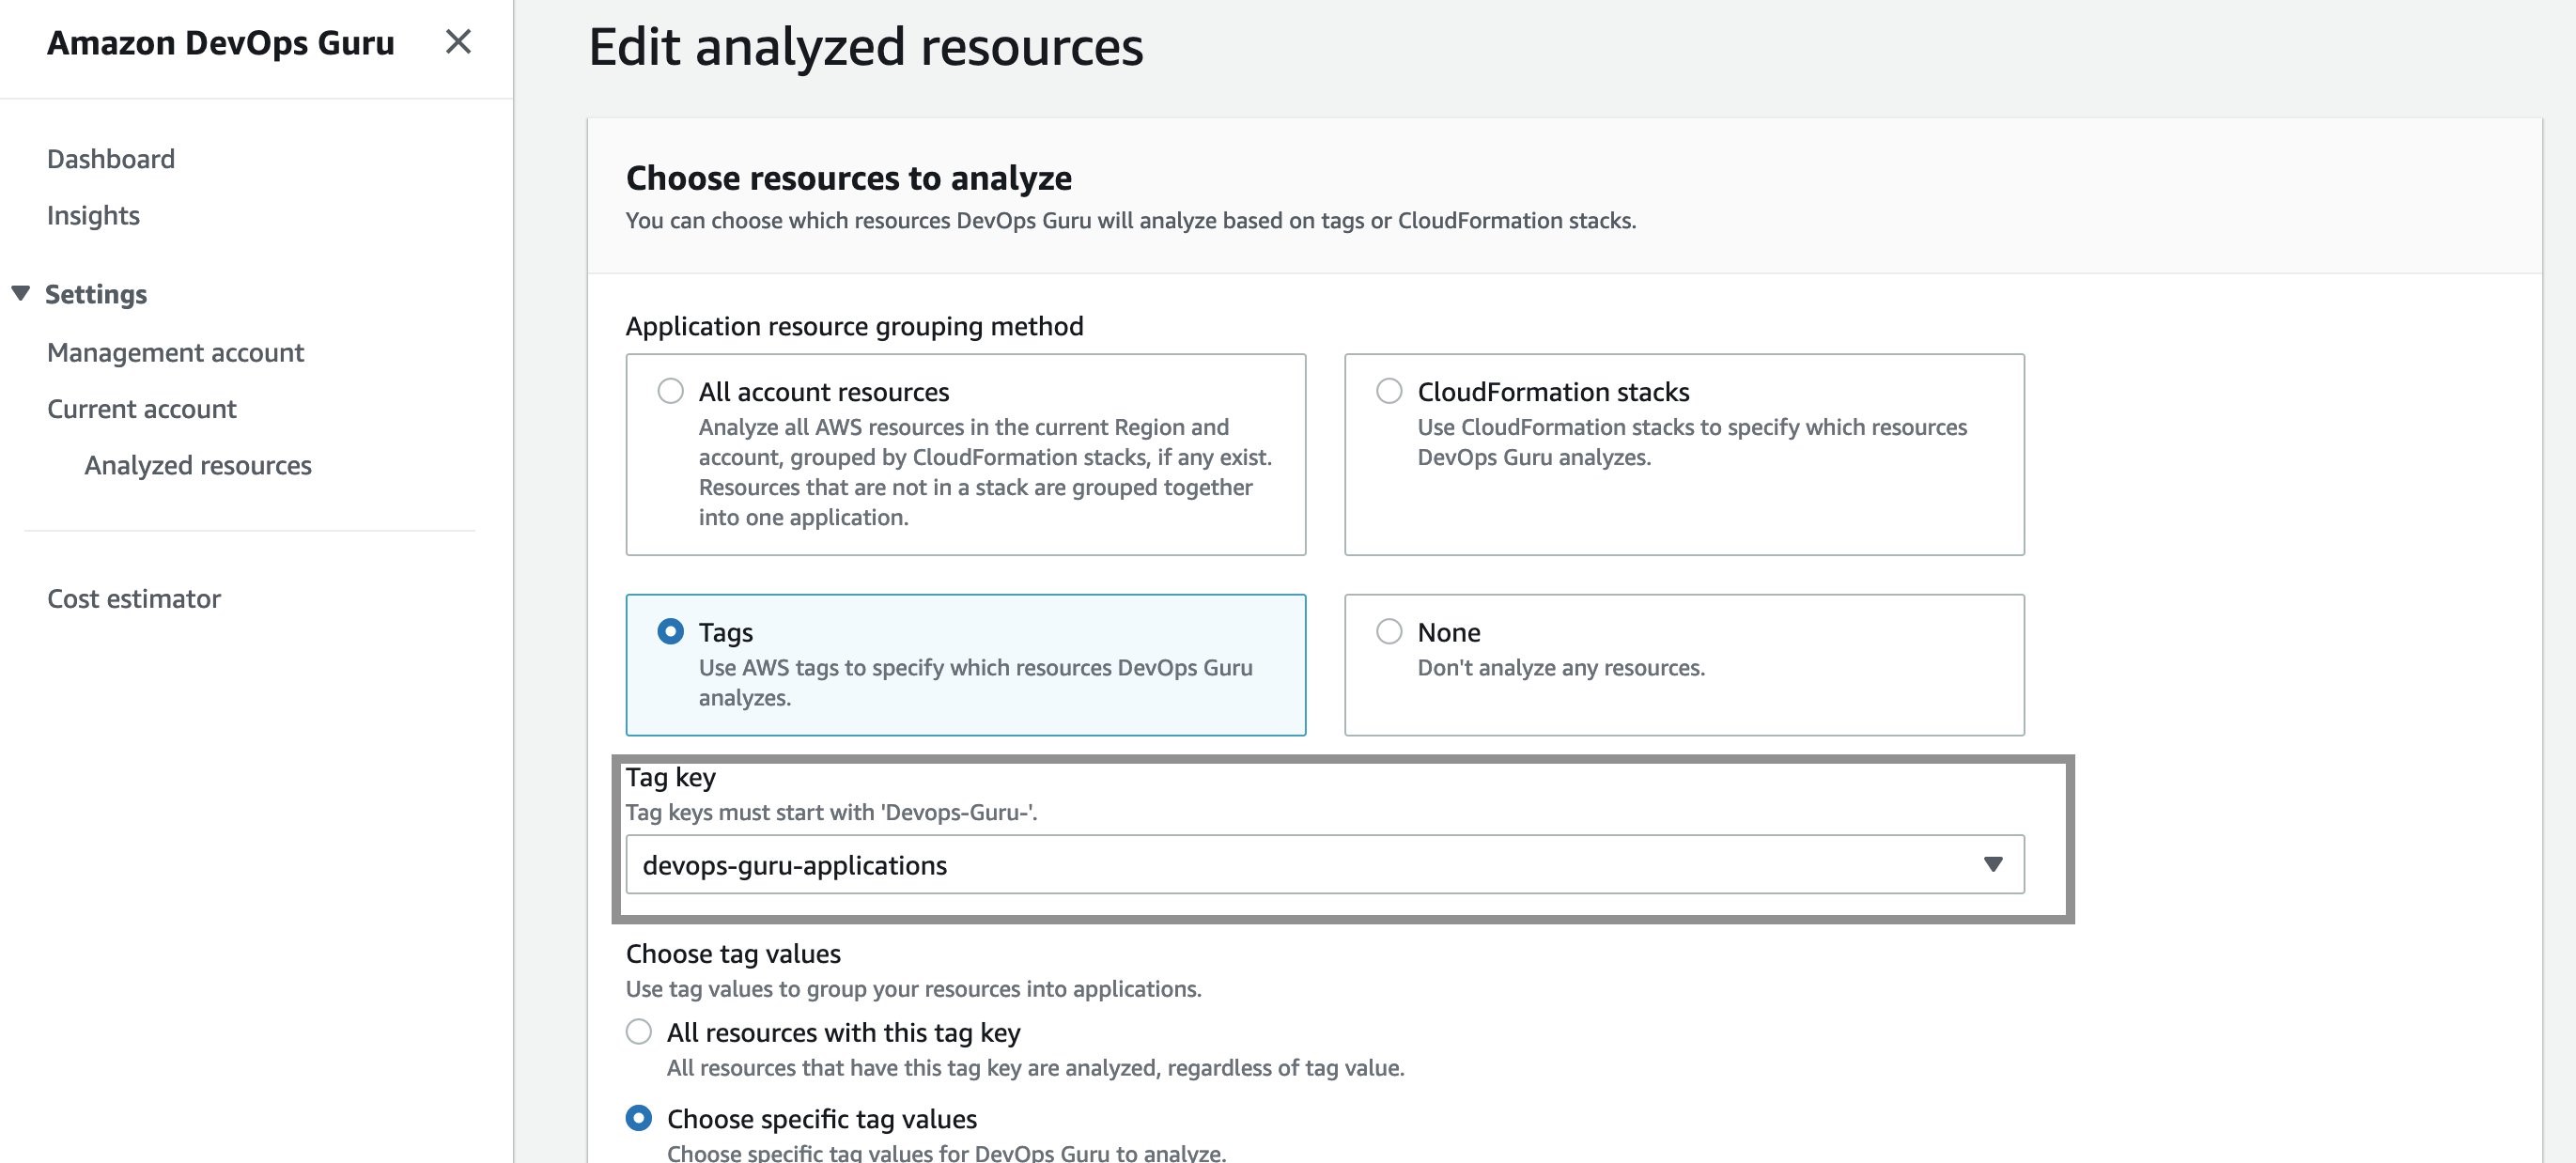
Next, I select the “devops-guru-applications” as tag key from the dropdown menu. I am going to select RDS as the tag value, since I am interested in looking at performance issues in my Amazon Aurora database instance.

Filter insights by tags
Next, I created my test scenario. Once DevOps Guru generated an insight, I am able to filter the insights by tag key or tag values. To display insights for my database instance, I select “Affected applications” from the search menu bar on insights page as shown below:
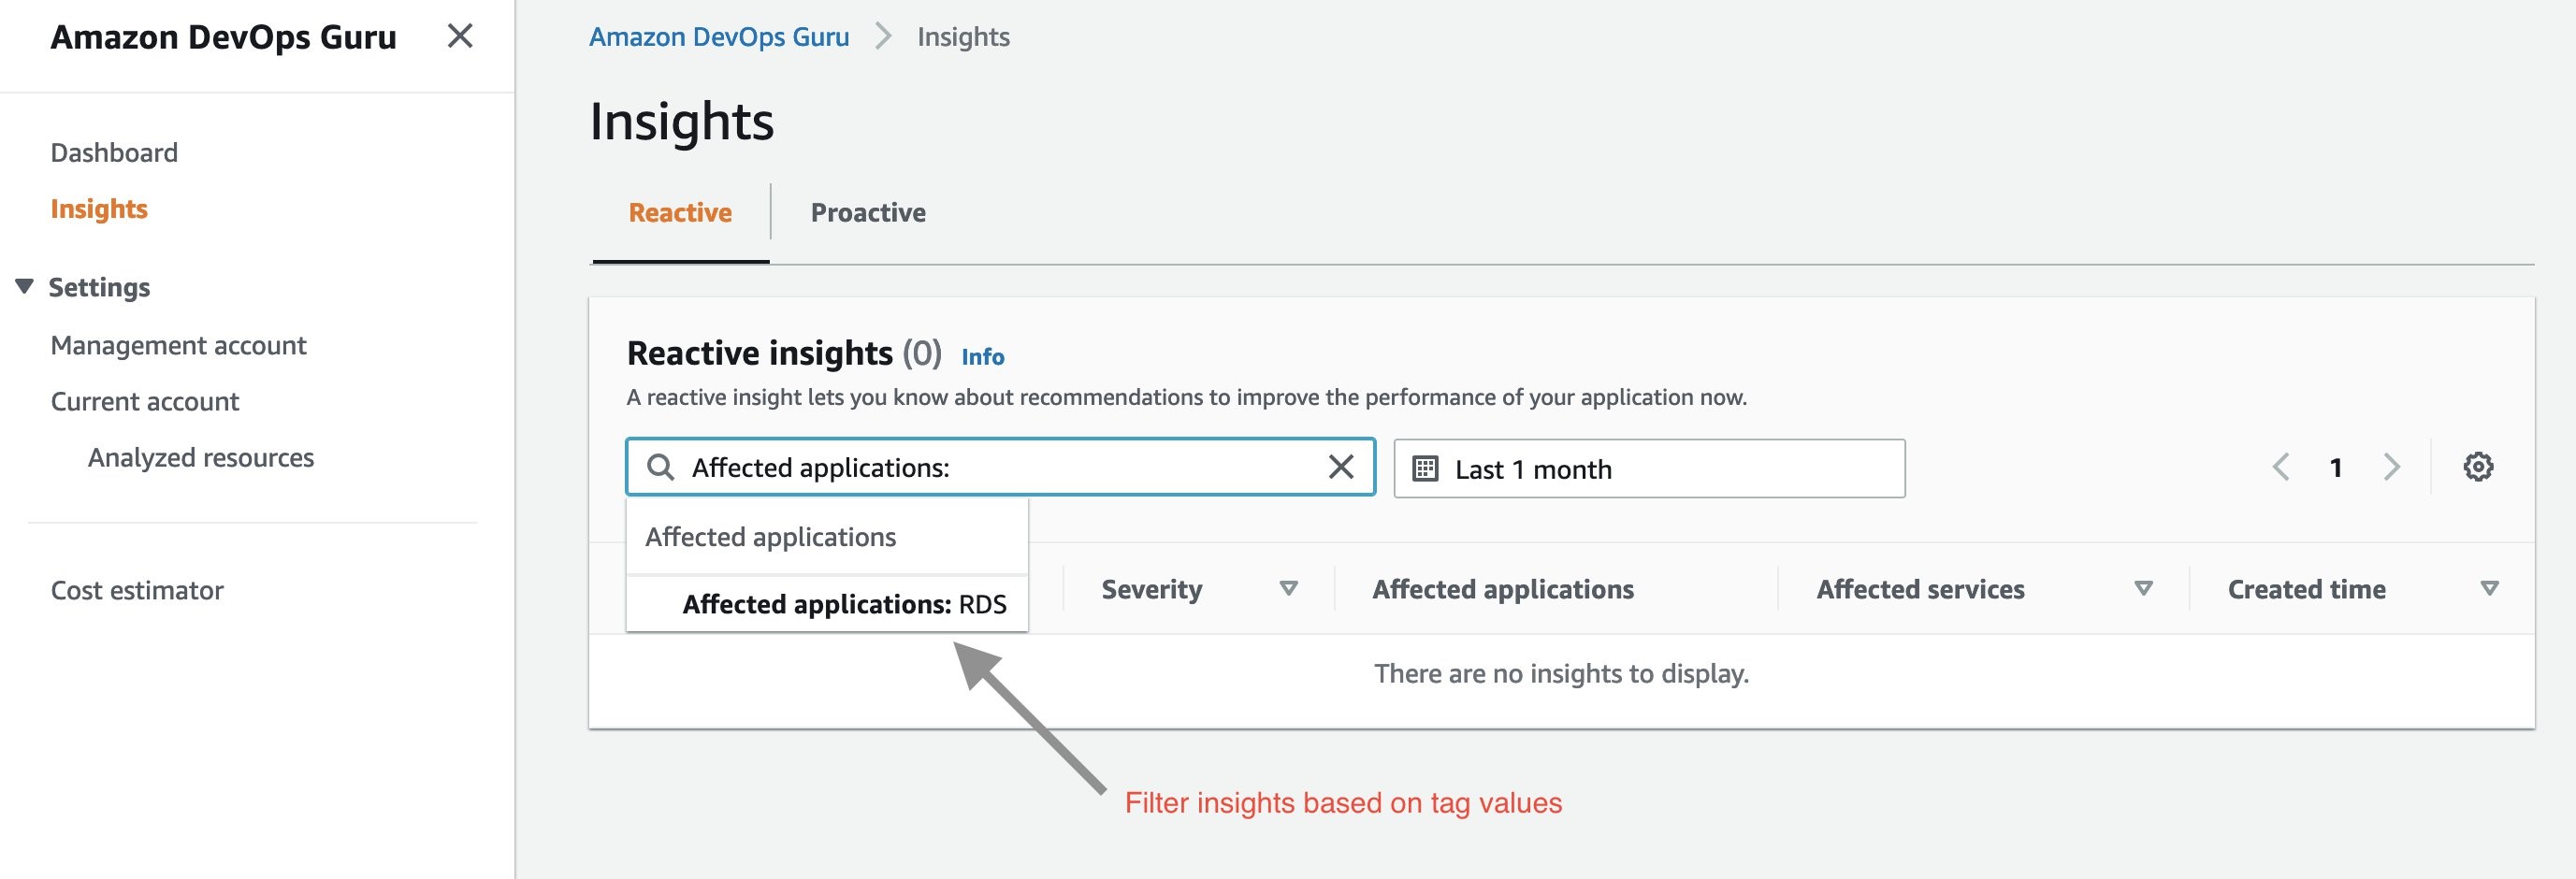
Next, I select “Affected applications” as RDS in the above dropdown menu. Below is the Insight overview screen that gets displayed.

The insights generated by DevOps Guru for my Amazon Aurora instances are enabled by Amazon DevOps Guru for RDS, a new feature we announced at re:Invent 2021. It allows developers to easily detect, diagnose, and resolve performance and operational issues in Amazon Aurora. For more information on Amazon DevOps Guru for RDS, see a related news blog written by my colleague, Marcia Villalba.
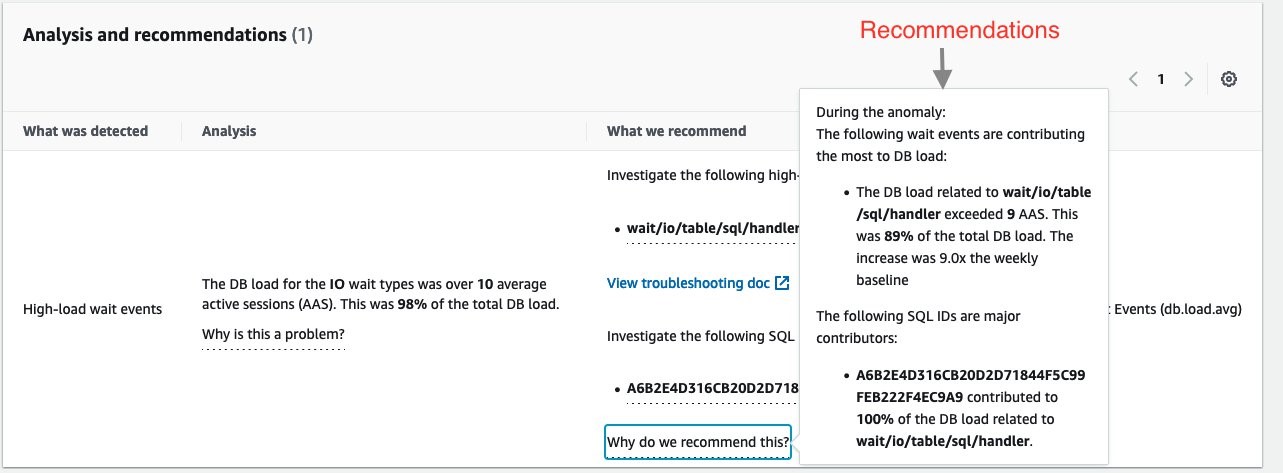
The insight summary indicates that there is high DB load, ten times above baseline. DevOps Guru for RDS uses anomaly detection on the database load (DB load) performance metric to detect issues. DB load is measured in units of Average Active Sessions (AAS). DB load measures the level of activity in your database, making it a great metric to understand the health of your database.
If you continue scrolling on the DevOps Guru for RDS analysis page, you can discover the cause for the problem and some recommendations to fix it. DevOps Guru for RDS detected there was a high load of wait events, and one SQL query was found to require further investigation. You can even see the exact SQL query if you click on the SQL digest IDs. The insight’s analysis and recommendation section is full of information on how to investigate further and fix the issue.
The easy-to-understand recommendations made by DevOps Guru for RDS means that as a DevOps engineer, you do not need to rely on a database administrator (DBA) or use any third party tools.
Conclusion
AWS resources tags give you one more way to specify the resource analysis coverage boundary, in addition to existing methods of an entire AWS account or specific AWS CloudFormation stacks. AWS tags allows you to better isolate the applications you want DevOps Guru to analyze. In this post, we used AWS tags to define the coverage boundary for a database application. We reduced unrelated and unnecessary resource coverage from our analysis, thereby controlling our resource analysis costs. Visit the DevOps Guru documentation to learn more about how to use tags to identify resources in your DevOps Guru applications.