Post Syndicated from Raks Khare original https://aws.amazon.com/blogs/big-data/achieve-near-real-time-operational-analytics-using-amazon-aurora-postgresql-zero-etl-integration-with-amazon-redshift/
“Data is at the center of every application, process, and business decision. When data is used to improve customer experiences and drive innovation, it can lead to business growth,”
– Swami Sivasubramanian, VP of Database, Analytics, and Machine Learning at AWS in With a zero-ETL approach, AWS is helping builders realize near-real-time analytics.
Customers across industries are becoming more data driven and looking to increase revenue, reduce cost, and optimize their business operations by implementing near real time analytics on transactional data, thereby enhancing agility. Based on customer needs and their feedback, AWS is investing and steadily progressing towards bringing our zero-ETL vision to life so that builders can focus more on creating value from data, instead of preparing data for analysis.
Our zero-ETL integration with Amazon Redshift facilitates point-to-point data movement to get it ready for analytics, artificial intelligence (AI) and machine learning (ML) using Amazon Redshift on petabytes of data. Within seconds of transactional data being written into supported AWS databases, zero-ETL seamlessly makes the data available in Amazon Redshift, removing the need to build and maintain complex data pipelines that perform extract, transform, and load (ETL) operations.
To help you focus on creating value from data instead of investing undifferentiated time and resources in building and managing ETL pipelines between transactional databases and data warehouses, we announced four AWS database zero-ETL integrations with Amazon Redshift at AWS re:Invent 2023:
In this post, we provide step-by-step guidance on how to get started with near real time operational analytics using the Amazon Aurora PostgreSQL zero-ETL integration with Amazon Redshift.
Solution overview
To create a zero-ETL integration, you specify an Amazon Aurora PostgreSQL-Compatible Edition cluster (compatible with PostgreSQL 15.4 and zero-ETL support) as the source, and a Redshift data warehouse as the target. The integration replicates data from the source database into the target data warehouse.
You must create Aurora PostgreSQL DB provisioned clusters within the Amazon RDS Database Preview Environment and a Redshift provisioned preview cluster or serverless preview workgroup, in the US East (Ohio) AWS Region. For Amazon Redshift, make sure that you choose the preview_2023 track in order to use zero-ETL integrations.
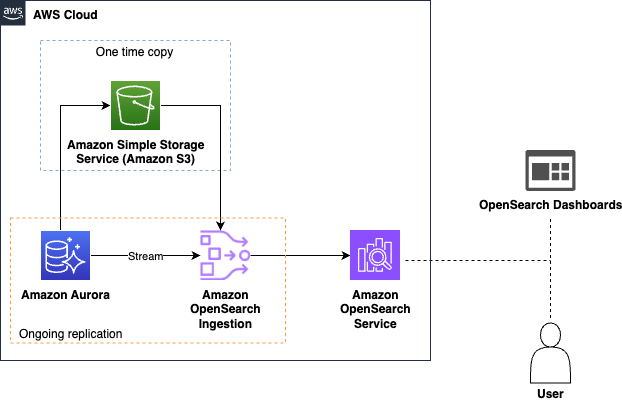
The following diagram illustrates the architecture implemented in this post.
The following are the steps needed to set up the zero-ETL integration for this solution. For complete getting started guides, refer to Working with Aurora zero-ETL integrations with Amazon Redshift and Working with zero-ETL integrations.

After Step1, you can also skip Steps 2–4 and directly start creating your zero-ETL integration from Step 5, in which case Amazon RDS will show a message about missing configurations and you can choose Fix it for me to let Amazon RDS automatically configure the steps.
- Configure the Aurora PostgreSQL source with a customized DB cluster parameter group.
- Configure the Amazon Redshift Serverless destination with the required resource policy for its namespace.
- Update the Redshift Serverless workgroup to enable case-sensitive identifiers.
- Configure the required permissions.
- Create the zero-ETL integration.
- Create a database from the integration in Amazon Redshift.
- Start analyzing the near real time transactional data.
Configure the Aurora PostgreSQL source with a customized DB cluster parameter group
For Aurora PostgreSQL DB clusters, you must create the custom parameter group within the Amazon RDS Database Preview Environment, in the US East (Ohio) Region. You can directly access the Amazon RDS Preview Environment.
To create an Aurora PostgreSQL database, complete the following steps:
- On the Amazon RDS console, choose Parameter groups in the navigation pane.
- Choose Create parameter group.
- For Parameter group family, choose
aurora-postgresql15.
- For Type, choose
DB Cluster Parameter Group.
- For Group name, enter a name (for example,
zero-etl-custom-pg-postgres).
- Choose Create.

Aurora PostgreSQL zero-ETL integrations with Amazon Redshift require specific values for the Aurora DB cluster parameters, which requires enhanced logical replication (aurora.enhanced_logical_replication).
- On the Parameter groups page, select the newly created parameter group.
- On the Actions menu, choose Edit.
- Set the following Aurora PostgreSQL (aurora-postgresql15 family) cluster parameter settings:
rds.logical_replication=1aurora.enhanced_logical_replication=1aurora.logical_replication_backup=0aurora.logical_replication_globaldb=0
Enabling enhanced logical replication (aurora.enhanced_logical_replication) automatically sets the REPLICA IDENTITY parameter to FULL, which means that all column values are written to the write ahead log (WAL).
- Choose Save Changes.

- Choose Databases in the navigation pane, then choose Create database.

- For Engine type, select Amazon Aurora.
- For Edition, select Amazon Aurora PostgreSQL-Compatible Edition.
- For Available versions, choose Aurora PostgreSQL (compatible with PostgreSQL 15.4 and Zero-ETL Support).

- For Templates, select Production.
- For DB cluster identifier, enter
zero-etl-source-pg.
- Under Credentials Settings, enter a password for Master password or use the option to automatically generate a password for you.
- In the Instance configuration section, select Memory optimized classes.
- Choose a suitable instance size (the default is
db.r5.2xlarge).
- Under Additional configuration, for DB cluster parameter group, choose the parameter group you created earlier (
zero-etl-custom-pg-postgres).
- Leave the default settings for the remaining configurations.
- Choose Create database.
In a few minutes, this should spin up an Aurora PostgreSQL cluster, with one writer and one reader instance, with the status changing from Creating to Available. The newly created Aurora PostgreSQL cluster will be the source for the zero-ETL integration.

The next step is to create a named database in Amazon Aurora PostgreSQL for the zero-ETL integration.
The PostgreSQL resource model allows you to create multiple databases within a cluster. Therefore, during the zero-ETL integration creation step, you need to specify which database you want to use as the source for your integration.
When setting up PostgreSQL, you get three standard databases out of the box: template0, template1, and postgres. Whenever you create a new database in PostgreSQL, you are actually basing it off one of these three databases in your cluster. The database created during Aurora PostgreSQL cluster creation is based on template0. The CREATE DATABASE command works by copying an existing database, and if not explicitly specified, by default, it copies the standard system database template1. For the named database for zero-ETL integration, the database is required to be created using template1 and not template0. Therefore, if an initial database name is added under Additional configuration, that would be created using template0 and cannot be used for zero-ETL integration.
- To create a new named database using
CREATE DATABASE within the new Aurora PostgreSQL cluster zero-etl-source-pg, first get the endpoint of the writer instance of the PostgreSQL cluster.
- From a terminal or using AWS CloudShell, SSH into the PostgreSQL cluster and run the following commands to install psql and create a new database
zeroetl_db:
sudo dnf install postgresql15
psql –version
psql -h <RDS Write Instance Endpoint> -p 5432 -U postgres
create database zeroetl_db template template1;
Adding template template1 is optional, because by default, if not mentioned, CREATE DATABASE will use template1.
You can also connect via a client and create the database. Refer to Connect to an Aurora PostgreSQL DB cluster for the options to connect to the PostgreSQL cluster.
Configure Redshift Serverless as destination
After you create your Aurora PostgreSQL source database cluster, you configure a Redshift target data warehouse. The data warehouse must comply with the following requirements:
- Created in preview (for Aurora PostgreSQL sources only)
- Uses an RA3 node type (ra3.16xlarge, ra3.4xlarge, or ra3.xlplus) with at least two nodes, or Redshift Serverless
- Encrypted (if using a provisioned cluster)
For this post, we create and configure a Redshift Serverless workgroup and namespace as the target data warehouse, following these steps:
- On the Amazon Redshift console, choose Serverless dashboard in the navigation pane.
Because the zero-ETL integration for Amazon Aurora PostgreSQL to Amazon Redshift has been launched in preview (not for production purposes), you need to create the target data warehouse in a preview environment.
- Choose Create preview workgroup.

The first step is to configure the Redshift Serverless workgroup.
- For Workgroup name, enter a name (for example,
zero-etl-target-rs-wg).
- Additionally, you can choose the capacity, to limit the compute resources of the data warehouse. The capacity can be configured in increments of 8, from 8–512 RPUs. For this post, set this to
8 RPUs.
- Choose Next.

Next, you need to configure the namespace of the data warehouse.
- Select Create a new namespace.
- For Namespace, enter a name (for example,
zero-etl-target-rs-ns).
- Choose Next.

- Choose Create workgroup.
- After the workgroup and namespace are created, choose Namespace configurations in the navigation pane and open the namespace configuration.
- On the Resource policy tab, choose Add authorized principals.
An authorized principal identifies the user or role that can create zero-ETL integrations into the data warehouse.

- For IAM principal ARN or AWS account ID, you can enter either the ARN of the AWS user or role, or the ID of the AWS account that you want to grant access to create zero-ETL integrations. (An account ID is stored as an ARN.)
- Choose Save changes.

After the Authorized principal is configured, you need to allow the source database to update your Redshift data warehouse. Therefore, you must add the source database as an authorized integration source to the namespace.
- Choose Add authorized integration source.

- For Authorized source ARN, enter the ARN of the Aurora PostgreSQL cluster, because it’s the source of the zero-ETL integration.
You can obtain the ARN of the Aurora PostgreSQL cluster on the Amazon RDS console, the Configuration tab under Amazon Resource Name.
- Choose Save changes.

Update the Redshift Serverless workgroup to enable case-sensitive identifiers
Amazon Aurora PostgreSQL is case sensitive by default, and case sensitivity is disabled on all provisioned clusters and Redshift Serverless workgroups. For the integration to be successful, the case sensitivity parameter enable_case_sensitive_identifier must be enabled for the data warehouse.
In order to modify the enable_case_sensitive_identifier parameter in a Redshift Serverless workgroup, you need to use the AWS Command Line Interface (AWS CLI), because the Amazon Redshift console doesn’t currently support modifying Redshift Serverless parameter values. Run the following command to update the parameter:
aws redshift-serverless update-workgroup --workgroup-name zero-etl-target-rs-wg --config-parameters parameterKey=enable_case_sensitive_identifier,parameterValue=true --region us-east-2
A simple way to connect to the AWS CLI is to use CloudShell, which is a browser-based shell that provides command line access to the AWS resources and tools directly from a browser. The following screenshot illustrates how to run the command in the CloudShell.

Configure required permissions
To create a zero-ETL integration, your user or role must have an attached identity-based policy with the appropriate AWS Identity and Access Management (IAM) permissions. An AWS account owner can configure required permissions for user or roles who may create zero-ETL integrations. The sample policy allows the associated principal to perform following actions:
- Create zero-ETL integrations for the source Aurora DB cluster.
- View and delete all zero-ETL integrations.
- Create inbound integrations into the target data warehouse. Amazon Redshift has a different ARN format for provisioned and serverless:
- Provisioned cluster –
arn:aws:redshift:{region}:{account-id}:namespace:namespace-uuid
- Serverless –
arn:aws:redshift-serverless:{region}:{account-id}:namespace/namespace-uuid
This permission is not required if the same account owns the Redshift data warehouse and this account is an authorized principal for that data warehouse.
Complete the following steps to configure the permissions:
- On the IAM console, choose Policies in the navigation pane.
- Choose Create policy.
- Create a new policy called rds-integrations using the following JSON. For the Amazon Aurora PostgreSQL preview, all ARNs and actions within the Amazon RDS Database Preview Environment have -preview appended to the service namespace. Therefore, in the following policy, instead of rds, you need to use
rds-preview. For example, rds-preview:CreateIntegration.
{
    "Version": "2012-10-17",
    "Statement": [{
        "Effect": "Allow",
        "Action": [
            "rds:CreateIntegration"
        ],
        "Resource": [
            "arn:aws:rds:{region}:{account-id}:cluster:source-cluster",
            "arn:aws:rds:{region}:{account-id}:integration:*"
        ]
    },
    {
        "Effect": "Allow",
        "Action": [
            "rds:DescribeIntegration"
        ],
        "Resource": ["*"]
    },
    {
        "Effect": "Allow",
        "Action": [
            "rds:DeleteIntegration"
        ],
        "Resource": [
            "arn:aws:rds:{region}:{account-id}:integration:*"
        ]
    },
    {
        "Effect": "Allow",
        "Action": [
            "redshift:CreateInboundIntegration"
        ],
        "Resource": [
            "arn:aws:redshift:{region}:{account-id}:cluster:namespace-uuid"
        ]
    }]
}
- Attach the policy you created to your IAM user or role permissions.
Create the zero-ETL integration
To create the zero-ETL integration, complete the following steps:
- On the Amazon RDS console, choose Zero-ETL integrations in the navigation pane.
- Choose Create zero-ETL integration.

- For Integration identifier, enter a name, for example
zero-etl-demo.
- Choose Next.

- For Source database, choose Browse RDS databases.

- Select the source database
zero-etl-source-pg and choose Choose.
- For Named database, enter the name of the new database created in the Amazon Aurora PostgreSQL (
zeroetl-db).
- Choose Next.

- In the Target section, for AWS account, select Use the current account.
- For Amazon Redshift data warehouse, choose Browse Redshift data warehouses.

We discuss the Specify a different account option later in this section.
- Select the Redshift Serverless destination namespace (
zero-etl-target-rs-ns), and choose Choose.
- Add tags and encryption, if applicable, and choose Next.

- Verify the integration name, source, target, and other settings, and choose Create zero-ETL integration.
You can choose the integration on the Amazon RDS console to view the details and monitor its progress. It takes about 30 minutes to change the status from Creating to Active, depending on size of the dataset already available in the source.


To specify a target Redshift data warehouse that’s in another AWS account, you must create a role that allows users in the current account to access resources in the target account. For more information, refer to Providing access to an IAM user in another AWS account that you own.
Create a role in the target account with the following permissions:
{
   "Version":"2012-10-17",
   "Statement":[
      {
         "Effect":"Allow",
         "Action":[
            "redshift:DescribeClusters",
            "redshift-serverless:ListNamespaces"
         ],
         "Resource":[
            "*"
         ]
      }
   ]
}
The role must have the following trust policy, which specifies the target account ID. You can do this by creating a role with a trusted entity as an AWS account ID in another account.
{
   "Version":"2012-10-17",
   "Statement":[
      {
         "Effect":"Allow",
         "Principal":{
            "AWS": "arn:aws:iam::{external-account-id}:root"
         },
         "Action":"sts:AssumeRole"
      }
   ]
}
The following screenshot illustrates creating this on the IAM console.

Then, while creating the zero-ETL integration, for Specify a different account, choose the destination account ID and the name of the role you created.
Create a database from the integration in Amazon Redshift
To create your database, complete the following steps:
- On the Redshift Serverless dashboard, navigate to the
zero-etl-target-rs-ns namespace.
- Choose Query data to open the query editor v2.

- Connect to the Redshift Serverless data warehouse by choosing Create connection.

- Obtain the
integration_id from the svv_integration system table:
SELECT integration_id FROM svv_integration; -- copy this result, use in the next sql
- Use the
integration_id from the previous step to create a new database from the integration. You must also include a reference to the named database within the cluster that you specified when you created the integration.
CREATE DATABASE aurora_pg_zetl FROM INTEGRATION '<result from above>' DATABASE zeroetl_db;

The integration is now complete, and an entire snapshot of the source will reflect as is in the destination. Ongoing changes will be synced in near real time.
Analyze the near real time transactional data
Now you can start analyzing the near real time data from the Amazon Aurora PostgreSQL source to the Amazon Redshift target:
- Connect to your source Aurora PostgreSQL database. In this demo, we use psql to connect to Amazon Aurora PostgreSQL:
psql -h <amazon_aurora_postgres_writer_endpoint> -p 5432 -d zeroetl_db -U postgres

- Create a sample table with a primary key. Make sure that all tables to be replicated from source to target have a primary key. Tables without a primary key can’t be replicated to the target.
CREATE TABLE NATION  (
N_NATIONKEY  INTEGER NOT NULL PRIMARY KEY,
N_NAME       CHAR(25) NOT NULL,
N_REGIONKEY  INTEGER NOT NULL,
N_COMMENT    VARCHAR(152));
- Insert dummy data into the nation table and verify if the data is properly loaded:
INSERT INTO nation VALUES (1, 'USA', 1 , 'united states of america');
SELECT * FROM nation;

This sample data should now be replicated in Amazon Redshift.
Analyze the source data in the destination
On the Redshift Serverless dashboard, open query editor v2 and connect to the database aurora_pg_zetl you created earlier.
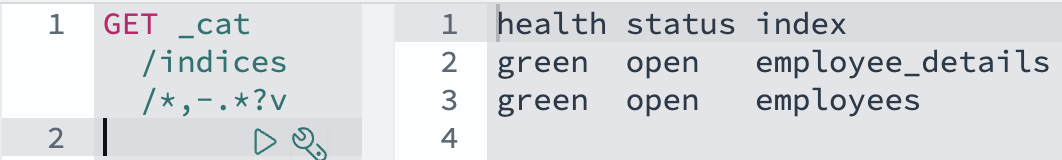
Run the following query to validate the successful replication of the source data into Amazon Redshift:
SELECT * FROM aurora_pg_etl.public.nation;

You can also use the following query to validate the initial snapshot or ongoing change data capture (CDC) activity:
SELECT * FROM sys_integration_activity ORDER BY last_commit_timestamp desc;

Monitoring
There are several options to obtain metrics on the performance and status of the Aurora PostgreSQL zero-ETL integration with Amazon Redshift.
If you navigate to the Amazon Redshift console, you can choose Zero-ETL integrations in the navigation pane. You can choose the zero-ETL integration you want and display Amazon CloudWatch metrics related to the integration. These metrics are also directly available in CloudWatch.

For each integration, there are two tabs with information available:
- Integration metrics – Shows metrics such as the number of tables successfully replicated and lag details

- Table statistics – Shows details about each table replicated from Amazon Aurora PostgreSQL to Amazon Redshift

In addition to the CloudWatch metrics, you can query the following system views, which provide information about the integrations:
Clean up
When you delete a zero-ETL integration, your transactional data isn’t deleted from Aurora or Amazon Redshift, but Aurora doesn’t send new data to Amazon Redshift.
To delete a zero-ETL integration, complete the following steps:
- On the Amazon RDS console, choose Zero-ETL integrations in the navigation pane.
- Select the zero-ETL integration that you want to delete and choose Delete.

- To confirm the deletion, enter confirm and choose Delete.

Conclusion
In this post, we explained how you can set up the zero-ETL integration from Amazon Aurora PostgreSQL to Amazon Redshift, a feature that reduces the effort of maintaining data pipelines and enables near real time analytics on transactional and operational data.
To learn more about zero-ETL integration, refer to Working with Aurora zero-ETL integrations with Amazon Redshift and Limitations.
About the Authors
 Raks Khare is an Analytics Specialist Solutions Architect at AWS based out of Pennsylvania. He helps customers architect data analytics solutions at scale on the AWS platform.
 Juan Luis Polo Garzon is an Associate Specialist Solutions Architect at AWS, specialized in analytics workloads. He has experience helping customers design, build and modernize their cloud-based analytics solutions. Outside of work, he enjoys travelling, outdoors and hiking, and attending to live music events.
 Sushmita Barthakur is a Senior Solutions Architect at Amazon Web Services, supporting Enterprise customers architect their workloads on AWS. With a strong background in Data Analytics and Data Management, she has extensive experience helping customers architect and build Business Intelligence and Analytics Solutions, both on-premises and the cloud. Sushmita is based out of Tampa, FL and enjoys traveling, reading and playing tennis.


 Michael Torio is an Associate Specialist Solutions Architect at AWS focused on Amazon OpenSearch Service based out of Mountain View, CA. Michael enjoys helping customers leverage cloud technologies to solve their business challenges.
 Arjun Nambiar is a Product Manager with Amazon OpenSearch Service. He focuses on ingestion technologies that enable ingesting data from a wide variety of sources into Amazon OpenSearch Service at scale. Arjun is interested in large-scale distributed systems and cloud-centered technologies, and is based out of Seattle, Washington.


 When we introduced the


 Raks Khare is an Analytics Specialist Solutions Architect at AWS based out of Pennsylvania. He helps customers architect data analytics solutions at scale on the AWS platform.
 Juan Luis Polo Garzon is an Associate Specialist Solutions Architect at AWS, specialized in analytics workloads. He has experience helping customers design, build and modernize their cloud-based analytics solutions. Outside of work, he enjoys travelling, outdoors and hiking, and attending to live music events.
 Sushmita Barthakur is a Senior Solutions Architect at Amazon Web Services, supporting Enterprise customers architect their workloads on AWS. With a strong background in Data Analytics and Data Management, she has extensive experience helping customers architect and build Business Intelligence and Analytics Solutions, both on-premises and the cloud. Sushmita is based out of Tampa, FL and enjoys traveling, reading and playing tennis.


 AWS Summits – Join free online and in-person events that bring the cloud computing community together to connect, collaborate, and learn about AWS. Register in your nearest city:


 Jyoti Aggarwal is a Product Management Lead for AWS zero-ETL. She leads the product and business strategy, including driving initiatives around performance, customer experience, and security. She brings along an expertise in cloud compute, data pipelines, analytics, artificial intelligence (AI), and data services including databases, data warehouses and data lakes.
 Sean Beath is an Analytics Solutions Architect at Amazon Web Services. He has experience in the full delivery lifecycle of data platform modernisation using AWS services, and works with customers to help drive analytics value on AWS.
 Gokul Soundararajan is a principal engineer at AWS and received a PhD from University of Toronto and has been working in the areas of storage, databases, and analytics.