Post Syndicated from Tekena Orugbani original https://aws.amazon.com/blogs/security/how-to-monitor-and-track-failed-logins-for-your-aws-managed-microsoft-ad/
AWS Directory Service for Microsoft Active Directory provides customers with the ability to review security logs on their AWS Managed Microsoft AD domain controllers by either using a domain management Amazon Elastic Compute Cloud (Amazon EC2) instance or by forwarding domain controller security event logs to Amazon CloudWatch Logs.
You can further improve visibility by monitoring Windows login activities on your AWS Managed Microsoft AD domain-joined EC2 instances, and in this blog post, I show you how. Monitoring and tracking Windows security events on your AWS Managed Microsoft AD domain-joined instances can reveal unexpected activities on your domain-joined EC2 instances so that you can take proactive remediating action.
For example, every time there is an unsuccessful attempt to log in to a domain-joined EC2 instance or on-premises server by using an AWS Managed Microsoft AD user or a local account, an “Audit Failure” Windows security event with ID 4625 is recorded on the EC2 instance itself. The event data includes details of the account name, workstation name, and source network address. Unsuccessful attempts to log in to non–domain-joined EC2 instances and servers are handled the same way. You can track and monitor these events on an ongoing basis across your fleet of Windows EC2 instances by using the solution described here.
Solution overview
Figure 1 shows the workflow for the solution.
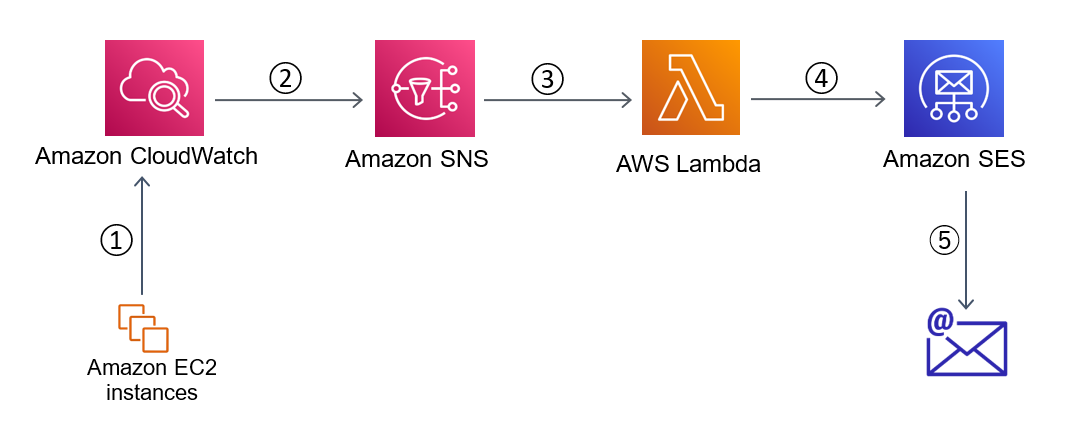
Figure 1: Solution architecture
The workflow steps are as follows:
- An Amazon CloudWatch agent that is running on the EC2 instances sends the Windows security event logs to Amazon CloudWatch.
- CloudWatch filters the logs based on the filter you specify. When the configured threshold is met, CloudWatch posts an alert to an SNS topic.
- Amazon Simple Notification Service (Amazon SNS) invokes an AWS Lambda function.
- The Lambda function scans through the events and determines which EC2 instance(s) generated the security events at a frequency that satisfies the configured threshold. It discards any other instances listed in the events that don’t meet the specified criteria. The function sends an email to the configured email address with a high-level description of the event logs and the instance(s) that generated them.
- Amazon Simple Email Service (Amazon SES) delivers the emails in the specified mailbox.
Note: Although this example uses email notification via Amazon SES to monitor failed logins, there are opportunities to extend the solution. For example, you can integrate with a Security Information and Event Management (SIEM) tool that may potentially be integrated with a ticketing service and/or some automation or incident response process when a set threshold for failed logins is breached.
Prerequisites
Before you deploy the solution, you must complete the following steps:
- Create AWS Identity and Access Management (IAM) roles for use with the CloudWatch agent
- Sign up for Amazon SES
- Verify the sender and recipient email addresses that you’ll use to send and receive email notifications
Deploy the solution
The solution I present here involves four main steps:
- Install and configure the CloudWatch agent for your EC2 instances.
- Create a metric filter in CloudWatch.
- Create a CloudWatch alarm based on the metric filter and add SNS notification.
- Create a Lambda function and subscribe the function to the SNS topic.
Step 1: Install and configure the CloudWatch agent for all your EC2 instances
The first step is to create an AWS Systems Manager parameter to contain the JSON configuration for the CloudWatch agent that runs on the EC2 instances. You’ll then use Systems Manager Run Command to install the CloudWatch agent on the instances and to apply the configuration in the Parameter Store to the CloudWatch agent.
To install and configure the CloudWatch agent
- Open the AWS Systems Manager console and in the navigation pane, choose Parameter Store to create a new Systems Manager parameter.
- Give your parameter a name. In my example, I named my parameter AmazonCloudWatch-Windows.
- For Tier, choose Standard. For Type, choose String. For Data type, choose Text.
- For the value of the parameter, enter the following JSON configuration and choose Create Parameter.
Note: This JSON configuration creates a log group in CloudWatch with the name /aws/SecurityAuditLogs. If you would prefer to use another log group name, you can modify the JSON configuration. Also, if you already have a Systems Manager parameter named AmazonCloudWatch-Windows, you can use any other name of your choice.
The Parameter details page should look similar to the following.

Figure 2: Create the System Manager parameter for the CloudWatch agent
- Next, you’ll use Run Command to install and configure the CloudWatch agent. In the navigation pane, choose Run Command.
- On the Run a command page, in the search box, enter Document name prefix: Equals: AWS-ConfigureAWSPackage. Press Enter and select the document that appears.
- Under Command parameters, for Name, enter AmazonCloudWatchAgent.

Figure 3: Install the CloudWatch agent on the instances
- Under Targets, specify your EC2 instances based on their tags, or choose them manually, and then choose Run.
- To configure the CloudWatch agent, choose Run Command again. On the Run a command screen, enter Document name prefix: Equals: AmazonCloudWatch-ManageAgent. Press Enter and select the document that appears.
- Under Command parameters, for Optional Configuration Location, enter the name of the Systems Manager parameter you created earlier. In my example, I used the name AmazonCloudWatch-Windows. Keep the defaults for the other settings.

Figure 4: Configure the CloudWatch agent on the instances
- Under Targets, specify your EC2 instances based on their tags, or choose them manually, and then choose Run.


Step 2: Create a metric filter in CloudWatch
After the completion of the tasks in Step 1, your EC2 instances should now be sending logs to a log group in Amazon CloudWatch called /aws/SecurityAuditLogs. The log group should have log streams named after the EC2 instances that are sending the logs to CloudWatch. The next step is to create a metric filter to filter the noise from the logs.
To create a metric filter
- Open the CloudWatch console and in the left navigation menu, choose Log Groups.
- Select the check box next to the /aws/SecurityAuditLogs log group, choose Actions, and then choose Create metric filter.
- On the Define pattern page, enter Audit Failure, keep the defaults for the other settings, and then choose Next.
- Enter values for Filter name, Metric namespace, Metric name, and Metric value, and then choose Next to create the metric filter.
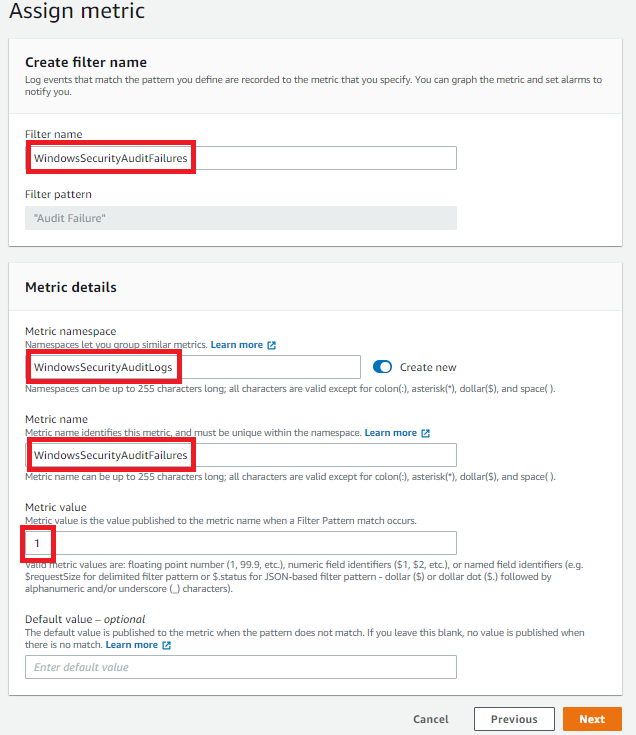
Figure 5: Create a CloudWatch metric filter
Step 3: Create a CloudWatch alarm based on the metric filter and add SNS notification
In this step, you set a threshold for how many “Audit Failure” events you want to allow within a period of time before triggering an alarm.
To create the CloudWatch alarm and add SNS notification
- Open the Amazon Simple Notification Service console and in the left navigation menu, choose Topics.
- Choose Create topic, and then choose Standard.
- Provide a name for your topic, and then choose Create topic. In my example, I named the topic WindowsSecurityLogsAlarmNotifications.
- Open the CloudWatch console, choose Log groups, and select the /aws/SecurityAuditLogs log group.
- Choose the Metric filters tab, select the check box next to the WindowsSecurityAuditFailures filter you just created, and choose Create alarm.
- On the Specify metric and conditions page, set the parameters as follows:
- For Statistic, choose Sample count.
- For Period, choose 5 minutes.
- For Threshold type, choose Static.
- For Define the alarm condition, choose Greater>threshold.
- For Define the threshold value, specify the threshold number of failed login attempts that will cause a notification to be sent.
Note: In my example, I’ve specified to be notified after five failed login attempts. You should determine the appropriate threshold to use, based on your organization’s security policies.

Figure 6: Create a CloudWatch alarm
- On the Configure actions page, choose Next.
- Choose In alarm, choose Select an existing SNS topic, and then select the SNS topic you created earlier in this procedure.
- Specify a name for the alarm, and then choose Create Alarm.

Step 4: Create a Lambda function and subscribe the function to the SNS topic
CloudWatch alarm messages are predefined, can’t be modified, and don’t provide details based on CloudWatch streams. Additionally, a CloudWatch alarm will trigger when a combination of failed login attempts on two or more instances meets the threshold. For instance, in my example, when there are three failed attempts on one instance and two failed attempts on a second instance all within a 5-minute period, a CloudWatch alarm will be triggered.
The purpose of the Lambda function that you’ll create in this step is to validate whether the triggered alarms meet the specified threshold on a per-instance basis before the function sends an email notification to the designated email address. When a CloudWatch alarm is triggered, the function reads through the CloudWatch logs and filters the logs based on CloudWatch log streams that meet the specified threshold for the alarm. If no individual CloudWatch log stream (that is, no individual instance or server) meets the threshold, the function won’t send a notification. The function only sends a notification if it determines that one or more instances have each met the specified threshold. The function also provides more information about the failed login attempts when it does send you an email.
To create the Lambda function and subscribe it to the SNS topic
- Open the AWS Lambda console and choose Create function.
- Choose Author from scratch, and provide a name for your function. Under Runtime, select Node.js 14.x, and then choose Create function.
- Double-click index.js, replace the code with the following code, and then choose Deploy.
- Choose Add trigger, and in the drop-down list, choose SNS.
- Under SNS topic, select the SNS topic you created in Step 3, and then choose Add.

Figure 7: Create the AWS Lambda function
- Choose the Configuration tab, and then choose Environment variables. Choose Edit to add the environment variables for ALARM_THRESHOLD, RECIPIENT_EMAIL, and SENDER_EMAIL, and then choose Save.

Figure 8: The Lambda environment variables


Note: The variables’ keys must be set exactly as ALARM_THRESHOLD, RECIPIENT_EMAIL, and SENDER_EMAIL, because otherwise the code will fail. For the recipient, you can specify a single email or multiple email addresses that are separated by commas, as shown in Figure 8, provided that the emails are verified as specified in the Prerequisites section.
Next, create an IAM policy, which you’ll attach to a role that will be assumed by the Lambda function. This policy provides permissions to perform the DescribeMetricFilters, FilterLogEvents, and SendEmail API calls that are necessary for the function to work. It also provides permissions to create a log group and log stream in CloudWatch for the Lambda function, so that you can review the logs if the Lambda function fails to run properly.
To create the IAM policy
- Sign in to the IAM console, and in the navigation bar, choose Policies.
- In the content pane, choose Create policy, and then choose JSON.
- Replace the content with the following script. Make sure to replace the placeholders with the ARN of the Lambda function, the ARNs for log group creation and the ARN of your SES verified email address to use as sender.
Here is how it appears in my example. Note that FilterSendSecurityEvents is the name of my Lambda function and /aws/SecurityAuditLogs is the name my log group created in Step 1.

Figure 9: Example policy for the IAM role to be attached to the Lambda function
- Choose Review policy, specify a name and a description for the policy, and then choose Create policy.

Next, create an IAM role and attach this policy.
To create the IAM role and attach the policy
- In the IAM console navigation bar, choose Roles, and then choose Create role.
- Under Choose the service that will use this role, choose Lambda, and then choose Next: Permissions.
- On the next page, select the policy you just created, and then choose Next: Tags. Add an optional tag, and then choose Next: Review.
- Specify a name and description for the role, and then choose Create role.
- To attach this role to the Lambda function, go to the AWS Lambda console. Navigate to the Lambda function, and choose Configurations.
- Choose Permissions, and then under Execution role, choose Edit.
- On the Edit basic settings page, under Existing role, select the role you just created, and then choose Save.
And that’s it! You will now be notified whenever there are “Audit Failure” events that reach the threshold you set on a per-instance basis for your AWS Managed Microsoft AD domain-joined instances. If you installed and configured the CloudWatch agent on non–domain-joined instances in Step 1, then you’ll also get notifications for “Audit Failure” events that are generated by failed login attempts that use local accounts.
Conclusion
In this post, I showed you how you can proactively track and monitor Windows security audit failures across your AWS Managed Microsoft AD domain-joined EC2 instances. This helps provide greater visibility into Windows login activities for administrators, so that they can take action to maintain the security of their server fleet. This solution can also be extended to potentially trigger an automation workflow or incident response process in the event of unexpected events.
Although this blog has specifically targeted AWS Managed Microsoft AD domain-joined instances, the procedure here also applies to standalone EC2 instances or on-premises servers that are configured to send logs to CloudWatch.
If you have feedback about this post, submit comments in the Comments section below. If you have questions about this post, start a new thread on the AWS Directory Service forum or contact AWS Support.
Want more AWS Security how-to content, news, and feature announcements? Follow us on Twitter.