Tag Archives: Apache Druid

Stop Answering the Same Question Twice: Interval-Aware Caching for Druid at Netflix Scale

Post Syndicated from Netflix Technology Blog original https://netflixtechblog.com/stop-answering-the-same-question-twice-interval-aware-caching-for-druid-at-netflix-scale-22fadc9b840e

By Ben Sykes

In a previous post, we described how Netflix uses Apache Druid to ingest millions of events per second and query trillions of rows, providing the real-time insights needed to ensure a high-quality experience for our members. Since that post, our scale has grown considerably.

With our database holding over 10 trillion rows and regularly ingesting up to 15 million events per second, the value of our real-time data is undeniable. But this massive scale introduced a new challenge: queries. The live show monitoring, dashboards, automated alerting, canary analysis, and A/B test monitoring that are built on top of Druid became so heavily relied upon that the repetitive query load started to become a scaling concern in itself.

This post describes an experimental caching layer we built to address this problem, and the trade-offs we chose to accept.

The Problem

Our internal dashboards are heavily used for real-time monitoring, especially during high-profile live shows or global launches. A typical dashboard has 10+ charts, each triggering one or more Druid queries; one popular dashboard with 26 charts and stats generates 64 queries per load. When dozens of engineers view the same dashboards and metrics for the same event, the query volume quickly becomes unmanageable.

Take the popular dashboard above: 64 queries per load, refreshing every 10 seconds, viewed by 30 people. That’s 192 queries per second from one dashboard, mostly for nearly identical data. We still need Druid capacity for automated alerting, canary analysis, and ad-hoc queries. And because these dashboards request a rolling last-few-hours window, each refresh changes slightly as the time range advances.

Druid’s built-in caches are effective. Both the full-result cache and the per-segment cache. But neither is designed to handle the continuous, overlapping time-window shifts inherent to rolling-window dashboards. The full-result cache misses for two reasons.

  • If the time window shifts even slightly, the query is different, so it’s a cache miss.
  • Druid deliberately refuses to cache results that involve realtime segments (those still being indexed), because it values deterministic, stable cache results and query correctness over a higher cache hit rate.

The per-segment cache does help avoid redundant scans on historical nodes, but we still need to collect those cached segment results from each data node and merge them in the brokers with data from the realtime nodes for every query.

During major shows, rolling-window dashboards can generate a flood of near-duplicate queries that Druid’s caches mostly miss, creating heavy redundant load. At our scale, solving this by simply adding more hardware is prohibitively expensive.

We needed a smarter approach.

The Insight

When a dashboard requests the last 3 hours of data, the vast majority of that data, everything except the most recent few minutes, is already settled. The data from 2 hours ago won’t change.

What if we could remember the older portions of the result and only ask Druid for the part that’s actually new?

This is the core idea behind a new caching service that understands the structure of Druid queries and serves previously-seen results from cache while fetching only the freshest portion from Druid.
A Deliberate Trade-Off

Before diving into the implementation, it’s worth being explicit about the trade-off we’re making. Caching query results introduces some staleness, specifically, up to 5 seconds for the newest data. This is acceptable for most of our operational dashboards, which refresh every 10 to 30 seconds. In practice, many of our queries already set an end time of now-1m or now-5s to avoid the “flappy tail” that can occur with currently-arriving data.

Since our end-to-end data pipeline latency is typically under 5 seconds at P90, a 5-second cache TTL on the freshest data introduces negligible additional staleness on top of what’s already inherent in the system. We decided it was better to accept this small amount of staleness in exchange for significantly lower query load on Druid. But a 5s cache on its own is not very useful.

Exponential TTLs

Not all data points are equally trustworthy. In real-time analytics, there’s a well-known late-arriving data problem. Events can arrive out of order or be delayed in the ingestion pipeline. A data point from 30 seconds ago might still change as late-arriving events trickle in. A data point from 30 minutes ago is almost certainly final.

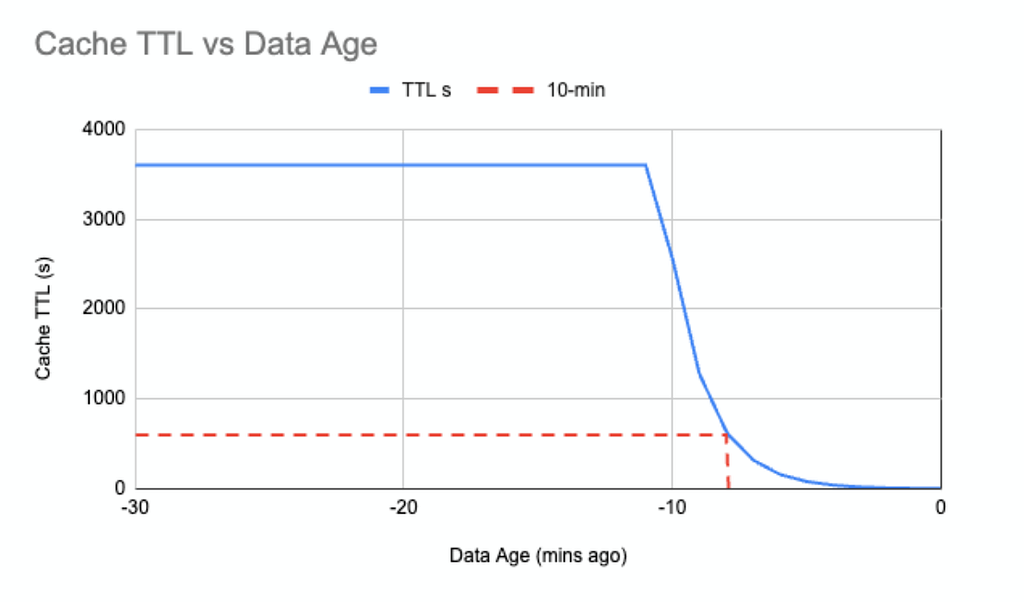
We use this observation to set cache TTLs that increase exponentially with the age of the data. Data less than 2 minutes old gets a minimum TTL of 5 seconds. After that, the TTL doubles for each additional minute of age: 10 seconds at 2 minutes old, 20 seconds at 3 minutes, 40 seconds at 4 minutes, and so on, up to a maximum TTL of 1 hour.

The effect is that fresh data cycles through the cache rapidly, so any corrections from late-arriving events in the most recent couple of minutes are picked up quickly. Older data lingers much longer, because our confidence in its accuracy grows with time.

For a 3-hour rolling window, the exponential TTL ensures the vast majority of the query is served from the cache, leaving Druid to only scan the most recent, unsettled data.
Bucketing

If we were to use a single-level cache key for the query and interval, similar to Druid’s existing result-level cache, we wouldn’t be able to extract only the relevant time range from cached results. A shifted window means a different key, which means a cache miss.

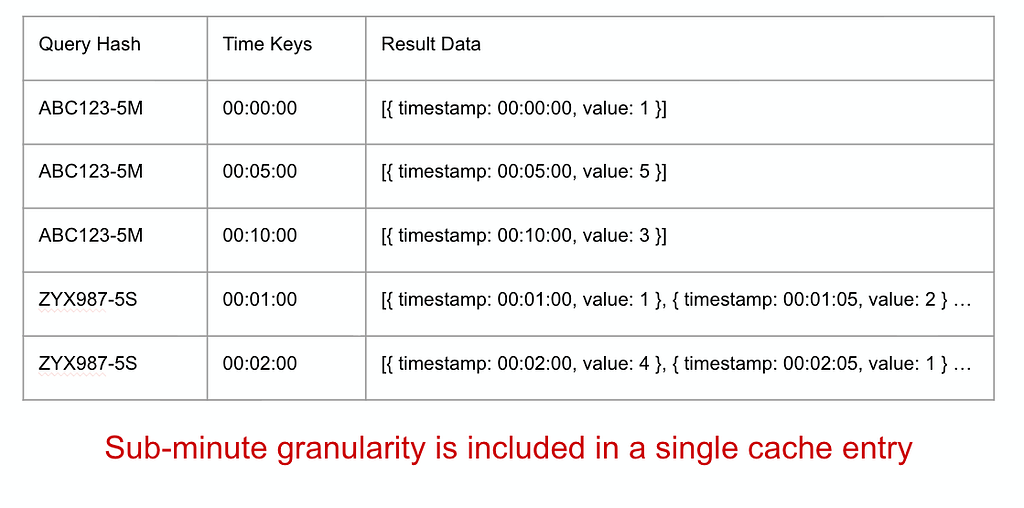
Instead, we use a map-of-maps. The top-level key is the query hash without the time interval; the inner keys are timestamps bucketed to the query granularity (or 1 minute, whichever is larger) and encoded as big-endian bytes so lexicographic order matches time. This enables efficient range scans; fetching all cached buckets between times A and B for a query hash. A 3-hour query at 1-minute granularity becomes 180 independent cached buckets, each with its own TTL; when the window shifts (e.g., 30 seconds later), we reuse most buckets from cache and only query Druid for the new data.
How It Works

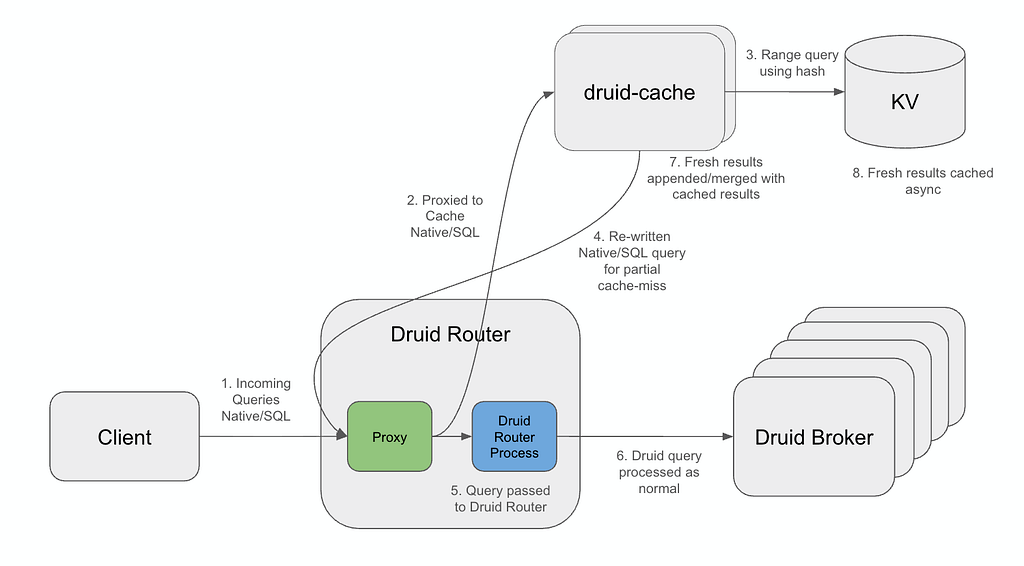
Today, the cache runs as an external service integrated transparently by intercepting requests at the Druid Router and redirecting them to the cache. If the cache fully satisfies a request, it returns the result; otherwise it shrinks the time interval to the uncached portion and calls back into the Router, bypassing the redirect to query Druid normally. Non-cached requests (e.g., metadata queries or queries without time group-bys) pass straight through to Druid unchanged.

This intercepting proxy design allows us to enable or disable caching without any client changes and is a key to its adoption. We see this setup as temporary while we work out a way to better integrate this capability into Druid more natively.

When a cacheable query arrives, those that are grouping-by time (timeseries, groupBy), the cache performs the following steps.

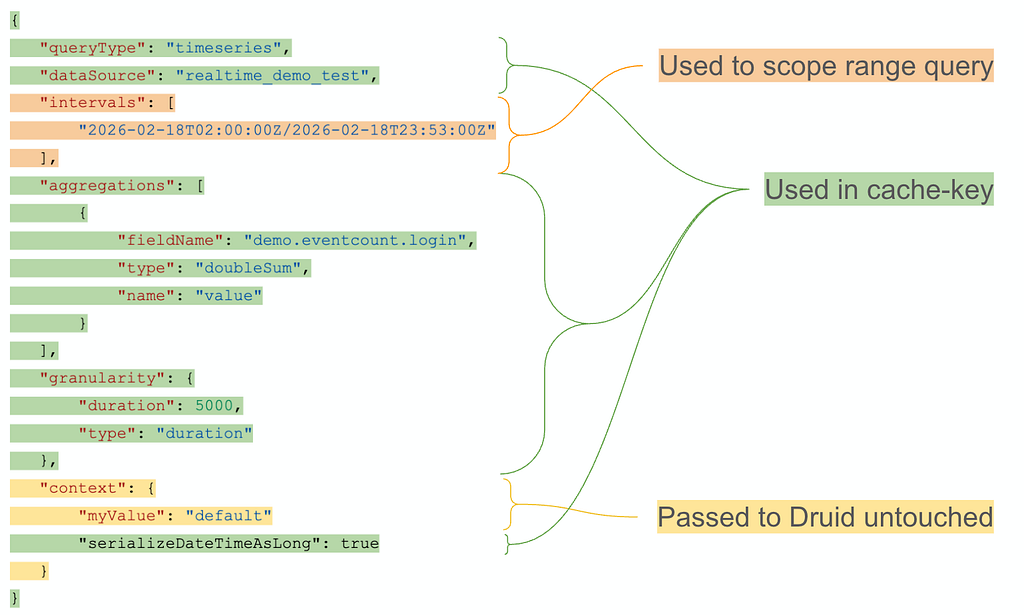
Parsing and Hashing. We parse each incoming query to extract the time interval, granularity, and structure, then compute a SHA-256 hash of the query with the time interval and parts of the context removed. That hash is the cache key: it encodes what is being asked (datasource, filters, aggregations, granularity) but not when, so the same logical query over different overlapping time windows maps to the same cache entry. There are some context properties that can alter the response structure or contents, so these are included in the cache-key.
Cache Lookup. Using the cache key, we fetch cached points within the requested range, but only if they’re contiguous from the start. Because bucket TTLs can expire unevenly, gaps can appear; when we hit a gap, we stop and fetch all newer data from Druid. This guarantees a complete, unbroken result set while sending at most one Druid query, rather than “filling gaps” with multiple small, fragmented queries that would increase Druid load.

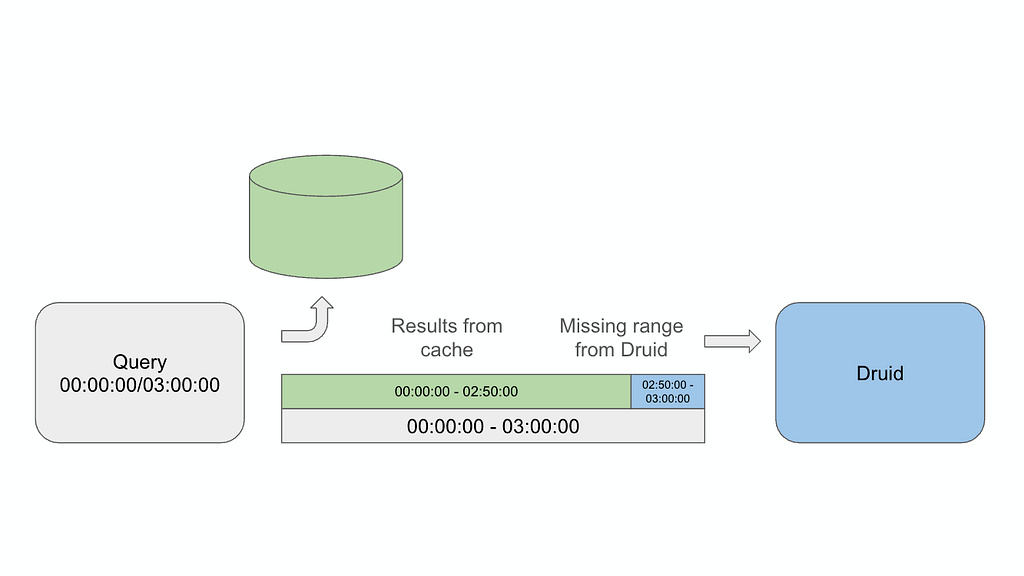
Fetching the Missing Tail. On a partial cache hit (e.g., 2h 50m of a 3h window), we rebuild the query with a narrowed interval for the missing 10 minutes and send only that to Druid. Since Druid then scans just the recent segments for a small time range, the query is usually faster and cheaper than the original.

Combining. The cached data and fresh data are concatenated, sorted by timestamp, and returned to the client. From the client’s perspective, the response looks identical to what Druid would have returned, same JSON format, same fields.

Asynchronous Caching. The fresh data from Druid is parsed into individual time-granularity buckets and written back to the cache asynchronously, so we don’t add latency to the response path.
Negative Caching

Some metrics are sparse. Certain time buckets may genuinely have no data. Without special handling, the cache would treat these empty buckets as gaps and re-query Druid for them every time.

We handle this by caching empty sentinel values for time buckets where Druid returned no data. Our gap-detection logic recognizes these empty entries as valid cached data rather than missing data, preventing needless re-queries for naturally sparse metrics.

However, we’re careful not to negative-cache trailing empty buckets. If a query returns data up to minute 45 and nothing after, we only cache empty entries for gaps between data points, not after the last one. This avoids incorrectly caching “no data” for time periods where events simply haven’t arrived yet, which would exacerbate the chart delays of late arriving data.

The Storage Layer

For the backing store, we use Netflix’s Key-Value Data Abstraction Layer (KVDAL), backed by Cassandra. KVDAL provides a two-level map abstraction, a natural fit for our needs. The outer key is the query hash, and the inner keys are timestamps. Crucially, KVDAL supports independent TTLs on each inner key-value pair, eliminating the need for us to manage cache eviction manually.

This two-level structure gives us efficient range queries over the inner keys, which is exactly what we need for partial cache lookups: “give me all cached buckets between time A and time B for query hash X.”

Results

The biggest win is during high-volume events (e.g., live shows): when many users view the same dashboards, the cache serves most identical queries as full hits, so the query rate reaching Druid is essentially the same with 1 viewer or 100. The scaling bottleneck moves from Druid’s query capacity to the much cheaper-to-scale cache, and with ~5.5 ms P90 cache responses, dashboards load faster for everyone.

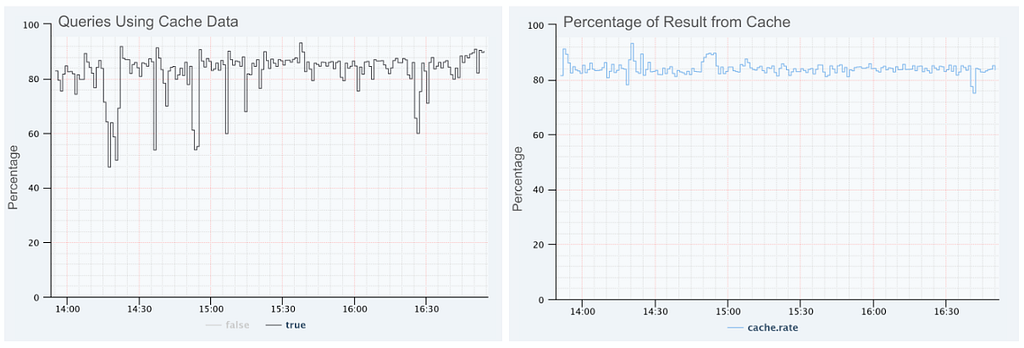
On a typical day, 82% of real user queries get at least a partial cache hit, and 84% of result data is served from cache. As a result, the queries that reach Druid scan much narrower time ranges, touching fewer segments and processing less data, freeing Druid to focus on aggregating the newest data instead of repeatedly re-querying historical segments.
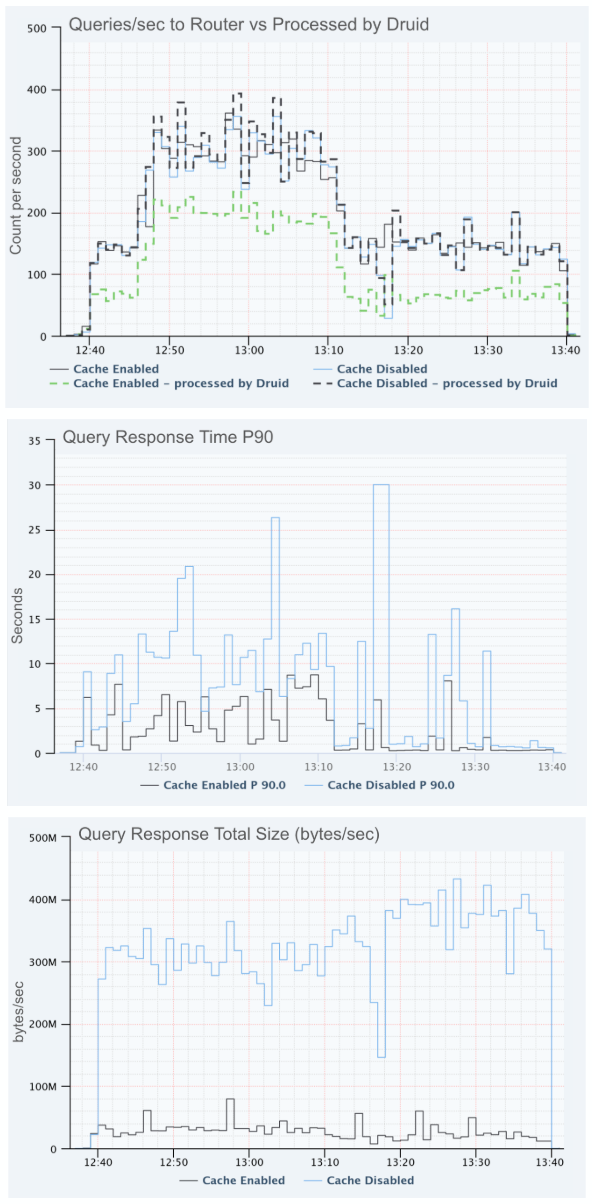
An experiment validated this, showing about a 33% drop in queries to Druid and a 66% improvement in overall P90 query times. It also cut result bytes and segments queried, and in some cases, enabling the cache reduced result bytes by more than 14x. Caveat: the size of these gains depends heavily on how similar and repetitive the query workload is.
Looking Ahead

This caching layer is still experimental, but results are promising and we’re exploring next steps. We’ve added partial support for templated SQL so dashboard tools can benefit without writing native Druid queries.

Longer term, we’d like interval-aware caching to be built into Druid: an external proxy adds infrastructure to manage, extra network hops, and workarounds (like SQL templating) to extract intervals. Implemented inside Druid, it could be more efficient, with direct access to the query planner and segment metadata, and benefit the broader community without custom infrastructure. We’d likely ship it as an opt-in, configurable, result-level cache in the Brokers, with metrics to tune TTLs and measure effectiveness. Please leave a comment if you have a use-case that could benefit from this feature.

More broadly, this strategy, splitting time-series results into independently cached, granularity-aligned buckets with age-based exponential TTLs, isn’t Druid-specific and could apply to any time-series database with frequent overlapping-window queries.

Summary

As more Netflix teams rely on real-time analytics, query volume grows too. Dashboards are essential at our scale, but their popularity can become a scaling bottleneck. By inserting an intelligent cache between dashboards and Druid, one that understands query structure, breaks results into granularity-aligned buckets, and trades a small amount of staleness for much lower Druid load, we’ve increased query capacity without scaling infrastructure proportionally, and hope to deliver these benefits to the Druid community soon as a built-in Druid feature.

Sometimes the best way to handle a flood of queries is to stop answering the same question twice.


Stop Answering the Same Question Twice: Interval-Aware Caching for Druid at Netflix Scale was originally published in Netflix TechBlog on Medium, where people are continuing the conversation by highlighting and responding to this story.
A dive into redBus’s data platform and how they used Amazon QuickSight to accelerate business insights

Post Syndicated from Girish Kumar Chidananda original https://aws.amazon.com/blogs/big-data/a-dive-into-redbuss-data-platform-and-how-they-used-amazon-quicksight-to-accelerate-business-insights/

This post is co-authored with Girish Kumar Chidananda from redBus.

redBus is one of the earliest adopters of AWS in India, and most of its services and applications are hosted on the AWS Cloud. AWS provided redBus the flexibility to scale their infrastructure rapidly while keeping costs extremely low. AWS has a comprehensive suite of services to cater to most of their needs, including providing customer support that redBus can vouch for.

In this post, we share redBus’s data platform architecture, and how various components are connected to form their data highway. We also discuss the challenges redBus faced in building dashboards for their real-time business intelligence (BI) use cases, and how they used Amazon QuickSight, a fast, easy-to-use, cloud-powered business analytics service that makes it easy for all employees within redBus to build visualizations and perform ad hoc analysis to gain business insights from their data, any time, and on any device.

About redBus

redBus is the world’s largest online bus ticketing platform built in India and serving more than 36 million happy customers around the world. Along with its bus ticketing vertical, redBus also runs a rail ticketing service called redRails and a bus and car rental service called rYde. It is part of the GO-MMT group, which is India’s leading online travel company, with an extensive brand portfolio that includes other prominent online travel brands like MakeMyTrip and Goibibo.

redBus’s data highway 1.0

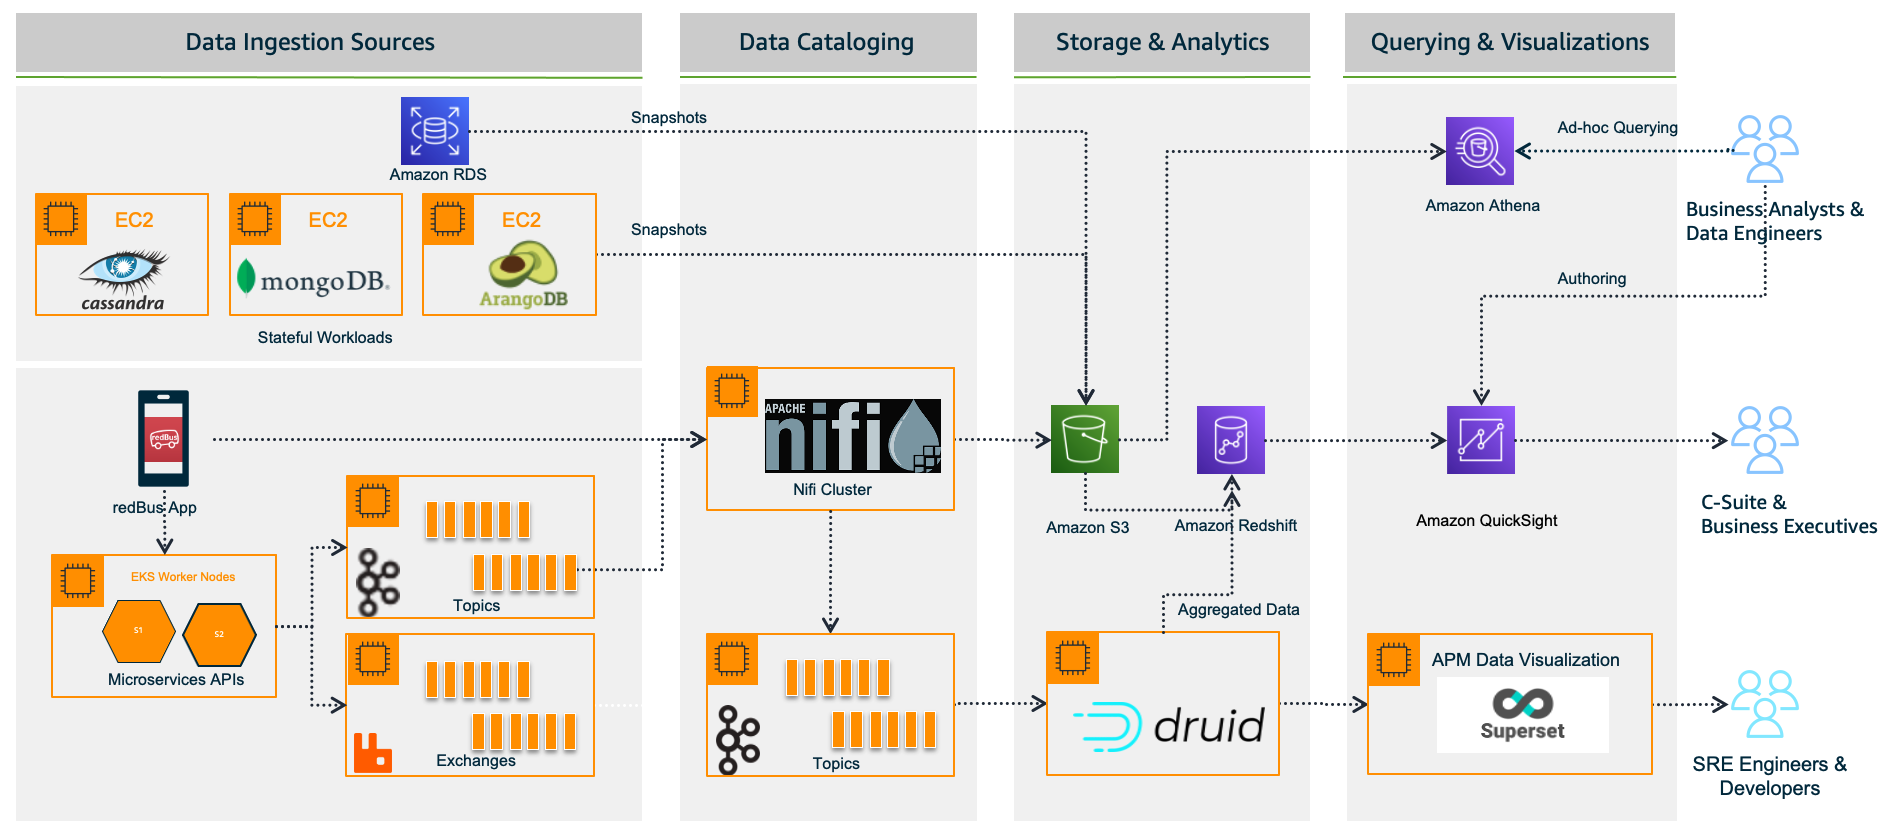
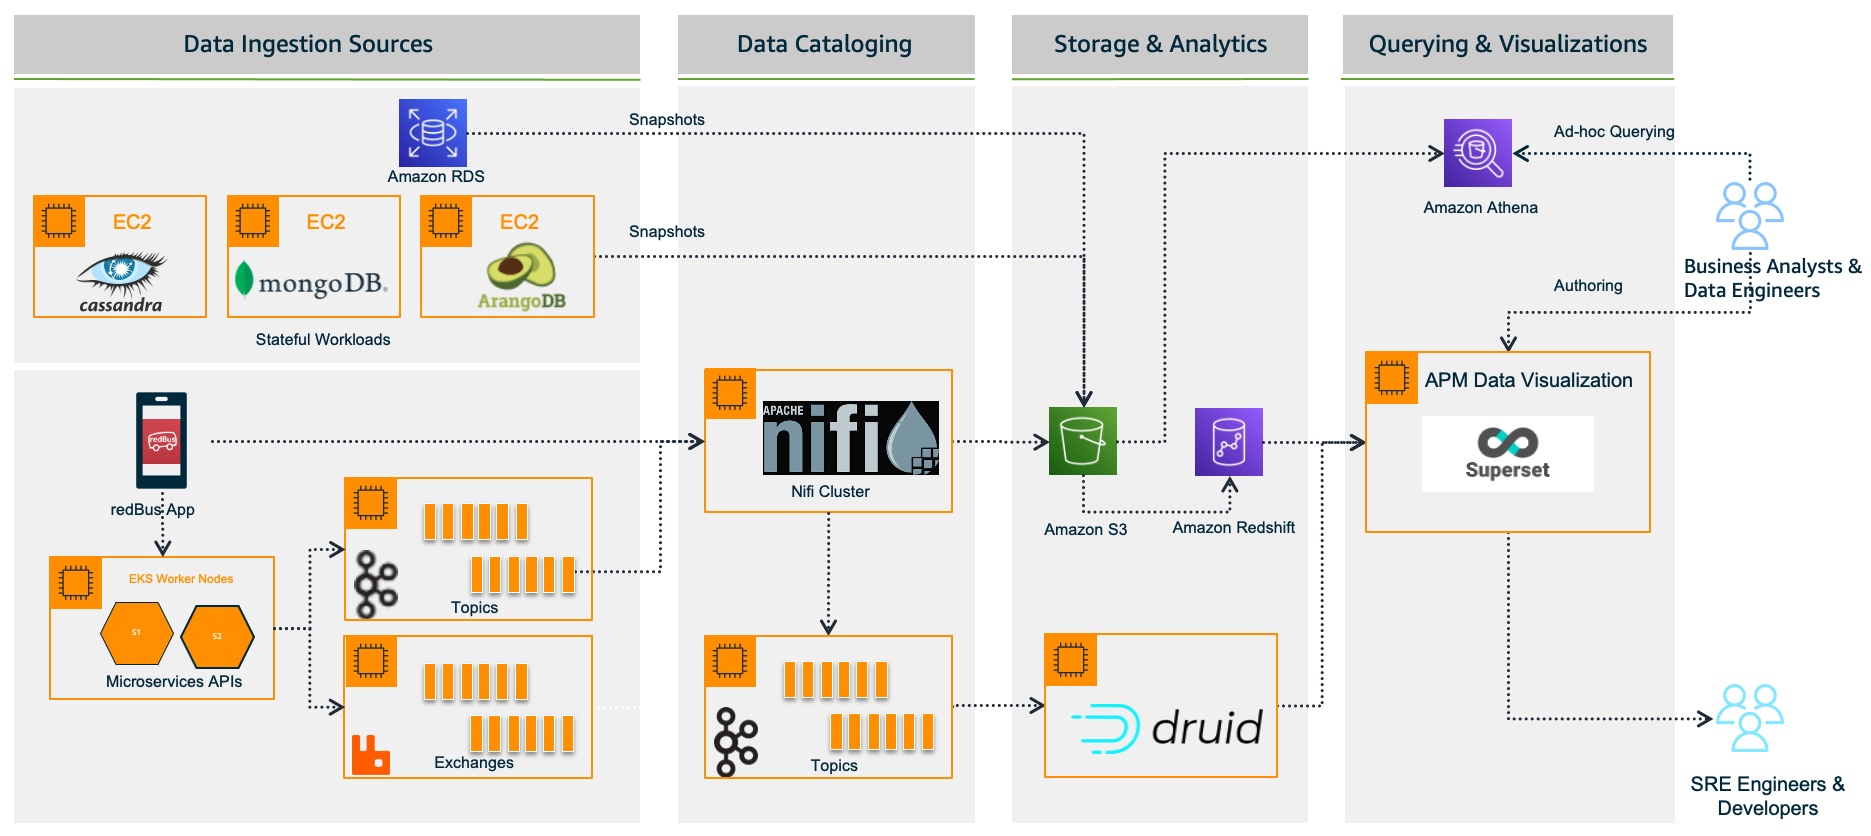
redBus relies heavily on making data-driven decisions at every level, from its traveler journey tracking, forecasting demand during high traffic, identifying and addressing bottlenecks in their bus operators signup process, and more. As redBus’s business started growing in terms of the number of cities and countries they operated in and the number of bus operators and travelers using the service in each city, the amount of incoming data also increased. The need to access and analyze the data in one place required them to build their own data platform, as shown in the following diagram.

redBus data platform 1.0

In the following sections, we look at each component in more detail.

Data ingestion sources

With the data platform 1.0, the data is ingested from various sources:

  • Real time – The real-time data flows from redBus mobile apps, the backend microservices, and when a passenger, bus operator, or application does any operation like booking bus tickets, searching the bus inventory, uploading a KYC document, and more
  • Batch mode – Scheduled jobs fetch data from multiple persistent data stores like Amazon Relational Database Service (Amazon RDS), where the OLTP data from all its applications are stored, Apache Cassandra clusters, where the bus inventory from various operators is stored, Arango DB, where the user identity graphs are stored, and more

Data cataloging

The real-time data is ingested into their self-managed Apache Nifi clusters, an open-source data platform that is used to clean, analyze, and catalog the data with its routing capabilities before sending the data to its destination.

Storage and analytics

redBus uses the following services for its storage and analytical needs:

  • Amazon Simple Storage Service (Amazon S3), an object storage service that provides the foundation for their data lake because of its virtually unlimited scalability and higher durability. Real-time data flows from Apache Druid and data from the data stores flow at regular intervals based on the schedules.
  • Apache Druid, an OLAP-style data store (data flows via Kafka Druid data loader), which computes facts and metrics against various dimensions during the data loading process.
  • Amazon Redshift, a cloud data warehouse service that helps you analyze exabytes of data and run complex analytical queries. redBus uses Amazon Redshift to store the processed data from Amazon S3 and the aggregated data from Apache Druid.

Querying and visualization

To make redBus as data-driven as possible, they ensured that the data is accessible to their SRE engineers, data engineers, and business analysts via a visualization layer. This layer features dashboards being served using Apache SuperSet, an open-source data visualization application, and Amazon Athena, an interactive query service to analyze data in Amazon S3 using standard SQL for ad hoc querying requirements.

The challenges

Initially, redBus handled data that was being ingested at the rate of 10 million events per day. Over time, as its business started growing, so did the data volume (from gigabytes to terabytes to petabytes), data ingestion per day (from 10 million to 320 million events), and its business intelligence dashboard needs. Soon after, they started facing challenges with their self-managed Superset’s BI capabilities, and the increased operational complexities.

Limited BI capabilities

redBus encountered the following BI limitations:

  • Inability to create visualizations from multiple data sources – Superset doesn’t allow creating visualizations from multiple tables within its data exploration layer. redBus data engineers had to have the tables joined beforehand at the data source level itself. In order to create a 360-degree view for redBus’s business stakeholders, it became inconvenient for data engineers to maintain multiple tables supporting the visualization layer.
  • No global filter for visuals in a dashboard – A global or primary filter across visuals in a dashboard is not supported in Superset. For example, consider there are visuals like Sales Wins by Region, YTD Revenue Realized by Region, Sales Pipeline by Region, and more in a dashboard, and a filter Region is added to the dashboard with values like EMEA, APAC, and US. The filter Region will only apply to one of the visuals, not the entire dashboard. However, dashboard users expected filtering across the dashboard.
  • Not a business-user friendly tool – Superset is highly developer centric when it comes to customization. For example, if a redBus business analyst had to customize a timed refresh that automatically re-queries every slice on a dashboard according to a pre-set value, then the analyst has to update the dashboard’s JSON metadata field. Therefore, having knowledge of JSON and its syntax is mandatory for doing any customization on the visuals or dashboard.

Increased operational cost

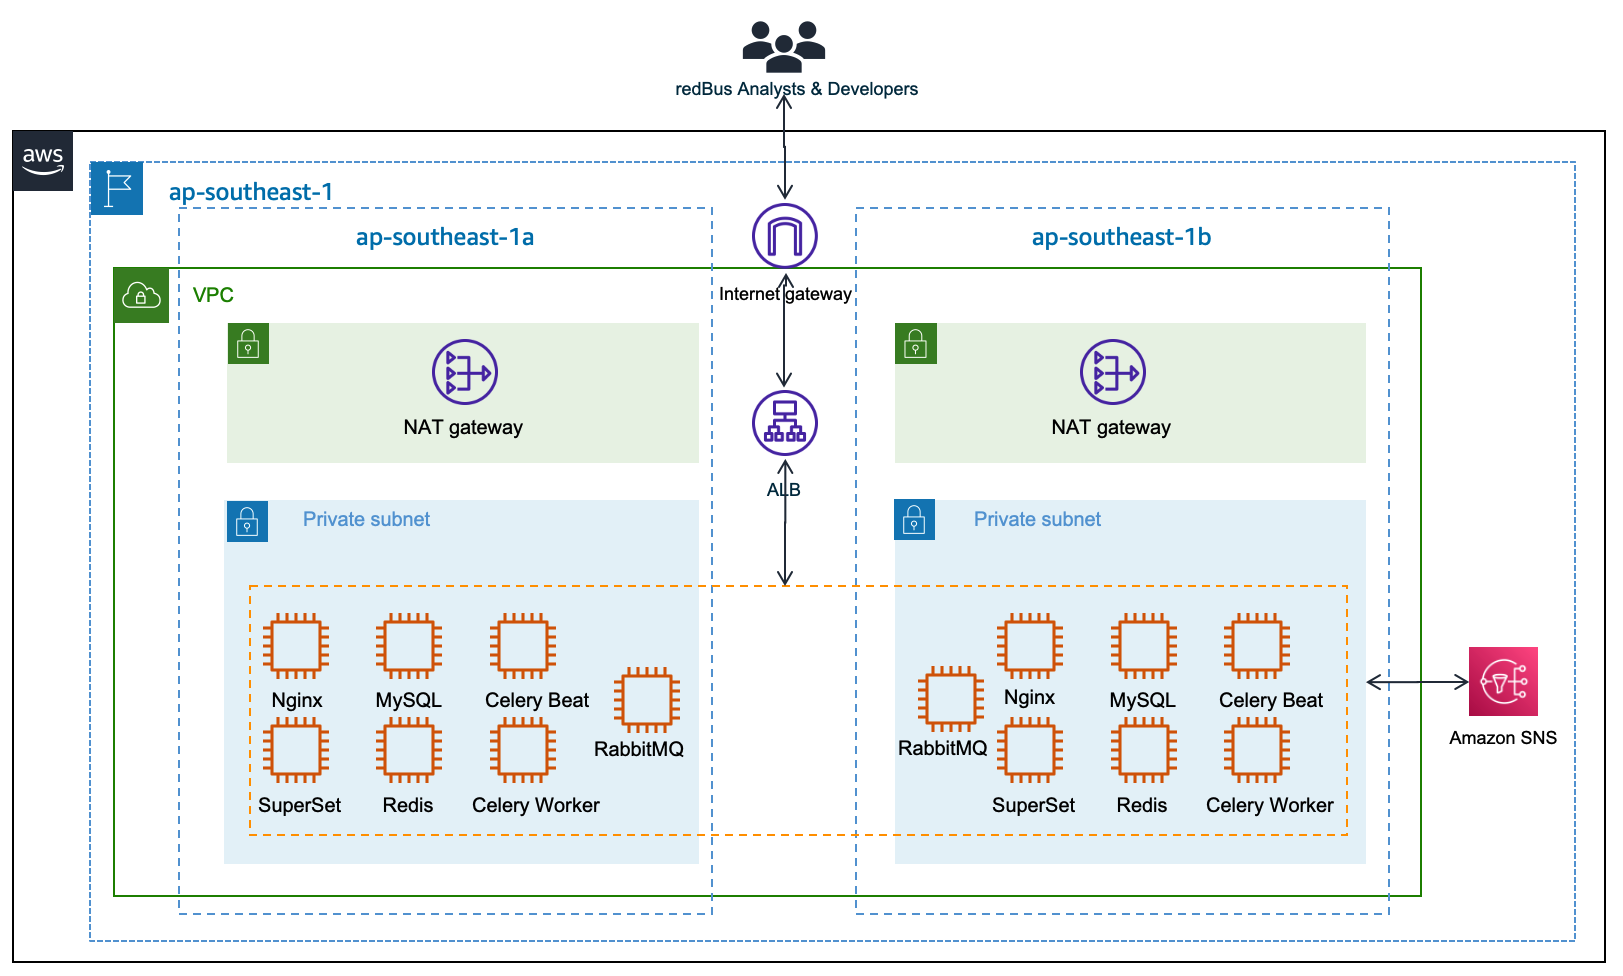
Although Superset is open source, which means there are no licensing costs, it also means there is more effort in maintaining all the components required for it to function as an enterprise-grade BI tool. redBus has deployed and maintained a web server (Nginx) fronted by an Application Load Balancer to do the load balancing; a metadata database server (MySQL) where Superset stores its internal information like users, slices, and dashboard definitions; an asynchronous task queue (Celery) for supporting long-running queries; a message broker (RabbitMQ); and a distributed caching server (Redis) for caching the results, charting data, and more on Amazon Elastic Compute Cloud (Amazon EC2) instances. The following diagram illustrates this architecture.

Apache Superset Deploment at redBus

redBus’s DevOps team had to do the heavy lifting of provisioning the infrastructure, taking backups, scaling the components manually as needed, upgrading the components individually, and more. It also required a Python web developer to be around for making the configurational changes so all the components work together seamlessly. All these manual operations increased the total cost of ownership for redBus.

Journey towards QuickSight

redBus started exploring BI solutions primarily around a couple of its dashboarding requirements:

  • BI dashboards for business stakeholders and analysts, where the data is sourced via Amazon S3 and Amazon Redshift.
  • A real-time application performance monitoring (APM) dashboard to help their SRE engineers and developers identify the root cause of an issue in their microservices deployment so they can fix the issues before they affect their customer’s experience. In this case, the data is sourced via Druid.

QuickSight fit into most of redBus’s BI dashboard requirements, and in no time their data platform team started with a proof of concept (POC) for a couple of their complex dashboards. At the end of the POC, which spanned a month’s time, the team shared their findings.

First, QuickSight is rich in BI capabilities, including the following:

  • It’s a self-service BI solution with drag-and-drop features that could help redBus analysts comfortably use it without any coding efforts.
  • Visualizations from multiple data sources in a single dashboard could help redBus business stakeholders get a 360-degree view of sales, forecasting, and insights in a single pane of glass.
  • Cascading filters across visuals and across sheets in a dashboard are much-needed features for redBus’s BI requirements.
  • QuickSight offers Excel-like visuals—tables with calculations, pivot tables with cell grouping, and styling are attractive for the viewers.
  • The Super-fast, Parallel, In-memory Calculation Engine (SPICE) in QuickSight could help redBus scale to hundreds of thousands of users, who can all simultaneously perform fast interactive analysis across a wide variety of AWS data sources.
  • Off-the-shelf ML insights and forecasting at no additional cost would allow redBus’s data science team to focus on ML models besides sales forecasting and similar models.
  • Built-in row-level security (RLS) could allow redBus to grant filtered access for their viewers. For example, redBus has many business analysts who manage different countries. With RLS, each business analyst only sees data related to their assigned country within a single dashboard.
  • redBus uses OneLogin as its identity provider, which supports Security Assertion Markup Language 2.0 (SAML 2.0). With the help of identity federation and single sign-on support from QuickSight, redBus could provide a simple onboarding flow for their QuickSight users.
  • QuickSight offers built-in alerts and email notification capabilities.

Secondly, QuickSight is a fully managed, cloud-native, serverless BI service offering from AWS, with the following features:

  • redBus engineers don’t need to focus on the heavy lifting of provisioning, scaling, and maintaining their BI solution on EC2 instances.
  • QuickSight offers native integration with AWS services like Amazon Redshift, Amazon S3, and Athena, and other popular frameworks like Presto, Snowflake, Teradata, and more. QuickSight connects to most of the data sources that redBus already has except Apache Druid, because native integration with Druid was not available as of December 2022. For a complete list of the supported data sources, see Supported data sources.

The outcome

Considering all the rich features and lower total cost of ownership, redBus chose QuickSight for their BI dashboard requirements. With QuickSight, redBus’s data engineers have built a number of dashboards in no time to give insights from petabytes of data to business stakeholders and analysts. The redBus data highway evolved to bring business intelligence to a much wider audience in their organization, with better performance and faster time-to-value. As of November 2022, it combines QuickSight for business users and Superset for real-time APM dashboards (at the time of writing, QuickSight doesn’t offer a native connector to Druid), as shown in the following diagram.

redBus data platform 2.0

Sales anomaly detection dashboard

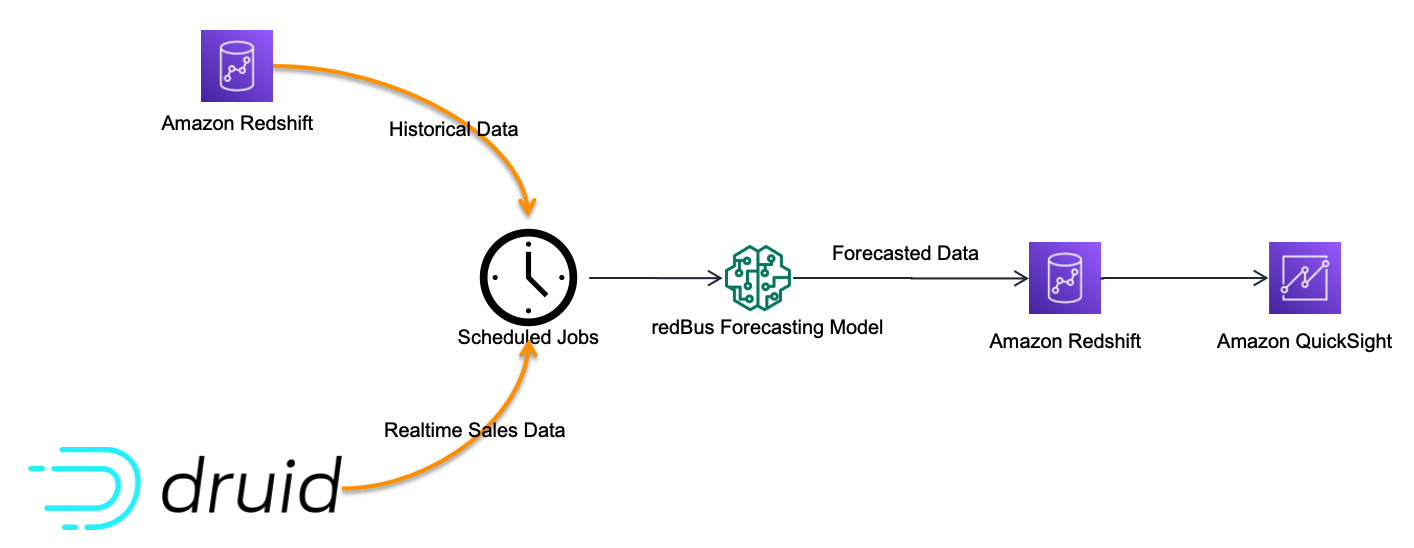
Although there are many dashboards that redBus deployed to production, sales anomaly detection is one of the interesting dashboards that redBus built. It uses redBus’s proprietary sales forecasting model, which in turn is sourced by historical sales data from Amazon Redshift tables and real-time sales data from Druid tables, as shown in the following figure.

Sales anomaly detection data flow

At regular intervals, the scheduled jobs feed the redBus forecasting model with real-time and historical sales data, and then the forecasted data is pushed into an Amazon Redshift table. The sales anomaly detection dashboard in QuickSight is served by the resultant Amazon Redshift table.

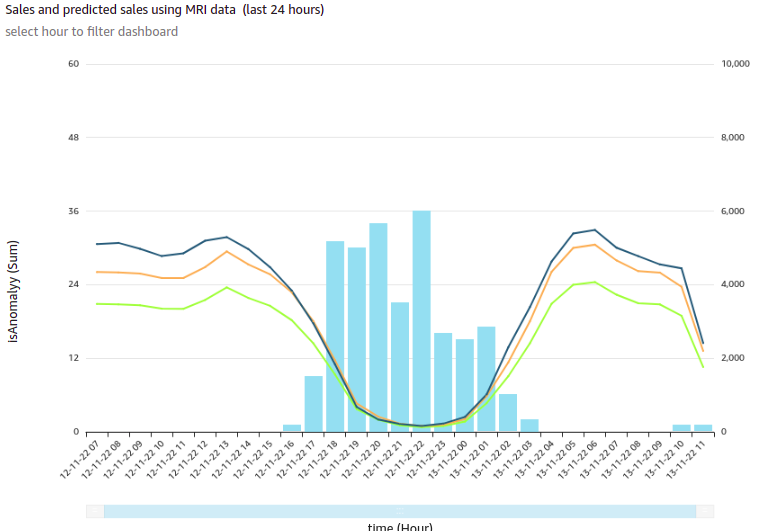
The following is one of the visuals from the sales anomaly detection dashboard. It’s built using a line chart representing hourly actual sales, predicted sales, and an alert threshold for a time series for a particular business cohort in redBus.

Sales and Predicted Sales for a particular cohort

In this visual, each bar represents the number of sales anomalies triggered at a particular point in the time series.

redBus’s analysts could further drill down to the sales details and anomalies at the minute level, as shown in the following diagram. This drill-down feature comes out of the box with QuickSight.

Drill-Down Chart - Sales and Predicted Sales for a particular cohort

For more details on adding drill-downs to QuickSight dashboard visuals, see Adding drill-downs to visual data in Amazon QuickSight.

Apart from the visuals, it has become one of viewers’ favorite dashboards at redBus due to the following notable features:

  • Because filtering across visuals is an out-of-the-box feature in QuickSight, a timestamp-based filter is added to the dashboard. This helps in filtering multiple visuals in the dashboard in a single click.
  • URL actions configured on the visuals help the viewers navigate to the context-sensitive in-house applications.
  • Email alerts configured on KPIs and Gauge visuals help the viewers get notifications on time.

Next steps

Apart from building new dashboards for their BI dashboard needs, redBus is taking the following next steps:

  • Exploring QuickSight Embedded Analytics for a couple of their application requirements to accelerate time to insights for users with in-context data visuals, interactive dashboards, and more directly within applications
  • Exploring QuickSight Q, which could enable their business stakeholders to ask questions in natural language and receive accurate answers with relevant visualizations that can help them gain insights from the data
  • Building a unified dashboarding solution using QuickSight covering all their data sources as integrations become available

Conclusion

In this post, we showed you how redBus built its data platform using various AWS services and Apache frameworks, the challenges the platform went through (especially in their BI dashboard requirements and challenges while scaling), and how they used QuickSight and lowered the total cost of ownership.

To know more about engineering at redBus, check out their medium blog posts. To learn more about what is happening in QuickSight or if you have any questions, reach out to the QuickSight Community, which is very active and offers several resources.


About the Authors


Author: Girish Chidanand
Girish Kumar Chidananda
works as a Senior Engineering Manager – Data Engineering at redBus, where he has been building various data engineering applications and components for redBus for the last 5 years. Prior to starting his journey in the IT industry, he worked as a Mechanical and Control systems engineer in various organizations, and he holds an MS degree in Fluid Power Engineering from University of Bath.


Author: Kayalvizhi Kandasamy
Kayalvizhi Kandasamy
works with digital-native companies to support their innovation. As a Senior Solutions Architect (APAC) at Amazon Web Services, she uses her experience to help people bring their ideas to life, focusing primarily on microservice architectures and cloud-native solutions using AWS services. Outside of work, she likes playing chess and is a FIDE rated chess player. She also coaches her daughters the art of playing chess, and prepares them for various chess tournaments.