Tag Archives: Travel and Hospitality

A dive into redBus’s data platform and how they used Amazon QuickSight to accelerate business insights

Post Syndicated from Girish Kumar Chidananda original https://aws.amazon.com/blogs/big-data/a-dive-into-redbuss-data-platform-and-how-they-used-amazon-quicksight-to-accelerate-business-insights/

This post is co-authored with Girish Kumar Chidananda from redBus.

redBus is one of the earliest adopters of AWS in India, and most of its services and applications are hosted on the AWS Cloud. AWS provided redBus the flexibility to scale their infrastructure rapidly while keeping costs extremely low. AWS has a comprehensive suite of services to cater to most of their needs, including providing customer support that redBus can vouch for.

In this post, we share redBus’s data platform architecture, and how various components are connected to form their data highway. We also discuss the challenges redBus faced in building dashboards for their real-time business intelligence (BI) use cases, and how they used Amazon QuickSight, a fast, easy-to-use, cloud-powered business analytics service that makes it easy for all employees within redBus to build visualizations and perform ad hoc analysis to gain business insights from their data, any time, and on any device.

About redBus

redBus is the world’s largest online bus ticketing platform built in India and serving more than 36 million happy customers around the world. Along with its bus ticketing vertical, redBus also runs a rail ticketing service called redRails and a bus and car rental service called rYde. It is part of the GO-MMT group, which is India’s leading online travel company, with an extensive brand portfolio that includes other prominent online travel brands like MakeMyTrip and Goibibo.

redBus’s data highway 1.0

redBus relies heavily on making data-driven decisions at every level, from its traveler journey tracking, forecasting demand during high traffic, identifying and addressing bottlenecks in their bus operators signup process, and more. As redBus’s business started growing in terms of the number of cities and countries they operated in and the number of bus operators and travelers using the service in each city, the amount of incoming data also increased. The need to access and analyze the data in one place required them to build their own data platform, as shown in the following diagram.
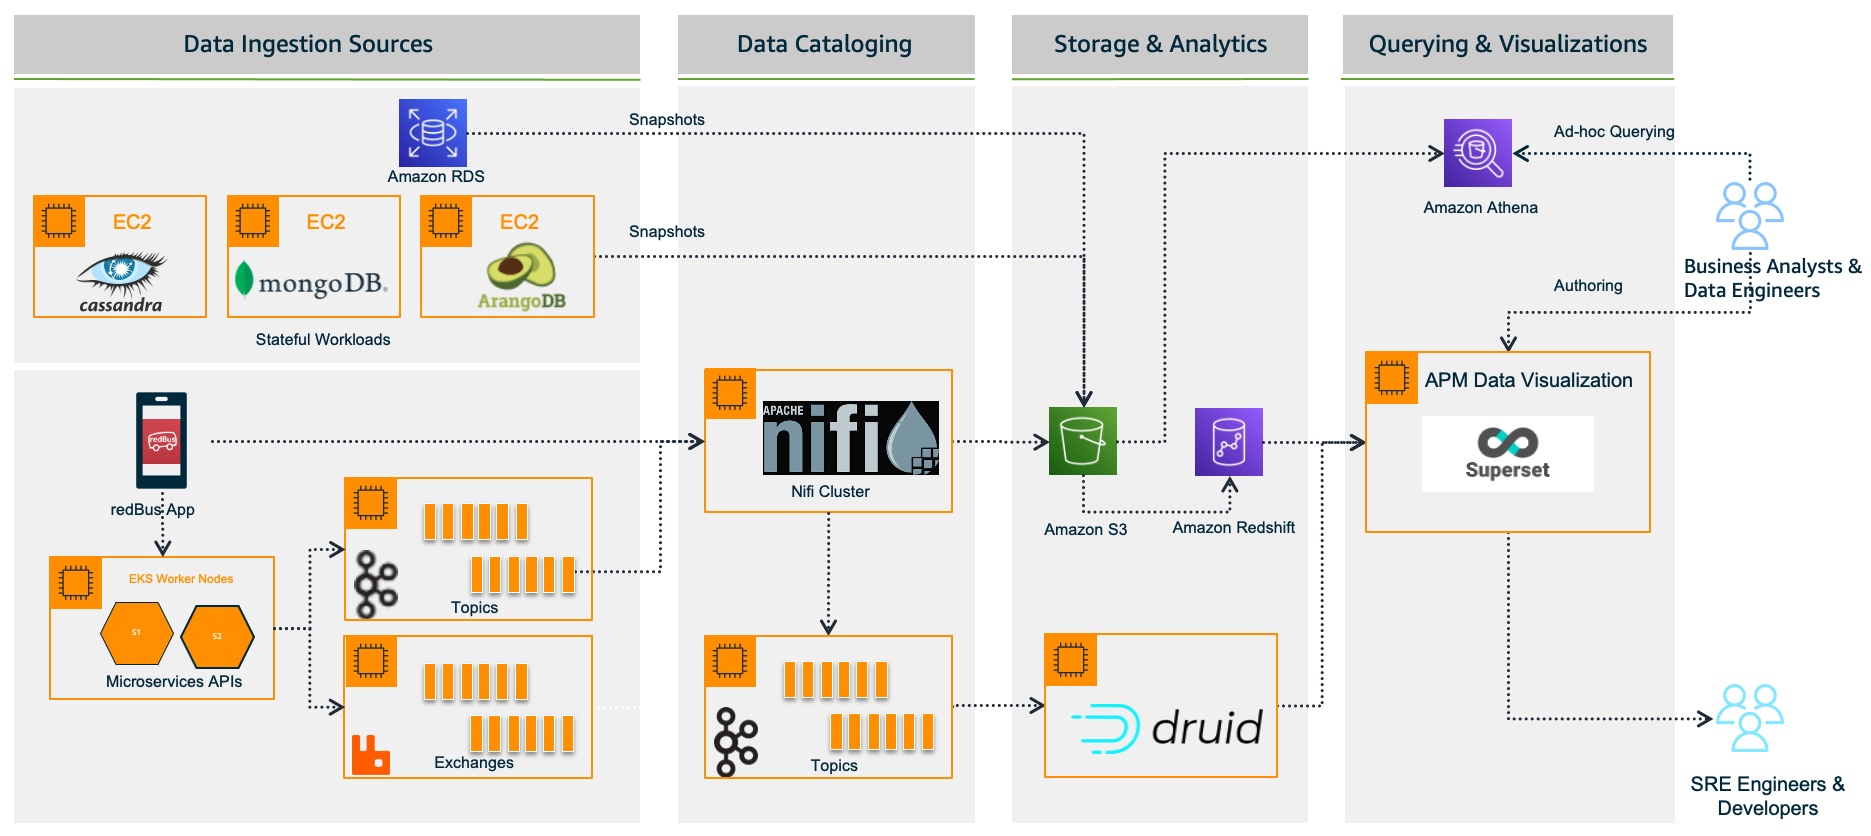
redBus data platform 1.0

In the following sections, we look at each component in more detail.

Data ingestion sources

With the data platform 1.0, the data is ingested from various sources:

  • Real time – The real-time data flows from redBus mobile apps, the backend microservices, and when a passenger, bus operator, or application does any operation like booking bus tickets, searching the bus inventory, uploading a KYC document, and more
  • Batch mode – Scheduled jobs fetch data from multiple persistent data stores like Amazon Relational Database Service (Amazon RDS), where the OLTP data from all its applications are stored, Apache Cassandra clusters, where the bus inventory from various operators is stored, Arango DB, where the user identity graphs are stored, and more

Data cataloging

The real-time data is ingested into their self-managed Apache Nifi clusters, an open-source data platform that is used to clean, analyze, and catalog the data with its routing capabilities before sending the data to its destination.

Storage and analytics

redBus uses the following services for its storage and analytical needs:

  • Amazon Simple Storage Service (Amazon S3), an object storage service that provides the foundation for their data lake because of its virtually unlimited scalability and higher durability. Real-time data flows from Apache Druid and data from the data stores flow at regular intervals based on the schedules.
  • Apache Druid, an OLAP-style data store (data flows via Kafka Druid data loader), which computes facts and metrics against various dimensions during the data loading process.
  • Amazon Redshift, a cloud data warehouse service that helps you analyze exabytes of data and run complex analytical queries. redBus uses Amazon Redshift to store the processed data from Amazon S3 and the aggregated data from Apache Druid.

Querying and visualization

To make redBus as data-driven as possible, they ensured that the data is accessible to their SRE engineers, data engineers, and business analysts via a visualization layer. This layer features dashboards being served using Apache SuperSet, an open-source data visualization application, and Amazon Athena, an interactive query service to analyze data in Amazon S3 using standard SQL for ad hoc querying requirements.

The challenges

Initially, redBus handled data that was being ingested at the rate of 10 million events per day. Over time, as its business started growing, so did the data volume (from gigabytes to terabytes to petabytes), data ingestion per day (from 10 million to 320 million events), and its business intelligence dashboard needs. Soon after, they started facing challenges with their self-managed Superset’s BI capabilities, and the increased operational complexities.

Limited BI capabilities

redBus encountered the following BI limitations:

  • Inability to create visualizations from multiple data sources – Superset doesn’t allow creating visualizations from multiple tables within its data exploration layer. redBus data engineers had to have the tables joined beforehand at the data source level itself. In order to create a 360-degree view for redBus’s business stakeholders, it became inconvenient for data engineers to maintain multiple tables supporting the visualization layer.
  • No global filter for visuals in a dashboard – A global or primary filter across visuals in a dashboard is not supported in Superset. For example, consider there are visuals like Sales Wins by Region, YTD Revenue Realized by Region, Sales Pipeline by Region, and more in a dashboard, and a filter Region is added to the dashboard with values like EMEA, APAC, and US. The filter Region will only apply to one of the visuals, not the entire dashboard. However, dashboard users expected filtering across the dashboard.
  • Not a business-user friendly tool – Superset is highly developer centric when it comes to customization. For example, if a redBus business analyst had to customize a timed refresh that automatically re-queries every slice on a dashboard according to a pre-set value, then the analyst has to update the dashboard’s JSON metadata field. Therefore, having knowledge of JSON and its syntax is mandatory for doing any customization on the visuals or dashboard.

Increased operational cost

Although Superset is open source, which means there are no licensing costs, it also means there is more effort in maintaining all the components required for it to function as an enterprise-grade BI tool. redBus has deployed and maintained a web server (Nginx) fronted by an Application Load Balancer to do the load balancing; a metadata database server (MySQL) where Superset stores its internal information like users, slices, and dashboard definitions; an asynchronous task queue (Celery) for supporting long-running queries; a message broker (RabbitMQ); and a distributed caching server (Redis) for caching the results, charting data, and more on Amazon Elastic Compute Cloud (Amazon EC2) instances. The following diagram illustrates this architecture.
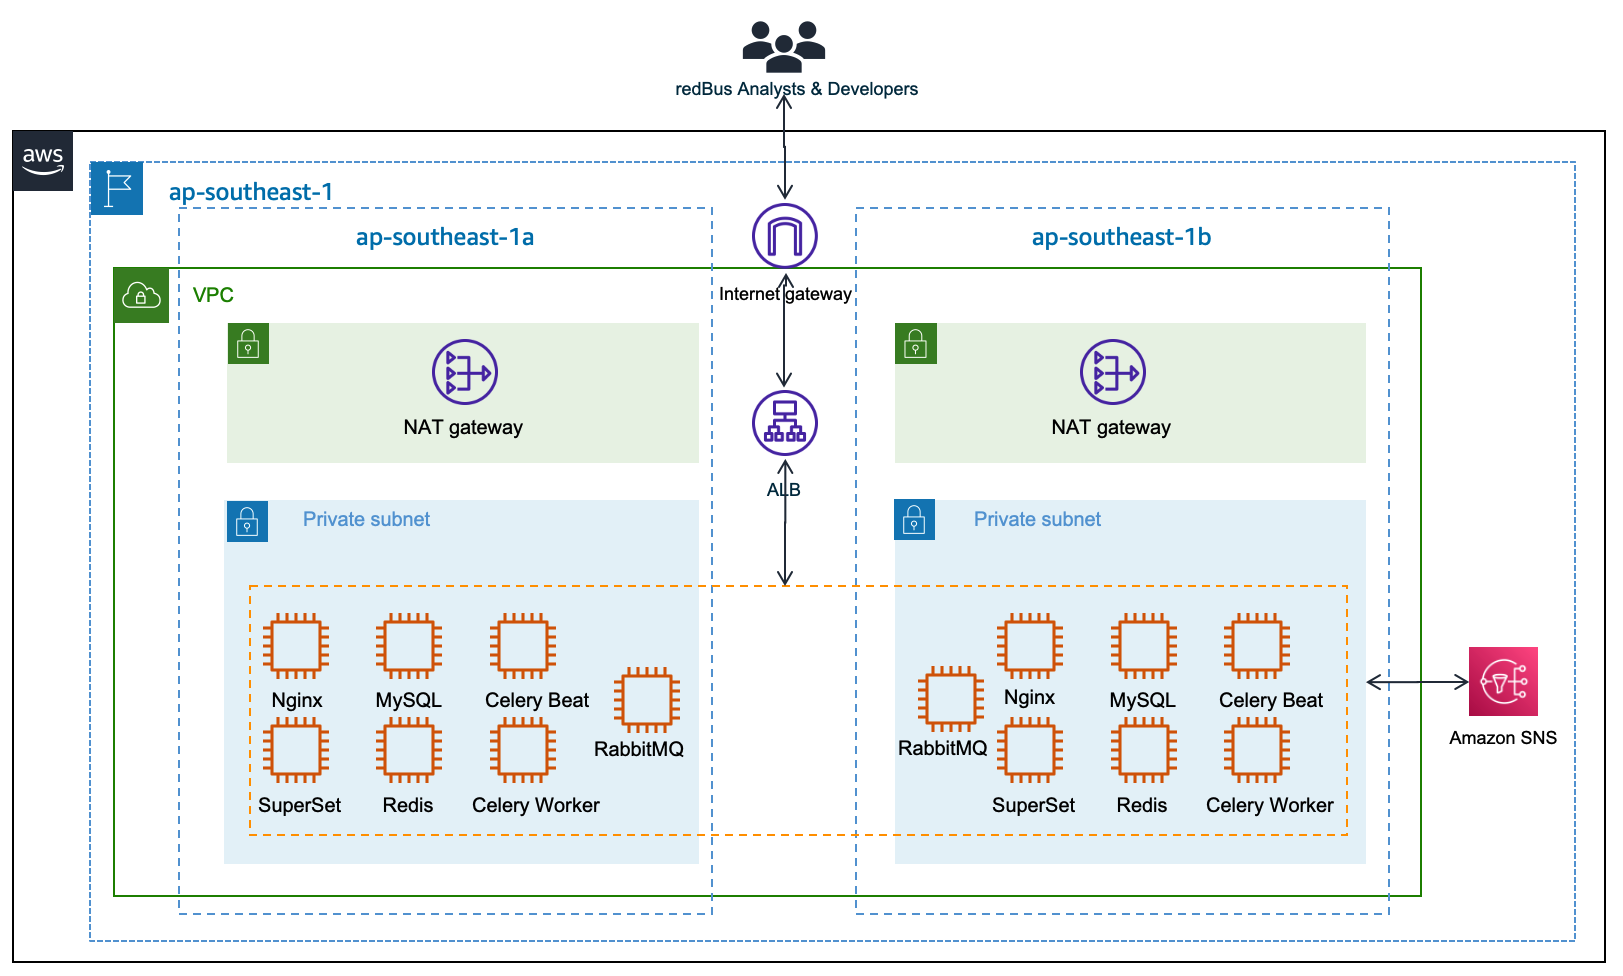
Apache Superset Deploment at redBus

redBus’s DevOps team had to do the heavy lifting of provisioning the infrastructure, taking backups, scaling the components manually as needed, upgrading the components individually, and more. It also required a Python web developer to be around for making the configurational changes so all the components work together seamlessly. All these manual operations increased the total cost of ownership for redBus.

Journey towards QuickSight

redBus started exploring BI solutions primarily around a couple of its dashboarding requirements:

  • BI dashboards for business stakeholders and analysts, where the data is sourced via Amazon S3 and Amazon Redshift.
  • A real-time application performance monitoring (APM) dashboard to help their SRE engineers and developers identify the root cause of an issue in their microservices deployment so they can fix the issues before they affect their customer’s experience. In this case, the data is sourced via Druid.

QuickSight fit into most of redBus’s BI dashboard requirements, and in no time their data platform team started with a proof of concept (POC) for a couple of their complex dashboards. At the end of the POC, which spanned a month’s time, the team shared their findings.

First, QuickSight is rich in BI capabilities, including the following:

  • It’s a self-service BI solution with drag-and-drop features that could help redBus analysts comfortably use it without any coding efforts.
  • Visualizations from multiple data sources in a single dashboard could help redBus business stakeholders get a 360-degree view of sales, forecasting, and insights in a single pane of glass.
  • Cascading filters across visuals and across sheets in a dashboard are much-needed features for redBus’s BI requirements.
  • QuickSight offers Excel-like visuals—tables with calculations, pivot tables with cell grouping, and styling are attractive for the viewers.
  • The Super-fast, Parallel, In-memory Calculation Engine (SPICE) in QuickSight could help redBus scale to hundreds of thousands of users, who can all simultaneously perform fast interactive analysis across a wide variety of AWS data sources.
  • Off-the-shelf ML insights and forecasting at no additional cost would allow redBus’s data science team to focus on ML models besides sales forecasting and similar models.
  • Built-in row-level security (RLS) could allow redBus to grant filtered access for their viewers. For example, redBus has many business analysts who manage different countries. With RLS, each business analyst only sees data related to their assigned country within a single dashboard.
  • redBus uses OneLogin as its identity provider, which supports Security Assertion Markup Language 2.0 (SAML 2.0). With the help of identity federation and single sign-on support from QuickSight, redBus could provide a simple onboarding flow for their QuickSight users.
  • QuickSight offers built-in alerts and email notification capabilities.

Secondly, QuickSight is a fully managed, cloud-native, serverless BI service offering from AWS, with the following features:

  • redBus engineers don’t need to focus on the heavy lifting of provisioning, scaling, and maintaining their BI solution on EC2 instances.
  • QuickSight offers native integration with AWS services like Amazon Redshift, Amazon S3, and Athena, and other popular frameworks like Presto, Snowflake, Teradata, and more. QuickSight connects to most of the data sources that redBus already has except Apache Druid, because native integration with Druid was not available as of December 2022. For a complete list of the supported data sources, see Supported data sources.

The outcome

Considering all the rich features and lower total cost of ownership, redBus chose QuickSight for their BI dashboard requirements. With QuickSight, redBus’s data engineers have built a number of dashboards in no time to give insights from petabytes of data to business stakeholders and analysts. The redBus data highway evolved to bring business intelligence to a much wider audience in their organization, with better performance and faster time-to-value. As of November 2022, it combines QuickSight for business users and Superset for real-time APM dashboards (at the time of writing, QuickSight doesn’t offer a native connector to Druid), as shown in the following diagram.
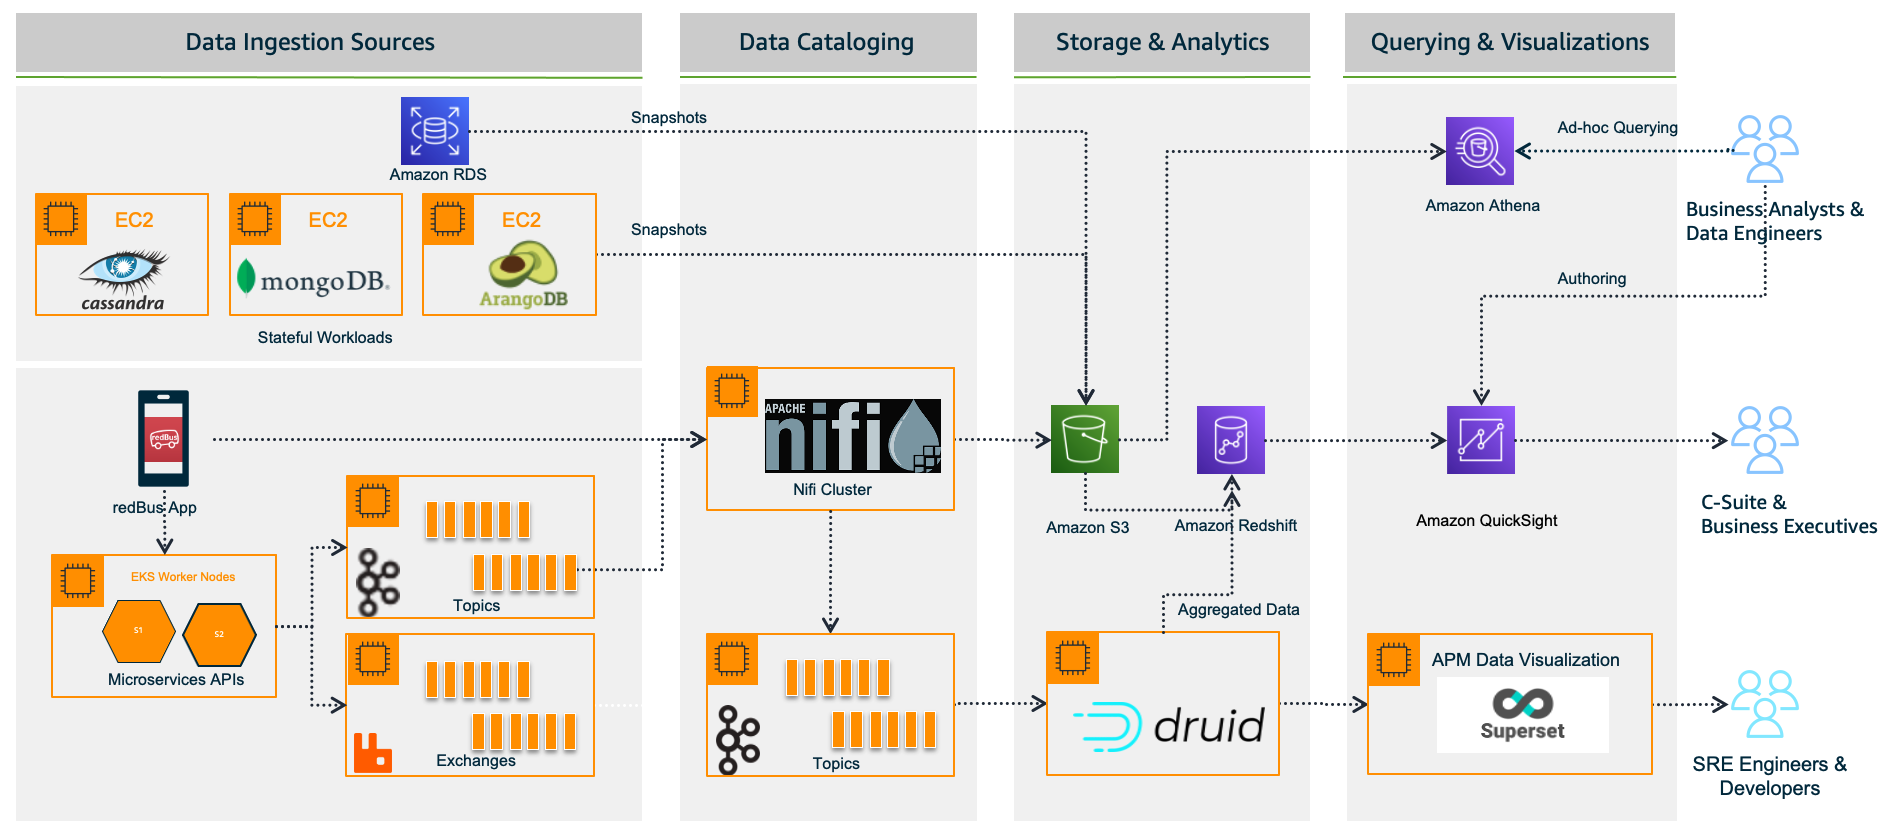
redBus data platform 2.0

Sales anomaly detection dashboard

Although there are many dashboards that redBus deployed to production, sales anomaly detection is one of the interesting dashboards that redBus built. It uses redBus’s proprietary sales forecasting model, which in turn is sourced by historical sales data from Amazon Redshift tables and real-time sales data from Druid tables, as shown in the following figure.
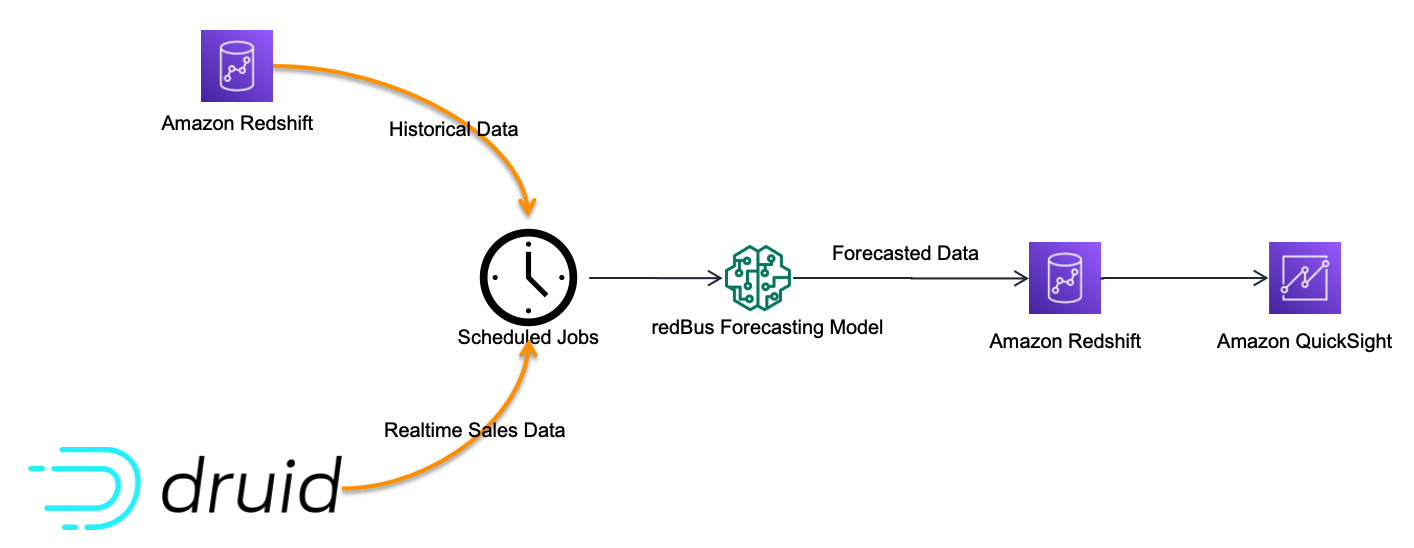
Sales anomaly detection data flow

At regular intervals, the scheduled jobs feed the redBus forecasting model with real-time and historical sales data, and then the forecasted data is pushed into an Amazon Redshift table. The sales anomaly detection dashboard in QuickSight is served by the resultant Amazon Redshift table.

The following is one of the visuals from the sales anomaly detection dashboard. It’s built using a line chart representing hourly actual sales, predicted sales, and an alert threshold for a time series for a particular business cohort in redBus.
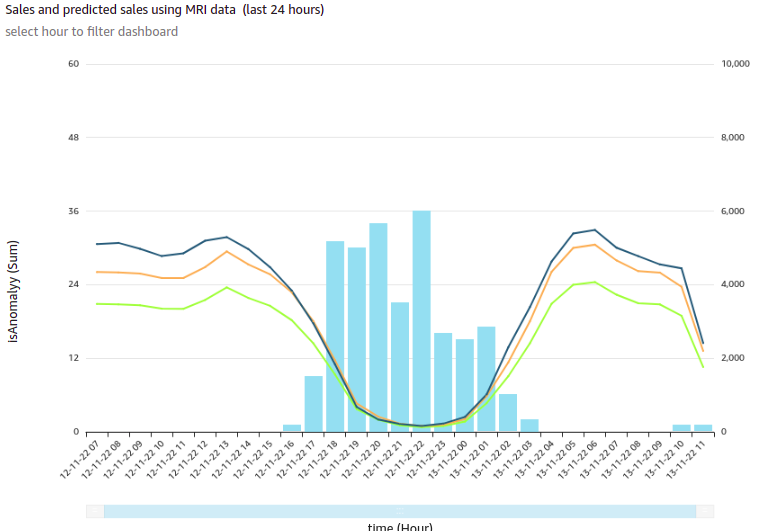
Sales and Predicted Sales for a particular cohort

In this visual, each bar represents the number of sales anomalies triggered at a particular point in the time series.

redBus’s analysts could further drill down to the sales details and anomalies at the minute level, as shown in the following diagram. This drill-down feature comes out of the box with QuickSight.

Drill-Down Chart - Sales and Predicted Sales for a particular cohort

For more details on adding drill-downs to QuickSight dashboard visuals, see Adding drill-downs to visual data in Amazon QuickSight.

Apart from the visuals, it has become one of viewers’ favorite dashboards at redBus due to the following notable features:

  • Because filtering across visuals is an out-of-the-box feature in QuickSight, a timestamp-based filter is added to the dashboard. This helps in filtering multiple visuals in the dashboard in a single click.
  • URL actions configured on the visuals help the viewers navigate to the context-sensitive in-house applications.
  • Email alerts configured on KPIs and Gauge visuals help the viewers get notifications on time.

Next steps

Apart from building new dashboards for their BI dashboard needs, redBus is taking the following next steps:

  • Exploring QuickSight Embedded Analytics for a couple of their application requirements to accelerate time to insights for users with in-context data visuals, interactive dashboards, and more directly within applications
  • Exploring QuickSight Q, which could enable their business stakeholders to ask questions in natural language and receive accurate answers with relevant visualizations that can help them gain insights from the data
  • Building a unified dashboarding solution using QuickSight covering all their data sources as integrations become available

Conclusion

In this post, we showed you how redBus built its data platform using various AWS services and Apache frameworks, the challenges the platform went through (especially in their BI dashboard requirements and challenges while scaling), and how they used QuickSight and lowered the total cost of ownership.

To know more about engineering at redBus, check out their medium blog posts. To learn more about what is happening in QuickSight or if you have any questions, reach out to the QuickSight Community, which is very active and offers several resources.


About the Authors


Author: Girish Chidanand
Girish Kumar Chidananda
works as a Senior Engineering Manager – Data Engineering at redBus, where he has been building various data engineering applications and components for redBus for the last 5 years. Prior to starting his journey in the IT industry, he worked as a Mechanical and Control systems engineer in various organizations, and he holds an MS degree in Fluid Power Engineering from University of Bath.


Author: Kayalvizhi Kandasamy
Kayalvizhi Kandasamy
works with digital-native companies to support their innovation. As a Senior Solutions Architect (APAC) at Amazon Web Services, she uses her experience to help people bring their ideas to life, focusing primarily on microservice architectures and cloud-native solutions using AWS services. Outside of work, she likes playing chess and is a FIDE rated chess player. She also coaches her daughters the art of playing chess, and prepares them for various chess tournaments.

How Shiji Group created a global guest profile store on AWS

Post Syndicated from Maximilian Schellhorn original https://aws.amazon.com/blogs/architecture/how-shiji-group-created-a-global-guest-profile-store-on-aws/

Shiji Group provides global software solutions for the hospitality industry. The Shiji Enterprise Platform enables customers to manage large hotel property portfolios using software as a service (SaaS). Among functionalities such as reservations, housekeeping, finance, and integrations with external systems, the guest profile is a key aspect of the system. Besides personal information (such as name and address) and billing details, the guest profile can include room preferences and entertainment options.

A property portfolio can span multiple hotels across the globe, and each hotel location can offer better customer service by consolidating data. Once the guest gives their cross-border data processing consent (CBDPC), profile information can be shared between properties. This provides a centralized and seamless experience for the hotel guest no matter which hotel in the portfolio was chosen.

In the following blog post, you will explore the architecture of the guest profile store that replicates the profile across multiple geographic areas. We will review the single Region design first and its infrastructure components and architectural patterns. We will then show the evolution to a multi-Region architecture.

Single Region architecture with CQRS

The ability to find relevant guest profile data fast is essential in the day-to-day hospitality business. Therefore, the following architecture uses the command query responsibility segregation (CQRS) pattern to provide high scalability and rich full-text search capabilities without sacrificing performance. With CQRS, write requests (commands) are targeting a different service than read requests (queries). This allows systems to store an item (such as a profile) in a search-optimized format for serving reads, while providing a simple schema for writes.

The microservices for the guest profile architecture are operated as containers on Amazon Elastic Kubernetes Service (Amazon EKS). The write model of the guest profile is stored in an Amazon Relational Database Service (Amazon RDS) PostgreSQL database. A separate read model uses Amazon OpenSearch Service. For interservice communication, Shiji runs a self-managed Apache Kafka cluster on Amazon Elastic Compute Cloud (Amazon EC2).

The following diagram provides a walk through the single Region architecture:

Single Region architecture with CQRS

Figure 1. Single Region architecture with CQRS

  1. The front desk employee creates the Guest Profile upon first interaction with the hotel guest (name, address, billing, and room preferences).
  2. The request is routed to the Kong API Management Solution that is running in an Amazon EKS Kubernetes cluster. It acts as the single entry-point to the system. It identifies the type of request by parsing the URL and forwarding write requests to the profile-write-model-service.
  3. The service validates the request. It stores the data and ProfileCreated event in the PostgreSQL database, Amazon RDS.
  4. A change data capture (CDC) mechanism publishes the ProfileCreated event to an Apache Kafka Local Profiles topic.
  5. The profile-read-model-service subscribes to the Local Profiles topic and stores the profile in an optimized read format in Amazon OpenSearch. Whenever the hotel performs a guest profile search, results will now be provided via the profile-read-model-service.

Multi-Region networking setup

Shiji operates in multiple AWS Regions to provide low latency, regulatory requirements, and resilience across the globe. The previously presented single Region architecture can be replicated to multiple AWS Regions (eu-central-1 and ap-southeast-1, for example). Hotels with a given property portfolio that operate in the same Region can reuse the profile store of the Shiji Enterprise Platform. However, hotels that are being operated in a different AWS Region can be interconnected as well.

This is achieved by providing an AWS Transit Gateway in a separate networking account that connects the different Regions with a VPC attachment:

Multi-Region networking setup

Figure 2. Multi-Region networking setup

The account segregation provides an additional layer of flexibility to add further Regions in the future.

Multi-Region event replication

Upon first arrival, guests can choose to sign a cross-border-data processing consent (CBDPC). This permits the hotel to share the profile information globally. If accepted, the profile-write-model-service creates an additional ProfileCreated event that gets published to a GlobalProfilesEU Apache Kafka topic. This topic is accessible for subscribers in the target Region, which replicates relevant profiles into the local database as follows.

A replicator-service in the target Region (ap-souteast-1) is now able to subscribe to the GlobalProfileEU topic in (eu-central-1), via the established network connection from the previous section. It republishes the event to a local ReplicatedProfiles topic that the profile-write-model-service subscribes to and saves to the local database:

Event replication

Figure 3. Event replication

Putting it all together: The multi-Region guest profile store

The following diagram combines all the components from the previous sections. It provides an end-to-end look at the multi-Region guest profile architecture. Due to the event driven nature of the system, the architecture can be extended without changing the initial flow outlined in the single Region design.

Multi-Region guest profile architecture

Figure 4. Multi-Region guest profile architecture

  1. If the hotel guest signed a cross-border data processing consent (CBDPC), the ProfileCreated event will also be published to a Global Profiles topic.
  2. The replicator-service in the target Region (for example, ap-southeast-1) subscribes to the Global Profiles topic of the source Region (for example, eu-central-1). It then publishes the event to its local Replicated Profiles topic.
  3. The profile-write-model-service in the target Region subscribes to the Replicated Profiles topic and records the item in the Amazon RDS PostgreSQL database with information about the source Region. This will initiate the local replication similar to the single Region design, and therefore creates a consistent experience between both Regions.

Conclusion and outlook

In this blog post, we showed how Shiji built a modern multi-Region microservice architecture on AWS. You have learned about patterns such as CQRS, which provide a scalable solution for both read and write traffic. We’ve also shown what is needed to interconnect two physically separated Regions. With cross-border data processing consent (CBDPC), you have seen how the ownership of guest data can be secured and utilized. The single Region architecture already provided a solid baseline for this solution architecture. The event-driven nature of the system permitted us to add additional functionality for the final multi-Region architecture.

The ability to manage a global guest profile within the main system as well as at the property itself is a huge advantage for enterprise hotel companies. It permits hotels to deliver a unified experience to their guests no matter where the guest is within the hotel or on their journey. Food preferences, spa, room, and more, can all be managed from a single guest profile. This centralized information hasn’t been possible within the hotel’s property management system (PMS) until recently.

Visit Shiji Enterprise Platform for more information.

Volotea MRO Modernization in AWS

Post Syndicated from Albert Capdevila original https://aws.amazon.com/blogs/architecture/volotea-mro-modernization-in-aws/

Volotea is one of the fastest growing independent airlines in Europe, and has increased its fleet, routes, and number of available seats year over year. Volotea has already transported more than 30 million passengers across Europe since 2012, and has bases in 16 European capitals.

The maintenance, repair, and overhaul (MRO) application is a critical system for every airline. It’s used to manage the maintenance, repair, service, and inspection of aircraft. The main goal of an MRO application is to ensure the safety and airworthiness of the aircraft. Traditionally, those systems have been based on monolithic, packaged applications. However, these are difficult to scale and do not offer the benefit of elasticity to adapt to changing demand. Volotea migrated to Amazon Web Services (AWS) to modernize their MRO without refactoring the code. In this blog post, we’ll show you an architecture solution that can be applied to modernize an MRO (or similarly packaged monolithic application) without refactoring, and discuss some considerations.

The challenges with an on-premises MRO solution

Volotea’s MRO software previously ran in an on-premises data center. The system was based on Windows, an outdated database engine, and a virtual desktop system based on Citrix. Costs were fixed, yet MRO usage is typically seasonal. All the interfaces with other systems were based on an outdated communications protocol. This presented security concerns, especially considering that ransomware attacks are an increasing threat.

The main challenge for Volotea was adapting the MRO system to changing business requirements. Seasonal workloads and high impact projects, like changing fleets from Boeing to Airbus, require flexibility. The company also needed to adapt to the changing protocols necessitated by the COVID-19 pandemic, as airlines are one of the most impacted industries in Europe.

Volotea needed to modernize the operating system (OS) and database, simplify the end user application access, and increase the overall platform security, including integration with other applications.

Modernizing the MRO without refactoring

Following Volotea’s cloud strategy, the MRO system was migrated in 2 months to AWS to reduce technology costs and gain higher operational performance, availability, security, and flexibility. The migration was not simply based on a lift-and-shift approach, but used an existing AWS reference architecture for the MRO system. This reference architecture incorporates AWS managed services to modernize the application without incurring refactoring costs.

Figure 1. Volotea MRO deployment in a multi-account architecture

Figure 1. Volotea MRO deployment in a multi-account architecture

As shown in the high-level architecture in Figure 1:

  1. Volotea migrated their servers to Amazon EC2 instances based on Linux, to minimize the OS costs. The database management system is now using an open source engine. Those changes have permitted saving more than €10K yearly in licenses.
  2. The user access technology was migrated to Amazon AppStream 2.0. This is a managed service with increased security, elasticity, and flexibility compared to traditional virtual desktop infrastructure (VDI) solutions. Volotea aligned the cost with the real usage and decreased the TCO by configuring Auto Scaling fleets, reducing the workplace costs by 50%.
  3. AWS Transfer Family was used to centralize the information exchanged with third-party applications, while increasing the security of the communication channel. This managed service enabled the migration of the SFTP, FTPS, and FTP interfaces without the need to manage servers.
  4. To modernize the access of the MRO administrators, AWS Systems Manager Session Manager was used. This provided an ideal browser-based shell access without requiring bastion hosts or opening SSH ports in the Amazon EC2 instances.
  5. The AWS services were linked to Volotea’s user directory using AWS Single Sign-On. This allowed users to authenticate with their corporate credentials, decreasing maintenance costs, and increasing the security.

The application was deployed in Volotea’s AWS Landing Zone, which included the following services:

To make the systems management homogeneous, AWS Systems Manager and AWS Backup offered a single management point for the backup policies, system inventory, and patching.

Incorporating high availability to the MRO

Once this initial modernization is finished, Volotea will use the AWS reference architecture for high availability (HA) to increase resiliency. They’ll configure Amazon EC2 Auto Scaling with application failover to another Availability Zone and the DB native replication mechanisms. This will use Elastic IP addresses to remap the endpoints in a failover scenario. This architecture can be easily implemented in AWS to incorporate HA to applications that do not natively support horizontal scaling.

Conclusion

Volotea successfully modernized its MRO software, which has given them greater flexibility, elasticity, and the increased security of AWS services. They intend to continue with their digital transformation journey. Volotea is increasing its capacity to innovate faster to deliver new digital services more efficiently and with reduced IT costs. The AWS services and strategies discussed in this blog post can be applied to other similarly packaged applications to implement a first level of modernization with little effort and low migration risk.

References:

Using AWS Serverless to Power Event Management Applications

Post Syndicated from Cheryl Joseph original https://aws.amazon.com/blogs/architecture/using-aws-serverless-to-power-event-management-applications/

Most large events have common activities such as event registration, check-in upon arrival, and requesting of amenities. When designing applications, factors such as high availability, low latency, reliability, and security must be considered.

In this blog post, we’d like to show how Amazon Web Services (AWS) can assist you in event planning activities. We’ll share an architecture that follows best practices, and one that can be used in developing other solutions.

Serverless to the Rescue

Serverless architecture enables you to focus on your application development without having to worry about managing servers and runtimes. You can quickly build, fix, and add new features to your applications. A microservices-based approach provides you the ability to scale and optimize each component of your event management application.

Let’s start by looking at some activities that an event guest might perform, and how they might be displayed in a mobile application:

  • Event registration: A guest can register either from a website or from a mobile device, see Figure 1. Events might have heavy traffic initially, or a large push toward the end. This requires building applications that are highly scalable.
Figure 1. Event registration

Figure 1. Event registration

  • Check-In: Check-In can be a manual and cumbersome process – some mobile options are shown in Figure 2. Attendees must queue up to register, pick up badges, receive agendas, and collect other meeting materials.
Figure 2. Guest check-in kiosk

Figure 2. Guest check-in kiosk

  • Guest requests: While the event is underway, a participant might request hand-outs or want to purchase food or beverages, see Figure 3.
Figure 3. Guest requests

Figure 3. Guest requests

  • Session notification: At popular events, there are some sessions that fill up quickly. Guests must queue up to get into the session. Figure 4 shows a notification screen.
Figure 4. Session notification on guest device

Figure 4. Session notification on guest device

Solution overview for event planning

The serverless architecture presented here is highly scalable and provides low latency. It follows the Serverless Application Lens of the AWS Well-Architected Framework. This enables you to build secure, high-performing, resilient, and efficient applications.

Frontend user interface using AWS Amplify

The event website is hosted on AWS Amplify. Amplify provides a fully managed service for deploying and hosting applications with built-in CI/CD workflows. An alternative for hosting the event website could be Amazon Simple Storage Service (S3) or even by provisioning Amazon EC2 instances. However, Amplify is well suited for native mobile apps and JavaScript-based web apps.

The event website uses Amazon Cognito for management of user authentication and authorization. Amazon Cognito is a good choice here as it allows federating with external identity providers.

Backend serverless microservices

The backend of the event management application uses Amazon API Gateway and AWS Lambda. They provide the ability to expose API operations. If the application has a flurry of requests coming in together, the backend serverless microservices will scale up or down seamlessly. However, there are service limits, and it is important to keep these in mind while designing your applications.

Amazon DynamoDB is the NoSQL database, which saves the guest registration data and other event-related information. DynamoDB is a good fit here, as it delivers single-digit millisecond performance at any scale and provides high availability, fault tolerance, and automatic capacity scaling.

Amazon Pinpoint is used to send notifications to guests via email and SMS. Amazon Pinpoint allows your app to connect with customers over channels like email, SMS, push, or voice.

Let’s take a closer look at some of the activities we’ve outlined.

Solution architecture – Event registration and check-in

Figure 5. Event registration and check-in

Figure 5. Event registration and check-in

Numbered items following refer to Figure 5:

  1. Developers upload code to AWS CodeCommit
  2. CodeCommit pushes the code to Amplify
  3. Guests access the website via Amazon Route 53
  4. Route 53 resolves incoming requests and forwards them to Amplify
  5. Guest authentication is performed by Amazon Cognito user pools
  6. Amplify sends the REST API requests to API Gateway
  7. API Gateway uses Amazon Cognito user pools as the authorizer
  8. API Gateway proxies the request to Lambda
  9. Lambda stores guest data in DynamoDB
  10. Lambda uses Amazon Pinpoint to notify the guest

The guest registration process begins with loading the web application hosted on Amplify. The application creates the user in the Amazon Cognito user pool and routes the request to API Gateway to complete the registration process. Amazon Cognito integrates with third-party authentication systems such as Google, Facebook, and Amazon. This allows guests to use their existing social media accounts to register.

The guest check-in process consists of loading a web application onto kiosks. Guest information is saved in a DynamoDB table. Upon registration, a QR code is sent to the guests, then scanned upon arrival at a kiosk. Guest information is then retrieved from a DynamoDB table. This allows guests to print their badges and other event materials.

Well-Architected guidance:

  • Enable active tracing with AWS X-Ray to provide distributed tracing capabilities and visual service maps for faster troubleshooting of the backend APIs.
  • For Lambda functions, follow least-privileged access and only allow the access required to perform a given operation.
  • Throttle API operations to enforce access patterns established by the event management application service contract.
  • Set appropriate logging levels and remove unnecessary logging information to optimize log ingestion. Use environment variables to control application logging level.

Solution architecture – Guest requests

Figure 6. Guest requests

Figure 6. Guest requests

Numbered items refer to Figure 6:

  1. Guests access the website via Route 53
  2. Route 53 resolves incoming requests and forwards them to Amplify
  3. Guest authentication is performed by Amazon Cognito user pools
  4. Amplify sends the REST API requests to API Gateway
  5. API Gateway uses Amazon Cognito user pools as the authorizer
  6. API Gateway proxies the request to Lambda
  7. Lambda validates and stores guest data in DynamoDB
  8. Lambda uses Amazon Pinpoint to notify the guest
  9. Amazon DynamoDB Streams are enabled which triggers a Lambda function
  10. Lambda notifies the employees via Amazon Simple Notification Service (SNS) to fulfill the request

Once a guest request is made for session handouts or food or beverages, it is stored in DynamoDB. DynamoDB Streams are enabled, see Figure 7, which captures a time-ordered sequence of item-level modifications in a DynamoDB table. It durably stores the information for up to 24 hours. This generates an event, which triggers a Lambda function. The Lambda function sends an SNS notification via SMS or email to the event employees who can address the guest requests.

Figure 7. Sample DynamoDB Streams record

Figure 7. Sample DynamoDB Streams record

Well-Architected guidance:

  • Standardize application logging across components, and business outcomes
  • Enable caching on API Gateway to improve application performance
  • Use an On-Demand Instance for DynamoDB when traffic is unpredictable, otherwise use provisioned mode when consistent
  • Amazon DynamoDB Accelerator (DAX) can be used as an in-memory cache to improve read performance

Solution architecture – Session notification

Figure 8. Session notification

Figure 8. Session notification

Numbered items refer to Figure 8:

  1. An Amazon EventBridge rule runs on a schedule and invokes a Lambda function
  2. Lambda retrieves guest and session information from DynamoDB
  3. Lambda notifies the guest via Amazon Pinpoint

Amazon Pinpoint can send notifications to registered guests to let them know when to queue up for the session.

Conclusion

This solution provides a powerful approach for deploying highly scalable applications, while providing low latency and low cost. Build a Serverless Web Application can get you started. Large events require a considerable amount of planning and coordination. We hope the guidance provided here will help you build a scalable and a robust event management application.

Automate thousands of mainframe tests on AWS with the Micro Focus Enterprise Suite

Post Syndicated from Kevin Yung original https://aws.amazon.com/blogs/devops/automate-mainframe-tests-on-aws-with-micro-focus/

Micro Focus – AWS Advanced Technology Parnter, they are a global infrastructure software company with 40 years of experience in delivering and supporting enterprise software.

We have seen mainframe customers often encounter scalability constraints, and they can’t support their development and test workforce to the scale required to support business requirements. These constraints can lead to delays, reduce product or feature releases, and make them unable to respond to market requirements. Furthermore, limits in capacity and scale often affect the quality of changes deployed, and are linked to unplanned or unexpected downtime in products or services.

The conventional approach to address these constraints is to scale up, meaning to increase MIPS/MSU capacity of the mainframe hardware available for development and testing. The cost of this approach, however, is excessively high, and to ensure time to market, you may reject this approach at the expense of quality and functionality. If you’re wrestling with these challenges, this post is written specifically for you.

To accompany this post, we developed an AWS prescriptive guidance (APG) pattern for developer instances and CI/CD pipelines: Mainframe Modernization: DevOps on AWS with Micro Focus.

Overview of solution

In the APG, we introduce DevOps automation and AWS CI/CD architecture to support mainframe application development. Our solution enables you to embrace both Test Driven Development (TDD) and Behavior Driven Development (BDD). Mainframe developers and testers can automate the tests in CI/CD pipelines so they’re repeatable and scalable. To speed up automated mainframe application tests, the solution uses team pipelines to run functional and integration tests frequently, and uses systems test pipelines to run comprehensive regression tests on demand. For more information about the pipelines, see Mainframe Modernization: DevOps on AWS with Micro Focus.

In this post, we focus on how to automate and scale mainframe application tests in AWS. We show you how to use AWS services and Micro Focus products to automate mainframe application tests with best practices. The solution can scale your mainframe application CI/CD pipeline to run thousands of tests in AWS within minutes, and you only pay a fraction of your current on-premises cost.

The following diagram illustrates the solution architecture.

Mainframe DevOps On AWS Architecture Overview, on the left is the conventional mainframe development environment, on the left is the CI/CD pipelines for mainframe tests in AWS

Figure: Mainframe DevOps On AWS Architecture Overview


Best practices

Before we get into the details of the solution, let’s recap the following mainframe application testing best practices:

  • Create a “test first” culture by writing tests for mainframe application code changes
  • Automate preparing and running tests in the CI/CD pipelines
  • Provide fast and quality feedback to project management throughout the SDLC
  • Assess and increase test coverage
  • Scale your test’s capacity and speed in line with your project schedule and requirements

Automated smoke test

In this architecture, mainframe developers can automate running functional smoke tests for new changes. This testing phase typically “smokes out” regression of core and critical business functions. You can achieve these tests using tools such as py3270 with x3270 or Robot Framework Mainframe 3270 Library.

The following code shows a feature test written in Behave and test step using py3270:

# home_loan_calculator.feature
Feature: calculate home loan monthly repayment
  the bankdemo application provides a monthly home loan repayment caculator 
  User need to input into transaction of home loan amount, interest rate and how many years of the loan maturity.
  User will be provided an output of home loan monthly repayment amount

  Scenario Outline: As a customer I want to calculate my monthly home loan repayment via a transaction
      Given home loan amount is <amount>, interest rate is <interest rate> and maturity date is <maturity date in months> months 
       When the transaction is submitted to the home loan calculator
       Then it shall show the monthly repayment of <monthly repayment>

    Examples: Homeloan
      | amount  | interest rate | maturity date in months | monthly repayment |
      | 1000000 | 3.29          | 300                     | $4894.31          |


# home_loan_calculator_steps.py
import sys, os
from py3270 import Emulator
from behave import *

@given("home loan amount is {amount}, interest rate is {rate} and maturity date is {maturity_date} months")
def step_impl(context, amount, rate, maturity_date):
    context.home_loan_amount = amount
    context.interest_rate = rate
    context.maturity_date_in_months = maturity_date

@when("the transaction is submitted to the home loan calculator")
def step_impl(context):
    # Setup connection parameters
    tn3270_host = os.getenv('TN3270_HOST')
    tn3270_port = os.getenv('TN3270_PORT')
	# Setup TN3270 connection
    em = Emulator(visible=False, timeout=120)
    em.connect(tn3270_host + ':' + tn3270_port)
    em.wait_for_field()
	# Screen login
    em.fill_field(10, 44, 'b0001', 5)
    em.send_enter()
	# Input screen fields for home loan calculator
    em.wait_for_field()
    em.fill_field(8, 46, context.home_loan_amount, 7)
    em.fill_field(10, 46, context.interest_rate, 7)
    em.fill_field(12, 46, context.maturity_date_in_months, 7)
    em.send_enter()
    em.wait_for_field()    

    # collect monthly replayment output from screen
    context.monthly_repayment = em.string_get(14, 46, 9)
    em.terminate()

@then("it shall show the monthly repayment of {amount}")
def step_impl(context, amount):
    print("expected amount is " + amount.strip() + ", and the result from screen is " + context.monthly_repayment.strip())
assert amount.strip() == context.monthly_repayment.strip()

To run this functional test in Micro Focus Enterprise Test Server (ETS), we use AWS CodeBuild.

We first need to build an Enterprise Test Server Docker image and push it to an Amazon Elastic Container Registry (Amazon ECR) registry. For instructions, see Using Enterprise Test Server with Docker.

Next, we create a CodeBuild project and uses the Enterprise Test Server Docker image in its configuration.

The following is an example AWS CloudFormation code snippet of a CodeBuild project that uses Windows Container and Enterprise Test Server:

  BddTestBankDemoStage:
    Type: AWS::CodeBuild::Project
    Properties:
      Name: !Sub '${AWS::StackName}BddTestBankDemo'
      LogsConfig:
        CloudWatchLogs:
          Status: ENABLED
      Artifacts:
        Type: CODEPIPELINE
        EncryptionDisabled: true
      Environment:
        ComputeType: BUILD_GENERAL1_LARGE
        Image: !Sub "${EnterpriseTestServerDockerImage}:latest"
        ImagePullCredentialsType: SERVICE_ROLE
        Type: WINDOWS_SERVER_2019_CONTAINER
      ServiceRole: !Ref CodeBuildRole
      Source:
        Type: CODEPIPELINE
        BuildSpec: bdd-test-bankdemo-buildspec.yaml

In the CodeBuild project, we need to create a buildspec to orchestrate the commands for preparing the Micro Focus Enterprise Test Server CICS environment and issue the test command. In the buildspec, we define the location for CodeBuild to look for test reports and upload them into the CodeBuild report group. The following buildspec code uses custom scripts DeployES.ps1 and StartAndWait.ps1 to start your CICS region, and runs Python Behave BDD tests:

version: 0.2
phases:
  build:
    commands:
      - |
        # Run Command to start Enterprise Test Server
        CD C:\
        .\DeployES.ps1
        .\StartAndWait.ps1

        py -m pip install behave

        Write-Host "waiting for server to be ready ..."
        do {
          Write-Host "..."
          sleep 3  
        } until(Test-NetConnection 127.0.0.1 -Port 9270 | ? { $_.TcpTestSucceeded } )

        CD C:\tests\features
        MD C:\tests\reports
        $Env:Path += ";c:\wc3270"

        $address=(Get-NetIPAddress -AddressFamily Ipv4 | where { $_.IPAddress -Match "172\.*" })
        $Env:TN3270_HOST = $address.IPAddress
        $Env:TN3270_PORT = "9270"
        
        behave.exe --color --junit --junit-directory C:\tests\reports
reports:
  bankdemo-bdd-test-report:
    files: 
      - '**/*'
    base-directory: "C:\\tests\\reports"

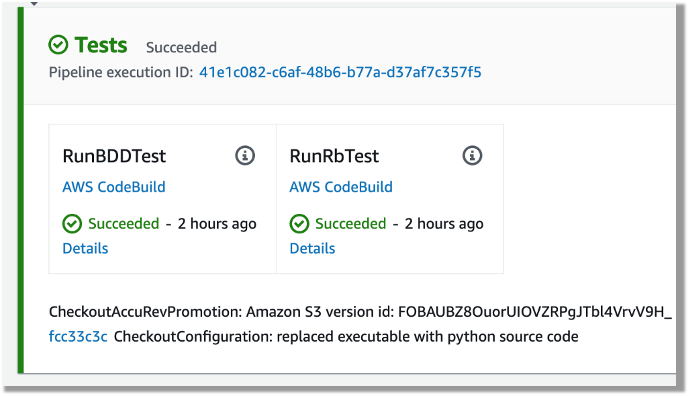
In the smoke test, the team may run both unit tests and functional tests. Ideally, these tests are better to run in parallel to speed up the pipeline. In AWS CodePipeline, we can set up a stage to run multiple steps in parallel. In our example, the pipeline runs both BDD tests and Robot Framework (RPA) tests.

The following CloudFormation code snippet runs two different tests. You use the same RunOrder value to indicate the actions run in parallel.

#...
        - Name: Tests
          Actions:
            - Name: RunBDDTest
              ActionTypeId:
                Category: Build
                Owner: AWS
                Provider: CodeBuild
                Version: 1
              Configuration:
                ProjectName: !Ref BddTestBankDemoStage
                PrimarySource: Config
              InputArtifacts:
                - Name: DemoBin
                - Name: Config
              RunOrder: 1
            - Name: RunRbTest
              ActionTypeId:
                Category: Build
                Owner: AWS
                Provider: CodeBuild
                Version: 1
              Configuration:
                ProjectName : !Ref RpaTestBankDemoStage
                PrimarySource: Config
              InputArtifacts:
                - Name: DemoBin
                - Name: Config
              RunOrder: 1  
#...

The following screenshot shows the example actions on the CodePipeline console that use the preceding code.

Screenshot of CodePipeine parallel execution tests using a same run order value

Figure – Screenshot of CodePipeine parallel execution tests

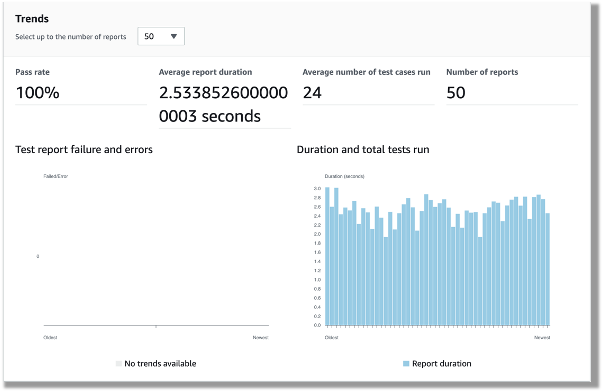
Both DBB and RPA tests produce jUnit format reports, which CodeBuild can ingest and show on the CodeBuild console. This is a great way for project management and business users to track the quality trend of an application. The following screenshot shows the CodeBuild report generated from the BDD tests.

CodeBuild report generated from the BDD tests showing 100% pass rate

Figure – CodeBuild report generated from the BDD tests

Automated regression tests

After you test the changes in the project team pipeline, you can automatically promote them to another stream with other team members’ changes for further testing. The scope of this testing stream is significantly more comprehensive, with a greater number and wider range of tests and higher volume of test data. The changes promoted to this stream by each team member are tested in this environment at the end of each day throughout the life of the project. This provides a high-quality delivery to production, with new code and changes to existing code tested together with hundreds or thousands of tests.

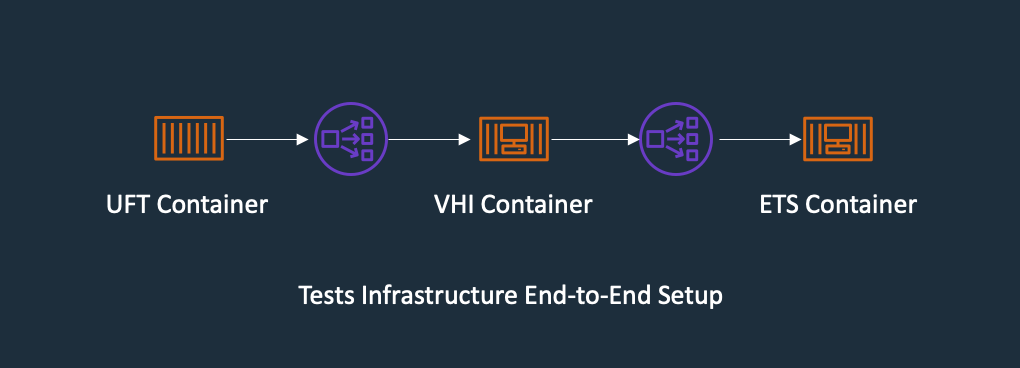
In enterprise architecture, it’s commonplace to see an application client consuming web services APIs exposed from a mainframe CICS application. One approach to do regression tests for mainframe applications is to use Micro Focus Verastream Host Integrator (VHI) to record and capture 3270 data stream processing and encapsulate these 3270 data streams as business functions, which in turn are packaged as web services. When these web services are available, they can be consumed by a test automation product, which in our environment is Micro Focus UFT One. This uses the Verastream server as the orchestration engine that translates the web service requests into 3270 data streams that integrate with the mainframe CICS application. The application is deployed in Micro Focus Enterprise Test Server.

The following diagram shows the end-to-end testing components.

Regression Test the end-to-end testing components using ECS Container for Exterprise Test Server, Verastream Host Integrator and UFT One Container, all integration points are using Elastic Network Load Balancer

Figure – Regression Test Infrastructure end-to-end Setup

To ensure we have the coverage required for large mainframe applications, we sometimes need to run thousands of tests against very large production volumes of test data. We want the tests to run faster and complete as soon as possible so we reduce AWS costs—we only pay for the infrastructure when consuming resources for the life of the test environment when provisioning and running tests.

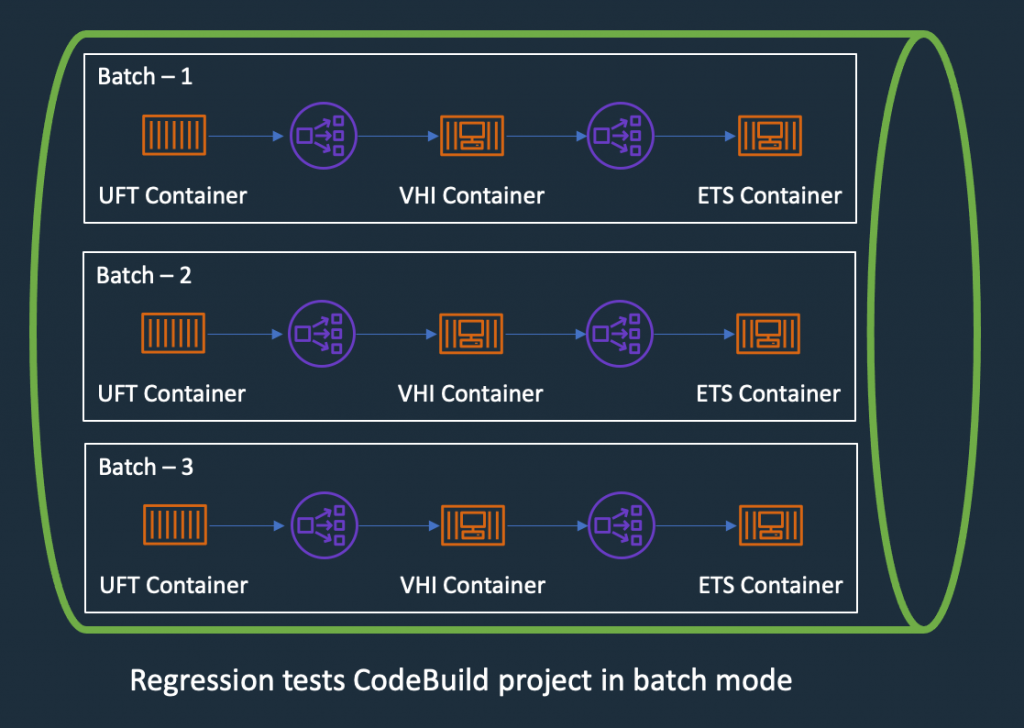
Therefore, the design of the test environment needs to scale out. The batch feature in CodeBuild allows you to run tests in batches and in parallel rather than serially. Furthermore, our solution needs to minimize interference between batches, a failure in one batch doesn’t affect another running in parallel. The following diagram depicts the high-level design, with each batch build running in its own independent infrastructure. Each infrastructure is launched as part of test preparation, and then torn down in the post-test phase.

Regression Tests in CodeBuoild Project setup to use batch mode, three batches running in independent infrastructure with containers

Figure – Regression Tests in CodeBuoild Project setup to use batch mode

Building and deploying regression test components

Following the design of the parallel regression test environment, let’s look at how we build each component and how they are deployed. The followings steps to build our regression tests use a working backward approach, starting from deployment in the Enterprise Test Server:

  1. Create a batch build in CodeBuild.
  2. Deploy to Enterprise Test Server.
  3. Deploy the VHI model.
  4. Deploy UFT One Tests.
  5. Integrate UFT One into CodeBuild and CodePipeline and test the application.

Creating a batch build in CodeBuild

We update two components to enable a batch build. First, in the CodePipeline CloudFormation resource, we set BatchEnabled to be true for the test stage. The UFT One test preparation stage uses the CloudFormation template to create the test infrastructure. The following code is an example of the AWS CloudFormation snippet with batch build enabled:

#...
        - Name: SystemsTest
          Actions:
            - Name: Uft-Tests
              ActionTypeId:
                Category: Build
                Owner: AWS
                Provider: CodeBuild
                Version: 1
              Configuration:
                ProjectName : !Ref UftTestBankDemoProject
                PrimarySource: Config
                BatchEnabled: true
                CombineArtifacts: true
              InputArtifacts:
                - Name: Config
                - Name: DemoSrc
              OutputArtifacts:
                - Name: TestReport                
              RunOrder: 1
#...

Second, in the buildspec configuration of the test stage, we provide a build matrix setting. We use the custom environment variable TEST_BATCH_NUMBER to indicate which set of tests runs in each batch. See the following code:

version: 0.2
batch:
  fast-fail: true
  build-matrix:
    static:
      ignore-failure: false
    dynamic:
      env:
        variables:
          TEST_BATCH_NUMBER:
            - 1
            - 2
            - 3 
phases:
  pre_build:
commands:
#...

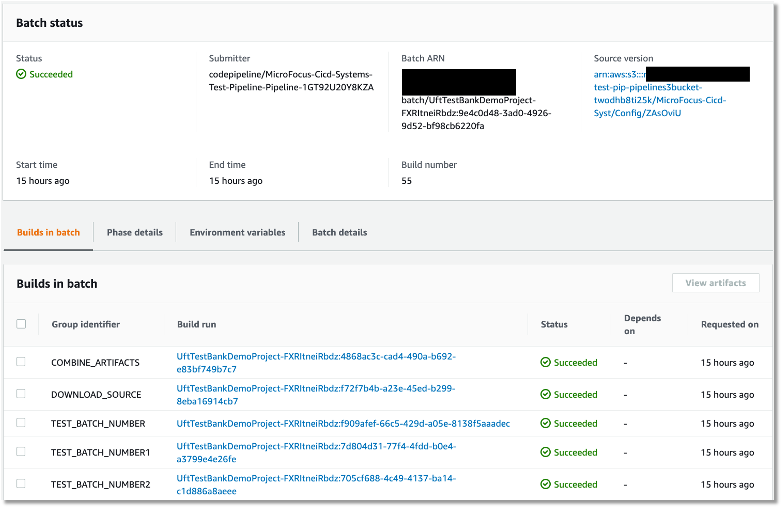
After setting up the batch build, CodeBuild creates multiple batches when the build starts. The following screenshot shows the batches on the CodeBuild console.

Regression tests Codebuild project ran in batch mode, three batches ran in prallel successfully

Figure – Regression tests Codebuild project ran in batch mode

Deploying to Enterprise Test Server

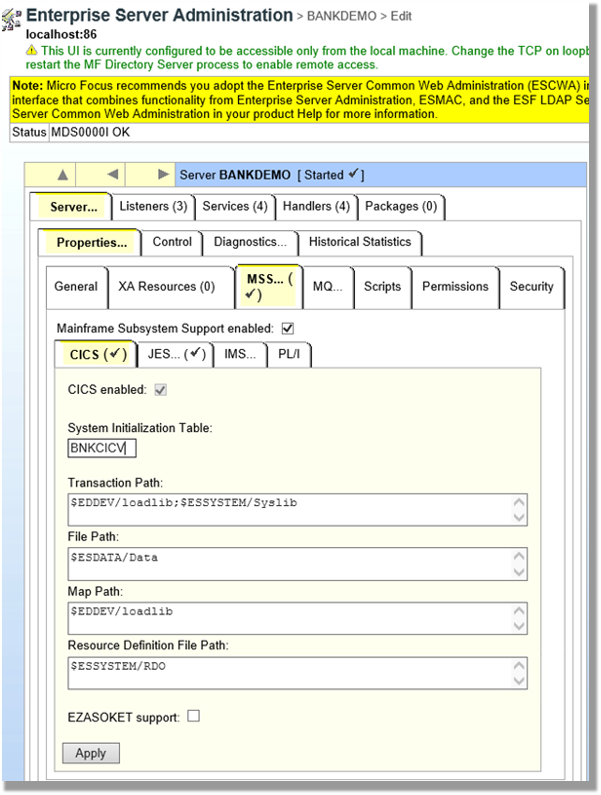
ETS is the transaction engine that processes all the online (and batch) requests that are initiated through external clients, such as 3270 terminals, web services, and websphere MQ. This engine provides support for various mainframe subsystems, such as CICS, IMS TM and JES, as well as code-level support for COBOL and PL/I. The following screenshot shows the Enterprise Test Server administration page.

Enterprise Server Administrator window showing configuration for CICS

Figure – Enterprise Server Administrator window

In this mainframe application testing use case, the regression tests are CICS transactions, initiated from 3270 requests (encapsulated in a web service). For more information about Enterprise Test Server, see the Enterprise Test Server and Micro Focus websites.

In the regression pipeline, after the stage of mainframe artifact compiling, we bake in the artifact into an ETS Docker container and upload the image to an Amazon ECR repository. This way, we have an immutable artifact for all the tests.

During each batch’s test preparation stage, a CloudFormation stack is deployed to create an Amazon ECS service on Windows EC2. The stack uses a Network Load Balancer as an integration point for the VHI’s integration.

The following code is an example of the CloudFormation snippet to create an Amazon ECS service using an Enterprise Test Server Docker image:

#...
  EtsService:
    DependsOn:
    - EtsTaskDefinition
    - EtsContainerSecurityGroup
    - EtsLoadBalancerListener
    Properties:
      Cluster: !Ref 'WindowsEcsClusterArn'
      DesiredCount: 1
      LoadBalancers:
        -
          ContainerName: !Sub "ets-${AWS::StackName}"
          ContainerPort: 9270
          TargetGroupArn: !Ref EtsPort9270TargetGroup
      HealthCheckGracePeriodSeconds: 300          
      TaskDefinition: !Ref 'EtsTaskDefinition'
    Type: "AWS::ECS::Service"

  EtsTaskDefinition:
    Properties:
      ContainerDefinitions:
        -
          Image: !Sub "${AWS::AccountId}.dkr.ecr.us-east-1.amazonaws.com/systems-test/ets:latest"
          LogConfiguration:
            LogDriver: awslogs
            Options:
              awslogs-group: !Ref 'SystemsTestLogGroup'
              awslogs-region: !Ref 'AWS::Region'
              awslogs-stream-prefix: ets
          Name: !Sub "ets-${AWS::StackName}"
          cpu: 4096
          memory: 8192
          PortMappings:
            -
              ContainerPort: 9270
          EntryPoint:
          - "powershell.exe"
          Command: 
          - '-F'
          - .\StartAndWait.ps1
          - 'bankdemo'
          - C:\bankdemo\
          - 'wait'
      Family: systems-test-ets
    Type: "AWS::ECS::TaskDefinition"
#...

Deploying the VHI model

In this architecture, the VHI is a bridge between mainframe and clients.

We use the VHI designer to capture the 3270 data streams and encapsulate the relevant data streams into a business function. We can then deliver this function as a web service that can be consumed by a test management solution, such as Micro Focus UFT One.

The following screenshot shows the setup for getCheckingDetails in VHI. Along with this procedure we can also see other procedures (eg calcCostLoan) defined that get generated as a web service. The properties associated with this procedure are available on this screen to allow for the defining of the mapping of the fields between the associated 3270 screens and exposed web service.

example of VHI designer to capture the 3270 data streams and encapsulate the relevant data streams into a business function getCheckingDetails

Figure – Setup for getCheckingDetails in VHI

The following screenshot shows the editor for this procedure and is initiated by the selection of the Procedure Editor. This screen presents the 3270 screens that are involved in the business function that will be generated as a web service.

VHI designer Procedure Editor shows the procedure

Figure – VHI designer Procedure Editor shows the procedure

After you define the required functional web services in VHI designer, the resultant model is saved and deployed into a VHI Docker image. We use this image and the associated model (from VHI designer) in the pipeline outlined in this post.

For more information about VHI, see the VHI website.

The pipeline contains two steps to deploy a VHI service. First, it installs and sets up the VHI models into a VHI Docker image, and it’s pushed into Amazon ECR. Second, a CloudFormation stack is deployed to create an Amazon ECS Fargate service, which uses the latest built Docker image. In AWS CloudFormation, the VHI ECS task definition defines an environment variable for the ETS Network Load Balancer’s DNS name. Therefore, the VHI can bootstrap and point to an ETS service. In the VHI stack, it uses a Network Load Balancer as an integration point for UFT One test integration.

The following code is an example of a ECS Task Definition CloudFormation snippet that creates a VHI service in Amazon ECS Fargate and integrates it with an ETS server:

#...
  VhiTaskDefinition:
    DependsOn:
    - EtsService
    Type: AWS::ECS::TaskDefinition
    Properties:
      Family: systems-test-vhi
      NetworkMode: awsvpc
      RequiresCompatibilities:
        - FARGATE
      ExecutionRoleArn: !Ref FargateEcsTaskExecutionRoleArn
      Cpu: 2048
      Memory: 4096
      ContainerDefinitions:
        - Cpu: 2048
          Name: !Sub "vhi-${AWS::StackName}"
          Memory: 4096
          Environment:
            - Name: esHostName 
              Value: !GetAtt EtsInternalLoadBalancer.DNSName
            - Name: esPort
              Value: 9270
          Image: !Ref "${AWS::AccountId}.dkr.ecr.us-east-1.amazonaws.com/systems-test/vhi:latest"
          PortMappings:
            - ContainerPort: 9680
          LogConfiguration:
            LogDriver: awslogs
            Options:
              awslogs-group: !Ref 'SystemsTestLogGroup'
              awslogs-region: !Ref 'AWS::Region'
              awslogs-stream-prefix: vhi

#...

Deploying UFT One Tests

UFT One is a test client that uses each of the web services created by the VHI designer to orchestrate running each of the associated business functions. Parameter data is supplied to each function, and validations are configured against the data returned. Multiple test suites are configured with different business functions with the associated data.

The following screenshot shows the test suite API_Bankdemo3, which is used in this regression test process.

the screenshot shows the test suite API_Bankdemo3 in UFT One test setup console, the API setup for getCheckingDetails

Figure – API_Bankdemo3 in UFT One Test Editor Console

For more information, see the UFT One website.

Integrating UFT One and testing the application

The last step is to integrate UFT One into CodeBuild and CodePipeline to test our mainframe application. First, we set up CodeBuild to use a UFT One container. The Docker image is available in Docker Hub. Then we author our buildspec. The buildspec has the following three phrases:

  • Setting up a UFT One license and deploying the test infrastructure
  • Starting the UFT One test suite to run regression tests
  • Tearing down the test infrastructure after tests are complete

The following code is an example of a buildspec snippet in the pre_build stage. The snippet shows the command to activate the UFT One license:

version: 0.2
batch: 
# . . .
phases:
  pre_build:
    commands:
      - |
        # Activate License
        $process = Start-Process -NoNewWindow -RedirectStandardOutput LicenseInstall.log -Wait -File 'C:\Program Files (x86)\Micro Focus\Unified Functional Testing\bin\HP.UFT.LicenseInstall.exe' -ArgumentList @('concurrent', 10600, 1, ${env:AUTOPASS_LICENSE_SERVER})        
        Get-Content -Path LicenseInstall.log
        if (Select-String -Path LicenseInstall.log -Pattern 'The installation was successful.' -Quiet) {
          Write-Host 'Licensed Successfully'
        } else {
          Write-Host 'License Failed'
          exit 1
        }
#...

The following command in the buildspec deploys the test infrastructure using the AWS Command Line Interface (AWS CLI)

aws cloudformation deploy --stack-name $stack_name `
--template-file cicd-pipeline/systems-test-pipeline/systems-test-service.yaml `
--parameter-overrides EcsCluster=$cluster_arn `
--capabilities CAPABILITY_IAM

Because ETS and VHI are both deployed with a load balancer, the build detects when the load balancers become healthy before starting the tests. The following AWS CLI commands detect the load balancer’s target group health:

$vhi_health_state = (aws elbv2 describe-target-health --target-group-arn $vhi_target_group_arn --query 'TargetHealthDescriptions[0].TargetHealth.State' --output text)
$ets_health_state = (aws elbv2 describe-target-health --target-group-arn $ets_target_group_arn --query 'TargetHealthDescriptions[0].TargetHealth.State' --output text)          

When the targets are healthy, the build moves into the build stage, and it uses the UFT One command line to start the tests. See the following code:

$process = Start-Process -Wait  -NoNewWindow -RedirectStandardOutput UFTBatchRunnerCMD.log `
-FilePath "C:\Program Files (x86)\Micro Focus\Unified Functional Testing\bin\UFTBatchRunnerCMD.exe" `
-ArgumentList @("-source", "${env:CODEBUILD_SRC_DIR_DemoSrc}\bankdemo\tests\API_Bankdemo\API_Bankdemo${env:TEST_BATCH_NUMBER}")

The next release of Micro Focus UFT One (November or December 2020) will provide an exit status to indicate a test’s success or failure.

When the tests are complete, the post_build stage tears down the test infrastructure. The following AWS CLI command tears down the CloudFormation stack:


#...
	post_build:
	  finally:
	  	- |
		  Write-Host "Clean up ETS, VHI Stack"
		  #...
		  aws cloudformation delete-stack --stack-name $stack_name
          aws cloudformation wait stack-delete-complete --stack-name $stack_name

At the end of the build, the buildspec is set up to upload UFT One test reports as an artifact into Amazon Simple Storage Service (Amazon S3). The following screenshot is the example of a test report in HTML format generated by UFT One in CodeBuild and CodePipeline.

UFT One HTML report shows regression testresult and test detals

Figure – UFT One HTML report

A new release of Micro Focus UFT One will provide test report formats supported by CodeBuild test report groups.

Conclusion

In this post, we introduced the solution to use Micro Focus Enterprise Suite, Micro Focus UFT One, Micro Focus VHI, AWS developer tools, and Amazon ECS containers to automate provisioning and running mainframe application tests in AWS at scale.

The on-demand model allows you to create the same test capacity infrastructure in minutes at a fraction of your current on-premises mainframe cost. It also significantly increases your testing and delivery capacity to increase quality and reduce production downtime.

A demo of the solution is available in AWS Partner Micro Focus website AWS Mainframe CI/CD Enterprise Solution. If you’re interested in modernizing your mainframe applications, please visit Micro Focus and contact AWS mainframe business development at [email protected].

References

Micro Focus


Peter Woods

Peter Woods

Peter has been with Micro Focus for almost 30 years, in a variety of roles and geographies including Technical Support, Channel Sales, Product Management, Strategic Alliances Management and Pre-Sales, primarily based in Europe but for the last four years in Australia and New Zealand. In his current role as Pre-Sales Manager, Peter is charged with driving and supporting sales activity within the Application Modernization and Connectivity team, based in Melbourne.

Leo Ervin

Leo Ervin

Leo Ervin is a Senior Solutions Architect working with Micro Focus Enterprise Solutions working with the ANZ team. After completing a Mathematics degree Leo started as a PL/1 programming with a local insurance company. The next step in Leo’s career involved consulting work in PL/1 and COBOL before he joined a start-up company as a technical director and partner. This company became the first distributor of Micro Focus software in the ANZ region in 1986. Leo’s involvement with Micro Focus technology has continued from this distributorship through to today with his current focus on cloud strategies for both DevOps and re-platform implementations.

Kevin Yung

Kevin Yung

Kevin is a Senior Modernization Architect in AWS Professional Services Global Mainframe and Midrange Modernization (GM3) team. Kevin currently is focusing on leading and delivering mainframe and midrange applications modernization for large enterprise customers.