The response header, Vary, has been called “the ugliest part of HTTP that we haven't yet improved.” The same post describes it as a “horrible, kludgy mechanism” with “pretty abysmal interoperability” across intermediaries. That is usually where sensible engineers back away slowly with their hands raised.
That’s not exactly an endorsement of Vary, but ugly doesn’t mean useless.
One URL can have more than one correct response. A server might, for example, deliver different image formats to different browsers. If a cache ignores Vary, it risks serving the wrong bytes to a request. But if it treats every raw header value as distinct, a handful of similar requests can spread into thousands of barely reusable cache entries. Vary tells a cache which request fields may affect the response, but it does not tell the cache which differences actually matter.
Vary support is now available in Cache Rules on every plan. The origin still names the request headers that may affect a response, but you decide how Cloudflare handles each one. You can normalize known negotiation headers, pass exact values through when those small differences matter, or bypass cache when the variation is too unpredictable. The origin declares what may vary, and you decide how much variation is actually meaningful for the cache.
How Vary works
Vary is a standard HTTP response header that tells intermediary caches (like Cloudflare) which request fields may affect the response sent by the origin. Sites use Vary to serve different languages, image formats, compression schemes, or regional content from the same URL.
Take one URL that produces two valid representations. A browser requests a webpage:
The origin returns HTML and identifies Accept as a field that may affect the response:
An API client can request the same URL with a different preference:
This time, the correct response is JSON. The Vary: Accept header tells the cache that the URL alone is not enough to choose between responses. The request’s Accept value must also be considered.
Without Vary, whichever response enters the cache first can be served to both clients. If HTML wins, the API client receives markup and its JSON parser fails. If JSON wins, a browser expecting a web page receives an API response.
Vary prevents the cache from serving the wrong response to the requesting client. But it introduces a harder question: when two requests contain different header values, do they actually need different responses?
When correct caching becomes useless
Vary can tell a cache which request fields may affect a response. It does not tell the cache what the response represents. For example, take an origin that serves content in only English, French, and German. A client might send:
While another client might request:
Both requests prefer English here. The origin’s response may map both requests to exactly the same English response. But a cache comparing the raw values cannot safely assume they are equivalent. They have different orders and language tags (that the origin doesn’t differentiate). So the cache may store them as separate variants, even when their response bodies contain identical bytes.
This is Vary’s central problem. Applications often produce a small, finite set of representations from an enormous set of possible request values. The origin understands that thousands of language preferences collapse into three supported languages, while a cache usually does not.
This problem compounds when a response varies on multiple fields. Ten possible values across one field create ten variants. Ten values across three fields can create 1,000 combinations. Real headers can have far greater cardinality: User-Agent values are numerous, cookies can be unique to individual visitors, and preference headers can differ in ordering, formatting (spaces and tabs matter!), and quality values.
The result is a cache that can be perfectly correct and almost permanently cold (an entry never reused). Identical responses can be scattered across entries that receive too little traffic to remain hot and in cache. They can consume capacity, evict one another, reduce cache hit ratios, and send more requests back to origin servers. Eviction can remove cold entries, but it cannot merge them just because the responses are identical.
An analysis of more than 120 million responses from nearly 50,000 popular sites found almost 3,000 sites varying on four or more fields. Some varied on 10, 23, or even 47 fields. We want to make sure that customers have the tools they need to use Vary when appropriate, but not so much that they create a useless cache.
Some high-cardinality variation is deliberate. CDNs or reverse proxies may inject values, such as a geographic region, to partition content predictably. That works when the possible values are controlled and every component agrees on their meaning. Without those constraints, the cache fragments into variants it may never reuse.
That was the design problem we needed to solve to support Vary. We needed to preserve enough variation to serve the right response, without allowing incidental differences between requests to destroy cache efficiency.
How Cache Rules control Vary
Cloudflare customers already had several ways to handle negotiated content similar to Vary. They could bypass cache and let their origin deal with it, reproduce the origin's negotiation logic in a custom cache key or other rule, use a Worker, or use features like Vary for images.
Those options remain useful, but they either give up caching, duplicate application logic, need to write additional code, or address a narrower use case. Vary in Cache Rules may fill the gap between these existing features by splitting support into two decisions:
The origin uses Vary to identify the request headers that may affect a response.
The Cache Rule determines how Cloudflare handles the value of each header.
A Cache Rule does not force every response to vary. If the origin does not return Vary, Cloudflare caches the response normally, though the rule may still rewrite Accept and Accept-Language before forwarding the request to the origin.
When the origin does return Vary, Cloudflare uses the configured action for each header it names. Headers without an individual setting use the rule’s default action. The three available actions are:
We recommend normalize as the default. For individual headers with personal or unbounded values, use bypass. Use passthrough when the exact value changes the response.
For example, passthrough preserves distinctions in casing, whitespace, ordering, and duplicate values, even when the origin treats them as equivalent. With Vary: X-View and passthrough, these three values produce separate cache keys:
X-View: compact,full
X-View: Compact,full
X-View: compact, full
Enough incidental variation can turn a reusable response into many one-off variants in your cache.
Regardless of the configured actions, Vary: * always bypasses cache. It means any aspect of the request, even information outside the HTTP message (like the client’s IP address), may affect which response the origin selects. Cloudflare therefore cannot reuse the response for a later request without contacting the origin.
How a response moves through cache
Let’s follow one of the /catalog requests from above through Cloudflare.
On the first request, Cloudflare has no stored Vary data for the resource, so the cache lookup misses. The matching Cache Rule can normalize configured fields before Cloudflare contacts the origin.
This can happen before Cloudflare knows whether the eventual response will contain Vary. The Cache Rule defines the permitted normalization; the response later determines whether those fields become part of the cached variant.
That ordering matters. If Cloudflare grouped several raw values under one normalized cache key, but the origin still received those raw values, the origin could produce different responses that the cache would later consider interchangeable. Forwarding the normalized value keeps origin selection aligned with cache matching.
The origin responds with:
Vary: Accept, Accept-Language
Cloudflare records those header names and stores the response as a cached variant. The header values, processed according to the Cache Rule, distinguish this variant from others for the same resource.
When another request for /catalog arrives, Cloudflare starts with the resource’s base cache key: generally the URL plus any other configured key fields. It then reads the stored Vary fields and applies the Cache Rule to those headers in the new request to identify the matching cached variant.
Suppose they normalize to:
Accept: text/html
Accept-Language: en,fr
Cloudflare uses those values to look up the matching cached variant directly. It does not compare the request against every stored variant one by one.
If a matching variant exists and is fresh, the request is a cache hit. If not, Cloudflare sends the request to the origin and may store the resulting response as another variant.
The origin response closes the loop. For each header named in Vary, Cloudflare uses the action configured for that header, or the rule’s default action if the header is not listed individually:
If it does not contain Vary, Cloudflare caches it normally.
If every named header resolves to normalize or passthrough, Cloudflare can store the response as a cached variant.
If any named field uses bypass, Cloudflare does not store the response.
If the response contains Vary: *, Cloudflare does not store it.
This places an important responsibility on the origin. Every cacheable response that can differ based on request fields must return the appropriate Vary header consistently, including errors and fallback responses. If one response omits it, Cloudflare could cache that response without the variance needed to keep it isolated.
The cache keys in the diagram are conceptual. The later request assumes a fresh cached response.
Any purge targeting a cached resource covers all its Vary variants. Existing requirements for purging custom cache keys still apply.
Changing a Vary configuration does not automatically purge existing content. The new policy may produce different cache keys: requests can miss and refill under the new keys, while old entries remain until they expire or are purged.
Normalization keeps equivalent requests together
Remember the requests from above asking for English and French?
Accept-Language: en-US, fr;q=0.8
Accept-Language: fr;q=0.8, en-GB
Both requests prefer English, but passthrough would treat them as different variants. If the Cache Rule allows en, fr, and de, normalize reduces both to en,fr, allowing them to share a cached response.
To do this, Cloudflare lowercases values in Accept, Accept-Language, and Accept-Encoding, then sorts them by quality value, the highest first, with alphabetical ordering to break ties. The client’s ordering therefore does not affect the cache key. After sorting, Cloudflare strips parameters from entries with a nonzero quality value. It can also lose q=0 (“not acceptable”) when shortening language tags or filtering to the configured formats and languages. For example, en-US;q=0 can become en. Use passthrough for Accept or Accept-Language if the origin needs to see those exclusions.
You can also configure the rule to keep only specified media types or languages in Accept and Accept-Language. Regional language tags such as en-US reduce to their base language, en, unless the full tag is configured. This lets you align normalization with the formats and languages your origin actually serves.
To keep origin selection aligned with cache matching, Cloudflare forwards the normalized Accept and Accept-Language values to the origin. It also forwards normalizedAccept-Encoding values when Respect Strong ETags is enabled. Other headers are normalized only for cache matching.
Configure Vary in Cache Rules
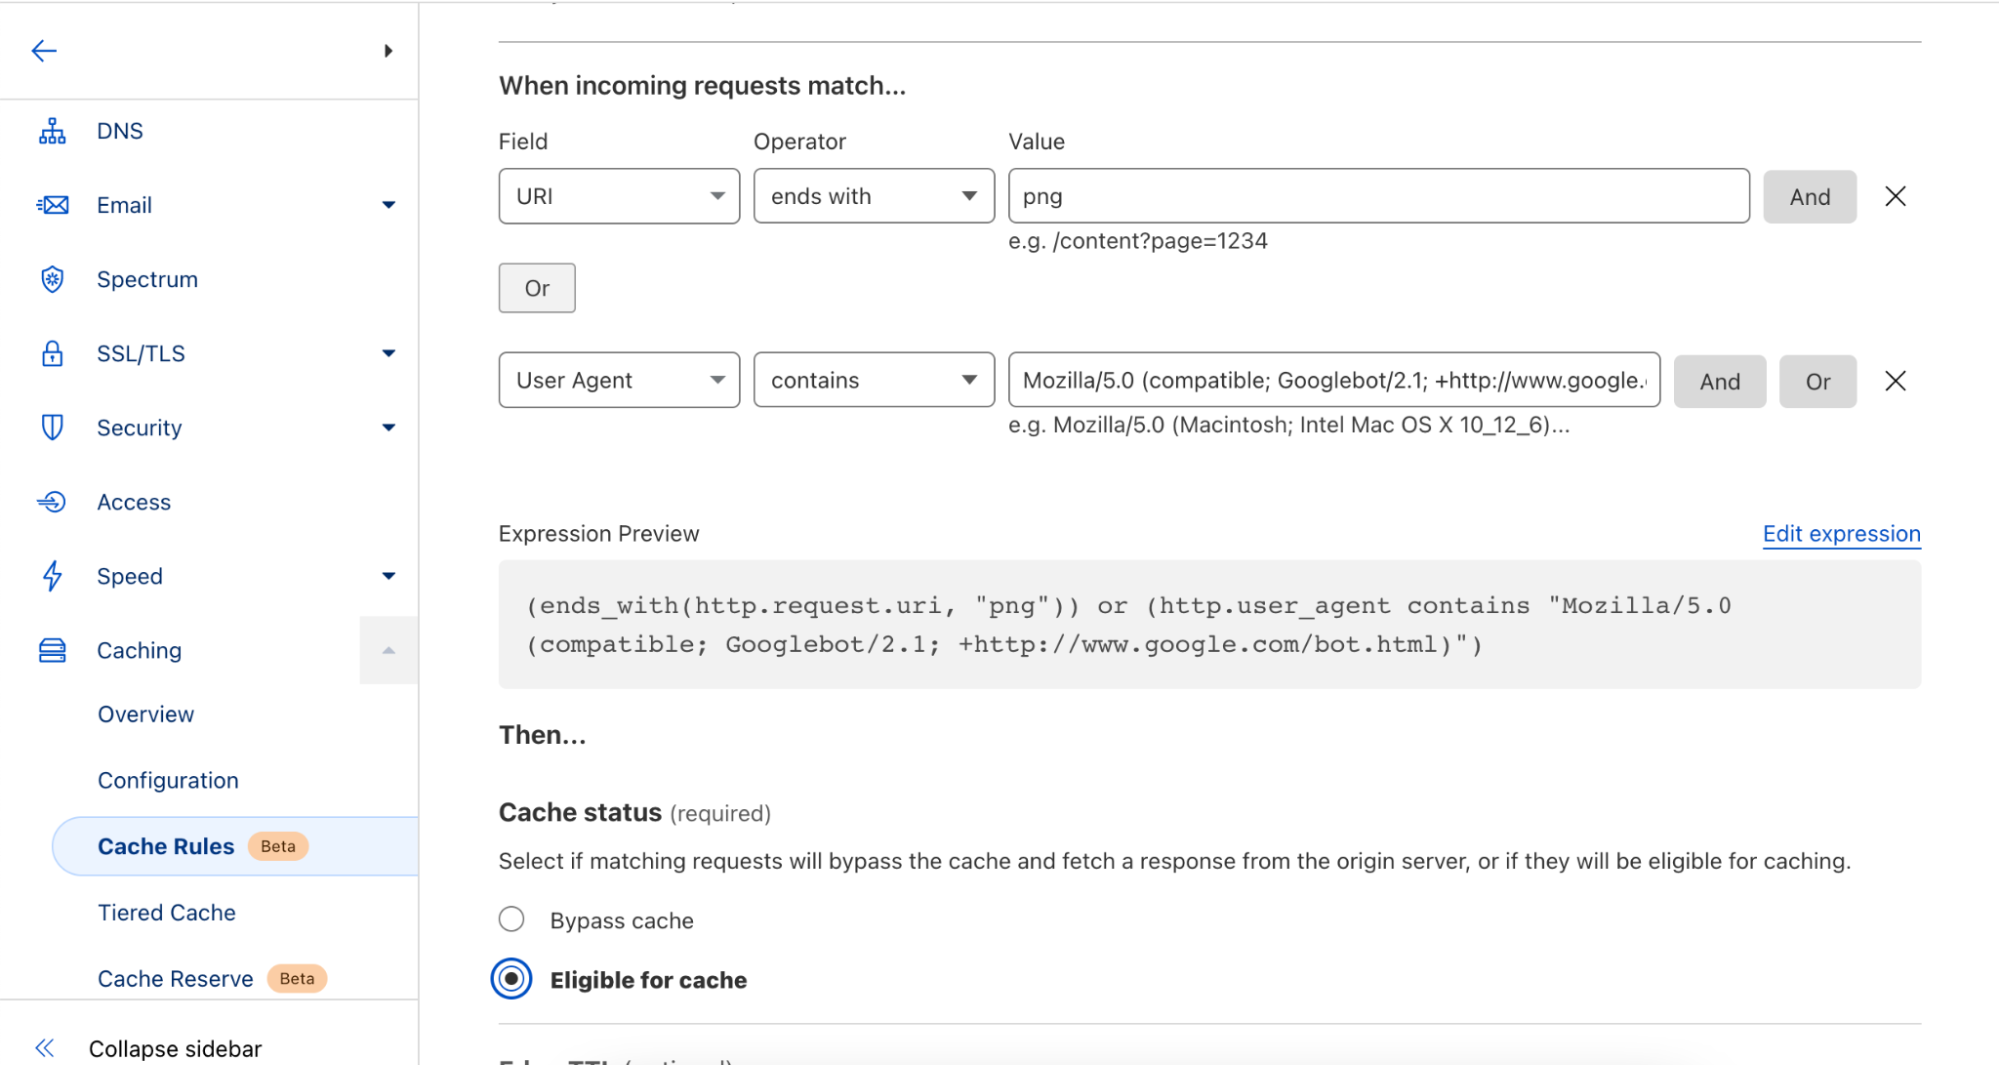
In the Cloudflare dashboard, go to Caching > Cache Rules, create or edit a rule, make the response eligible for cache, and add the Vary setting. Set the default behavior, then add the headers your origin is expected to name.
The same configuration is available through the Rulesets API in the http_request_cache_settings phase. The default setting chooses a fallback action for headers your origin names in Vary that you have not configured individually.
This example normalizes Accept and Accept-Language to a configured set of formats and languages. The default normalize action also applies to other headers named in Vary:
This is a complete request body for a PUT to the http_request_cache_settings phase entrypoint. A PUT replaces every rule in that entrypoint. If you already have Cache Rules, include them in the rules array or use the appropriate single-rule create or update operation instead.
If the origin serves one representation for each media type and language pair, there are six content combinations. That does not cap the cache at six keys. Preference order, missing headers, and values that normalize to empty can create more. Keep the supported set small and define the rule’s boundaries clearly. After rollout, test the same URL with different header values that should normalize to the same cached variant. Send the test requests from the same client, confirm they return the expected format and language, and inspect CF-Cache-Status. Look for hits once the cache is populated, and investigate persistent miss responses or unexpected bypass responses.
For limitations, additional examples, and how to set this in Terraform, see the Vary documentation.
Why not use a custom cache key?
At this point, an obvious question is, “why not add Accept and Accept-Language to a custom cache key?”
That works when those fields are always part of the resource’s identity. But a custom cache key adds the configured dimensions to every response covered by the rule, whether the origin used them or not.
Vary is response-driven, but cacheable responses under the same base key need a consistent set of Vary fields.
Use a custom cache key when a request property always defines the resource. Use Vary when the origin declares the same set of request fields across cacheable responses. Avoid placing the same header in both unless the duplication is deliberate and tested.
Use Vary in Cache Rules today!
Vary helps solve an obvious problem: one URL can have more than one correct response. But it hands a cache a harder problem, which request differences actually matter? The origin knows which responses it can serve. The cache needs to know which requests can reuse each response.
Vary in Cache Rules connects those two views. The origin identifies the request fields that may affect a response. You decide whether to normalize values, use passthrough for exact differences, or keep the response out of cache.
Vary was never too ugly to be useful. But configuring supported formats and languages manually may not suit every application. We’re evaluating whether ideas from the expired Availability Hints draft could reduce that work by letting origins describe the representations they serve directly.
Memory costs are increasing dramatically. Both RAM and hard disk drive prices have exploded over the past year. At Cloudflare, we run several massively distributed storage products (including our famous CDN) that rely on making efficient use of the memory we have deployed so we can continue to serve all of our customers.
With this in mind, we prototyped a way to expand effective cache capacity. By encoding eligible assets with Zstandard inside Pingora, the architecture trades a minor CPU increase for significant storage and cross-data center bandwidth savings.
We have been prototyping a system called Cache Transcoding, which I built during my internship at Cloudflare as part of the 1.1.1.1 Intern Program. When an eligible response enters the cache, we encode it using Zstandard, or zstd, before writing it to disk. We keep that compressed form while the asset lives in the cache and moves between data centers via Tiered Cache, then decode it before serving the response to the client.
In our initial testing, this encoding shrunk eligible assets to ⅓ of their original on-disk size on average. The estimated extra CPU cost in our origin-facing proxy was small, but that is the trade. A small increase in CPU gives Cloudflare petabytes of effective cache capacity and reduces the data transferred between our data centers. The encoding cost is paid once when an asset enters the cache. The storage and bandwidth savings continue every single time that asset is reused.
What is Zstandard?
Zstandard, or zstd, is a lossless compression algorithm developed by Yann Collet at Facebook and open sourced in 2016. Lossless means that after compressed data is decoded, every byte is identical to the original. We can change how an asset is represented on disk without changing the asset itself.
Zstd is designed to balance compression ratio with speed. In our earlier browser compression testing, it compressed data 42% faster than Brotli while producing nearly the same file size, and produced files 11.3% smaller than gzip at a comparable speed. That balance matters because Cache Transcoding would touch a large amount of traffic, so both encoding and decoding need to stay fast.
The prototype uses zstd level 3, giving us most of the compression benefit without turning cache fills into a CPU bottleneck.
Cloudflare traditionally stores an asset using the content encoding supplied by its origin. If an origin sends an uncompressed response, we store those uncompressed bytes on disk and transfer them between data centers in the same form. Cache Transcoding adds compression inside the cache itself.
Not everything is worth compressing
Transcoding does not mean compressing everything. Images, video, and fonts are usually compressed already. In our traffic sample, this media slice represented 21.4% of requests but 63.3% of bytes. Compressing it again would burn CPU for nothing.
Compressible text is different. HTML, JSON, CSS, and JavaScript represented 67.3% of requests and 22.3% of bytes. Within that text slice, approximately 71% arrived uncompressed with Content-Encoding unset and it compresses well.
In our controlled test corpus, the eligible assets compressed by roughly 2.8 times.
Encoding is more expensive per byte, but assets are served far more often than they are filled.
By changing how assets are represented, existing hardware could store more customer content.
Fewer bytes on disk mean each server can retain more objects. This increases cache density and reduces the likelihood that useful content is evicted because an uncompressed representation consumed more space than necessary.
The smaller representation also helps as an asset moves through Tiered Cache because it reduces the data transferred between Cloudflare data centers, making backbone usage more efficient.
Paying the compression cost once
Compression is never free. Encoding and decoding both use CPU, so the important question is whether the byte savings are worth the processing cost.
At zstd level 3 (often the default balance of speed and compression size output), our model kept the extra CPU cost to a few percent under the traffic and reuse assumptions we tested.
We initially considered limiting transcoding to popular content, since hot assets are reused more, but it did not help. Decoding happens every time an asset is served, so limiting the feature to only the hottest content reduced the storage saving without cutting CPU by the same amount.
The simpler policy performed better. Transcoding all eligible compressible text at or above 4 kibibytes (KiB) captured nearly all of the measured storage benefit, while remaining within the CPU budget.
How Cache Transcoding works
On a cache miss, our Pingora-based proxy encodes the body using zstd before writing it to disk. The cache metadata records that the stored representation is compressed and preserves the original content length. Before the response leaves the proxy, the body is decoded back to its original identity representation.
On a cache hit, the stored zstd object is read from disk and decoded. With Tiered Cache, the compressed representation is transferred from the upper tier to the lower tier in the compressed form. Decoding only happens on the client-facing hop.
On a full cache miss, the upper tier fetches identity bytes from the origin. Those bytes are encoded once, stored as zstd, and transferred to the lower tier in their compressed form. The lower tier also stores the zstd representation, then decodes it for the request path.
If the lower tier misses but the upper tier already has the object, the origin is not involved. The compressed object moves directly between the cache tiers. It remains compressed on the wire and on disk, then is decoded once at the lower tier.
If the lower tier already has the object, no network transfer or encoding is needed. The lower tier reads the zstd bytes from disk, decodes them, and passes the original asset onward.
The storage encoding marker prevents an object from being encoded more than once. A cache layer receiving an object from another tier can see that it is already stored using zstd, and preserve it in that form.
Why we only transcode certain text
The fastest compression operation is the one we do not need to perform. Cache Transcoding therefore uses a series of eligibility checks to avoid content that is unlikely to benefit.
The prototype only transcodes a 200 OK response when Content-Encoding is unset, the Content-Type is compressible text, and the response has a known Content-Length of at least 4 KiB. Slice subrequests, responses using active upstream compression, range requests, precompressed responses, unknown length bodies, and binary content remain unchanged.
The 4 KiB threshold removed a large number of tiny requests while leaving out only about 1% of the otherwise eligible bytes. Lowering it would add per-object overhead without saving much more storage.
The threshold and zstd level are both parameters rather than permanent limits. We started with zstd level 3 and a 4 KiB minimum because they gave us a conservative way to measure the architecture. With the initial CPU budget understood, we can test whether higher compression levels improve the ratio enough to justify their additional cost.
Testing over one million requests through the cache
We exercised the prototype against a controlled test zone and correlated each request across request logs, Prometheus metrics, and Jaeger traces.
The correctness campaign covered cache misses, cache hits, single-hop fills, Tiered Cache fills, and more. We varied cache keys to make each request follow a specific path and used traces to confirm where encoding and decoding occurred.
One performance campaign sent more than a million requests across 10 cache servers. Half of the campaign ran with Tiered Cache disabled and the other half with it enabled. This allowed us to measure local cache behavior separately from transfers between cache tiers.
The two assets were approximately 195 KiB and 272 KiB, and both compressed by roughly 2.8 times. This was deliberately a compressible test corpus. It gave us a clear signal for validating the architecture, but it does not represent every text object on the Internet. A broader corpus is required before treating the measured compression ratio as a fleet-wide constant.
Compress once, benefit many times
What this experiment showed us is that there are significant efficiencies we can still deploy across our caching service that can benefit all of our customers. What we built for Cache Transcoding shows that the trade is favorable under the conditions we tested. The architecture preserved the content and remained within the CPU budget.
For next steps, we plan to evaluate higher zstd levels, test a broader range of content types and object sizes, tune different parameters from the eligibility criteria and more. Future work can also examine range requests, pre-compressed origin responses, and passing the compressed object directly to downstream components that already support it without decoding.
Throughout my internship, I’ve had the wonderful opportunity to work alongside Cloudflare's engineering teams on the real infrastructure that stores and serves content across our global network. If you want to start your career by helping build a better Internet, explore our internship opportunities and job openings.
As of June 23, 2026, cdnjs, one of the Internet's busiest open-source CDNs, is running exclusively on Cloudflare’s Developer Platform. Along the way, cdnjs surfaced limits in the platform, and the platform grew to meet them.
cdnjs is a free, open-source content delivery network for JavaScript and CSS libraries. Instead of using a bundler or self-hosting jQuery, Bootstrap, or Lodash, you drop a <script> tag pointing to cdnjs.cloudflare.com and the library loads from Cloudflare's edge, instantly, anywhere in the world, with no signup, no API keys, and no rate limits. It's the infrastructure behind a significant portion of “intro to JavaScript” tutorials, CodePen demos, and Stack Overflow answers.
Community-driven, cdnjs is used on roughly 12% of all websites, a 48.3% share of the JavaScript CDN market. It serves an average of 108,000 requests per second, 9 billion per day, across more than 330 Cloudflare data centers, with a 98.6% cache hit rate. Pretty cool, Internet!
In 2011, when bundlers were exotic, npm was barely a year old, and "just drop a <script> tag" was how the web shipped JavaScript, Ryan Kirkman and Thomas Davis built cdnjs as a free, community-run mirror of every popular open-source library.
Cloudflare stepped in to host it free of charge months later, and took over project maintenance in 2019. Back then, Cloudflare didn't have a mature Developer Platform that could fully sustain the entire cdnjs ecosystem. Fifteen years and a lot of building blocks later, the platform is mature enough to run cdnjs end to end, on Workers, Workflows, D1, Queues, Workers Cache, R2, KV, and Containers.
Why cdnjs has 9 billion requests a day
The web has changed beyond recognition from those days. We have ES Modules (ESM), the standardized import / export syntax browsers understand natively. We have import maps, Vite, Bun, Turbopack. We have AI assistants that scaffold entire apps in seconds. Bundlers are everywhere. So why does a CDN for <script> tags still serve 9 billion requests a day?
One reason: LLMs love cdnjs. When ChatGPT, Claude, or Cursor scaffold a quick HTML demo, they reach for cdnjs because their training data is full of it. There have been 15 years of blog posts, GitHub READMEs, tutorial sites, and Q&A threads pointing to cdnjs.cloudflare.com. The URL pattern is consistent and versions are immutable — exactly the kind of dependency a model can produce reliably without hallucinating.
Every file on cdnjs has an SRI hash (we're still working on ensuring all the existing stored hashes match reality due to bugs in the old system), mirrors are auditable, and the whole project is open source. In a world increasingly worried about supply-chain attacks, an immutable, hash-verified mirror of well-known libraries is indispensable.
And it's free, forever, for everyone. No API keys. No rate limits. No "sign up to continue." That's a rare thing on today's Internet, and it's worth protecting.
Why we migrated
We didn't migrate because cdnjs was slow. We migrated because we want to keep improving it.
The previous architecture served users well: 98% cache hit, billions of requests, no outages. But internally, shipping anything new or fixing existing issues in how packages were processed was getting harder. Making a change meant coordinating deployments across GCP Functions, a VM, and Cloudflare. Observability was painful too.
The pain points
In 2020, we migrated cdnjs to serverless, moving file serving onto Cloudflare Workers and KV, with a bare-metal origin as fallback. That change dramatically improved resilience and scalability, and let us pre-compress every asset with Brotli and gzip for smaller, faster responses, but only on the serving side.
The publishing side — the pipeline that watches npm and GitHub for new library versions, downloads them, processes them, and writes the results so cdnjs can serve them — stayed on Google Cloud Platform (GCP). At the time, Cloudflare Workers were designed for fast, short-lived HTTP requests; they didn't yet have the building blocks for a long-running, multi-step pipeline that fetches large tarballs, runs CPU-heavy compression, and orchestrates work over hours. Workflows, Queues, Durable Objects, R2, and Containers didn't exist yet.
So we built the publishing bot on what was available: a chain of GCP Functions, a VM running git-sync, and a GitHub repository as the source of truth. It worked, but six years later, that architecture was showing its age. Here's a diagram of the previous architecture:
The architecture had five pain points. The one that hurt most was observability: debugging meant stitching logs together by hand. We'll start there.
No shared trace A single package update could pass through Cloud Functions, Google Cloud Storage (GCS) object events, Pub/Sub topics, a git-sync VM, and Workers KV before a file reached a user. None of those systems shared a correlation ID. GCP Logging held one half of the story, Cloudflare Logpush held the other, and the two had no common key to join on.
The problem wasn't outright failure, it was partial success. A version that processed cleanly, wrote to KV, and then silently failed to land in the GitHub repo would serve fine for weeks until someone noticed the two stores had diverged. There was no alert for that. There couldn't be, because nothing in the system knew the full pipeline state.
Split-brain storage Files lived in two places at once: Workers KV at the edge (with a bare-metal origin as fallback) and a GitHub repository as the source of truth. The ingestion pipeline wrote to both at the end of every run. Neither was authoritative, and when they drifted, there was no clean way to reconcile them.
Pipeline glued together with object events The ingestion pipeline was a chain of small GCP Cloud Functions, each doing one step and handing off to the next through shared storage. One function fetched the package's release archive from npm and dropped it in a bucket. The bucket firing a "new file" event triggered the next function, which unpacked it and wrote the results somewhere else, triggering the next, and so on. Storage was doing double duty as a message queue, with no dead-letter queue, no backlog visibility, and no clean replay when a step failed.
26 functions for 26 letters Just checking npm for updates required 26 Cloud Functions, one per letter of the alphabet. Each shard had its own deployment and its own logs, and the only way to know if the fleet was healthy was to check all 26.
The GitHub repo GitHub couldn't serve A separate VM ran git-sync, mirroring every processed file into cdnjs/cdnjs. Years of releases pushed it past 1.1TB of packed storage, large enough that GitHub's own archive service refused to generate tarballs or zip downloads for it. Forking became impractical, clones were slow, and the .gitignore had grown to 274 hand-curated entries blocking broken or weirdly-versioned releases. It was a documented graveyard of everything the pipeline couldn't reasonably reject upstream.
A genuine thank you to the GitHub team for hosting this giant for over a decade. They bore with us through years of storage growth, and the project wouldn't have survived without them.
A quieter benefit that came with the migration is having fewer moving parts to secure. Cloud Functions, a git-sync VM, container images, GCS buckets, service-account keys — every one of those was a thing to secure, patch, and audit. Retiring the pipeline closed all of the recently opened cdnjs vulnerabilities.
How we re-built it
The new cdnjs architecture runs entirely on Cloudflare’s Developer Platform.
R2 is the single source of truth for file content. It has no practical size limit, so the files that couldn't fit in KV before, like source maps, big bundles, and font packs, now live alongside everything else. As a bonus, the S3 API makes the entire cdnjs catalog accessible to any S3 client. Maintain a mirror? Open an issue on the cdnjs repository and we'll set you up with read-only credentials.
KV stores only metadata now: package info, version lists, SRI hashes. KV is built for high read volume with infrequent writes, which is exactly the shape of metadata access.
In front of the Worker sits Workers Cache, a tiered cache Cloudflare launched this year. Before, we relied on a separate internal caching layer between the edge and the Worker. That layer is gone now, replaced by one owned by the Developer Platform, the same platform that runs the rest of cdnjs. One less moving part!
The new architecture also extends a long-standing partnership. DigitalOcean has hosted the cdnjs website for years as a sponsor; now it hosts the storage too. Every file published to R2 is mirrored to DigitalOcean Spaces: architecturally a disaster-recovery copy, operationally also a live fallback. The serving worker reads through to it whenever R2 can’t return a file. The chain is cache → R2 → DigitalOcean, so R2 having a bad day doesn't take cdnjs down. A Cloudflare-hosted origin still sits in the chain during the transition, but it will retire once the GitHub backfill lands in R2.
The ingestion pipeline is built on Cloudflare Workflows. Every ten minutes, a cron job triggers PackageUpdatesWorkflow, which checks npm and GitHub for new versions. For each new version found, it spawns a DownloadPackageWorkflow that fetches the tarball into R2, then a ProcessingWorkflow per file that extracts, minifies, and compresses. Finally, PublishingWorkflow writes the results to R2 and KV and updates the Algolia search index.
Because Workflows provides durable execution, the state of each step is preserved. If anything fails — a network timeout, a compression error — the workflow resumes from the last successful step.
The trickier piece is how we glue Workflows to the external compression container. We pre-compress text-based files to streamline the delivery process. But compression is too CPU-intensive for a Worker, so we hand it off to Cloudflare Containers, wait for compression to complete, and then pick up where we left off.
The pipeline has two kinds of waiting:
Per file: Each ProcessingWorkflow writes the uncompressed file to an R2 bucket, sends a job to a Queue, and hibernates. A Rust compression service running in the container picks it up, compresses it, and writes the result to another bucket. An R2 event notification wakes the workflow up so it can continue.
Per package: The parent workflow needs to wait for all its file children before moving on to publish. A package with thousands of files means thousands of children running in parallel. We use a small Durable Object as a counter: a parent increments on each child it spawns, children decrement when they finish. The parent wakes up when the counter reaches zero.
An overview of the new architecture, with R2 as the source of truth and Workflows running the pipeline:
Pushing the limits
Designing the new architecture was one challenge. Migrating the existing catalog into it, without disturbing a single file already in the wild, was another.
We'd actually tried this once before and had to roll back. The plan, back then, was to re-process old packages and write the results directly to R2, but the regenerated files didn't byte-match what KV had been serving. Minifiers and compressors aren't fully deterministic across versions, so the new outputs were correct but had different SRI hashes. For a CDN where users pin those hashes in their HTML, that's a serving break. So we rolled back, and now, we migrated the existing content from KV to R2 as-is instead of regenerating it.
That decision shifted the problem from "re-process millions of files" to "copy millions of files between accounts, without missing any." And that's where we ran into the Workers subrequest limit, capped at 1,000 per invocation on paid plans. A package with thousands of files would burn through it in one go. Parallelizing didn't help, since every Worker hits the same ceiling. So we sharded the migration by package name and fanned the work out across many invocations via Queues, whose at-least-once delivery guarantee meant no package could silently fall out of the migration.
We hit two platform limits during the migration: 1,000 subrequests per Worker invocation and 1,024 steps per Workflow. Instead of just working around them, we asked the Workers and Workflows teams to raise them — which they did. Subrequests now go up to 10 million on paid plans; Workflows now default to 10,000 steps, configurable to 25,000.
The cdnjs pipeline runs on the same building blocks anyone can use: Workers, Workflows, R2, KV, Queues, Containers, and Durable Objects. The limits we hit are limits we lifted for everyone. If the Cloudflare Developer Platform can serve 9 billion requests a day and publish packages with hundreds of thousands of compressed, minified files, it can probably run whatever you're building.
What’s next
There's an obvious next question hiding in all of this: could cdnjs also serve modern, browser-native ES modules? The same packages, transformed on publish, ready to import without a bundler. The architecture doesn't rule it out. The Workflows-plus-Containers pattern that pre-compresses files today would work just as well for transforming them. We're not committing to it, but it's the kind of thing that's now possible to consider, which wasn't true a year ago.
git commit -m "with love" --author="cdnjs team"
We follow every open issue on GitHub and we want your feedback. Don't hesitate to contribute and help make the Internet better for everyone.
Today we’re excited to announce Cache Response Rules. These are a new rule type that runs after an origin server replies but before Cloudflare caches the content.
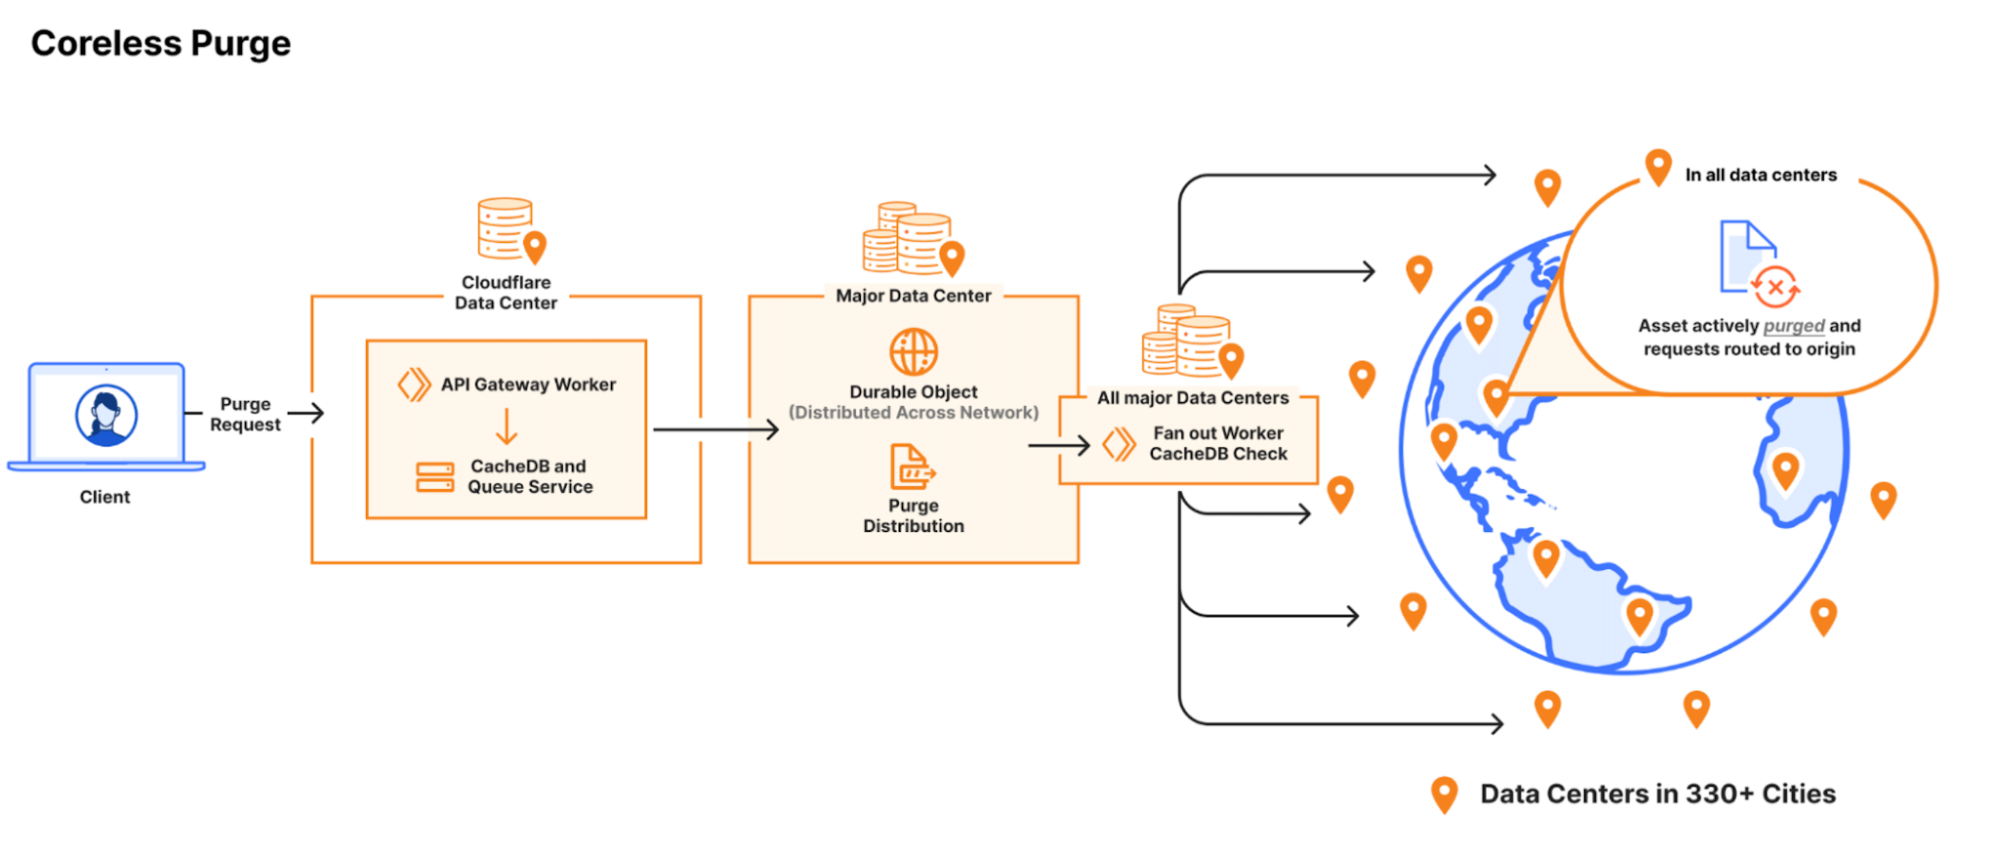
If you've ever been irked watching something that should easily sail out of cache get dragged back to the origin by a stray Set-Cookie or wrong Cache-Control, headers that are sometimes hard or impossible to strip or change on the origin itself, then Cache Response Rules is that fix, applied at exactly the right moment.
When and how caching decisions are made
A CDN cache and an origin server work as a pair. Their goal is to answer from the cache whenever possible and only go back to the origin when the edge can’t respond. Every point of cache hit ratio comes from getting that division of labor right. Check the cache when we shouldn't, and we waste a lookup that was always going to miss. Check it too rarely, the origin serves traffic the edge should have absorbed and the performance win evaporates.
Importantly, the origin guides the cache. When it returns a cacheable asset, its response headers tell Cloudflare how long it’s OK to serve it, when and how to revalidate, and even whether to cache it at all. The cache is only ever as efficient as the origin allows. If the origin gets it wrong, cache becomes decoration while the origin infrastructure costs skyrocket.
Most cache eligibility problems are not decided at request time. They manifest after the origin replies.
A visitor asks for /static/app.js. Cloudflare checks cache, it misses, and forwards the request to the origin. The origin returns the file. Somewhere in those response headers, quietly, is a Set-Cookie header. The asset that should have been cached at every Cloudflare data center is now uncacheable. Multiply that by every visitor, on every site, with the same accidental header, and you have a cache hit ratio that is leaking origin bandwidth, ruining performance, and driving infrastructure costs higher.
There is a long list of variations of this same problem. The origin sends Cache-Control: no-cache on assets that are perfectly safe to cache on the CDN. The origin sends correct directives, but they're meant for the browser, not for Cloudflare. Or the origin attaches an ETag (an identifier for a specific version of a resource) that's overly aggressive and causes revalidation thrash on every conditional request. Often, especially in large teams, those managing the origin’s responses and the group that manages the CDN are different. This makes changing a one-line header a weeks-long negotiation.
None of these problems can be solved at request time. By the time Cloudflare sees the Set-Cookie on /app.js, the request phase is over. The response is already in flight.
So we put a fix in the right place.
Cache Response Rules run after the origin’s response arrives at Cloudflare, but before it gets written to cache. With them, you can rewrite Cache-Control directives, manage cache-tags, and strip headers like Set-Cookie, ETag, and Last-Modified from the origin response before Cloudflare's cache ever sees them. The fix lives entirely on Cloudflare. No origin code changes required.
The missing piece
If you've used Cloudflare for any length of time, you've watched the cache control surface area evolve. A few years ago, most of this lived inside Page Rules, which operated as a single, albeit overloaded, primitive that mixed caching with redirects, security, and a dozen other behaviors, all evaluated on requests. We later split these rules apart so that only relevant behavior changes would be evaluated against requests, reducing unnecessary latency and allowing for complex rule stacking between behaviors. Cache Rules became a dedicated, expressive rule type for caching decisions, joined by CDN-Cache-Control, Origin Cache Control, custom cache keys, and other controls that give you precise ways to tell Cloudflare what's safe to cache, for how long, and under what conditions.
Many of these controls share a common trait: they operate on the request.
While maybe unintuitive, this makes sense. The most important caching decisions Cloudflare has to make are should we look this up in cache, and under what key? This question has to be answered before Cloudflare talks to the origin. If the answer is "no" when it should have been "yes," the request has already paid for the origin round trip and there's nothing the response can do to give it back that latency. Request-time rules answer that question using the only information available at that moment: the URL, the requested file’s extension, the request headers, geography, device type, and so on. Using these request parameters and the rules set to change these request parameters, we determine if something is likely in cache and look there before talking with the origin.
But some cache decisions cannot be made on the request. The origin's Cache-Control directives (cache-control: max-age=3600) are part of the response Cloudflare receives from the origin. The status code, the ETag, the Last-Modified timestamp, Set-Cookie, and the cache-tag format the origin chooses are all things in the response that the origin passes to the cache. None of it is available when request-time rules run.
Responses from the origin are the source of truth, so if something needed to be changed on Cloudflare that wasn’t available at request time, that previously left you with three workarounds:
Change the origin.
Write a Worker that re-fetches and rewrites the response.
Live with a worse hit ratio.
Each of those costs engineering time, adds latency, or burns money. Cache Response Rules give you a fourth option: a ruleset where you can modify the origin's response before it hits Cloudflare's cache.
Two phases, two questions
The cleanest way to think about the difference between Cache Rules and the new Cache Response Rules is as two phases, each answering its own question.
Cache Rulesrun in the request phase, before Cloudflare talks to the origin server. They answer: given this request, should Cloudflare cache the response, and under what cache key? That’s three decisions that can be made at request time with cache rules: whether to cache (eligible vs. bypass), what the object is (the cache key and how to identify the stored object in the future), and how to cache (edge TTL, browser TTL, serve-stale, etc). All of these questions must be settled before the origin fetch, using only what’s in the request.
Cache Response Rules run in the response phase, after the origin replies but before the response is written to Cloudflare's cache. Cache Response Rules answer: now that the origin has responded, should we adjust how we cache it? Cache Response Rules can rewrite the how from the request bystripping headers that would make a response ineligible for cache,changing origin cache-control directives that tell Cloudflare whether and how to cache, or setting cache tags for purging content. When a cache rule and cache response rule are in conflict with each other, the cache response rule wins.
The response phase can't do everything the request phase can. It can't change the what, as the key is already fixed. Though it can change whether and how Cloudflare caches, for example, a response rule can set no-store to make a cacheable object non-cacheable or strip a Set-Cookie to make non-cacheable content eligible for cache. However, Cache Response Rules can't make a previously ineligible request cacheable by the response phase, because it’s too late.
So Cache Response Rules don't replace Cache Rules. Cache Rules decide whether, what, and how we cache on the request. Cache Response Rules get the final word on the how and whether, once the origin's response is seen by Cloudflare in a phase that didn't exist before.
What you can do
Cache Response Rules support three actions today.
Strip headers that break caching
The set_cache_settings action removes things like Set-Cookie, ETag, or Last-Modified from the origin response before Cloudflare evaluates it for caching:
This is the fix for the Set-Cookie-on-a-static-asset problem. Origin frameworks frequently attach session cookies to every response (for load balancing or other purposes), including responses for assets that users don't want to be associated with a session. Stripping Set-Cookie in the response phase makes those assets cacheable again without asking the origin, load balancer, or anything else upstream to change anything.
Cache Response Rules also run on responses that aren't eligible for caching at all. So when you strip Set-Cookie from a dynamic response, for instance, the rule fires whether or not the object is ever stored. This allows you to control what the client sees even when the response is not stored in cache. You can also strip ETag and Last-Modified, which is useful when those headers are misconfigured at the origin and causing thrash. This comes with a tradeoff: stripping both ETag and Last-Modified enables Smart Edge Revalidation for that response. If Cache Response Rules then add new validators, Cloudflare will not enable a Smart Edge Revalidation for browser conditional requests.
So stripping and modifying headers, even on dynamic requests, are a powerful new pattern that did not exist before on Cloudflare, but there can be additional configs to be aware of if you make these changes.
Manage cache tags
set_cache_tags lets you add, remove, or set cache tags used for purge by tag on the response. Tags can be static:
Or computed from a response header expression:
That second form is the one that earns its keep during a CDN migration. If your previous CDN attached surrogate keys to responses using a header like Surrogate-Keys with a comma delimiter, you can translate them into Cloudflare's Cache-Tag format directly in the response phase.
The third argument to split() is the limit: the maximum number of elements in the resulting array can be between 1 and 128. Use a value comfortably larger than the realistic tag count per response. The value 1 would return the entire header as a single tag. Once tags exist on the response, purge-by-tag just works (and by “works” we mean usually in under 150 ms, globally).
Modify Cache-Control directives
set_cache_control is the action that does the most heavy lifting. You can set or remove individual directives:
For each directive you can also set cloudflare_only: true, which is the part that often surprises people:
When cloudflare_only is true, the directive affects how Cloudflare caches the response, but the downstream Cache-Control value sent to the browser is left alone. This is the response-phase version of what CDN-Cache-Control gives you at the origin: cache the asset for 24 hours at Cloudflare, but tell the browser something else. The difference is that you're now doing it from a Rules surface in the Cloudflare dashboard, rather than asking the origin to set a separate header.
Examples worth stealing
Below are some examples we thought could help show you the power of Cache Response Rules. Try them out, remix them, and share with others in the community so you can see how to achieve powerful cache customizations using Cache Rules with Cache Response Rules. More examples can be found in the docs.
Strip Set-Cookie from static asset extensions
Why it works: The most common cause of "this should be cacheable but isn't" is a session middleware on the origin that attaches a Set-Cookie to every response. Stripping it for known-static extensions converts those responses to cacheable without any origin change.
Caveat: Only do this for asset types where the cookie is not semantically required. If your origin uses cookies to drive variant behavior on those URLs (very unusual but possible), strip selectively or scope stripping these headers by path.
Long-cache static assets in Cloudflare, shorter-cache them in the browser
Why it works: Cloudflare holds the asset for a month and serves it from cache. Browsers see max-age=86400 and re-validate after a day. You decouple the two cache lifetimes without touching the origin.
Caveat: immutable tells browsers not to revalidate even on explicit refresh. Pair it only with versioned/hashed filenames.
Override no-cache on a known-static path
Why it works: Framework defaults sometimes attach no-cache to every response. If you know /static/* is safe to cache, you can strip the directive and impose your own TTL (at Cloudflare only), without changing what the origin or any downstream cache sees.
Caveat: Be honest about what's actually static. If /static/ is sometimes used to serve user-specific content, narrow the match (extension, response header signal, content type).
Translate cache tags during a CDN migration
Why it works: A lot of CDN migration pain comes from origin tooling that emits cache-tag headers in another vendor's format. Instead of asking the origin team to ship a release that adds Cloudflare's Cache-Tag, translate the existing header in the response phase. Purge-by-tag on Cloudflare starts working immediately.
Caveat: The third argument to split() is the limit (1–128) on the resulting array size, not anything to do with the separator.
How to use Cache Response Rules
Dashboard
Go to Cache > Cache Rules in the Cloudflare dashboard.
Select Create rule and then Cache Response Rule.
Choose a name and an expression. The expression builder exposes both request fields and response fields.
Choose an action: Modify cache-control directives, Modify cache tags, or Strip headers.
For directives, toggle Cloudflare only when you want the change to apply only to Cloudflare's view of the asset.
Save as a draft to iterate, or deploy directly.
API
Rules in this phase live at:
For further information about how to use Cache Response Rules including API and terraform examples, please see the documentation.
Use Cache Response Rules today
Cache Rules saw the request. Cache Response Rules see the response. Both give you even more control to build the perfect cache on Cloudflare. They are available on all plans today — go try them out!
In 2021, we shipped Smart Tiered Cache. The idea: for each origin behind your site, Cloudflare picks the single best upper-tier data center to route through, based on real-time latency. Flip one switch, and we find the fastest path from our network to your origin.
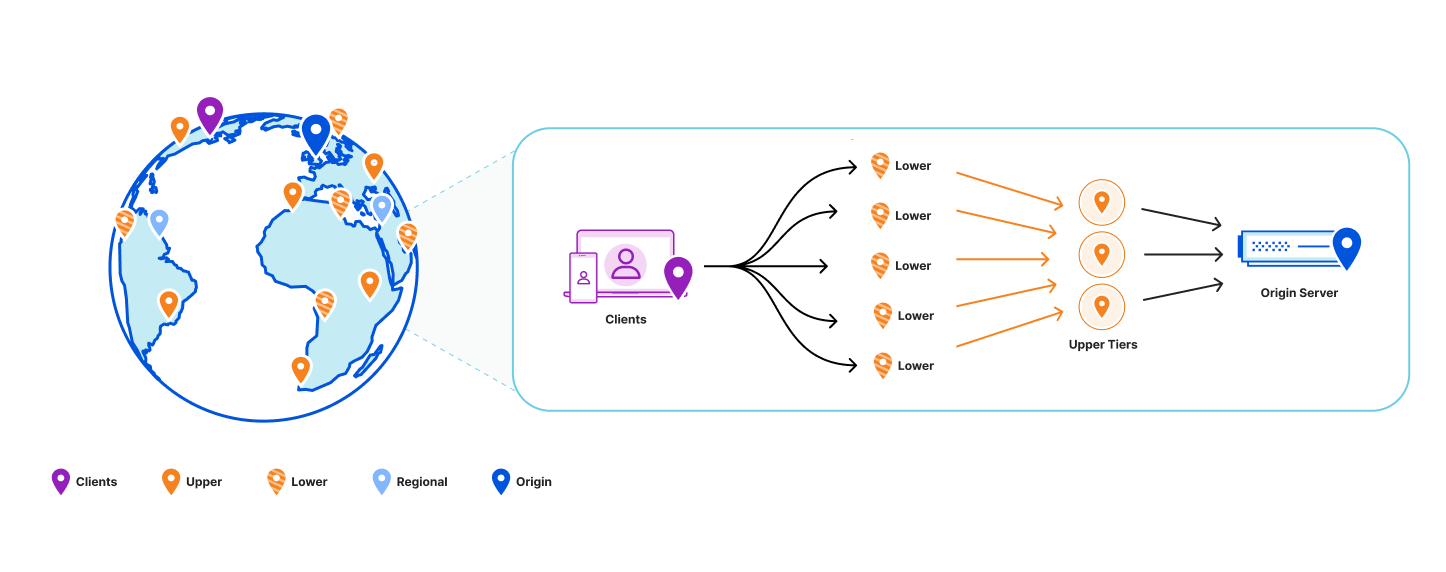
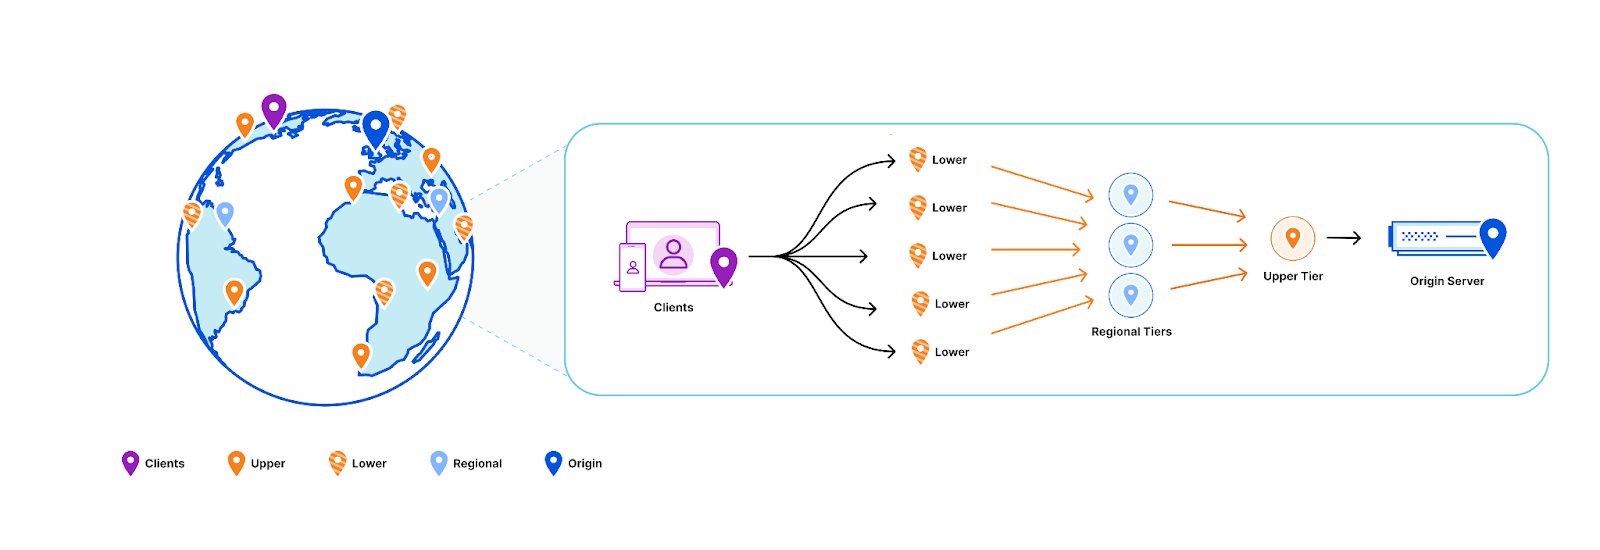
That works as long as an origin IP lives in one fixed place. Public cloud origins usually don’t. They sit behind anycast or regional unicast front ends, so one origin IP can look equally close to a dozen Cloudflare data centers at once — and the latency probes have nothing to lock onto. Smart Tiered Cache handles this the safe way: when there’s no clear winner, it falls back to several upper tiers. Nothing breaks. You just lose the thing that made a single closest tier worth it, which is cache efficiency.
Smart Tiered Cache for Public Cloud Regions fixes this by letting you provide a cloud region hint. With that hint, Cloudflare can map public cloud origins to the right region and select better primary and fallback upper tiers, even when the origin IP itself looks anycast or ambiguous.
We made our most popular tiered cache topology smarter
Since it was launched, Smart Tiered Cache has become the most popular tiered cache topology among Cloudflare customers. It’s available to all plans, for free.
Much of our work aims to continually improve it. Over time, we’ve extended Smart Tiered Cache to handle more origin architectures, including:
November 2024: Smart Tiered Cache for R2: We taught Smart Tiered Cache to automatically select the closest upper tier to where the R2 bucket actually lives, reducing latency with zero configuration.
January 2025: Smart Tiered Cache for Load Balancing: We extended Smart Tiered Cache to select a single optimal upper tier for an entire Load Balancing pool, so all origins in the pool share the same cache, improving hit ratios.
Each of these improvements has shared a common goal: understand the customer’s origin infrastructure and automatically do the best thing for that infrastructure.
While we’ve been improving this system for a while, customers still had a common frustration: Smart Tiered Cache did not work when an origin is behind an anycast or regional unicast network, because this architecture prevented us from knowing where the origin is located. And this wasn’t an edge case, either. Origins hosted on public cloud providers behind anycast IPs are a growing slice of the Internet.
Today, we’re closing that gap for origins hosted on AWS, GCP, Azure, and Oracle Cloud.
Why anycast cloud origins are different
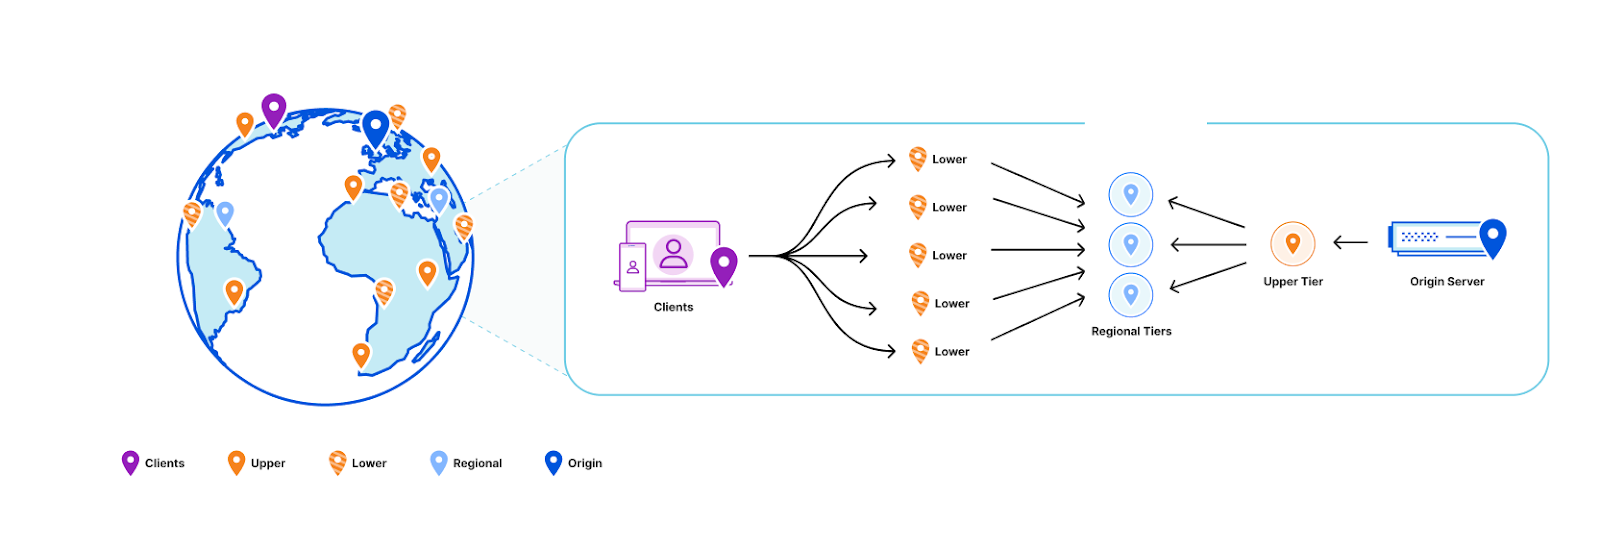
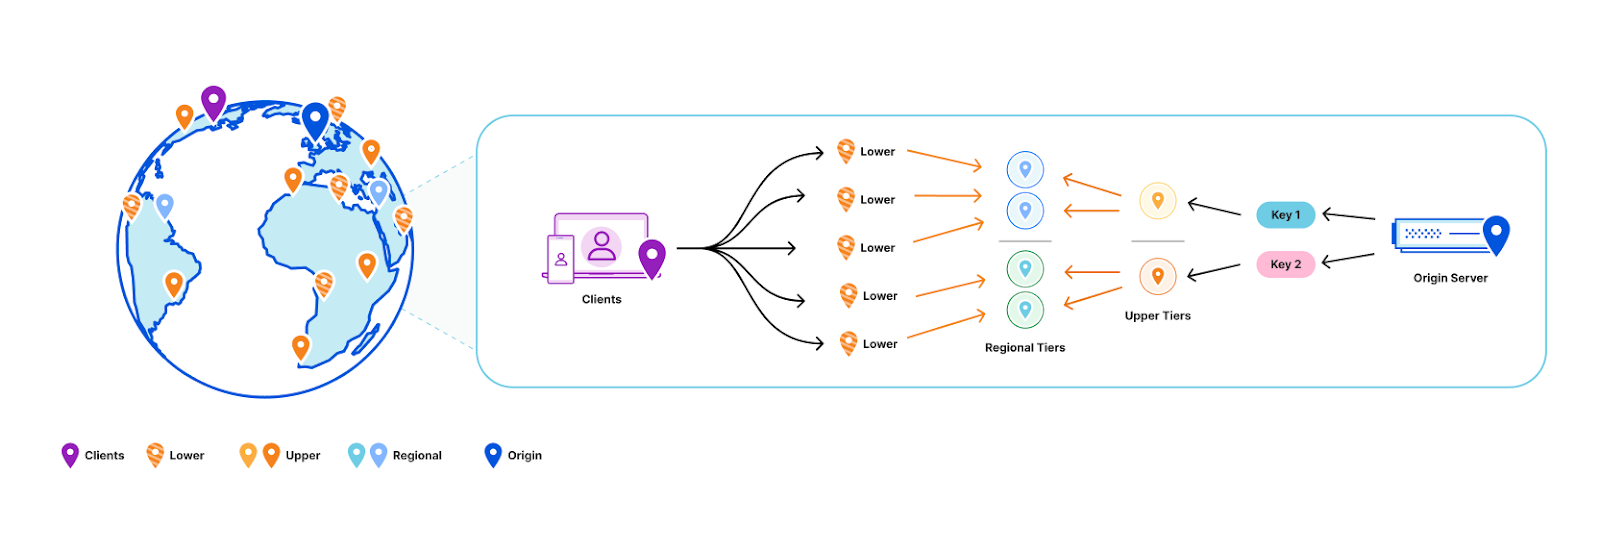
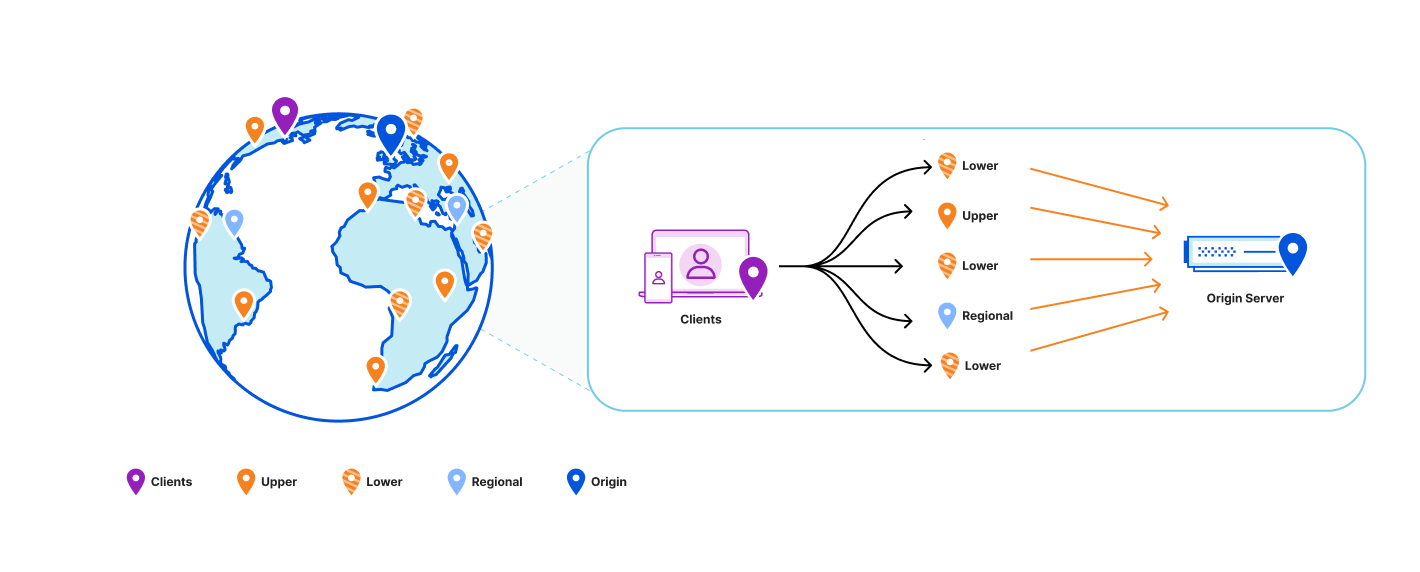
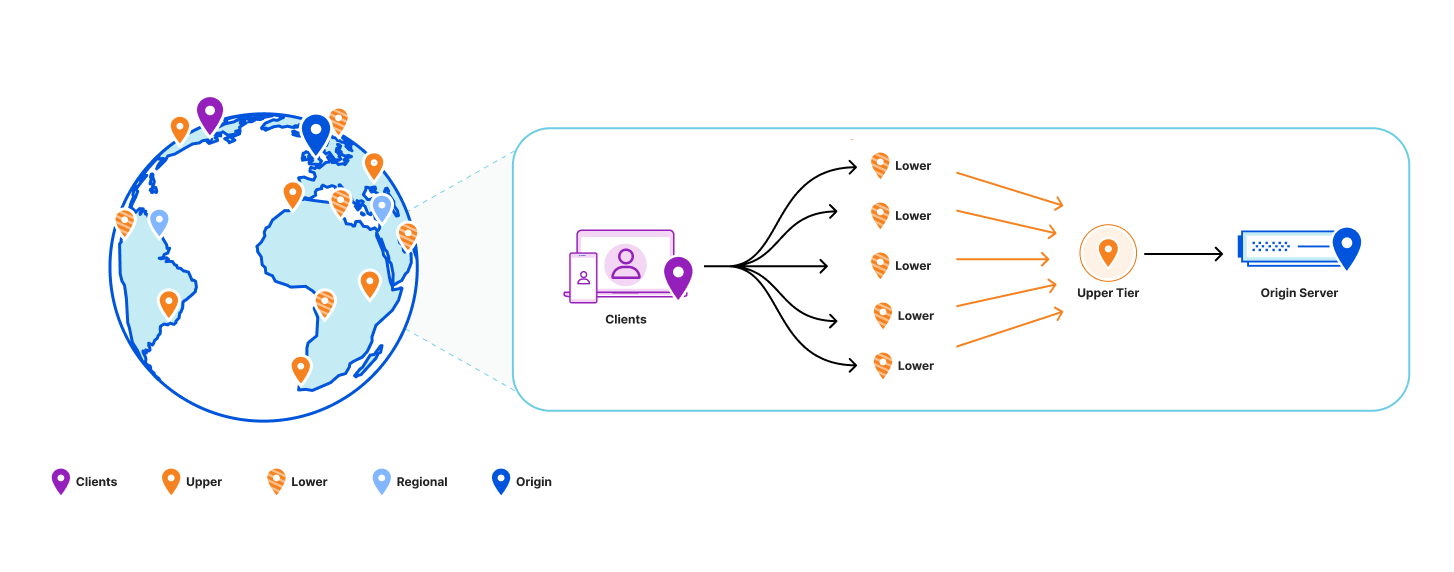
Smart Tiered Cache works by measuring the latency from each Cloudflare data center to the origin’s IP address. The data center with the lowest latency becomes the upper tier: the single point through which all cache misses funnel on their way to your origin. By concentrating cache misses at one data center, you get higher cache hit ratios, fewer connections to your origin, and lower latency on origin pulls. This works well when the origin has a fixed, unicast IP address that can be reliably probed.
Many cloud providers use anycast or regional unicast networking for their load balancers, front-end services, and regional ingress points. When we probe these IPs, the origin appears to be “close” to many data centers simultaneously. That is because the IP address represents the cloud provider’s front end, not a single physical origin location. Different Cloudflare data centers may reach different nearby cloud edges for the exact same IP, and the provider then carries the request across its own network to the actual backend. So Smart Tiered Cache cannot confidently pick one best upper tier.
In practice, this could result in hairpin traffic across continents, adding a whole extra round trip. Say your origin sits in Singapore, behind an anycast IP from a cloud provider. Because of how anycast works, our Chicago data center might show the lowest probe latency to that IP. Smart Tiered Cache would then select Chicago as the upper tier. The result: a request from an end user in Asia hits a nearby Cloudflare data center, gets routed cross-continent to the upper tier in Chicago, and Chicago fetches from the origin back in Singapore, crossing the ocean twice. That hairpinning adds hundreds of milliseconds of latency, and it’s one of the most consistently reported issues from customers with cloud-hosted origins.
An example of hairpinning is when traffic is routed to an upper tier in Chicago only to fetch data from an origin in Singapore, resulting in an unnecessary cross-continental round trip.
To address this unnecessary back-and-forth, Smart Tiered Cache learned to detect anycast origins with a constraint from physics: the speed of light. We measure probe latencies from multiple checkpoint data centers around the world to the origin. If the combined latencies from two checkpoint data centers are faster than what light in fiber could physically travel between the two, the origin must be answering from multiple locations, not one. That means it’s anycast.
We detect anycast origins by comparing probe latencies from multiple Cloudflare data centers. If two paths are faster than physically possible for a single origin location, the origin is likely answering from multiple places.
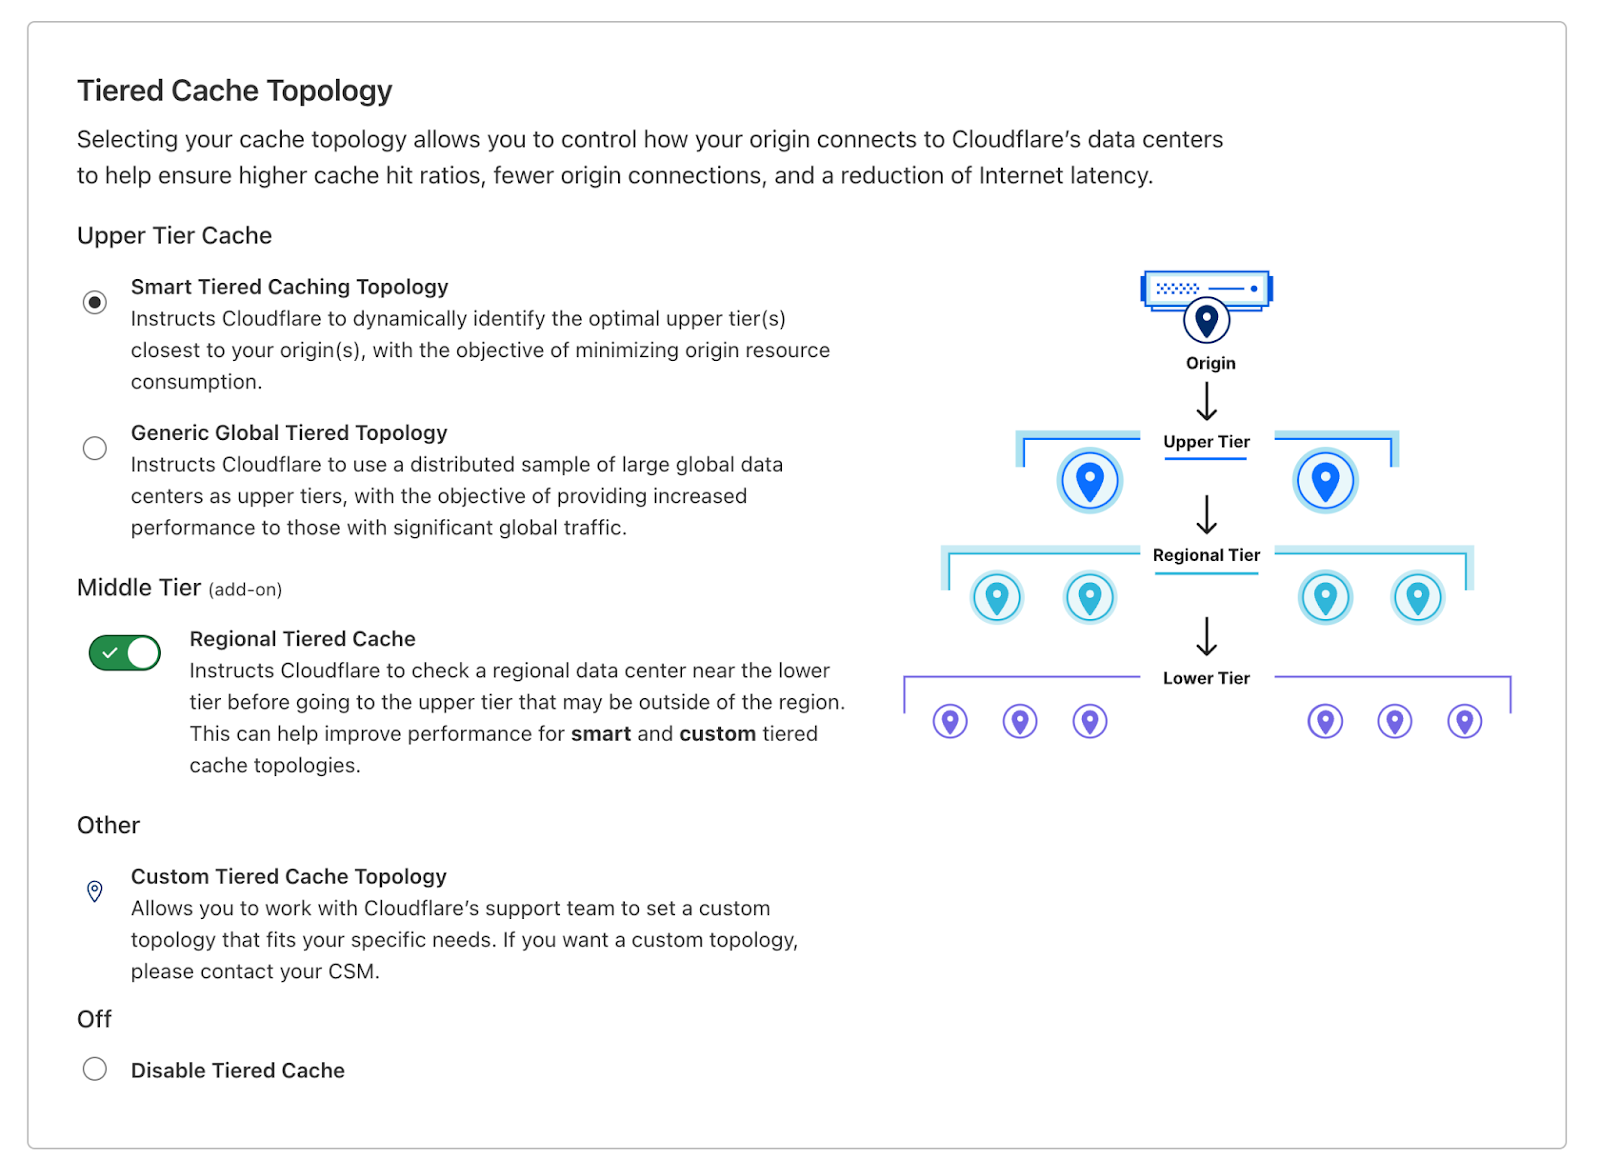
When Smart Tiered Cache detects an anycast origin, it plays it safe: it won’t pin that IP to a single upper tier. Instead, it falls back to a tiered cache topology with multiple upper tiers. Tiered caching still works, but spreading traffic across multiple tiers instead of one means more requests reach the origin. For some setups that’s a fine trade. But if you want one upper tier close to an origin that lives on a public cloud behind anycast IPs, there hasn’t been a good option — until now.
Tell us the region
From the Cloudflare dashboard, go to Caching > Tiered Cache > Origin Configuration. Find your origin IP, click “Set Region Hint,” and tell us the cloud region (for example, aws:us-east-1 or gcp:europe-west1). Smart Tiered Cache takes over from there. Note that, on the dashboard, region hints can only be set for origins whose IPs we’ve detected as anycast.
On the Tiered Cache page, go to the Origin Configuration table and click the edit icon next to an origin IP to set its region hint.
You can set hints one IP at a time, or bulk-edit cloud regions for all your origin IPs at once. Beyond the dashboard, the same configuration is available via the API and through Terraform, so you can integrate it into your existing infrastructure-as-code workflows.
We’re launching with AWS, GCP, Azure, and Oracle Cloud, with more providers coming.
How Smart Tiered Cache for Public Cloud Regions works
Every few hours, we fetch the latest IP range files from each supported cloud provider. These files map every cloud region to its current set of IP prefixes, so when a provider adds, removes, or reassigns a subnet, we pick it up.
Smart Tiered Cache for Public Cloud system diagram
We match those subnets against our upper tier database, which is built from continuous latency probing refreshed every 15 minutes. For each cloud region, each matching subnet contributes a weighted vote based on its current upper-tier assignment. The upper tier with the strongest signal becomes the region’s primary upper tier. Primary and fallback always come from different points of presence (PoPs), so losing one PoP can’t take out both.
Some regions don’t have enough probe data, for example, perhaps the new region’s cloud provider is still rolling out, or the region has no origin onboarded to Cloudflare yet — so there’s nothing to vote on. We fall back to geography: the closest of our Tier 1 PoPs. As origins come online and probe data builds up, the region quietly switches from that geographic guess to the option backed by real data.
Try it now, and what’s next
All this means that the work of selecting the optimal region for your cache — the constant probing, the algorithmic choice of each region’s best upper tier, the geographic fallbacks, the failover across PoPs — runs on our side. Your job is selecting the region hint.
If your anycast origin sits on a public cloud, you can turn this on now. In the dashboard, go to Caching > Tiered Cache > Origin Configuration. Find your origin IP, click Set Region Hint, and pick your region.
Next up, we’re expanding to more providers, and continuing to teach Smart Tiered Cache to recognize more origin setups and pick the right path on its own. To learn more about how Tiered Cache can benefit your service, check out our Tiered Cache documentation.
Today we are launching Workers Cache: a tiered cache that sits in front of your Worker, configured by a single line of Wrangler config and the same Cache-Control headers you already know.
When Workers Cache is enabled, every cacheable request to your Worker hits Cloudflare’s cache first. If there’s a fresh cached response, Cloudflare returns it directly — your Worker doesn’t run, and you don’t pay CPU time for it. On a miss, your Worker runs, and if your response is cacheable, Cloudflare stores it for the next request. The next request from anywhere on Earth can be served straight from cache.
And when content changes, your Worker purges its own cache:
await ctx.cache.purge({ tags: ["product:123"] });
That’s the whole API. There is no zone to configure, no rules engine to set up, no separate cache to provision, and no second product to log into. The Worker’s code is the configuration surface, and the cache follows the Worker wherever it runs — on a custom domain, on workers.dev, behind a service binding, in a preview, in a Workers for Platforms tenant. One Worker, one cache, configured once.
That’s the surface area. There’s a lot underneath: tiered caching across our entire network, full support for stale-while-revalidate so stale responses never block a user, content negotiation via Vary, multi-tenant-safe cache keys via ctx.props, programmatic purges by tag or path prefix, and — the part we think is the biggest unlock — a cache that sits in front of every Worker entrypoint, not just the public one, with per-entrypoint control over which ones cache and which don’t. That last piece means you can compose caching directly into the structure of your app: a chain of entrypoints with cache stages slotted in wherever you want them, configured by the code on either side. We’ll walk through all of it below.
Workers Cache is available today to every Worker on any plan, enabled in Wrangler.
This is the caching API we’ve always wanted Workers to have. Here’s why it took us this long, what becomes possible because of it, and what’s coming next.
Why server-rendered apps need a cache in front
When we introduced Workers in 2017, the pitch was that you could run code on Cloudflare’s network to transform requests on their way to your origin. The Worker sat in front of the cache and the origin:
This was the right model for the use cases we were targeting. If you wanted to add a header to every request, rewrite a URL, do an A/B split, or filter traffic before it reached your origin, putting the Worker in front of the cache and the origin gave you full control over what got cached and what didn’t. Customers built incredible things with it.
But the world changed. Workers stopped being a thing you bolted onto an origin and started being the origin. Frameworks like Astro, TanStack Start, Next.js, Remix, and SvelteKit all ship a Cloudflare adapter that builds your app as a Worker. There’s no origin behind them. The Worker is the server.
When the Worker is the origin, the original architecture has nothing to cache. Every request runs your code, even when the response would be byte-for-byte identical to the one you returned a second ago. The Workers runtime is fast enough that this works — it routinely handles tens of millions of requests per second without breaking a sweat — but “fast enough to render every request” still costs you latency on every page load and CPU time on every invocation. And on a server-rendered app, every page load is, by definition, a render.
Workers Cache flips the architecture. Cloudflare’s cache now sits in front of the Worker:
On a cache hit, your Worker doesn’t run at all. Cloudflare returns the cached response and your CPU billing stays at zero. On a miss, your Worker runs once, populates the cache, and the next request — from anywhere — gets served from cache without invoking your code.
This is what was missing for server-side rendering on Workers. You used to have to choose between two unsatisfying options:
Prerender everything at build time (“static site generation”). Fast page loads, but every change requires a full rebuild and redeploy. For a docs site with a few thousand pages, that’s 5–10 minutes. For a large e-commerce site, it’s worse — and the build runs every single time you touch anything.
Render every page on every request. Up-to-date content, but every page load pays the rendering cost and every visitor pays the latency.
Workers Cache gives you a third option: server-render on demand, cache the rendered response, refresh it on a time-to-live (TTL) you choose. The first request to a new page still renders. Every subsequent request, until the cache expires, is served as if the page were static. When the cache expires, the next request triggers a re-render — and with stale-while-revalidate, even that one doesn’t wait.
You get the speed of a static site without the build time, and the freshness of server rendering without the cost. No framework-specific machinery like Incremental Static Regeneration. Just HTTP caching, working the way it was designed to work, in front of code that was designed to be the origin.
stale-while-revalidate is the part that makes it feel instant
The stale-while-revalidate directive tells Cloudflare that when a cached response expires, it’s allowed to serve the stale copy immediately while it refreshes the response in the background. Cloudflare shipped full support for stale-while-revalidate earlier this year, and it’s the directive that turns “we cache your Worker” into “your Worker’s site feels static.”
Without it, the first request after a cache entry expires has to wait for the Worker to render the page from scratch. The user sees that latency. With it, the first request after expiration gets the stale page immediately (with a Cf-Cache-Status: UPDATING header), and the Worker runs in the background to refill the cache. Every user, including the one who triggered the refresh, gets a cache-speed response.
In practice, this looks like:
 export default {
  async fetch(request) {
    const html = await renderPage(request);
    return new Response(html, {
      headers: {
        "Content-Type": "text/html; charset=utf-8",
        // Treat as fresh for 5 minutes; serve stale for up to an hour
        // while a background refresh runs.
        "Cache-Control": "public, max-age=300, stale-while-revalidate=3600",
      },
    });
  },
};
The mental model that makes this click:
Fresh window (max-age): Cloudflare serves the cached response. Your Worker doesn’t run.
Stale window (stale-while-revalidate): Cloudflare serves the cached response. Your Worker runs in the background to refresh it. No user waits.
Outside both windows: Cloudflare runs your Worker to generate a fresh response, and the user waits for that one render.
You pick the windows. For a product catalog that updates every few minutes, max-age=300, stale-while-revalidate=3600 means visitors basically never wait, and your Worker still runs often enough to keep content fresh. For a blog archive that almost never changes, max-age=86400, stale-while-revalidate=2592000 means your Worker runs once a day per page.
The first request to a brand-new page is the only one that pays the full render cost. After that, the page behaves like static output for visitors, while your Worker still owns how the page gets generated.
One URL, many representations: Vary works
Real apps rarely return the same bytes to every client. The same product page might be HTML for a browser and JSON for an API client. The same image might be WebP for clients that support it and JPEG for the ones that don’t. The same homepage might come back in English, French, or Japanese depending on the user.
Doing this without a cache is easy — your Worker just reads the request header and returns the right thing. Doing it with a cache is where it usually gets ugly. Most caches give you two bad options: cache nothing on URLs that have multiple representations, or cache one representation and serve it to everyone.
Workers Cache supports the standard HTTP Vary header, which is the right way to solve this. When your Worker returns a response with Vary: Accept-Encoding (or Accept, or Accept-Language, or any other request header), Cloudflare stores a separate cached variant per distinct combination of those headers — and only returns a variant whose stored values match the incoming request.
One URL, two cached variants. A browser that sends Accept: image/webp,*/* gets the WebP. A browser that sends Accept: image/jpeg gets the JPEG. Both come from cache. Your Worker writes both variants on the first request to each, and then runs zero times for either after that.
This is the well-trodden HTTP standard for content negotiation, and Workers Cache implements it the way RFC 9110 and RFC 9111 describe. There’s no allowlist of what headers you can Vary on. You list whatever you need, and Cloudflare keys variants on the verbatim values. The docs go through the edge cases — how to keep variant fan-out under control by normalizing headers in a gateway Worker, why purges invalidate all variants of a URL together, and the one case (Vary: *) that disables caching entirely.
This is your Worker’s cache, not your zone’s
Before we get to what becomes possible with all this, there’s a conceptual shift worth naming.
Cloudflare has had a cache forever. It’s configured at the zone level: Cache Rules, Page Rules, the cached-file-extensions list, Cache Reserve, Tiered Cache topology, custom cache keys. All of it is set per zone, and historically a Worker had to either fit into that zone’s configuration or work around it.
Workers Cache is different. It’s your Worker’s cache — it belongs to the Worker, not to a zone. This has a bunch of consequences that turn out to matter:
There is no zone configuration to manage. Cache Rules, cache level settings, the file-extensions list, Page Rules — none of them apply to Workers Cache. The Worker’s Cache-Control headers are the configuration.
The cache follows the Worker, not the hostname. A Worker that’s bound to api.example.com, api.example.net, and invoked over a service binding shares one cache across all three. A request to /users/42 hits the same cached entry regardless of which way in it came.
The cache works on workers.dev. It works in preview URLs (each preview gets its own cache, so testing a change doesn’t poison production). It works in Workers for Platforms (each user Worker has its own cache, isolated from the dispatcher and from other tenants). All of these used to be second-class citizens for caching. They aren’t anymore.
Purges are scoped to the Worker’s entrypoint. When you call ctx.cache.purge({ purgeEverything: true }), you’re only purging your Worker entrypoint’s cache. No risk of nuking your zone’s other content. No risk of one Worker’s deploy invalidating another’s data.
What you configure about caching, you configure in code: which paths get longer TTLs (branch on the path and set a different max-age), which requests bypass the cache (return Cache-Control: private), how the cache key is shaped (control what gets into ctx.props, normalize the URL in a gateway Worker before dispatching). The Worker you already wrote is the configuration surface.
Workers Cache is regionally tiered by default. There are two layers:
A lower tier in the Cloudflare data center closest to the user. Every data center that receives traffic for your Worker has its own lower-tier cache.
An upper tier that aggregates fills across the whole network. There are fewer of these, and every lower tier consults the upper tier on a miss.
A request hits the lower tier first. On a hit, the response is served and that’s the end of it. On a miss, the lower tier asks the upper tier. On a hit there, the response is returned and also stored in the lower tier on the way back. Only if both tiers miss does your Worker actually run — and the response from that run gets stored in both tiers.
The reason this matters is that the first request anywhere in the world populates the upper tier. Every subsequent request, from any data center, can be served from the upper tier without your Worker running — even if the lower tier at that data center has never seen the request before. Cache hit ratios are dramatically higher than they would be with a single flat cache layer, which is exactly what you want when your Worker is the origin.
This is the same topology that powers Tiered Cache for zones today, except you don’t configure it. There is no dialog for “turn on tiered cache for my Worker.” Every Worker that has caching enabled gets tiering for free.
If your Worker uses Smart Placement, the cache composes cleanly with it: tiers are consulted first, and only if both miss does Smart Placement route execution close to your origin. We have more to say about how those layers interact, including a few rough edges we’re planning to smooth out, in the docs.
Run your app near the user and near the data
There’s a recurring tension in web performance that nobody has fully resolved: you want your code to run close to the user (because the round-trip between user and server is on the critical path), and you want your code to run close to the data (because every database query is also a round-trip). Pick one, and the other gets slow.
We’ve spent years chasing both. Our network puts us within ~50ms of about 95% of the world’s Internet users. Smart Placement and Placement Hints let you keep your code close to your data without ever having to think about cloud regions. But until now, the two pieces didn’t fully compose. You could do “near the user” or “near the data,” and if you wanted both halves of your app to be in the right place at the same time, you had to be a Cloudflare expert. We knew we could do better.
Workers Cache is the piece that closes the gap. Because the cache belongs to the Worker (not the zone), and because service bindings and ctx.exports calls between Workers go through the cache, you can build an app as a chain of Workers — each one running where it should run — with the cache as the seam between them.
The architecture looks like this:
Worker A runs near the user. It handles the cheap, latency-sensitive parts of every request: authentication, rate limiting, routing, header normalization, rendering the outer “shell” of an HTML page that doesn’t depend on data.
Worker B runs near the data, courtesy of Smart Placement or an explicit Placement Hint. It does the heavy work: server-rendering pages that fetch data, reading product catalogs, generating search results, aggregating APIs, expensive transforms.
Workers Cache sits in front of Worker B. When Worker A calls Worker B over a service binding, Cloudflare checks Worker B’s cache first. On a hit, Worker A receives the response and Worker B doesn’t run at all — no data-center hop, no database query, no rendering work.
The cache hit path becomes: user → Worker A near the user → cache hit for Worker B → response. The data hop is paid only on a miss. Your hot pages run at the speed of code-in-front-of-the-user, and your cold pages still benefit from running near the data when they do execute.
You don’t have to architect anything special to get this. Write your app as two Workers, point one at the other with a service binding, turn caching on in Worker B’s wrangler.jsonc file, and you’re done.
Multi-tenant by default, with ctx.props
If you’re caching a Worker that returns user-specific data — say, an API that serves different content per logged-in user — you need a way to make sure one user can never see another user’s cached response. The standard solution is “don’t cache authenticated requests,” and Cloudflare’s automatic bypass for Authorization headers does exactly that. But “don’t cache anything” gives up the entire performance win.
Workers Cache solves this by making the caller’s ctx.props part of the cache key. When one Worker calls another over a service binding and passes ctx.props with a user ID, tenant ID, or any other identifier, callers with different props get separate cache entries. One user’s response can never leak into another user’s cache.
import { WorkerEntrypoint } from "cloudflare:workers";

interface Props { userId: string; }

export default class Backend extends WorkerEntrypoint<Env, Props> {
  async fetch(request: Request): Promise<Response> {
    // ctx.props.userId is part of the cache key. User A and User B
    // requesting the same URL get separate cached entries.
    const { userId } = this.ctx.props;
    const data = await loadUserData(userId);

    return new Response(JSON.stringify(data), {
      headers: {
        "Content-Type": "application/json",
        "Cache-Control": "public, max-age=300",
      },
    });
  }
}
The typical pattern is to authenticate the request in a gateway Worker, strip the Authorization header, set the authenticated user’s ID into ctx.props, and then call the cached backend Worker. The gateway runs on every request (it has to, to authenticate), but the expensive backend only runs when there’s no cache entry for that user yet. Auth’d APIs go from “uncacheable” to “cached per user with full safety,” and the cache key does the isolation for you. The docs walk through this in detail in Multi-tenant safety with ctx.props and the example in Per-user authenticated responses.
Other CDNs make you choose between correctness and hit ratio: key the cache by each user’s token, or send every request back to origin for authorization. Workers Cache lets you share cached API responses at the edge while preserving per-request authorization boundaries. We don’t know of another CDN that offers this as a built-in model for authenticated, multi-tenant APIs. We’re pretty proud of it.
A cache between every Worker entrypoint
Here is the part of Workers Cache that we think is the biggest unlock, and it’s the part that’s hardest to see if you’re thinking about it as “a CDN cache that happens to work in front of Workers.”
Workers Cache sits in front of every Worker entrypoint — the default export, every named WorkerEntrypoint, and every call between entrypoints in the same Worker via ctx.exports. That last clause is the one that changes what you can build.
When one entrypoint calls another via ctx.exports, the cache evaluates that call the same way it would evaluate a request from a browser. A hit returns the cached response and the callee never runs. A miss runs the callee and stores its response under its own cache key — keyed by the callee’s entrypoint, path, query string, and ctx.props. The caller still runs on every request, but anything it hands off to the callee is memoized independently.
You decide, per entrypoint, which ones cache. In your Wrangler config, the exports map lets you turn caching on or off for each entrypoint by name ("default" is the default export). Opt an entrypoint in to cache the responses it produces; opt one out to keep it running on every request. A gateway or router entrypoint — anything that authenticates, normalizes, or dispatches — should be opted out, so it always runs, and its own output is never served from cache.
That gives you a primitive you can compose. You can author a Worker as a chain of small entrypoints — auth, normalization, routing, the expensive read, the data layer — and let Workers Cache slot in wherever you want it. Each cached entrypoint is a unit of memoization with its own key, its own TTL, and its own tag namespace for purging. Anything you would want to configure about caching — when it runs, what it keys on, when it invalidates — is expressed as ordinary Worker code: which entrypoint you call, what request you forward, what ctx.props you pass, what Cache-Control you set.
To make this concrete, here’s a single Worker that does three things you couldn’t easily do together on any other platform: it authenticates every request, caches the expensive backend behind a multi-tenant-safe cache key, and invalidates that cache when data changes.
Caching is configured per entrypoint. The gateway must run on every request — both to authenticate and because a cached gateway response would skip that auth check — so we disable caching on the default entrypoint and enable it only on the inner one:
import { WorkerEntrypoint } from "cloudflare:workers";

interface Env { API_TOKEN: string; }
interface Props { userId: string; }

// Inner entrypoint: the expensive work. Workers Cache sits in front
// of this — on a hit, this code never runs.
export class CachedBackend extends WorkerEntrypoint<Env, Props> {
  async fetch(request: Request): Promise<Response> {
    // ctx.props.userId is part of the cache key, so this is cached
    // separately for every user.
    const { userId } = this.ctx.props;
    const data = await loadExpensiveData(userId);

    return new Response(JSON.stringify(data), {
      headers: {
        "Content-Type": "application/json",
        "Cache-Control": "public, max-age=300, stale-while-revalidate=3600",
        "Cache-Tag": `user:${userId}`,
      },
    });
  }

  // Invalidate a user's cached response. purge() is scoped to the
  // entrypoint that calls it, so it must run inside CachedBackend —
  // the entrypoint that owns the cached response.
  async invalidate(userId: string): Promise<void> {
    await this.ctx.cache.purge({ tags: [`user:${userId}`] });
  }
}

// Outer entrypoint: runs on every request to authenticate and route.
// Caching is disabled for it in Wrangler config (above), so it always
// runs and the auth check is never skipped by a cache hit.
export default {
  async fetch(request, env, ctx): Promise<Response> {
    const userId = await authenticate(request, env);
    if (!userId) return new Response("Unauthorized", { status: 401 });

    // Invalidate this user's cache on writes, from the entrypoint that
    // owns it.
    if (request.method === "POST") {
      await handleWrite(request, userId);
      await ctx.exports.CachedBackend.invalidate(userId);
      return new Response("OK");
    }

    // For reads: strip Authorization (otherwise Cloudflare's automatic
    // bypass fires and nothing caches), then dispatch to the cached
    // backend with the authenticated user's identity in ctx.props.
    const forwarded = new Request(request);
    forwarded.headers.delete("Authorization");

    return ctx.exports.CachedBackend.fetch(forwarded, {
      props: { userId },
    });
  },
} satisfies ExportedHandler<Env>;
The whole thing is one Worker. One source file. One deploy. But there are two execution stages — caching is turned off for the gateway and on for the backend in one small exports block — and a cache sits between them, keyed per user, invalidated by the write path, and serving stale during background refreshes. The cache stage isn’t something you bolted on. It’s a layer of the program, written in code.
The patterns this composes into are open-ended. The same shape works for:
Caching a Durable Object. Wrap the Durable Object behind an entrypoint, set Cache-Control on the response, and reads stop touching the Durable Object on a hit. Writes go to the DO directly and purge the cache by tag. The DO stays unaware that caching is happening.
Normalizing Accept-Encoding before Vary. The outer entrypoint restores the original encoding from request.cf.clientAcceptEncoding (Cloudflare’s front line normalizes it for cache efficiency) and forwards to a cached entrypoint that varies on the real value. Hit ratios stay high; clients get the right encoding.
Stripping tracking parameters before caching. The outer entrypoint canonicalizes the URL — or sets a custom cache key with cf.cacheKey on the ctx.exports call — so the cached inner entrypoint sees only the canonical form, and ?utm_source=anything collapses to a single cache entry.
Stack them. A single Worker can have an outer entrypoint that authenticates and routes, a normalization entrypoint that strips tracking parameters and restores encoding headers, a cached entrypoint that fronts a Durable Object, and a separate cached entrypoint for an unauthenticated public API — each connected by a cache stage you didn’t configure, just decided where to put. The Examples page in the docs walks through several of these end-to-end.
We don’t know of another platform where you can do this. CDN caches sit in front of an origin. Function platforms run functions. We don’t know of another platform that gives you a cache that sits inside a single deployable unit, between the parts of your application, with each cache stage configured by the code on either side of it. That’s what Workers Cache is. And because it composes with everything else the platform already gives you — Smart Placement, Durable Objects, service bindings, ctx.props, ctx.exports — the patterns you can build are open-ended. We’ve barely scratched the surface in this post.
First-class support in your framework
If you’re building with Astro, the Cloudflare adapter wires up Workers Cache for you. Just add the cacheCloudflare provider to your configuration:
The adapter enables the cache, sets the right headers on the responses Astro generates, attaches Cache-Tag values for invalidation, and gives you a cache.invalidate() helper for purging tags when content changes. Astro pages that opt into server rendering automatically get the “render once, cache, refresh in the background” flow described above — no per-route configuration required, no framework-specific runtime layer to learn.
We’re working with the maintainers of other frameworks to ship the same integration. If you build a framework adapter for Cloudflare, the Workers Cache APIs are exactly what you’d want them to be — header-driven configuration, programmatic purges, no platform-specific concepts to model.
See your cache on the same dashboard as your Worker
Caching is only useful if you can see what it’s doing. The Workers Observability dashboard now surfaces cache hit information per invocation:
You can see, per Worker:
Cache hit ratio over time. The number you want trending up after you enable caching.
Hits, misses, updates, bypasses broken down. If your hit ratio is low, this is where you find out why — too many BYPASS responses (because something is setting a cookie?), too many MISS responses (because the cache key is partitioning more than you thought?), too many UPDATING responses (because max-age is shorter than your traffic interval?).
Because all of this lives on the same dashboard as your Worker’s other observability — logs, exceptions, CPU time, request counts — you don’t have to context-switch between looking at your zone and your Worker to understand what’s happening.
Billing
Cache hits don’t run your Worker, and they don’t bill CPU time. They do count as a request at the standard Workers request rate, the same as any other invocation. Cache misses and bypasses bill normally — request + CPU time, exactly as they would without caching.
Outcome
Request charge
CPU time charge
Cache HIT (Worker does not run)
Standard rate
Not billed
Cache MISS (Worker runs)
Standard rate
Billed
Cache BYPASS (Worker runs)
Standard rate
Billed
Static asset request
Standard rate
Not billed
Worker-to-worker invocation
Standard rate
Billed if the Worker runs
There’s no separate Workers Cache SKU and no per-GB cache storage fee. Tiered caching, purges, stale-while-revalidate, and the analytics described above are all included. If a request would have run your Worker and Workers Cache serves it as a hit instead, you still pay the standard request rate, but you pay no CPU time for that request. Because of this, that cache hit costs less than rendering the same response in your Worker.
One thing to watch: when caching is enabled, requests that are normally free — static asset requests and worker-to-worker invocations through service bindings or ctx.exports — are billed at the standard request rate, because each one now consults the cache in front of your Worker.
What’s next
Things we know we want to do next:
Smarter co-location with Smart Placement. Today, Cloudflare chooses the upper-tier cache and Smart Placement target separately. On a full miss, the request may travel between Cloudflare locations twice: once to check the upper tier, and again to run your Worker near its data. We’re working to coordinate those choices, so a miss only makes that long-distance trip once.
Larger response size limits. At launch, all responses follow the Free plan’s cacheable size limit (512 MB), regardless of your account. That’s temporary — the standard per-plan cache limits will apply once we finish a few rollout steps.
An API to mark cached responses stale. ctx.cache.purge() removes matching responses from cache. We’re looking at a ctx.cache.invalidate() API that makes matching responses behave as expired, so the next request can still get a fast stale response with stale-while-revalidate while your Worker refreshes the cache in the background.
Try it
Workers Cache is available today to every Worker on any plan.
In a previous post, we described how Netflix uses Apache Druid to ingest millions of events per second and query trillions of rows, providing the real-time insights needed to ensure a high-quality experience for our members. Since that post, our scale has grown considerably.
With our database holding over 10 trillion rows and regularly ingesting up to 15 million events per second, the value of our real-time data is undeniable. But this massive scale introduced a new challenge: queries. The live show monitoring, dashboards, automated alerting, canary analysis, and A/B test monitoring that are built on top of Druid became so heavily relied upon that the repetitive query load started to become a scaling concern in itself.
This post describes an experimental caching layer we built to address this problem, and the trade-offs we chose to accept.
The Problem
Our internal dashboards are heavily used for real-time monitoring, especially during high-profile live shows or global launches. A typical dashboard has 10+ charts, each triggering one or more Druid queries; one popular dashboard with 26 charts and stats generates 64 queries per load. When dozens of engineers view the same dashboards and metrics for the same event, the query volume quickly becomes unmanageable.
Take the popular dashboard above: 64 queries per load, refreshing every 10 seconds, viewed by 30 people. That’s 192 queries per second from one dashboard, mostly for nearly identical data. We still need Druid capacity for automated alerting, canary analysis, and ad-hoc queries. And because these dashboards request a rolling last-few-hours window, each refresh changes slightly as the time range advances.
Druid’s built-in caches are effective. Both the full-result cache and the per-segment cache. But neither is designed to handle the continuous, overlapping time-window shifts inherent to rolling-window dashboards. The full-result cache misses for two reasons.
If the time window shifts even slightly, the query is different, so it’s a cache miss.
Druid deliberately refuses to cache results that involve realtime segments (those still being indexed), because it values deterministic, stable cache results and query correctness over a higher cache hit rate.
The per-segment cache does help avoid redundant scans on historical nodes, but we still need to collect those cached segment results from each data node and merge them in the brokers with data from the realtime nodes for every query.
During major shows, rolling-window dashboards can generate a flood of near-duplicate queries that Druid’s caches mostly miss, creating heavy redundant load. At our scale, solving this by simply adding more hardware is prohibitively expensive.
We needed a smarter approach.
The Insight
When a dashboard requests the last 3 hours of data, the vast majority of that data, everything except the most recent few minutes, is already settled. The data from 2 hours ago won’t change.
What if we could remember the older portions of the result and only ask Druid for the part that’s actually new?
This is the core idea behind a new caching service that understands the structure of Druid queries and serves previously-seen results from cache while fetching only the freshest portion from Druid.
A Deliberate Trade-Off
Before diving into the implementation, it’s worth being explicit about the trade-off we’re making. Caching query results introduces some staleness, specifically, up to 5 seconds for the newest data. This is acceptable for most of our operational dashboards, which refresh every 10 to 30 seconds. In practice, many of our queries already set an end time of now-1m or now-5s to avoid the “flappy tail” that can occur with currently-arriving data.
Since our end-to-end data pipeline latency is typically under 5 seconds at P90, a 5-second cache TTL on the freshest data introduces negligible additional staleness on top of what’s already inherent in the system. We decided it was better to accept this small amount of staleness in exchange for significantly lower query load on Druid. But a 5s cache on its own is not very useful.
Exponential TTLs
Not all data points are equally trustworthy. In real-time analytics, there’s a well-known late-arriving data problem. Events can arrive out of order or be delayed in the ingestion pipeline. A data point from 30 seconds ago might still change as late-arriving events trickle in. A data point from 30 minutes ago is almost certainly final.
We use this observation to set cache TTLs that increase exponentially with the age of the data. Data less than 2 minutes old gets a minimum TTL of 5 seconds. After that, the TTL doubles for each additional minute of age: 10 seconds at 2 minutes old, 20 seconds at 3 minutes, 40 seconds at 4 minutes, and so on, up to a maximum TTL of 1 hour.
The effect is that fresh data cycles through the cache rapidly, so any corrections from late-arriving events in the most recent couple of minutes are picked up quickly. Older data lingers much longer, because our confidence in its accuracy grows with time.
For a 3-hour rolling window, the exponential TTL ensures the vast majority of the query is served from the cache, leaving Druid to only scan the most recent, unsettled data.
Bucketing
If we were to use a single-level cache key for the query and interval, similar to Druid’s existing result-level cache, we wouldn’t be able to extract only the relevant time range from cached results. A shifted window means a different key, which means a cache miss.
Instead, we use a map-of-maps. The top-level key is the query hash without the time interval; the inner keys are timestamps bucketed to the query granularity (or 1 minute, whichever is larger) and encoded as big-endian bytes so lexicographic order matches time. This enables efficient range scans; fetching all cached buckets between times A and B for a query hash. A 3-hour query at 1-minute granularity becomes 180 independent cached buckets, each with its own TTL; when the window shifts (e.g., 30 seconds later), we reuse most buckets from cache and only query Druid for the new data.
How It Works
Today, the cache runs as an external service integrated transparently by intercepting requests at the Druid Router and redirecting them to the cache. If the cache fully satisfies a request, it returns the result; otherwise it shrinks the time interval to the uncached portion and calls back into the Router, bypassing the redirect to query Druid normally. Non-cached requests (e.g., metadata queries or queries without time group-bys) pass straight through to Druid unchanged.
This intercepting proxy design allows us to enable or disable caching without any client changes and is a key to its adoption. We see this setup as temporary while we work out a way to better integrate this capability into Druid more natively.
When a cacheable query arrives, those that are grouping-by time (timeseries, groupBy), the cache performs the following steps.
Parsing and Hashing. We parse each incoming query to extract the time interval, granularity, and structure, then compute a SHA-256 hash of the query with the time interval and parts of the context removed. That hash is the cache key: it encodes what is being asked (datasource, filters, aggregations, granularity) but not when, so the same logical query over different overlapping time windows maps to the same cache entry. There are some context properties that can alter the response structure or contents, so these are included in the cache-key.
Cache Lookup. Using the cache key, we fetch cached points within the requested range, but only if they’re contiguous from the start. Because bucket TTLs can expire unevenly, gaps can appear; when we hit a gap, we stop and fetch all newer data from Druid. This guarantees a complete, unbroken result set while sending at most one Druid query, rather than “filling gaps” with multiple small, fragmented queries that would increase Druid load.
Fetching the Missing Tail. On a partial cache hit (e.g., 2h 50m of a 3h window), we rebuild the query with a narrowed interval for the missing 10 minutes and send only that to Druid. Since Druid then scans just the recent segments for a small time range, the query is usually faster and cheaper than the original.
Combining. The cached data and fresh data are concatenated, sorted by timestamp, and returned to the client. From the client’s perspective, the response looks identical to what Druid would have returned, same JSON format, same fields.
Asynchronous Caching. The fresh data from Druid is parsed into individual time-granularity buckets and written back to the cache asynchronously, so we don’t add latency to the response path.
Negative Caching
Some metrics are sparse. Certain time buckets may genuinely have no data. Without special handling, the cache would treat these empty buckets as gaps and re-query Druid for them every time.
We handle this by caching empty sentinel values for time buckets where Druid returned no data. Our gap-detection logic recognizes these empty entries as valid cached data rather than missing data, preventing needless re-queries for naturally sparse metrics.
However, we’re careful not to negative-cache trailing empty buckets. If a query returns data up to minute 45 and nothing after, we only cache empty entries for gaps between data points, not after the last one. This avoids incorrectly caching “no data” for time periods where events simply haven’t arrived yet, which would exacerbate the chart delays of late arriving data.
The Storage Layer
For the backing store, we use Netflix’s Key-Value Data Abstraction Layer (KVDAL), backed by Cassandra. KVDAL provides a two-level map abstraction, a natural fit for our needs. The outer key is the query hash, and the inner keys are timestamps. Crucially, KVDAL supports independent TTLs on each inner key-value pair, eliminating the need for us to manage cache eviction manually.
This two-level structure gives us efficient range queries over the inner keys, which is exactly what we need for partial cache lookups: “give me all cached buckets between time A and time B for query hash X.”
Results
The biggest win is during high-volume events (e.g., live shows): when many users view the same dashboards, the cache serves most identical queries as full hits, so the query rate reaching Druid is essentially the same with 1 viewer or 100. The scaling bottleneck moves from Druid’s query capacity to the much cheaper-to-scale cache, and with ~5.5 ms P90 cache responses, dashboards load faster for everyone.
On a typical day, 82% of real user queries get at least a partial cache hit, and 84% of result data is served from cache. As a result, the queries that reach Druid scan much narrower time ranges, touching fewer segments and processing less data, freeing Druid to focus on aggregating the newest data instead of repeatedly re-querying historical segments.
An experiment validated this, showing about a 33% drop in queries to Druid and a 66% improvement in overall P90 query times. It also cut result bytes and segments queried, and in some cases, enabling the cache reduced result bytes by more than 14x. Caveat: the size of these gains depends heavily on how similar and repetitive the query workload is.
Looking Ahead
This caching layer is still experimental, but results are promising and we’re exploring next steps. We’ve added partial support for templated SQL so dashboard tools can benefit without writing native Druid queries.
Longer term, we’d like interval-aware caching to be built into Druid: an external proxy adds infrastructure to manage, extra network hops, and workarounds (like SQL templating) to extract intervals. Implemented inside Druid, it could be more efficient, with direct access to the query planner and segment metadata, and benefit the broader community without custom infrastructure. We’d likely ship it as an opt-in, configurable, result-level cache in the Brokers, with metrics to tune TTLs and measure effectiveness. Please leave a comment if you have a use-case that could benefit from this feature.
More broadly, this strategy, splitting time-series results into independently cached, granularity-aligned buckets with age-based exponential TTLs, isn’t Druid-specific and could apply to any time-series database with frequent overlapping-window queries.
Summary
As more Netflix teams rely on real-time analytics, query volume grows too. Dashboards are essential at our scale, but their popularity can become a scaling bottleneck. By inserting an intelligent cache between dashboards and Druid, one that understands query structure, breaks results into granularity-aligned buckets, and trades a small amount of staleness for much lower Druid load, we’ve increased query capacity without scaling infrastructure proportionally, and hope to deliver these benefits to the Druid community soon as a built-in Druid feature.
Sometimes the best way to handle a flood of queries is to stop answering the same question twice.
Cloudflare data shows that 32% of traffic across our network originates from automated traffic. This includes search engine crawlers, uptime checkers, ad networks — and more recently, AI assistants looking to the web to add relevant data to their knowledge bases as they generate responses with retrieval-augmented generation (RAG). Unlike typical human behavior, AI agents, crawlers, and scrapers’ automated behavior may appear aggressive to the server responding to the requests.
For instance, AI bots frequently issue high-volume requests, often in parallel. Rather than focusing on popular pages, they may access rarely visited or loosely related content across a site, often in sequential, complete scans of the websites. For example, an AI assistant generating a response may fetch images, documentation, and knowledge articles across dozens of unrelated sources.
Although Cloudflare already makes it easy to control and limit automated access to your content, many sites may want to serve AI traffic. For instance, an application developer may want to guarantee that their developer documentation is up-to-date in foundational AI models, an e-commerce site may want to ensure that product descriptions are part of LLM search results, or publishers may want to get paid for their content through mechanisms such as pay per crawl.
Website operators therefore face a dichotomy: tune for AI crawlers, or for human traffic. Given both exhibit widely different traffic patterns, current cache architectures force operators to choose one approach to save resources.
In this post, we’ll explore how AI traffic impacts storage cache, describe some challenges associated with mitigating this impact, and propose directions for the community to consider adapting CDN cache to the AI era.
Let’s start with a quick refresher on caching. When a user initiates a request for content on their device, it’s usually sent to the Cloudflare data center closest to them. When the request arrives, we check to see if we have a valid cached copy. If we do, we can serve the content immediately, resulting in a fast response, and a happy user. If the content isn’t available to read from our cache, (a “cache miss”), our data centers reach out to the origin server to get a fresh copy, which then stays in our cache until it expires or other data pushes it out.
Keeping the right elements in our cache is critical for reducing our cache misses and providing a great user experience — but what’s “right” for human traffic may be very different from what’s right for AI crawlers!
AI traffic at Cloudflare
Here, we’ll focus on AI crawler traffic, which has emerged as the most active AI bot type in recent analyses, accounting for 80% of the self-identified AI bot traffic we see. AI crawlers fetch content to support real-time AI services, such as answering questions or summarizing pages, as well as to harvest data to build large training datasets for models like LLMs.
From Cloudflare Radar, we see that the vast majority of single-purpose AI bot traffic is for training, with search as a distant second. (See this blog post for a deep discussion of the AI crawler traffic we see at Cloudflare).
While both search and training crawls impact cache through numerous sequential, long-tail accesses, training traffic has properties such as high unique URL ratio, content diversity, and crawling inefficiency that make it even more impactful on cache.
How does AI traffic differ from other traffic for a CDN?
AI crawler traffic has three main differentiating characteristics: high unique URL ratio, content diversity, and crawling inefficiency.
Public crawl statistics from Common Crawl, which performs large-scale web crawls on a monthly basis, show that over 90% of pages are unique by content. Different AI crawlers also target distinct content types: e.g., some specialize in technical documentation, while others focus on source code, media, or blog posts. Finally, AI crawlers do not necessarily follow optimal crawling paths. A substantial fraction of fetches from popular AI crawlers result in 404 errors or redirects, often due to poor URL handling. The rate of these ineffective requests varies depending on how well the crawler is tuned to target live, meaningful content. AI crawlers also typically do not employ browser-side caching or session management in the same way human users do. AI crawlers can launch multiple independent instances, and because they don’t share sessions, each may appear as a new visitor to the CDN, even if all instances request the same content.
Even a single AI crawler is likely to dig deeper into websites and explore a broader range of content than a typical human user. Usage data from Wikipedia shows that pages once considered “long-tail” or rarely accessed are now being frequently requested, shifting the distribution of content popularity within a CDN’s cache. In fact, AI agents may iteratively loop to refine search results, scraping the same content repeatedly. We model this to show that this iterative looping leads to low content reuse and broad coverage.
Our modeling of AI agent behavior shows that as they iteratively loop to refine search results (a common pattern for retrieval-augmented generation), they maintain a consistently high unique access ratio (the red columns above) — typically between 70% and 100%. This means that each loop, while generally increasing accuracy for the agent (represented here by the blue line), is constantly fetching new, unique content rather than revisiting previously seen pages.
This repeat access to long-tail assets churns the cache that the human traffic relies on. That could make existing pre-fetching and traditional cache invalidation strategies less effective as the amount of crawler traffic increases.
How does AI traffic impact cache?
For a CDN, a cache miss means having to go to the origin server to fetch the requested content. Think of a cache miss like your local library not having a book in house, so you have to wait to get the book from inter-library loan. You’ll get your book eventually, but it will take longer than you wanted. It will also inform your library that having that book in stock locally could be a good idea.
As a result of their broad, unpredictable access patterns with long-tail reuse, AI crawlers significantly raise the cache miss rate. And many of our typical methods to improve our cache hit rate, such as cache speculation or prefetching, are significantly less effective.
The first chart below shows the difference in cache hit rates for a single node in Cloudflare’s CDN with and without our identified AI crawlers. While the impact of crawlers is still relatively limited, there is a clear drop in hit rate with the addition of AI crawler traffic. We manage our cache with an algorithm called “least recently used”, or LRU. This means that the least-requested content can be evicted from cache first to make space for more popular content when storage space is full. The drop in hit rate implies that LRU is struggling under the repeated scan behavior of AI crawlers.
The bottom figure shows Al cache misses during this time. Each of those cache misses represents a request to the origin, slowing response times as well as increasing egress costs and load on the origin.
This surge in AI bot traffic has had real-world impact. The following table from our paper shows the effects on several large websites. Each example links to its source report.
The impact is severe: Wikimedia experienced a 50% surge in multimedia bandwidth usage due to bulk image scraping. Fedora, which hosts large software packages, and the Diaspora social network suffered from heavy load and poor performance for human users. Many others have noted bandwidth increases or slowdowns from AI bots repeatedly downloading large files. While blocking crawler traffic mitigates some of the impact, a smarter cache architecture would let site operators serve AI crawlers while maintaining response times for their human users.
AI-aware caching
AI crawlers power live applications such as retrieval-augmented generation (RAG) or real-time summarization, so latency matters. That’s why these requests should be routed to caches that can balance larger capacity with moderate response times. These caches should still preserve freshness, but can tolerate slightly higher access latency than human-facing caches.
AI crawlers are also used for building training sets and running large-scale content collection jobs. These workloads can tolerate significantly higher latency and are not time-sensitive. As such, their requests can be served from deep cache tiers that take longer to reach (e.g., origin-side SSD caches), or even delayed using queue-based admission or rate-limiters to prevent backend overload. This also opens the opportunity to defer bulk scraping when infrastructure is under load, without affecting interactive human or AI use cases.
Existing projects like Cloudflare’s AI Index and Markdown for Agents allow website operators to present a simplified or reduced version of websites to known AI agents and bots. We’re making plans to do much more to mitigate the impact of AI traffic on CDN cache, leading to better cache performance for everyone. With our collaborators at ETH Zurich, we’re experimenting with two complementary approaches: first, traffic filtering with AI-aware caching algorithms; and second, exploring the addition of an entirely new cache layer to siphon AI crawler traffic to a cache that will improve performance for both AI crawlers and human traffic.
There are several different types of cache replacement algorithms, such as LRU (“Least Recently Used”), LFU (“Least Frequently Used”), or FIFO (“First-In, First-Out”), that govern how a storage cache chooses to evict elements from the cache when a new element needs to be added and the cache is full. LRU is often the best balance of simplicity, low-overhead, and effectiveness for generic situations, and is widely used. For mixed human and AI bot traffic, however, our initial experiments indicate that a different choice of cache replacement algorithm, particularly using SEIVE or S3FIFO, could allow human traffic to achieve the same hit rate with or without AI interference. We are also experimenting with developing more directly workload-aware, machine learning-based caching algorithms to customize cache response in real time for a faster and cheaper cache.
Long term, we expect that a separate cache layer for AI traffic will be the best way forward. Imagine a cache architecture that routes human and AI traffic to distinct tiers deployed at different layers of the network. Human traffic would continue to be served from edge caches located at CDN PoPs, which prioritize responsiveness and cache hit rates. For AI traffic, cache handling could vary by task type.
This is just the beginning
The impact of AI bot traffic on cloud infrastructure is only going to grow over the next few years. We need better characterization of the effects on CDNs across the globe, along with bold new cache policies and architectures to address this novel workload and help make a better Internet.
Cloudflare is already solving the problems we’ve laid out here. Cloudflare reduces bandwidth costs for customers who experience high bot traffic with our AI-aware caching, and with our AI Crawl Control and Pay Per Crawl tools, we give customers better control over who programmatically accesses their content.
We’re just getting started exploring this space. If you’re interested in building new ML-based caching algorithms or designing these new cache architectures, please apply for an internship! We have open internship positions in Summer and Fall 2026 to work on this and other exciting problems at the intersection of AI and Systems.
Cloudflare launched fifteen years ago with a mission to help build a better Internet. Over that time the Internet has changed and so has what it needs from teams like ours. In this year’s Founder’s Letter, Matthew and Michelle discussed the role we have played in the evolution of the Internet, from helping encryption grow from 10% to 95% of Internet traffic to more recent challenges like how people consume content.
This year’s themes focused on helping prepare the Internet for a new model of monetization that encourages great content to be published, fostering more opportunities to build community both inside and outside of Cloudflare, and evergreen missions like making more features available to everyone and constantly improving the speed and security of what we offer.
We shipped a lot of new things this year. In case you missed the dozens of blog posts, here is a breakdown of everything we announced during Birthday Week 2025.
To support a diverse and open Internet, we are now sponsoring Ladybird (an independent browser) and Omarchy (an open-source Linux distribution and developer environment).
We are opening our office doors in four major cities (San Francisco, Austin, London, and Lisbon) as free hubs for startups to collaborate and connect with the builder community.
We are removing cost as a barrier for the next generation by giving students with .edu emails 12 months of free access to our paid developer platform features.
We are partnering with Coinbase to create the x402 Foundation, encouraging the adoption of the x402 protocol to allow clients and services to exchange value on the web using a common language
Our Automatic SSL/TLS system has upgraded over 6 million domains to more secure encryption modes by default and will soon automatically enable post-quantum connections.
We made our CSAM Scanning Tool easier to adopt by removing the need to create and provide unique credentials, helping more site owners protect their platforms.
Updates across Workers and beyond for a more powerful developer platform – such as support for larger and more concurrent Container images, support for external models from OpenAI and Anthropic in AI Search (previously AutoRAG), and more.
A deep-dive into how we’ve hardened the Workers runtime with new defense-in-depth security measures, including V8 sandboxes and hardware-assisted memory protection keys.
We announced the Cloudflare Email Service private beta, allowing developers to reliably send and receive transactional emails directly from Cloudflare Workers.
The TCP Connection Time (Trimean) graph shows that we are the fastest TCP connection time in 40% of measured ISPs – and the fastest across the top networks.
We are using our network’s vast performance data to tune congestion control algorithms, improving speeds by an average of 10% for QUIC traffic.
Come build with us!
Helping build a better Internet has always been about more than just technology. Like the announcements about interns or working together in our offices, the community of people behind helping build a better Internet matters to its future. This week, we rolled out our most ambitious set of initiatives ever to support the builders, founders, and students who are creating the future.
For founders and startups, we are thrilled to welcome Cohort #6 to the Workers Launchpad, our accelerator program that gives early-stage companies the resources they need to scale. But we’re not stopping there. We’re opening our doors, literally, by launching new physical hubs for startups in our San Francisco, Austin, London, and Lisbon offices. These spaces will provide access to mentorship, resources, and a community of fellow builders.
We’re also investing in the next generation of talent. We announced free access to the Cloudflare developer platform for all students, giving them the tools to learn and experiment without limits. To provide a path from the classroom to the industry, we also announced our goal to hire 1,111 interns in 2026 — our biggest commitment yet to fostering future tech leaders.
And because a better Internet is for everyone, we’re extending our support to non-profits and public-interest organizations, offering them free access to our production-grade developer tools, so they can focus on their missions.
Whether you’re a founder with a big idea, a student just getting started, or a team working for a cause you believe in, we want to help you succeed.
Until next year
Thank you to our customers, our community, and the millions of developers who trust us to help them build, secure, and accelerate the Internet. Your curiosity and feedback drive our innovation.
It’s been an incredible 15 years. And as always, we’re just getting started!
Cloudflare has servers in 330 cities spread across 125+ countries. All of these servers run Quicksilver, which is a key-value database that contains important configuration information for many of our services, and is queried for all requests that hit the Cloudflare network.
Because it is used while handling requests, Quicksilver is designed to be very fast; it currently responds to 90% of requests in less than 1 ms and 99.9% of requests in less than 7 ms. Most requests are only for a few keys, but some are for hundreds or even more keys.
Quicksilver currently contains over five billion key-value pairs with a combined size of 1.6 TB, and it serves over three billion keys per second, worldwide. Keeping Quicksilver fast provides some unique challenges, given that our dataset is always growing, and new use cases are added regularly.
Quicksilver used to store all key-values on all servers everywhere, but there is obviously a limit to how much disk space can be used on every single server. For instance, the more disk space used by Quicksilver, the less disk space is left for content caching. Also, with each added server that contains a particular key-value, the cost of storing that key-value increases.
This is why disk space usage has been the main battle that the Quicksilver team has been waging over the past several years. A lot was done over the years, but we now think that we have finally created an architecture that will allow us to get ahead of the disk space limitations and finally make Quicksilver scale better.
The size of the Quicksilver database has grown by 50% to about 1.6 TB in the past year
What we talked about previously
Part one of the story explained how Quicksilver V1 stored all key-value pairs on each server all around the world. It was a very simple and fast design, it worked very well, and it was a great way to get started. But over time, it turned out to not scale well from a disk space perspective.
The problem was that disk space was running out so fast that there was not enough time to design and implement a fully scalable version of Quicksilver. Therefore, Quicksilver V1.5 was created first. It halved the disk space used on each server compared to V1.
For this, a new proxy mode was introduced for Quicksilver. In this mode, Quicksilver does not contain the full dataset anymore, but only contains a cache. All cache misses are looked up on another server that runs Quicksilver with a full dataset. Each server runs about ten separate instances of Quicksilver, and all have different databases with different sets of key-values. We call Quicksilver instances with the full data set replicas.
For Quicksilver V1.5, half of those instances on a particular server would run Quicksilver in proxy mode, and therefore would not have the full dataset anymore. The other half would run in replica mode. This worked well for a time, but it was not the final solution.
Building this intermediate solution had the added benefit of allowing the team to gain experience running an even more distributed version of Quicksilver.
The problem
There were a few reasons why Quicksilver V1.5 was not fully scalable.
First, the size of the separate instances were not very stable. The key-space is owned by the teams that use Quicksilver, not by the Quicksilver team, and the way those teams use Quicksilver changes frequently. Furthermore, while most instances grow in size over time, some instances have actually gotten smaller, such as when the use of Quicksilver is optimised by teams. The result of this is that the split of instances that was well-balanced at the start, quickly became unbalanced.
Second, the analyses that were done to estimate how much of the key space would need to be in cache on each server assumed that taking all keys that were accessed in a three-day period would represent a good enough cache. This assumption turned out to be wildly off. This analysis estimated that we needed about 20% of the key space in cache, which turned out to not be entirely accurate. Whereas most instances did have a good cache hit rate, with 20% or less of the key space in cache, some instances turned out to need a much higher percentage.
The main issue, however, was that reducing the disk space used by Quicksilver on our network by as much as 40% does not actually make it more scalable. The number of key-values that are stored in Quicksilver keeps growing. It only took about two years before disk space was running low again.
The solution
Except for a handful of special storage servers, Quicksilver does not contain the full dataset anymore, but only cache. Any cache misses will be looked up in replicas on our storage servers, which do have the full dataset.
The solution to the scalability problem was brought on by a new insight. As it turns out, numerous key-values were actually almost never used. We call these cold keys. There are different reasons for these cold keys: some of them were old and not well cleaned up, some were used only in certain regions or in certain data centers, and some were not used for a very long time or maybe not at all (a domain name that is never looked up for example or a script that was uploaded but never used).
At first, the team had been considering solving our scalability problem by splitting up the entire dataset into shards and distributing those across the servers in the different data centers. But sharding the full dataset adds a lot of complexity, corner cases, and unknowns. Sharding also does not optimize for data locality. For example, if the key-space is split into 4 shards and each server gets one shard, that server can only serve 25% of the requested keys from its local database. The cold keys would also still be contained in those shards and would take up disk space unnecessarily.
Another data structure that is much better at data locality and explicitly avoids storing keys that are never used is a cache. So it was decided that only a handful of servers with large disks would maintain the full data set, and all other servers would only have a cache. This was an obvious evolution from Quicksilver V1.5. Caching was already being done on a smaller scale, so all the components were already available. The caching proxies and the inter-data center discovery mechanisms were already in place. They had been used since 2021 and were therefore thoroughly battle tested. However, one more component needed to be added.
There was a concern that having all instances on all servers connect to a handful of storage nodes with replicas would overload them with too many connections. So a Quicksilver relay was added. For each instance, a few servers would be elected within each data center on which Quicksilver would run in relay mode. The relays would maintain the connections to the replicas on the storage nodes. All proxies inside a data center would discover those relays and all cache misses would be relayed through them to the replicas.
This new architecture worked very well. The cache hit rates still needed some improvement, however.
Prefetching the future
Every resolved cache miss is prefetched by all servers in the data center
We had a hypothesis that prefetching all keys that were cache misses on the other servers inside the same data center would improve the cache hit rate. So an analysis was done, and it indeed showed that every key that was a cache miss on one server in a data center had a very high probability of also being a cache miss on another server in the same data center sometime in the near future. Therefore, a mechanism was built that distributed all resolved cache misses on relays to all other servers.
All cache misses in a data center are resolved by requesting them from a relay, which subsequently forwards the requests to one of the replicas on the storage nodes. Therefore, the prefetching mechanism was implemented by making relays publish a stream of all resolved cache misses, to which all Quicksilver proxies in the same data center subscribe. The resulting key-values were then added to the proxy local caches.
This strategy is called reactive prefetching, because it fills caches only with the key-values that directly resulted from cache misses inside the same data center. Those prefetches are a reaction to the cache misses. Another way of prefetching is called predictive prefetching, in which an algorithm tries to predict which keys that have not yet been requested will be requested in the near future. A few approaches for making these predictions were tried, but they did not result in any improvement, and so this idea was abandoned.
With the prefetching enabled, cache hit rates went up to about 99.9% for the worst performing instance. This was the goal that we were trying to reach. But while rolling this out to more of our network, it turned out that there was one team that needed an even higher cache hit rate, because the tail latencies they were seeing with this new architecture were too high.
This team was using a Quicksilver instance called dnsv2. This is a very latency sensitive instance, because it is the one from which DNS queries are served. Some of the DNS queries under the hood need multiple queries to Quicksilver, so any added latency to Quicksilver multiplies for them. This is why it was decided that one more improvement to the Quicksilver cache was needed.
The level 1 cache hit-rate is 99.9% or higher, on average.
Back to the sharding
Before going to a replica in another data center, a cache miss is first looked up in a data center-wide sharded cache
The instance on which higher cache hit rates were required was also the instance on which the cache performed the worst. The cache works with a retention time, defined as the number of days a key-value is kept in cache after it was last accessed, after which it is evicted from the cache. An analysis of the cache showed that this instance needed a much longer retention time. But, a higher retention time also causes the cache to take up more disk space — space that was not available.
However, while running Quicksilver V1.5, we had already noticed the pattern that caches generally performed much better in smaller data centers as compared to larger ones. This sparked the hypothesis that led to the final improvement.
It turns out that smaller data centers, with fewer servers, generally needed less disk space for their cache. Vice versa, the more servers there are in a data center, the larger the Quicksilver cache needs to be. This is easily explained by the fact that larger data centers generally serve larger populations, and therefore have a larger diversity of requests. More servers also means more total disk space available inside the data center. To be able to make use of this pattern the concept of sharding was reintroduced.
Our key space was split up into multiple shards. Each server in a data center was assigned one of the shards. Instead of those shards containing the full dataset for their part of the key space, they contain a cache for it. Those cache shards are populated by all cache misses inside the data center. This all forms a data center-wide cache that is distributed using sharding.
The data locality issue that sharding the full dataset has, as described above, is solved by keeping the local per-server caches as well. The sharded cache is in addition to the local caches. All servers in a data center contain both their local cache and a cache for one physical shard of the sharded cache. Therefore, each requested key is first looked up in the server’s local cache, after that the data center-wide sharded cache is queried, and finally if both caches miss the requested key, it is looked up on one of the storage nodes.
The key space is split up into separate shards by first dividing hashes of the keys by range into 1024 logical shards. Those logical shards are then divided up into physical shards, again by range. Each server gets one physical shard assigned by repeating the same process on the server hostname.
Each server contains one physical shard. A physical shard contains a range of logical shards. A local shard contains a range of the ordered set that result from hashing all keys.
This approach has the advantage that the sharding factor can be scaled up by factors of two without the need for copying caches to other servers. When the sharding factor is increased in this way, the servers will automatically get a new physical shard assigned that contains a subset of the key space that the previous physical shard on that server contained. After this has happened, their cache will contain supersets of the needed cache. The key-values that are not needed anymore will be evicted over time.
When the number of physical shards are doubled the servers will automatically get new physical shards that are subsets of their previous physical shards, therefore still have the relevant key-values in cache.
This approach means that the sharded caches can easily be scaled up when needed as the number of keys that are in Quicksilver grows, and without any need for relocating data. Also, shards are well-balanced due to the fact that they contain uniform random subsets of a very large key-space.
Adding new key-values to the physical cache shards piggybacks on the prefetching mechanism, which already distributes all resolved cache misses to all servers in a data center. The keys that are part of the key space for a physical shard on a particular server are just kept longer in cache than the keys that are not part of that physical shard.
Another reason why a sharded cache is simpler than sharding the full key-space is that it is possible to cut some corners with a cache. For instance, looking up older versions of key-values (as used for multiversion concurrency control) is not supported on cache shards. As explained in an earlier blog post, this is needed for consistency when looking up key-values on different servers, when that server has a newer version of the database. It is not needed in the cache shards, because lookups can always fall back to the storage nodes when the right version is not available.
Proxies have a recent keys window that contains all recently written key-values. A cache shard only has its cached key-values. Storage replicas contain all key-values and on top of that they contain multiple versions for recently written key-values. When the proxy, that has database version 1000, has a cache miss for key1 it can be seen that the version of that key on the cache shard was written at database version 1002 and therefore is too new. This means that it is not consistent with the proxy’s database version. This is why the relay will fetch that key from a replica instead, which can return the earlier consistent version. In contrast, key2 on the cache shard can be used, because it was written at index 994, well below the database version of the proxy.
There is only one very specific corner case in which a key-value on a cache shard cannot be used. This happens when the key-value in the cache shard was written at a more recent database version than the version of the proxy database at that time. This would mean that the key-value probably has a different value than it had at the correct version. Because, in general, the cache shard and the proxy database versions are very close to each other, and this only happens for key-values that were written in between those two database versions, this happens very rarely. As such, deferring the lookup to storage nodes has no noticeable effect on the cache hit rate.
Tiered Storage
To summarize, Quicksilver V2 has three levels of storage.
Level 1: The local cache on each server that contains the key-values that have most recently been accessed.
Level 2: The data center wide sharded cache that contains key-values that haven’t been accessed in a while, but do have been accessed.
Level 3: The replicas on the storage nodes that contain the full dataset, which live on a handful of storage nodes and are only queried for the cold keys.
The results
The percentage of keys that can be resolved within a data center improved significantly by adding the second caching layer. The worst performing instance has a cache hit rate higher than 99.99%. All other instances have a cache hit rate that is higher than 99.999%.
The combined level 1 and level 2 cache hit-rate is 99.99% or higher for the worst caching instance.
Final notes
It took the team quite a few years to go from the old Quicksilver V1, where all data was stored on each server to the tiered caching Quicksilver V2, where all but a handful of servers only have cache. We faced many challenges, including migrating hundreds of thousands of live databases without interruptions, while serving billions of requests per second. A lot of code changes were rolled out, with the result that Quicksilver now has a significantly different architecture. All of this was done transparently to our customers. It was all done iteratively, always learning from the previous step before taking the next one. And always making sure that, if at all possible, all changes are easy to revert. These are important strategies for migrating complex systems safely.
And finally, a big thanks to the rest of the Quicksilver team, because we all do this together: Aleksandr Matveev, Aleksei Surikov, Alex Dzyoba, Alexandra (Modi) Stana-Palade, Francois Stiennon, Geoffrey Plouviez, Ilya Polyakovskiy, Manzur Mukhitdinov, Volodymyr Dorokhov.
Quicksilver is a key-value store developed internally by Cloudflare to enable fast global replication and low-latency access on a planet scale. It was initially designed to be a global distribution system for configurations, but over time it gained popularity and became the foundational storage system for many products in Cloudflare.
A previous post described how we moved Quicksilver to production and started replicating on all machines across our global network. That is what we called Quicksilver v1: each server has a full copy of the data and updates it through asynchronous replication. The design served us well for some time. However, as our business grew with an ever-expanding data center footprint and a growing dataset, it became more and more expensive to store everything everywhere.
We realized that storing the full dataset on every server is inefficient. Due to the uniform design, data accessed in one region or data center is replicated globally, even if it’s never accessed elsewhere. This leads to wasted disk space. We decided to introduce a more efficient system with two new server roles: replica, which stores the full dataset and proxy, which acts as a persistent cache, evicting unused key-value pairs to free up some disk space. We call this design Quicksilver v1.5 – an interim step towards a more sophisticated and scalable system.
To understand how those two roles helped us reduce disk space usage, we first need to share some background on our setup and introduce some terminology. Cloudflare is architected in a way where we have a few hyperscale core data centers that form our control plane, and many smaller data centers distributed across the globe where resources are more constrained. Quicksilver has dozens of servers in the core data centers with terabytes of storage called root nodes. In the smaller data centers, though, things are different. A typical data center has two types of nodes: intermediate nodes and leaf nodes. Intermediate servers replicate data either from the other intermediate nodes or directly from the root nodes. Leaf nodes serve end user traffic, and receive updates from intermediate servers, effectively being leaves of a replication tree. Disk capacity varies significantly between node types. While root nodes aren’t facing an imminent disk space bottleneck, it’s a definite concern for leaf nodes.
Every server – whether it’s a root, intermediate, or leaf – hosts 10 Quicksilver instances. These are independent databases, each used by specific Cloudflare services or products such as the DNS, CDN or WAF.
Figure 1. Global Quicksilver
Let’s consider the role distribution. Instead of hosting ten full datasets on every machine within a data center, what if we deploy only a few replicas in each? The remaining servers would be proxies, maintaining a persistent cache of hot keys and querying replicas for any cache misses.
Figure 2. Role allocation for different Quicksilver instances
Data centers across our network are very different in size, ranging from hundreds of servers to a single rack with just a few servers. To ensure every data center has at least one replica, the simplest initial step is an even split: on each server, place five replicas of some instances and five proxies for others. The change immediately frees up disk space, as the cached hot dataset on a proxy should be smaller than a full replica. While it doesn’t remove the bottleneck entirely, it could, in theory, lead to an up to 50% reduction in disk space usage. More importantly, it lays the foundation for a new distributed design of Quicksilver, where queries can be served by multiple machines in a data center, paving the way for further horizontal scaling. Additionally, an iterative approach helps to battle-proof the code changes earlier.
Can it even work?
Before committing to building Quicksilver v1.5, we wanted to be sure that the proxy/replica design would actually work for our workload. If proxies needed to cache the entire dataset for good performance, then it would be a dead end, offering no potential disk space benefits. To assess this, we built a data pipeline which pushes accessed keys from all across our network to ClickHouse. This allowed us to estimate typical sizes of working sets. Our analysis revealed that:
in large data centers approximately, 20% of the keyspace was in use
in small data centers this number dropped to just about 1%
These findings gave us confidence that the caching approach should work, though it wouldn’t be without its challenges.
Persistent caching
When talking about caches, the first thing that comes to mind is an in-memory cache. However, this cannot work for Quicksilver for two main reasons: memory usage and the “cold cache” problem.
Indeed, with billions of stored keys, even a fraction of them would lead to an unmanageable increase in memory usage. System restarts should not affect performance, which means that cache data must be preserved somewhere anyway. So we decided to make the cache persistent and store it in the same way as full datasets: in our embedded RocksDB. Thus, cached keys normally sit on disk and can be retrieved on-demand with low memory footprint.
When a key cannot be found in the proxy’s cache, we request it from a replica using our internal distributed key-value protocol, and put it into a local cache after processing.
Evictions are based on RocksDB compaction filters. Compaction filters allow defining custom logic executed in background RocksDB threads responsible for compacting files on disk. Each key-value pair is processed with a filter on a regular basis, evicting least recently used data from the disk when available disk space drops below a certain threshold called a soft limit. To track keys accessed on disk, we have an LRU-like in-memory data structure, which is passed to the compaction filter to set last access date in key metadata and inform potential evictions.
However, with some specific workloads there is still a chance that evictions will not keep up with disk space growth, and for this scenario we have a hard limit: when available disk space drops below a critical threshold, we temporarily stop adding new keys to the cache. This hurts performance, but it acts as a safeguard, ensuring our proxies remain stable and don’t overflow under a massive surge of requests.
Consistency and asynchronous replication
Quicksilver has, from the start, provided sequential consistency to clients: if key A was written before B, it’s not possible to read B and not A. We are committed to maintaining this guarantee in the new design. We have experienced Hyrum’s Law first hand, with Quicksilver being so widely adopted across the company that every property we introduced in earlier versions is now relied upon by other teams. This means that changing behaviour would inevitably break existing functionality and introduce bugs.
However, there is one thing standing in our way: asynchronous replication. Quicksilver replication is asynchronous mainly because machines in different parts of the world replicate at different speeds, and we don’t want a single server to slow down the entire tree. But it turns out in a proxy-replica design, independent replication progress can result in non-monotonic reads!
Consider the following scenario: a client sequentially writes keys A, B, C, .. K one after another to the Quicksilver root node. These keys are asynchronously replicated through data centers across our network with varying latency. Imagine we have a proxy on index 5, which has observed keys from A to E, and two replicas:
replica_1 is at index 2 (slightly behind the proxy), having only received A and B
replica_2 at index 9, which is slightly ahead due to a faster replication path and has received all keys from A to I
Figure 3. Asynchronous replication in QSv1.5
Now, a client performs two successive requests on a proxy, each time reading the keys E, F, G, H and I. For simplicity, we assume these keys are not cacheable (for example, due to low disk space). The proxy’s first remote request is routed to replica_2, which already has all keys and responds back with values. To prevent hot spots in a data center, we load balance requests from proxies, and the next one lands on replica_1, which hasn’t received any of the requested keys yet, and responds with a “not found” error.
So, which result is correct?
The correct behavior here is that of Quicksilver v1, which we aim to preserve. If the server on replication index 5 were a replica instead of a proxy, it would have seen updates for keys A through E inclusive, resulting in E being the only key in both replies, while all other keys cannot be found yet. Which means responses from both replica_1 and replica_2 are wrong!
Therefore, to maintain previous guarantees and API backwards compatibility, Quicksilver v1.5 must address two crucial consistency problems: cases where the replica is ahead of the proxy, and conversely, where it lags behind. For now let’s focus on the case where a proxy lags behind a replica.
Multiversion concurrency control
In our example, replica_2 responds to a request from a proxy “from the past”. We cannot use any locks for synchronizing two servers, as it would introduce undesirable delays to the replication tree, defeating the purpose of asynchronous replication. The only option is for replicas to maintain a history of recent updates. This naturally leads us to implementing multiversion concurrency control (MVCC), a popular database mechanism for tracking changes in a non-blocking fashion, where for any key we can keep multiple versions of its values for different points in time.
With MVCC, we no longer overwrite the latest value of a key in the default column family for every update. Instead, we introduced a new MVCC column family in RocksDB, where all updates are stored with a corresponding replication index. Lookup for a key at some index in the past goes as follows:
First we search in the default column family. If a key is found and the write timestamp is not greater than the index of a requesting proxy, we can use it straight away.
Otherwise, we begin scanning the MVCC column family, where keys have unique suffixes based on latest timestamps for which they are still valid.
In the example above, replica_2 has MVCC enabled and has keys A@1 .. K@11 in its default column family. The MVCC is initially empty, because no keys have been overwritten yet. When it receives a request for, say, key H with target index 5, it first makes a lookup in a default column family and finds the given key, but its timestamp is 8, which means this version should not be visible to the proxy yet. It then scans the MVCC, finds no matching previous versions and responds with “not found” to the proxy. Should key H be updated twice at indexes 4 and 8, we would have placed the initial version into MVCC before overwriting it in the default column family, and the proxy would receive the first version in response.
If a key E is requested at index 5, replica_2 can find it quickly in the default column family and return it back to the proxy. There is no need to read from MVCC, as the timestamp of the latest version (5) satisfies the request.
Another corner case to consider is deletions. When a key is deleted and then re-written, we need to explicitly mark the period of removal in MVCC. For that we’ve implemented tombstones – a special value format for absent keys.
Finally, we need to make sure that key history is not growing uncontrollably, using up all of the disk space available. Luckily we don’t actually need to record history for a long period of time, it just needs to cover the maximum replication index difference between any two machines. And in practice, a two-hour interval turned out to be way more than enough, while adding only about 500 MB of extra disk space usage. All records in the MVCC column family older than two hours are garbage collected, and for that again we use custom RocksDB compaction filters.
Sliding window
Now we know how to deal with proxies lagging behind replicas. But what about the opposite case, when a proxy is ahead of replicas?
The simplest solution is for replicas to not serve requests with a target index higher than its own. After all, it cannot know about keys from the future, whether they will be added, updated, or removed. In fact, our first implementation just returned an error when the proxy was ahead, as we expected it to happen quite infrequently. But after rolling out gradually to a few data centers, our metrics made it clear that the approach was not going to work.
This led us to analyze which keys are affected by this kind of replication asymmetry. It’s definitely not keys added or updated a long time ago, because replicas would already have the changes replicated. The only problematic keys are those updated very recently, which the proxy already knows about, but the replica does not.
With this insight, we realized that the issue should be solved on the proxies rather than on the replica side. By preserving all recent updates locally, the proxy can avoid querying the replica. This became known as the sliding window approach.
The sliding window retains all recent updates written in a short, rolling timeframe. Unlike cached keys, items in the window cannot be evicted until they move outside of the window. Internally, the sliding window is defined by lower and upper boundary pointers. These are kept in memory, and can easily be restored after a reload from the current database index and the pre-configured window size.
Figure 4. The sliding window shifts when replication updates arrive
When a new update event arrives from the replication layer we add it to the sliding window by moving both the upper and lower boundary one position higher. Thereby, we maintain the fixed size of the window. Keys written before the lower bound can be evicted by the compaction filter, which is aware of current sliding window boundaries.
Negative lookups
Another problem arising with our distributed replica-proxy design is negative lookups – requests for keys which don’t exist in the database. Interestingly, in our workloads we see about ten times more negative lookups than positive ones!
But why is it a problem? Unfortunately, each negative lookup will be a cache miss on a proxy, requiring a request to a replica. Given the volume of requests and proportion of such lookups, it would be a disaster for performance, with overloaded replicas, overused data center networks, and massive latency degradation. We needed a fast and efficient approach to identifying non-existing keys directly at the proxy level.
In v1, negative lookups are the quickest type of requests. We rely on a special probabilistic data structure – Bloom filters – used in RocksDB to determine if the requested key might belong to a certain data file containing a range of sorted keys (called Sorted Sequence Table or SST) or definitely not. 99% of the time, negative lookups are served using only this in-memory data structure, avoiding the need for disk I/O.
One approach we considered for proxies was to cache negative lookups. Two problems immediately arise:
How big is the keyspace of negative lookups? In theory, it’s infinite, but the real size was unclear. We can store it in our cache only if it is small enough.
Cached negative lookups would no longer be served by the fast Bloom filters. We have row and block caches in RocksDB, but the hit rate is nowhere near the filters for SSTs, which means negative lookups would end up going to disk more often.
These turned out to be dealbreakers: not only was the negative keyspace vast, greatly exceeding the actual keyspace (by a thousand times for some instances!), but clients also need lookups to be really fast, ideally served from memory.
In pursuit of probabilistic data structures which could give us a dynamic compact representation of a full keyspace on proxies, we spent some time exploring Cuckoo filters. Unfortunately, with 5 billion keys it takes about 18 GB to have a false positive rate similar to Bloom filters (which only require 6 GB). And this is not only about wasted disk space — to be fast we have to keep it all in memory too!
Clearly some other solution was needed.
Finally, we decided to implement key and value separation, storing all keys on proxies, but persisting values only for cached keys. Evicting a key from the cache actually results in the removal of its value.
But wait, don’t the keys, even stripped of values, take a lot of space? Well, yes and no.
The total size of pure keys in Quicksilver is approximately 11 times smaller than the full dataset. Of course, it’s larger than any representation by probabilistic data structure, but there are some very desirable properties to such a solution. Firstly, we continue to enjoy fast Bloom filter lookups in RocksDB. Another benefit is that it unlocks some cool optimizations for range queries in a distributed context.
We may revisit it one day, but so far it has worked great for us.
Discovery mechanism
Having solved all of the above challenges, one bit remained to be sorted out to make distributed query execution work: how can proxies discover replicas?
Within the local data center it is fairly easy. Each one runs its own consul cluster, where machines are registered as services. Consul is well integrated with our internal DNS resolvers, and with a single DNS request, we can get the names of all replicas running in a data center, which proxies can directly connect to.
However, data centers vary in size, servers are constantly added and removed, and having only local discovery would not be enough for the system to work reliably. Proxies also need to find replicas in other nearby data centers.
We had previously encountered a similar problem with our replication layer. Initially, the replication topology was statically defined in a configuration and distributed to all servers, such that they know from which sources they should replicate. While simple, this approach was quite fragile and tedious to operate. It led to a rigid replication tree with suboptimal overall performance, unable to adapt to network changes.
Our solution to this problem was the Network Oracle – a special overlay network based on a gossip protocol and consisting of intermediate nodes in our data centers. Each member of this overlay constantly exchanges status and metainformation with other nodes, which helps us see active members in near-real time. Each member runs network probes measuring round-trip time to its peers, making it easy to find closest (in terms of RTT) active intermediate nodes to form a low-latency replication tree. Introducing the Network Oracle was a major improvement: we no longer needed to reconfigure the topology, watch intermediate nodes or entire data centers go down, or investigate frequent replication issues. Replication is now a completely self-organized and self-healing dynamic system.
Naturally, we decided to reuse the Network Oracle for our discovery mechanism. It consists of two subproblems: data center discovery and specific service lookup. We use the Network Oracle to find the closest data centers. Adding all machines running Quicksilver to the same overlay would be inefficient because of significant increase of network traffic and message delivery times. Instead, we use intermediate nodes as sources of network proximity information for the leaf nodes. Knowing which data centers are nearby, we can directly send DNS queries there to resolve specific services – Quicksilver replicas in this case.
Proxies maintain a pool of connections to active replicas and distribute requests among them to smooth out the load and avoid hotspots in a data center. Proxies also have a health-tracking mechanism, monitoring the state of connections and errors coming from replicas, and temporarily deprioritizing or isolating potentially faulty ones.
Figure 5. Internal replica request errors
To demonstrate its efficiency, we graphed errors coming from replica requests, which showed that such errors almost disappeared after introducing the new discovery system.
Results
Our objective with Quicksilver v1.5 was simple: gain some disk space without losing request latency, because clients rely heavily on us being fast. While the replica-proxy design delivered significant space savings, what about latencies?
Proxy
Replica
Figure 6. Proxy-replica latency comparison
Above, we have the 99.9% percentile of request latency on both a replica and proxy during a 24-hour window. One can hardly find a difference between the two. Surprisingly, proxies can even be slightly faster than replicas sometimes, likely because of smaller datasets on disk!
Quicksilver v1.5 is released but our journey to a highly scalable and efficient solution is not over. In the next post we’ll share what challenges we faced with the following iteration. Stay tuned!
Thank you
This project was a big team effort, so we’d like to thank everyone on the Quicksilver team – it would not have come true without you all.
There’s a tradition at Cloudflare of launching real products on April 1, instead of the usual joke product announcements circulating online today. In previous years, we’ve introduced impactful products like 1.1.1.1 and 1.1.1.1 for Families. Today, we’re excited to continue this tradition by making every purge method available to all customers, regardless of plan type.
During Birthday Week 2024, we announced our intention to bring the full suite of purge methods — including purge by URL, purge by hostname, purge by tag, purge by prefix, and purge everything — to all Cloudflare plans. Historically, methods other than “purge by URL” and “purge everything” were exclusive to Enterprise customers. However, we’ve been openly rebuilding our purge pipeline over the past few years (hopefully you’ve read some of ourblogseries), and we’re thrilled to share the results more broadly. We’ve spent recent months ensuring the new Instant Purge pipeline performs consistently under 150 ms, even during increased load scenarios, making it ready for every customer.
But that’s not all — we’re also significantly raising the default purge rate limits for Enterprise customers, allowing even greater purge throughput thanks to the efficiency of our newly developed Instant Purge system.
Building a better purge: a two-year journey
Stepping back, today’s announcement represents roughly two years of focused engineering. Near the end of 2022, our team went heads down rebuilding Cloudflare’s purge pipeline with a clear yet challenging goal: dramatically increase our throughput while maintaining near-instant invalidation across our global network.
Cloudflare operates data centers in over 335 cities worldwide. Popular cached assets can reside across all of our data centers, meaning each purge request must quickly propagate to every location caching that content. Upon receiving a purge command, each data center must efficiently locate and invalidate cached content, preventing stale responses from being served. The amount of content that must be invalidated can vary drastically, from a single file, to all cached assets associated with a particular hostname. After the content has been purged, any subsequent requests will trigger retrieval of a fresh copy from the origin server, which will be stored in Cloudflare’s cache during the response.
Ensuring consistent, rapid propagation of purge requests across a vast network introduces substantial technical challenges, especially when accounting for occasional data center outages, maintenance, or network interruptions. Maintaining consistency under these conditions requires robust distributed systems engineering.
How did we scale purge?
We’ve previously discussed how our new Instant Purge system was architected to achieve sub-150 ms purge times. It’s worth noting that the performance improvements were only part of what our new architecture achieved, as it also helped us solve significant scaling challenges around storage and throughput that allowed us to bring Instant Purge to all users.
Initially, our purge system scaled well, but with rapid customer growth, the storage consumption from millions of daily purge keys that needed to be stored reduced available caching space. Early attempts to manage this storage and throughput demand involved queues and batching for smoothing traffic spikes, but this introduced latency and underscored the tight coupling between increased usage and rising storage costs.
We needed to revisit our thinking on how to better store purge keys and when to remove purged content so we could reclaim space. Historically, when a customer would purge by tag, prefix or hostname, Cloudflare would mark the content as expired and allow it to be evicted later. This is known as lazy-purge because nothing is actively removed from disk. Lazy-purge is fast, but not necessarily efficient, because it consumes storage for expired but not-yet-evicted content. After examining global or data center-level indexing for purge keys, we decided that wasn’t viable due to increases in system complexity and the latency those indices could bring due to our network size. So instead, we opted for per-machine indexing, integrating indices directly alongside our cache proxies. This minimized network complexity, simplified reliability, and provided predictable scaling.
After careful analysis and benchmarking, we selected RocksDB, an embedded key-value store that we could optimize for our needs, which formed the basis of CacheDB, our Rust-based service running alongside each cache proxy. CacheDB manages indexing and immediate purge execution (active purge), significantly reducing storage needs and freeing space for caching.
Local queues within CacheDB buffer purge operations to ensure consistent throughput without latency spikes, while the cache proxies consult CacheDB to guarantee rapid, active purges. Our updated distribution pipeline broadcasts purges directly to CacheDB instances across machines, dramatically improving throughput and purge speed.
Using CacheDB, we’ve reduced storage requirements 10x by eliminating lazy purge storage accumulation, instantly freeing valuable disk space. The freed storage enhances cache retention, boosting cache HIT ratios and minimizing origin egress. These savings in storage and increased throughput allowed us to scale to the point where we can offer Instant Purge to more customers.
For more information on how we designed the new Instant Purge system, please see the previous installment of our Purge series blog posts.
Striking the right balance: what to purge and when
Moving on to practical considerations of using these new purge methods, it’s important to use the right method for what you want to invalidate. Purging too aggressively can overwhelm origin servers with unnecessary requests, driving up egress costs and potentially causing downtime. Conversely, insufficient purging leaves visitors with outdated content. Balancing precision and speed is vital.
Cloudflare supports multiple targeted purge methods to help customers achieve this balance.
Purge Everything: Clears all cached content associated with a website.
Purge by Tag: Uses Cache-Tag headers to invalidate grouped assets, offering flexibility for complex cache management scenarios.
Starting today, all of these methods are available to every Cloudflare customer.
How to purge
Users can select their purge method directly in the Cloudflare dashboard, located under the Cache tab in the configurations section, or via the Cloudflare API. Each purge request should clearly specify the targeted URLs, hostnames, prefixes, or cache tags relevant to the selected purge type (known as purge keys). For instance, a prefix purge request might specify a directory such as example.com/foo/bar. To maximize efficiency and throughput, batching multiple purge keys in a single request is recommended over sending individual purge requests each with a single key.
How much can you purge?
The new rate limits for Cloudflare’s purge by tag, prefix, hostname, and purge everything are different for each plan type. We use a token bucket rate limit system, so each account has a token bucket with a maximum size based on plan type. When we receive a purge request we first add tokens to the account’s bucket based on the time passed since the account’s last purge request divided by the refill rate for its plan type (which can be a fraction of a token). Then we check if there’s at least one whole token in the bucket, and if so we remove it and process the purge request. If not, the purge request will be rate limited. An easy way to think about this rate limit is that the refill rate represents the consistent rate of requests a user can send in a given period while the bucket size represents the maximum burst of requests available.
For example, a free user starts with a bucket size of 25 requests and a refill rate of 5 requests per minute (one request per 12 seconds). If the user were to send 26 requests all at once, the first 25 would be processed, but the last request would be rate limited. They would need to wait 12 seconds and retry their last request for it to succeed.
The current limits are applied per account:
Plan
Bucket size
Request refill rate
Max keys per request
Total keys
Free
25 requests
5 per minute
100
500 per minute
Pro
25 requests
5 per second
100
500 per second
Biz
50 requests
10 per second
100
1,000 per second
Enterprise
500 requests
50 per second
100
5,000 per second
More detailed documentation on all purge rate limits can be found in our documentation.
What’s next?
We’ve spent a lot of time optimizing our purge platform. But we’re not done yet. Looking forward, we will continue to enhance the performance of Cloudflare’s single-file purge. The current P50 performance is around 250 ms, and we suspect that we can optimize it further to bring it under 200 ms. We will also build out our ability to allow for greater purge throughput for all of our systems, and will continue to find ways to implement filtering techniques to ensure we can continue to scale effectively and allow customers to purge whatever and whenever they choose.
We invite you to try out our new purge system today and deliver an instant, seamless experience to your visitors.
HTTP caching is conceptually simple: if the response to a request is in the cache, serve it, and if not, pull it from your origin, put it in the cache, and return it. When the response is old, you repeat the process. If you are worried about too many requests going to your origin at once, you protect it with a cache lock: a small program, possibly distinct from your cache, that indicates if a request is already going to your origin. This is called cache revalidation.
In this blog post, we dive into how cache revalidation works, and present a new approach based on probability. For every request going to the origin, we simulate a die roll. If it’s 6, the request can go to the origin. Otherwise, it stays stale to protect our origin from being overloaded. To see how this is built and optimised, read on.
Background
Let’s take the example of an online image library. When a client requests an image, the service first checks its cache to see if the resource is present. If it is, it returns it. If it is not, the image server processes the request, places the response into the cache for a day, and returns it. When the cache expires, the process is repeated.
Figure 1: Uncached request goes to the origin
Figure 2: Cached request stops at the cache
And this is where things get complex. The image of a cat might be quite popular. Let’s say it’s requested 10 times per second. Let’s also assume the image server cannot handle more than 1 request per second. After a day, the cache expires. 10 requests hit the service. Given there are no up-to-date items in cache, these 10 requests are going to go directly to the image server. This problem is known as cache stampede. When the image server sees these 10 requests all happening at the same time, it gets overloaded.
Figure 3: Image server overloaded upon cache expiration. This can happen to one or multiple users, across locations.
This all stops if the cache gets populated, as it can handle a lot more requests than the origin.
Figure 4: Cache is populated and can handle the load. The image server is healthy again.
In the following sections, we build this image service, see how it can prevent cache stampede with a cache lock, then dive into probabilistic cache revalidation, and its optimisation.
Setup
Let’s write this image service. We need an image, a server, and a cache. For the image we’re going to use a picture of my cat, Cloudflare Workers for the server, and the Cloudflare Cache API for caching.
Note to the reader: On purpose, we aren’t using Cloudflare KV or Cloudflare CDN Cache, because they already solve our cache validation problem by using a cache lock.
let cache = caches.default
const CACHE_KEY = new Request('https://cache.local/')
const CACHE_AGE_IN_S = 86_400 // 1 day

function cacheExpirationDate() {
  return new Date(Date.now() + 1000*CACHE_AGE_IN_S)
}

function fetchAndCache(ctx) {
  let response = await fetch('https://files.research.cloudflare.com/images/cat.jpg')
  response = new Response(
	await response.arrayBuffer(),
	{
  	  headers: {
  	    'Content-Type': response.headers.get('Content-Type'),
  	    'Expires': cacheExpirationDate().toUTCString(),
  	  },
	},
  )
  ctx.waitUntil(cache.put(CACHE_KEY, response.clone()))
  return response
}

export default {
  async fetch(request, env, ctx) {
	let cachedResponse = await cache.match(CACHE_KEY)
	if (cachedResponse) {
  	  return cachedResponse
	}
	return fetchAndCache(ctx)
  }
}
Codeblock 1: Image server with a non-collapsing cache
Expectation about cache revalidation
The image service is receiving 10 requests per second, and it caches images for a day. It’s reasonable to assume we would like to start revalidating the cache 5 minutes before it expires. The code evolves as follows:
let cache = caches.default
const CACHE_KEY = new Request('https://cache.local/')
const CACHE_AGE_IN_S = 86_400 // 1 day
const CACHE_REVALIDATION_INTERVAL_IN_S = 300

function cacheExpirationDate() {
  // Date constructor in workers takes Unix time in milliseconds
  // Date.now() returns time in milliseconds as well
  return new Date(Date.now() + 1000*CACHE_AGE_IN_S)
}

async function fetchAndCache(ctx) {
  let response = await fetch('https://files.research.cloudflare.com/images/cat.jpg')
  response = new Response(
	await response.arrayBuffer(),
	{
  	  headers: {
  	    'Content-Type': response.headers.get('Content-Type'),
  	    'Expires': cacheExpirationDate().toUTCString(),
  	  },
	},
  )
  ctx.waitUntil(cache.put(CACHE_KEY, response.clone()))
  return response
}

// Revalidation function added here
// This is were we are going to focus our effort: should the request be revalidated ?
function shouldRevalidate(expirationDate) {
  let remainingCacheTimeInS = (expirationDate.getTime() - Date.now()) / 1000

  return remainingCacheTimeInS <= CACHE_REVALIDATION_INTERVAL_IN_S
}

export default {
  async fetch(request, env, ctx) {
	let cachedResponse = await cache.match(CACHE_KEY)
	if (cachedResponse) {
       // revalidation happens only if the request was cached. Otherwise, the resource is fetched anyway
  	  if (shouldRevalidate()) {
    	    ctx.waitUntil(fetchAndCache(ctx))
  	  }
  	  return cachedResponse
	}
	return fetchAndCache(ctx)
  }
}
Codeblock 2: Image server with early-revalidation and a non-collapsing cache
That code works, and we can now revalidate 5 minutes in advance of cache expiration. However, instead of fetching the image from the origin server at expiration time, all requests are going to be made 5 minutes in advance, and that does not solve our cache stampede problem. This happens no matter if requests are coming to a single location or not, given the code above does not collapse requests.
To solve our cache stampede problem, we need the revalidation process to not send too many requests at the same time. Ideally, we would like only one request to be sent between expiration - 5min and expiration.
The usual solution: a cache lock
To make sure there is only one request at a time going to the origin server, the solution that’s usually deployed is a cache lock. The idea is that for a specific item, a cat picture in our case, requests to the origin try to obtain a lock. The request obtaining the lock can go to the origin, the others will serve stale content.
The lock has two methods: try_lock() and unlock.
* try_lock if the lock is free, take it and return true. If not, return false.
* unlock releases the lock.
import { WorkerEntrypoint } from 'cloudflare:workers'

class Lock extends WorkerEntryPoint {
  async try_lock(key) {
	let value = await this.ctx.storage.get(key)
	if (!value) {
  	  await this.ctx.storage.put(key, true)
  	  return true
	}
	return false
  }

  unlock() {
	return this.ctx.storage.delete(key)
  }
}
Codeblock 3: Lock service implemented with a Durable Object
That service can then be used as a cache lock.
// CACHE_LOCK is an instantiation of the above binding
// Assuming the above is deployed as a worker with name `lock`
// It can be bound in wrangler.toml as follows
// services = [ { binding = "CACHE_LOCK", service = "lock" } ]

const LOCK_KEY = "cat_image_service"

async function fetchAndCache(env, ctx) {
  let response = await fetch('...')
  ctx.waitUntil(env.CACHE_LOCK.unlock(LOCK_KEY))
  ...
}

function shouldRevalidate(env, expirationDate) {
  let remainingCacheTimeInS = (expirationDate.getTime() - Date.now()) / 1000

  // check if the expiry window is now, and then if the revalidation lock is available. if it is, take it
  return remainingCacheTimeInS <= CACHE_REVALIDATION_INTERVAL_IN_S && env.CACHE_LOCK.try_lock(LOCK_KEY)
}
Codeblock 4: Image server with early-revalidation and a cache using a cache-lock
Now you might say “Et voilà. No need for probabilities and mathematics. Peak engineering has triumphed.” And you might be right, in most cases. That’s why cache locks are so predominant: they are conceptually simple, deterministic for the same key, and scale well with predictable resource usage.
On the other hand, cache locks add latency and fallibility. To take ownership of a lock, cache revalidation has to contact the lock service. This service is shared across different processes, possibly different machines in different locations. Requests therefore take time. In addition, this service might be unavailable. Probabilistic cache revalidation does not suffer from these, given it does not reach out to an external service but rolls a die with the local randomness generator. It does so at the cost of not guaranteeing the number of requests going to the origin server: maybe zero for an extended period, maybe more than one. On average, this is going to be fine. But there can be border cases, similar to how one can roll a die 10 times and get 10 sixes. It’s unlikely, but not unrealistic, and certain services need that certainty. In the following sections, we dissect this approach.
First dive into probabilities given a stable request rate
A first approach is to reduce the number of requests going to the origin server. Instead of always sending a request to revalidate, we are going to send 1 out of 10. This means that instead of sending 10 requests per second when the cache is invalidated, we send 1 per second.
Because we don’t have a lock, we do that with probabilities. We set the probability of sending a request to the origin to be $p=\frac{1}{10}$. With a rate of 10 requests per second, after 1 second, the expectancy of a request being sent to the origin is $1-(1-p)^10=65\%$. We draw the evolution of the function $E(r, t)=1-(1-p)^{r \times t}$ representing the expectancy of a request being sent to the server over time. $r = 10$ and is the request rate.
Figure 5: Revalidation time $E(t)$ with $r=10$ and $p=\frac{1}{10}$. At time $t$, $E(t)$ is the probability that an early revalidation occurred.
The graph moves very quickly towards $1$. This means we might still have space to reduce the number of requests going to our origin server. We can set a lower probability, such as $p_2=\frac{1}{500}$ (1 request every 5 seconds on average). The graph looks as follows:
Figure 6: Revalidation time $E(t)$ with $r=10$ and $p=\frac{1}{500}$.
This looks great. Let’s implement it.
const CACHE_REVALIDATION_INTERVAL_IN_S = 300
const CACHE_REVALIDATION_PROBABILITY = 1/500

function shouldRevalidate(expirationDate) {
  let remainingCacheTimeInS = (expirationDate.getTime() - Date.now()) / 1000

  if (remainingCacheTimeInS > CACHE_REVALIDATION_INTERVAL_IN_S) {
	return false
  }
  if (remainingCacheTimeInS <= 0) {
	return true
  }
  return Math.random() < CACHE_REVALIDATION_PROBABILITY
}
Codeblock 5: Image server with early-revalidation and a probabilistic cache using uniform distribution
That’s it. If the cache is not close to expiration, we don’t revalidate. If the cache is expired, we revalidate. Otherwise, we revalidate based on a probability.
Adaptive cache revalidation
Until now, we assumed the picture of the cat received a stable request rate. However, for a real service, this does not necessarily hold. For instance, if instead of 10 requests per second, imagine the service receives only 1. The expectancy function does not look as good. After 5 minutes (300s), $E(r=1, t=300)=45\%$. On the other hand, if the image service is receiving 10,000 requests per second, $E(r=10000, t = 300) \approx 100\%$, but our server receives on average $10000 \times \frac{1}{500} = 20$ requests per second. It would be ideal to design a probability function that would adapt to the request rate.
That function would return a low probability when expiration time is far in the future, and increase over time such that the cache is revalidated before it expires. It would cap the request rate going to the origin server.
Let’s design the variation of probability $p$ over 5 minutes. When far from the expiration, the probability to revalidate should be low. This should help match the high request rate. For example, with a request rate of 10k requests per second, we would like the revalidation probability $p$ to be $\frac{1}{100000}$. This ensures the request rates seen by our server are going to be low on average, at about 1 request every 10 seconds. As time passes, we increase this probability to allow for revalidation even at a lower request rate.
Time to expiration $t$ (in s)
Revalidation probability $p$
Target request rate $r$ (in rps)
300
1/100000
10000
240
1/10000
1000
180
1/1000
100
120
1/100
10
60
1/10
1
0
1
–
Table 1: Variation of revalidation probability over time
For each of these intervals, there is a high likelihood that a request rate $r$ will trigger a cache revalidation, and low likelihood that a lower request rate will trigger it. If it does, it’s ok.
We can update our revalidation function as follows:
const CACHE_REVALIDATION_INTERVAL_IN_S = 300
const CACHE_REVALIDATION_PROBABILITY_PER_MIN = [1/100_000, 1/10_000, 1/1000, 1/100, 1/10, 1]

function shouldRevalidate(expirationDate) {
  let remainingCacheTimeInS = (expirationDate.getTime() - Date.now()) / 1000

  if (remainingCacheTimeInS > CACHE_REVALIDATION_INTERVAL_IN_S) {
	return false
  }
  if (remainingCacheTimeInS <= 0) {
	return true
  }
  let currentMinute = Math.floor(remainingCacheTimeInS/60)
  return Math.random() < CACHE_REVALIDATION_PROBABILITY_PER_MIN[currentMinute]
}
Codeblock 6: Image server with early-revalidation and a probabilistic cache using piecewise uniform distribution
Optimal cache stampede solution
There seems to be a lot of decisions going on here. To solve this, we can reference an academic paper written by A Vattani, T Chierichetti, and K Lowenstein in 2015 called Optimal Probabilistic Cache Stampede Prevention. If you read it, you’ll recognise that what we have been discussing until now is close to what the paper presents. For instance, both the cache revalidation algorithm structure and the early revalidation function look similar.
Figure 7: Probabilistic early expiration of a cache item as defined by Figure 2 of Optimal Probabilistic Cache Stampede Prevention paper. In our case, $\mathcal{D}=300$
One takeaway from the paper is that instead of discretization, with a probability from 0 to 60s, then from 60s to 120s, …, the probability function can be continuous. Instead of a fixed $p$, there is a function $p(t)$ of time $t$.
$p(t)=e^{-\lambda (expiry-t)}, \text{ with } expiry=300, \text{ and } t \in [0, 300]$
We call $\lambda$ the steepness parameter, and set it to $\frac{1}{300}$, $300$ being our early expiration gap.
The expectancy over time is $E(r, t)=1-e^{-rλt}$. This leads to the expectancy below for various request rates. You can note that when $r=1$, there is not a $100%$ chance that the request will be revalidated before expiry.
Figure 8: Revalidation time $E(t)$ for multiple $r$ with an exponential distribution.
This leads to the final code snippet:
const CACHE_REVALIDATION_INTERVAL_IN_S = 300
const REVALIDATION_STEEPNESS = 1/300

function shouldRevalidate(expirationDate) {
  let remainingCacheTimeInS = (expirationDate.getTime() - Date.now()) / 1000

  if (remainingCacheTimeInS > CACHE_REVALIDATION_INTERVAL_IN_S) {
	return false
  }
  if (remainingCacheTimeInS <= 0) {
	return true
  }
  // p(t) is evaluated here
  return Math.random() < Math.exp(-REVALIDATION_STEEPNESS*(CACHE_REVALIDATION_INTERVAL_IN_S-remainingCacheTimeInS)
}
Codeblock 7: Image server with early-revalidation and a probabilistic cache using exponential distribution
And that’s it. Given Date.now() has a granularity, and is not continuous, it would also be possible to discretise these functions, even though the gains are minimal. This is what we have done in a production worker implementation, where the number of requests is important. It is a service that benefits from caching for performance consideration, and that cannot use built-in stale-while-revalidate from within Cloudflare workers. Probabilistic cache stampede prevention is well-suited here, as no new component has to be built, and it performs well at different request rates.
Conclusion
We have seen how to solve cache stampede without a lock, its implementation, and why it is optimal. In the real world, you likely will not encounter this issue: either because it’s good enough to optimize your origin service to serve more requests, or because you can leverage a CDN cache. In fact, most HTTP caches provide an API that follows Cache Control, and likely have all the tools you need. This primitive is also built into certain products, such as Cloudflare KV.
If you have not done so, you can go and experiment with all the code snippets presented in this blog on the Cloudflare Workers Playground at cloudflareworkers.com.
2024 marks Cloudflare’s 14th birthday. Birthday Week each year is packed with major announcements and the release of innovative new offerings, all focused on giving back to our customers and the broader Internet community. Birthday Week has become a proud tradition at Cloudflare and our culture, to not just stay true to our mission, but to always stay close to our customers. We begin planning for this week of celebration earlier in the year and invite everyone at Cloudflare to participate.
Months before Birthday Week, we invited teams to submit ideas for what to announce. We were flooded with submissions, from proposals for implementing new standards to creating new products for developers. Our biggest challenge is finding space for it all in just one week — there is still so much to build. Good thing we have a birthday to celebrate each year, but we might need an extra day in Birthday Week next year!
In case you missed it, here’s everything we announced during 2024’s Birthday Week:
Customers using Cloudflare to manage DNS can create a whole batch of records, enable proxying on many records, update many records to point to a new target at the same time, or even delete all of their records.
Taking the next step in advancing security with Ephemeral IDs, a new feature that generates a unique short-lived ID, without relying on any network-level information.
Speed Brain, our latest leap forward in speed, uses the Speculation Rules API to prefetch content for users’ likely next navigations — downloading web pages before they navigate to them and making pages load 45% faster.
Instant Purge invalidates cached content in under 150ms, offering the industry’s fastest cache purge with global latency for purges by tags, hostnames, and prefixes.
Next generation servers focused on exceptional performance and security, enhanced support for AI/ML workloads, and significant strides in power efficiency.
More powerful GPUs, expanded model support, enhanced logging and evaluations in AI Gateway, and Vectorize GA with larger index sizes and faster queries.
Persistent and queryable Workers logs, Node.js compatibility GA, improved Next.js support via OpenNext, built-in CI/CD for Workers, Gradual Deployments, Queues, and R2 Event Notifications GA, and more — making building on Cloudflare easier, faster, and more affordable.
Using new optimization techniques such as KV cache compression and speculative decoding, we’ve made large language model (LLM) inference lightning-fast on the Cloudflare Workers AI platform.
We’ve been working on something new — a platform for running containers across Cloudflare’s network. We already use it in production, for AI inference and more.
Extending our AI Assistant capabilities to help you build new WAF rules, added new AI bot and crawler traffic insights to Radar, and new AI bot blocking capabilities.
Our free plan is here to stay, and we reaffirm that commitment this week with 15 releases that make the Free plan even better.
One more thing…
Cloudflare serves millions of customers and their millions of domains across nearly every country on Earth. However, as a global company, the payment landscape can be complex — especially in regions outside of North America. While credit cards are very popular for online purchases in the US, the global picture is quite different. 60% of consumers across EMEA, APAC and LATAM choose alternative payment methods. For instance, European consumers often opt for SEPA Direct Debit, a bank transfer mechanism, while Chinese consumers frequently use Alipay, a digital wallet.
At Cloudflare, we saw this as an opportunity to meet customers where they are. Today, we’re thrilled to announce that we are expanding our payment system and launching a closed beta for a new payment method called Stripe Link. The checkout experience will be faster and more seamless, allowing our self-serve customers to pay using saved bank accounts or cards with Link. Customers who have saved their payment details at any business using Link can quickly check out without having to reenter their payment information.
These are the first steps in our efforts to expand our payment system to support global payment methods used by customers around the world.We’ll be rolling out new payment methods gradually, ensuring a smooth integration and gathering feedback from our customers every step of the way.
Until next year
That’s all for Birthday Week 2024. However, the innovation never stops at Cloudflare. Continue to follow the Cloudflare Blog all year long as we launch more products and features that help build a better Internet.
Each time a user visits your web page, they are initiating a race to receive content as quickly as possible. Performance is a critical factor that influences how visitors interact with your site. Some might think that moving content across the globe introduces significant latency, but for a while, network transmission speeds have approached their theoretical limits. To put this into perspective, data on Cloudflare can traverse the 11,000 kilometer round trip between New York and London in about 76 milliseconds – faster than the blink of an eye.
However, delays in loading web pages persist due to the complexities of processing requests, responses, and configurations. In addition to pushing advancements in connection establishment, compression, hardware, and software, we have built a new way to reduce page load latency by anticipating how visitors will interact with a given web page.
Today we are very excited to share the latest leap forward in speed: Speed Brain. It relies on the Speculation Rules API to prefetch the content of the user’s likely next navigations. The main goal of Speed Brain is to download a web page to the browser cache before a user navigates to it, allowing pages to load almost instantly when the actual navigation takes place.
Our initial approach uses a conservative model that prefetches static content for the next page when a user starts a touch or click event. Through the fourth quarter of 2024 and into 2025, we will offer more aggressive speculation models, such as speculatively prerendering (not just fetching the page before the navigation happens but rendering it completely) for an even faster experience. Eventually, Speed Brain will learn how to eliminate latency for your static website, without any configuration, and work with browsers to make sure that it loads as fast as possible.
To illustrate, imagine an ecommerce website selling clothing. Using the insights from our global request logs, we can predict with high accuracy that a typical visitor is likely to click on ‘Shirts’ when viewing the parent page ‘Mens > Clothes’. Based on this, we can start delivering static content, like images, before the shopper even clicks the ‘Shirts’ link. As a result, when they inevitably click, the page loads instantly. Recent lab testing of our aggressive loading model implementation has shown up to a 75% reduction in Largest Contentful Paint (LCP), the time it takes for the largest visible element (like an image, video, or text block) to load and render in the browser.
The best part? We are making Speed Brain available to all plan types immediately and at no cost. Simply toggle on the Speed Brain feature for your website from the dashboard or the API. It’ll feel like magic, but behind the scenes it’s a lot of clever engineering.
We have already enabled Speed Brain by default on all free domains and are seeing a reduction in LCP of 45% on successful prefetches. Pro, Business, and Enterprise domains need to enable Speed Brain manually. If you have not done so already, we strongly recommend also enabling Real User Measurements (RUM) via your dashboard so you can see your new and improved web page performance. As a bonus, enabling RUM for your domain will help us provide improved and customized prefetching and prerendering rules for your website in the near future!
How browsers work at a glance
Before discussing how Speed Brain can help load content exceptionally fast, we need to take a step back to review the complexity of loading content on browsers. Every time a user navigates to your web page, a series of request and response cycles must be completed.
After the browser establishes a secure connection with a server, it sends an HTTP request to retrieve the base document of the web page. The server processes the request, constructs the necessary HTML document and sends it back to the browser in the response.
When the browser receives an HTML document, it immediately begins parsing the content. During this process, it may encounter references to external resources such as CSS files, JavaScript, images, and fonts. These subresources are essential for rendering the page correctly, so the browser issues additional HTTP requests to fetch them. However, if these resources are available in the browser’s cache, the browser can retrieve them locally, significantly reducing network latency and improving page load times.
As the browser processes HTML, CSS, and JavaScript, the rendering engine begins to display content on the screen. Once the page’s visual elements are displayed, user interactions — like clicking a link — prompt the browser to restart much of this process to fetch new content for the next page. This workflow is typical of every browsing session: as users navigate, the browser continually fetches and renders new or uncached resources, introducing a delay before the new page fully loads.
Take the example of a user navigating the shopping site described above. As the shopper moves from the homepage to the ‘men’s’ section of the site to the ‘clothing’ section to the ‘shirts’ section, the time spent on retrieving each of those subsequent pages can add up and contribute to the shopper leaving the site before they complete the transaction.
Ideally, having prefetched and prerendered pages present in the browser at the time each of those links are clicked would eliminate much of the network latency impact, allowing the browser to load content instantly and providing a smoother user experience.
Wait, I’ve heard this story before (how did we get to Speed Brain?)
We know what you’re thinking. We’ve had prefetching for years. There have even been several speculative prefetching efforts in the past. You’ve heard this all before. How is this different now?
You’re right, of course. Over the years, there has been a constant effort by developers and browser vendors to optimize page load times and enhance user experience across the web. Numerous techniques have been developed, spanning various layers of the Internet stack — from optimizing network layer connectivity to preloading application content closer to the client.
Early prefetching: lack of data and flexibility
Web prefetching has been one such technique that has existed for more than a decade. It is based on the assumption that certain subresources are likely to be needed in the near future, so why not fetch them proactively? This could include anything from HTML pages to images, stylesheets, or scripts that the user might need as they navigate through a website. In fact, the core concept of speculative execution is not new, as it’s a general technique that’s been employed in various areas of computer science for years, with branch prediction in CPUs as a prime example.
In the early days of the web, several custom prefetching solutions emerged to enhance performance. For example, in 2005, Google introduced the Google Web Accelerator, a client-side application aimed at speeding up browsing for broadband users. Though innovative, the project was short-lived due to privacy and compatibility issues (we will describe how Speed Brain is different below). Predictive prefetching at that time lacked the data insights and API support for capturing user behavior, especially those handling sensitive actions like deletions or purchases.
Static lists and manual effort
Traditionally, prefetching has been accomplished through the use of the <link rel="prefetch"> attribute as one of the Resource Hints. Developers had to manually specify the attribute on each page for each resource they wanted the browser to preemptively fetch and cache in memory. This manual effort has not only been laborious but developers often lacked insight into what resources should be prefetched, which reduced the quality of their specified hints.
In a similar vein, Cloudflare has offered a URL prefetching feature since 2015. Instead of prefetching in browser cache, Cloudflare allows customers to prefetch a static list of resources into the CDN cache. The feature allows prefetching resources in advance of when they are actually needed, usually during idle time or when network conditions are favorable. However, similar concerns apply for CDN prefetching, since customers have to manually decide on what resources are good candidates for prefetching for each page they own. If misconfigured, static link prefetching can be a footgun, causing the web page load time to actually slow down.
Server Push and its struggles
HTTP/2’s “server push” was another attempt to improve web performance by pushing resources to the client before they were requested. In theory, this would reduce latency by eliminating the need for additional round trips for future assets. However, the server-centric dictatorial nature of “pushing” resources to the client raised significant challenges, primarily due to lack of context about what was already cached in the browser. This not only wasted bandwidth but had the potential to slow down the delivery of critical resources, like base HTML and CSS, due to race conditions on browser fetches when rendering the page. The proposed solution of cache digests, which would have informed servers about client cache contents, never gained widespread implementation, leaving servers to push resources blindly. In October 2022, Google Chrome removed Server Push support, and in September 2024, Firefox followed suit.
A step forward with Early Hints
As a successor, Early Hints was specified in 2017 but not widely adopted until 2022, when we partnered with browsers and key customers to deploy it. It offers a more efficient alternative by “hinting” to clients which resources to load, allowing better prioritization based on what the browser needs. Specifically, the server sends a 103 Early Hints HTTP status code with a list of key page assets that the browser should start loading while the main response is still being prepared. This gives the browser a head start in fetching essential resources and avoids redundant preloading if assets are already cached. Although Early Hints doesn’t adapt to user behaviors or dynamic page conditions (yet), its use is primarily limited to preloading specific assets rather than full web pages — in particular, cases where there is a long server “think time” to produce HTML.
As the web evolves, tools that can handle complex, dynamic user interactions will become increasingly important to balance the performance gains of speculative execution with its potential drawbacks for end-users. For years Cloudflare has offered performance-based solutions that adapt to user behavior and work to balance the speed and correctness decisions across the Internet like Argo Smart Routing, Smart Tiered Cache, and Smart Placement. Today we take another step forward toward an adaptable framework for serving content lightning-fast.
Enter Speed Brain: what makes it different?
Speed Brain offers a robust approach for implementing predictive prefetching strategies directly within the browser based on the ruleset returned by our servers. By building on lessons from previous attempts, it shifts the responsibility for resource prediction to the client, enabling more dynamic and personalized optimizations based on user interaction – like hovering over a link, for example – and their device capabilities. Instead of the browser sitting idly waiting for the next web page to be requested by the user, it takes cues from how a user is interacting with a page and begins asking for the next web page before the user finishes clicking on a link.
Behind the scenes, all of this magic is made possible by the Speculation Rules API, which is an emerging standard in the web performance space from Google. When Cloudflare’s Speed Brain feature is enabled, an HTTP header called Speculation-Rules is added to web page responses. The value for this header is a URL that hosts an opinionated Rules configuration. This configuration instructs the browser to initiate prefetch requests for future navigations. Speed Brain does not improve page load time for the first page that is visited on a website, but it can improve it for subsequent web pages that are visited on the same site.
The idea seems simple enough, but prefetching comes with challenges, as some prefetched content may never end up being used. With the initial release of Speed Brain, we have designed a solution with guardrails that addresses two important but distinct issues that limited previous speculation efforts — stale prefetch configuration and incorrect prefetching. The Speculation Rules API configuration we have chosen for this initial release has been carefully designed to balance safety of prefetching while still maintaining broad applicability of rules for the entire site.
Stale prefetch configuration
As websites inevitably change over time, static prefetch configurations often become outdated, leading to inefficient or ineffective prefetching. This has been especially true for techniques like the rel=prefetch attribute or static CDN prefetching URL sets, which have required developers to manually maintain relevant prefetchable URL lists for each page of their website. Most static prefetch lists are based on developer intuition rather than real user navigation data, potentially missing important prefetch opportunities or wasting resources on unnecessary prefetches.
Incorrect prefetching
Since prefetch requests are just like normal requests except with a `sec-purpose` HTTP request header, they incur the same overhead on the client, network, and server. However, the crucial difference is that prefetch requests anticipate user behavior and the response might not end up being used, so all that overhead might be wasted. This makes prefetch accuracy extremely important — that is, maximizing the percentage of prefetched pages that end up being viewed by the user. Incorrect prefetching can lead to inefficiencies and unneeded costs, such as caching resources that aren’t requested, or wasting bandwidth and network resources, which is especially critical on metered mobile networks or in low-bandwidth environments.
Guardrails
With the initial release of Speed Brain, we have designed a solution with important side effect prevention guardrails that completely removes the chance of stale prefetch configuration, and minimizes the risk of incorrect prefetching. This opinionated configuration is achieved by leveraging the document rules and eagerness settings from the Speculation Rules API. Our chosen configuration looks like the following:
Document Rules, indicated by “source”: “document” and the “where” key in the configuration, allows prefetching to be applied dynamically over the entire web page. This eliminates the need for a predefined static URL list for prefetching. Hence, we remove the problem of stale prefetch configuration as prefetch candidate links are determined based on the active page structure.
Our use of “relative_to”: “document” in the where clause instructs the browser to limit prefetching to same-site links. This has the added bonus of allowing our implementation to avoid cross-origin prefetches to avoid any privacy implications for users, as it doesn’t follow them around the web.
Eagerness
Eagerness controls how aggressively the browser prefetches content. There are four possible settings:
immediate: Used as soon as possible on page load — generally as soon as the rule value is seen by the browser, it starts prefetching the next page.
eager: Identical to immediate setting above, but the prefetch trigger additionally relies on slight user interaction events, such as moving the cursor towards the link (coming soon).
moderate: Prefetches if you hold the pointer over a link for more than 200 milliseconds (or on the pointerdown event if that is sooner, and on mobile where there is no hover event).
conservative: Prefetches on pointer or touch down on the link.
Our initial release of Speed Brain makes use of the conservative eagerness value to minimize the risk of incorrect prefetching, which can lead to unintended resource waste while making your websites noticeably faster. While we lose out on the potential performance improvements that the more aggressive eagerness settings offer, we chose this cautious approach to prioritize safety for our users. Looking ahead, we plan to explore more dynamic eagerness settings for sites that could benefit from a more liberal setting, and we’ll also expand our rules to include prerendering.
Another important safeguard we implement is to only accept prefetch requests for static content that is already stored in our CDN cache. If the content isn’t in the cache, we reject the prefetch request. Retrieving content directly from our CDN cache for prefetching requests lets us bypass concerns about their cache eligibility. The rationale for this is straightforward: if a page is not eligible for caching, we don’t want it to be prefetched in the browser cache, as it could lead to unintended consequences and increased origin load. For instance, prefetching a logout page might log the user out prematurely before the user actually finishes their action. Stateful prefetching or prerendering requests can have unpredictable effects, potentially altering the server’s state for actions the client has not confirmed. By only allowing prefetching for pages already in our CDN cache, we have confidence those pages will not negatively impact the user experience.
These guardrails were implemented to work in performance-sensitive environments. We measured the impact of our baseline conservative deployment model on all pages across Cloudflare’s developer documentation in early July 2024. We found that we were able to prefetch the correct content, content that would in fact be navigated to by the users, 94% of the time. We did this while improving the performance of the navigation by reducing LCP at p75 quantile by 40% without inducing any unintended side effects. The results were amazing!
Explaining Cloudflare’s implementation
Our global network spans over 330 cities and operates within 50 milliseconds of 95% of the Internet-connected population. This extensive reach allows us to significantly improve the performance of cacheable assets for our customers. By leveraging this network for smart prefetching with Speed Brain, Cloudflare can serve prefetched content directly from the CDN cache, reducing network latency to practically instant.
Our unique position on the network provides us the leverage to automatically enable Speed Brain without requiring any changes from our customers to their origin server configurations. It’s as simple as flipping a switch! Our first version of Speed Brain is now live.
Upon receiving a request for a web page with Speed Brain enabled, the Cloudflare server returns an additional “Speculation-Rules” HTTP response header. The value for this header is a URL that hosts an opinionated Rules configuration (as mentioned above).
When the browser begins parsing the response header, it fetches our Speculation-Rules configuration, and loads it as part of the web page.
The configuration guides the browser on when to prefetch the next likely page from Cloudflare that the visitor may navigate to, based on how the visitor is engaging with the page.
When a user action (such as mouse down event on the next page link) triggers the Rules application, the browser sends a prefetch request for that page with the “sec-purpose: prefetch” HTTP request header.
Our server parses the request header to identify the prefetch request. If the requested content is present in our cache, we return it; otherwise, we return a 503 HTTP status code and deny the prefetch request. This removes the risk of unsafe side-effects of sending requests to origins or Cloudflare Workers that are unaware of prefetching. Only content present exclusively in the cache is returned.
On a success response, the browser successfully prefetches the content in memory, and when the visitor navigates to that page, the browser directly loads the web page from the browser cache for immediate rendering.
Common troubleshooting patterns
Support for Speed Brain relies on the Speculation Rules API, an emerging web standard. As of September 2024, support for this emerging standard is limited to Chromium-based browsers (version 121 or later), such as Google Chrome and Microsoft Edge. As the web community reaches consensus on API standardization, we hope to see wider adoption across other browser vendors.
Prefetching by nature does not apply to dynamic content, as the state of such content can change, potentially leading to stale or outdated data being delivered to the end user as well as increased origin load. Therefore, Speed Brain will only work for non-dynamic pages of your website that are cached on our network. It has no impact on the loading of dynamic pages. To get the most benefit out of Speed Brain, we suggest making use of cache rules to ensure that all static content (especially HTML content) on your site is eligible for caching.
When the browser receives a 503 HTTP status code in response to a speculative prefetch request (marked by the sec-purpose: prefetch header), it cancels the prefetch attempt. Although a 503 error appearing in the browser’s console may seem alarming, it is completely harmless for prefetch request cancellation. In our early tests, the 503 response code has caused some site owners concern. We are working with our partners to iterate on this to improve the client experience, but for now follow the specification guidance, which suggests a 503 response for the browser to safely discard the speculative request. We’re in active discussions with Chrome, based on feedback from early beta testers, and believe a new non-error dedicated response code would be more appropriate, and cause less confusion. In the meantime, 503 response logs for prefetch requests related to Speed Brain are harmless. If your tooling makes ignoring these requests difficult, you can temporarily disable Speed Brain until we work out something better with the Chrome Team.
Additionally, when a website uses both its own custom Speculation Rules and Cloudflare’s Speed Brain feature, both rule sets can operate simultaneously. Cloudflare’s guardrails will limit speculation rules to cacheable pages, which may be an unexpected limitation for those with existing implementations. If you observe such behavior, consider disabling one of the implementations for your site to ensure consistency in behavior. Note that if your origin server responses include the Speculation-Rules header, it will not be overridden. Therefore, the potential for ruleset conflicts primarily applies to predefined in-line speculation rules.
How can I see the impact of Speed Brain?
In general, we suggest that you use Speed Brain and most other Cloudflare performance features with our RUM performance measurement tool enabled. Our RUM feature helps developers and website operators understand how their end users are experiencing the performance of their application, providing visibility into:
Loading: How long did it take for content to become available?
Interactivity: How responsive is the website when users interact with it?
Visual stability: How much does the page move around while loading?
With RUM enabled, you can navigate to the Web Analytics section in the dashboard to see important information about how Speed Brain is helping reduce latency in your core web vitals metrics like Largest Contentful Paint (LCP) and load time.
Example RUM dashboard for a website with a high amount of prefetchable content that enabled Speed Brain around September 16.
What have we seen in our rollout so far?
We have enabled this feature by default on all free plans and have observed the following:
Domains
Cloudflare currently has tens of millions of domains using Speed Brain. We have measured the LCP at the 75th quantile (p75) for these sites and found an improvement for these sites between 40% and 50% (average around 45%).
We found this improvement by comparing navigational prefetches to normal (non-prefetched) page loads for the same set of domains.
Requests
Before Speed Brain is enabled, the p75 of free websites on Cloudflare experience an LCP around 2.2 seconds. With Speed Brain enabled, these sites see significant latency savings on LCP. In aggregate, Speed Brain saves about 0.88 seconds on the low end and up to 1.1 seconds on each successful prefetch!
Applicable browsers
Currently, the Speculation Rules API is only available in Chromium browsers. From Cloudflare Radar, we can see that approximately 70% of requests from visitors are from Chromium (Chrome, Edge, etc) browsers.
Across the network
Cloudflare sees hundreds of billions of requests for HTML content each day. Of these requests, about half are cached (make sure your HTML is cacheable!). Around 1% of those requests are for navigational prefetching made by the visitors. This represents significant savings every day for visitors to websites with Speed Brain enabled. Every 24 hours, Speed Brain can save more than 82 years worth of latency!
What’s next?
What we’re offering today for Speed Brain is only the beginning. Heading into 2025, we have a number of exciting additions to explore and ship.
Leveraging Machine Learning
Our unique position on the Internet provides us valuable insights into web browsing patterns, which we can leverage for improving web performance while maintaining individual user privacy. By employing a generalized data-driven machine learning approach, we can define more accurate and site-specific prefetch predictors for users’ pages.
We are in the process of developing an adaptive speculative model that significantly improves upon our current conservative offering. This model uses a privacy-preserving method to generate a user traversal graph for each site based on same-site Referrer headers. For any two pages connected by a navigational hop, our model predicts the likelihood of a typical user moving between them, using insights extracted from our aggregated traffic data.
This model enables us to tailor rule sets with custom eagerness values to each relevant next page link on your site. For pages where the model predicts high confidence in user navigation, the system will aggressively prefetch or prerender them. If the model does not provide a rule for a page, it defaults to our existing conservative approach, maintaining the benefits of baseline Speed Brain model. These signals guide browsers in prefetching and prerendering the appropriate pages, which helps speed up navigation for users, while maintaining our current safety guardrails.
In lab tests, our ML model improved LCP latency by 75% and predicted visitor navigation with ~98% accuracy, ensuring the correct pages were being prefetched to prevent resource waste for users. As we move toward scaling this solution, we are focused on periodic training of the model to adapt to varying user behaviors and evolving websites. Using an online machine learning approach will drastically reduce the need for any manual update, and content drifts, while maintaining high accuracy — the Speed Brain load solution that gets smarter over time!
Finer observability via RUM
As we’ve mentioned, we believe that our RUM tools offer the best insights for how Speed Brain is helping the performance of your website. In the future, we plan on offering the ability to filter RUM tooling by navigation type so that you can compare the browser rendering of prefetched content versus non-prefetched content.
Prerendering
We are currently offering the ability for prefetching on cacheable content. Prefetching downloads the main document resource of the page before the user’s navigation, but it does not instruct the browser to prerender the page or download any additional subresources.
In the future, Cloudflare’s Speed Brain offering will prefetch content into our CDN cache and then work with browsers to know what are the best prospects for prerendering. This will help get static content even closer to instant rendering.
Argo Smart Browsing: Speed Brain & Smart Routing
Speed Brain, in its initial implementation, provides an incredible performance boost whilst still remaining conservative in its implementation; both from an eagerness, and a resource consumption perspective.
As was outlined earlier in the post, lab testing of a more aggressive model, powered by machine-learning and a higher eagerness, yielded a 75% reduction in LCP. We are investigating bundling this more aggressive, additional implementation of Speed Brain with Argo Smart Routing into a product called “Argo Smart Browsing”.
Cloudflare customers will be free to continue using Speed Brain, however those who want even more performance improvement will be able to enable Argo Smart Browsing with a single button click. With Argo Smart Browsing, not only will cacheable static content load up to 75% faster in the browser, thanks to the more aggressive models, however in times when content can’t be cached, and the request must go forward to an origin server, it will be sent over the most performant network path resulting in an average 33% performance increase. Performance optimizations are being applied to almost every segment of the request lifecycle regardless if the content is static or dynamic, cached or not.
Conclusion
To get started with Speed Brain, navigate to Speed > Optimization > Content Optimization > Speed Brain in the Cloudflare Dashboard and enable it. That’s all! The feature can also be enabled via API. Free plan domains have had Speed Brain enabled by default.
We strongly recommend that customers also enable RUM, found in the same section of the dashboard, to give visibility into the performance improvements provided by Speed Brain and other Cloudflare features and products.
We’re excited to continue to build products and features that make web performance reliably fast. If you’re an engineer interested in improving the performance of the web for all, come join us!
Over the past 14 years, Cloudflare has evolved far beyond a Content Delivery Network (CDN), expanding its offerings to include a comprehensive Zero Trust security portfolio, network security & performance services, application security & performance optimizations, and a powerful developer platform. But customers also continue to rely on Cloudflare for caching and delivering static website content. CDNs are often judged on their ability to return content to visitors as quickly as possible. However, the speed at which content is removed from a CDN’s global cache is just as crucial.
When customers frequently update content such as news, scores, or other data, it is essential they avoid serving stale, out-of-date information from cache to visitors. This can lead to a subpar experience where users might see invalid prices, or incorrect news. The goal is to remove the stale content and cache the new version of the file on the CDN, as quickly as possible. And that starts by issuing a “purge.”
In May 2022, we released the first partof the series detailing our efforts to rebuild and publicly document the steps taken to improve the system our customers use, to purge their cached content. Our goal was to increase scalability, and importantly, the speed of our customer’s purges. In that initial post, we explained how our purge system worked and the design constraints we found when scaling. We outlined how after more than a decade, we had outgrown our purge system and started building an entirely new purge system, and provided purge performance benchmarking that users experienced at the time. We set ourselves a lofty goal: to be the fastest.
Today, we’re excited to share that we’ve built the fastest cache purge in the industry. We now offer a global purge latency for purge by tags, hostnames, and prefixes of less than 150ms on average (P50), representing a 90% improvement since May 2022. Users can now purge from anywhere, (almost) instantly. By the time you hit enter on a purge request and your eyes blink, the file is now removed from our global network — including data centers in 330 cities and 120+ countries.
But that’s not all. It wouldn’t be Birthday Week if we stopped at just being the fastest purge. We are alsoannouncing that we’re opening up more purge options to Free, Pro, and Business plans. Historically, only Enterprise customers had access to the full arsenal of cache purge methods supported by Cloudflare, such as purge by cache-tags, hostnames, and URL prefixes. As part of rebuilding our purge infrastructure, we’re not only fast but we are able to scale well beyond our current capacity. This enables more customers to use different types of purge. We are excited to offer these new capabilities to all plan types once we finish rolling out our new purge infrastructure, and expect to begin offering additional purge capabilities to all plan types in early 2025.
Why cache and purge?
Caching content is like pulling off a spectacular magic trick. It makes loading website content lightning-fast for visitors, slashes the load on origin servers and the cost to operate them, and enables global scalability with a single button press. But here’s the catch: for the magic to work, caching requires predicting the future. The right content needs to be cached in the right data center, at the right moment when requests arrive, and in the ideal format. This guarantees astonishing performance for visitors and game-changing scalability for web properties.
Cloudflare helps make this caching magic trick easy. But regular users of our cache know that getting content into cache is only part of what makes it useful. When content is updated on an origin, it must also be updated in the cache. The beauty of caching is that it holds content until it expires or is evicted. To update the content, it must be actively removed and updated across the globe quickly and completely. If data centers are not uniformly updated or are updated at drastically different times, visitors risk getting different data depending on where they are located. This is where cache “purging” (also known as “cache invalidation”) comes in.
One-to-many purges on Cloudflare
Back in part 2 of the blog series, we touched on how there are multiple ways of purging cache: by URL, cache-tag, hostname, URL prefix, and “purge everything”, and discussed a necessary distinction between purging by URL and the other four kinds of purge — referred to as flexible purges — based on the scope of their impact.
The reason flexible purge isn’t also fully coreless yet is because it’s a more complex task than “purge this object”; flexible purge requests can end up purging multiple objects – or even entire zones – from cache. They do this through an entirely different process that isn’t coreless compatible, so to make flexible purge fully coreless we would have needed to come up with an entirely new multi-purge mechanism on top of redesigning distribution. We chose instead to start with just purge by URL, so we could focus purely on the most impactful improvements, revamping distribution, without reworking the logic a data center uses to actually remove an object from cache.
We said our next steps included a redesign of flexible purges at Cloudflare, and today we’d like to walk you through the resulting system. But first, a brief history of flexible cache purges at Cloudflare and elaboration on why the old flexible purge system wasn’t “coreless compatible”.
Just in time
“Cache” within a given data center is made up of many machines, all contributing disk space to store customer content. When a request comes in for an asset, the URL and headers are used to calculate a cache key, which is the filename for that content on disk and also determines which machine in the datacenter that file lives on. The filename is the same for every data center, and every data center knows how to use it to find the right machine to cache the content. A purge request for a URL (plus headers) therefore contains everything needed to generate the cache key — the pointer to the response object on disk — and getting that key to every data center is the hardest part of carrying out the purge.
Purging content based on response properties has a different hardest part. If a customer wants to purge all content with the cache-tag “foo”, for example, there’s no way for us to generate all the cache keys that will point to the files with that cache-tag at request time. Cache-tags are response headers, and the decision of where to store a file is based on request attributes only. To find all files with matching cache-tags, we would need to look at every file in every cache disk on every machine in every data center. That’s thousands upon thousands of machines we would be scanning for each purge-by-tag request. There are ways to avoid actually continuously scanning all disks worldwide (foreshadowing!) but for our first implementation of our flexible purge system, we hoped to avoid the problem space altogether.
An alternative approach to going to every machine and looking for all files that match some criteria to actively delete from disk was something we affectionately referred to as “lazy purge”. Instead of deleting all matching files as soon as we process a purge request, we wait to do so when we get an end user request for one of those files. Whenever a request comes in, and we have the file in cache, we can compare the timestamp of any recent purge requests from the file owner to the insertion timestamp of the file we have on disk. If the purge timestamp is fresher than the insertion timestamp, we pretend we didn’t find the file on disk. For this to work, we needed to keep track of purge requests going back further than a data center’s maximum cache eviction age to be sure that any file a customer sends a matching flex purge to clear from cache will either be naturally evicted, or forced to cache MISS and get refreshed from the origin. With this approach, we just needed a distribution and storage system for keeping track of flexible purges.
Purge looks a lot like a nail
At Cloudflare there is a lot of configuration data that needs to go “everywhere”: cache configuration, load balancer settings, firewall rules, host metadata — countless products, features, and services that depend on configuration data that’s managed through Cloudflare’s control plane APIs. This data needs to be accessible by every machine in every datacenter in our network. The vast majority of that data is distributed via a system introduced several years ago called Quicksilver. The system works very, very well (sub-second p99 replication lag, globally). It’s extremely flexible and reliable, and reads are lightning fast. The team responsible for the system has done such a good job that Quicksilver has become a hammer that when wielded, makes everything look like a nail… like flexible purges.
Core-based purge request entering a data center and getting backhauled to a core data center where Quicksilver distributes the request to all network data centers (hub and spoke).
Our first version of the flexible purge system used Quicksilver’s spoke-hub distribution to send purges from a core data center to every other data center in our network. It took less than a second for flexible purges to propagate, and once in a given data center, the purge key lookups in the hot path to force cache misses were in the low hundreds of microseconds. We were quite happy with this system at the time, especially because of the simplicity. Using well-supported internal infrastructure meant we weren’t having to manage database clusters or worry about transport between data centers ourselves, since we got that “for free”. Flexible purge was a new feature set and the performance seemed pretty good, especially since we had no predecessor to compare against.
Victims of our own success
Our first version of flexible purge didn’t start showing cracks for years, but eventually both our network and our customer base grew large enough that our system was reaching the limits of what it could scale to. As mentioned above, we needed to store purge requests beyond our maximum eviction age. Purge requests are relatively small, and compress well, but thousands of customers using the API millions of times a day adds up to quite a bit of storage that Quicksilver needed on each machine to maintain purge history, and all of that storage cut into disk space we could otherwise be using to cache customer content. We also found the limits of Quicksilver in terms of how many writes per second it could handle without replication slowing down. We bought ourselves more runway by putting Kafka queues in front of Quicksilver to buffer and throttle ourselves to even out traffic spikes, and increased batching, but all of those protections introduced latency. We knew we needed to come up with a solution without such a strong correlation between usage and operational costs.
Another pain point exposed by our growing user base that we mentioned in Part 2 was the excessive round trip times experienced by customers furthest away from our core data centers. A purge request sent by a customer in Australia would have to cross the Pacific Ocean and back before local customers would see the new content.
To summarize, three issues were plaguing us:
Latency corresponding to how far a customer was from the centralized ingest point.
Latency due to the bottleneck for writes at the centralized ingest point.
Storage needs in all data centers correlating strongly with throughput demand.
Coreless purge proves useful
The first two issues affected all types of purge. The spoke-hub distribution model was problematic for purge-by-URL just as much as it was for flexible purges. So we embarked on the path to peer-to-peer distribution for purge-by-URL to address the latency and throughput issues, and the results of that project were good enough that we wanted to propagate flexible purges through the same system. But doing so meant we’d have to replace our use of Quicksilver; it was so good at what it does (fast/reliable replication network-wide, extremely fast/high read throughput) in large part because of the core assumption of spoke-hub distribution it could optimize for. That meant there was no way to write to Quicksilver from “spoke” data centers, and we would need to find another storage system for our purges.
Flipping purge on its head
We decided if we’re going to replace our storage system we should dig into exactly what our needs are and find the best fit. It was time to revisit some of our oldest conclusions to see if they still held true, and one of the earlier ones was that proactively purging content from disk would be difficult to do efficiently given our storage layout.
But was that true? Or could we make active cache purge fast and efficient (enough)? What would it take to quickly find files on disk based on their metadata? “Indexes!” you’re probably screaming, and for good reason. Indexing files’ hostnames, cache-tags, and URLs would undoubtedly make querying for relevant files trivial, but a few aspects of our network make it less straightforward.
Cloudflare has hundreds of data centers that see trillions of unique files, so any kind of global index — even ignoring the networking hurdles of aggregation — would suffer the same type of bottlenecking issues with our previous spoke-hub system. Scoping the indices to the data center level would be better, but they vary in size up to several hundred machines. Managing a database cluster in each data center scaled to the appropriate size for the aggregate traffic of all the machines was a daunting proposition; it could easily end up being enough work on its own for a separate team, not something we should take on as a side hustle.
The next step down in scope was an index per machine. Indexing on the same machine as the cache proxy had some compelling upsides:
The proxy could talk to the index over UDS (Unix domain sockets), avoiding networking complexities in the hottest paths.
As a sidecar service, the index just had to be running anytime the machine was accepting traffic. If a machine died, so would the index, but that didn’t matter, so there wasn’t any need to deal with the complexities of distributed databases.
While data centers were frequently adding and removing machines, machines weren’t frequently adding and removing disks. An index could reasonably count on its maximum size being predictable and constant based on overall disk size.
But we wanted to make sure it was feasible on our machines. We analyzed representative cache disks from across our fleet, gathering data like the number of cached assets per terabyte and the average number of cache-tags per asset. We looked at cache MISS, REVALIDATED, and EXPIRED rates to estimate the required write throughput.
After conducting a thorough analysis, we were convinced the design would work. With a clearer understanding of the anticipated read/write throughput, we started looking at databases that could meet our needs. After benchmarking several relational and non-relational databases, we ultimately chose RocksDB, a high-performance embedded key-value store. We found that with proper tuning, it could be extremely good at the types of queries we needed.
Putting it all together
And so CacheDB was born — a service written in Rust and built on RocksDB, which operates on each machine alongside the cache proxy to manage the indexing and purging of cached files. We integrated the cache proxy with CacheDB to ensure that indices are stored whenever a file is cached or updated, and they’re deleted when a file is removed due to eviction or purging. In addition to indexing data, CacheDB maintains a local queue for buffering incoming purge operations. A background process reads purge operations in the queue, looking up all matching files using the indices, and deleting the matched files from disk. Once all matched files for an operation have been deleted, the process clears the indices and removes the purge operation from the queue.
To further optimize the speed of purges taking effect, the cache proxy was updated to check with CacheDB — similar to the previous lazy purge approach — when a cache HIT occurs before returning the asset. CacheDB does a quick scan of its local queue to see if there are any pending purge operations that match the asset in question, dictating whether the cache proxy should respond with the cached file or fetch a new copy. This means purges will prevent the cache proxy from returning a matching cached file as soon as a purge reaches the machine, even if there are millions of files that correspond to a purge key, and it takes a while to actually delete them all from disk.
Coreless purge using CacheDB and Durable Objects to distribute purges without needing to first stop at a core data center.
The last piece to change was the distribution pipeline, updated to broadcast flexible purges not just to every data center, but to the CacheDB service running on every machine. We opted for CacheDB to handle the last-mile fan out of machine to machine within a data center, using consul to keep each machine informed of the health of its peers. The choice let us keep the Workers largely the same for purge-by-URL (more here) and flexible purge handling, despite the difference in termination points.
The payoff
Our new approach reduced the long tail of the lazy purge, saving 10x storage. Better yet, we can now delete purged content immediately instead of waiting for the lazy purge to happen or expire. This new-found storage will improve cache retention on disk for all users, leading to improved cache HIT ratios and reduced egress from your origin.
The shift from lazy content purging (left) to the new Coreless Purge architecture allows us to actively delete content (right). This helps reduce storage needs and increase cache retention times across our service.
With the new coreless cache purge, we can now get a purge request into any datacenter, distribute the keys to purge, and instantly purge the content from the cache database. This all occurs in less than 150 milliseconds on P50 for tags, hostnames, and prefix URL, covering all 330 cities in 120+ countries.
Benchmarks
To measure Instant Purge, we wanted to make sure that we were looking at real user metrics — that these were purges customers were actually issuing and performance that was representative of what we were seeing under real conditions, rather than marketing numbers.
The time we measure represents the period when a request enters the local datacenter, and ends with when the purge has been executed in every datacenter. When the local data center receives the request, one of the first things we do is to add a timestamp to the purge request. When all data centers have completed the purge action, another timestamp is added to “stop the clock.” Each purge request generates this performance data, and it is then sent to a database for us to measure the appropriate quantiles and to help us understand how we can improve further.
In August 2024, we took purge performance data and segmented our collected data by region based on where the local data center receiving the request was located.
Region
P50 Aug 2024 (Coreless)
P50 May 2022 (Core-based)
Improvement
Africa
303ms
1,420ms
78.66%
Asia Pacific Region (APAC)
199ms
1,300ms
84.69%
Eastern Europe (EEUR)
140ms
1,240ms
88.70%
Eastern North America (ENAM)
119ms
1,080ms
88.98%
Oceania
191ms
1,160ms
83.53%
South America (SA)
196ms
1,250ms
84.32%
Western Europe (WEUR)
131ms
1,190ms
88.99%
Western North America (WNAM)
115ms
1,000ms
88.5%
Global
149ms
1,570ms
90.5%
Note: Global latency numbers on the core-based measurements (May 2022) may be larger than the regional numbers because it represents all of our data centers instead of only a regional portion, so outliers and retries might have an outsized effect.
What’s next?
We are currently wrapping up the roll-out of the last throughput changes which allow us to efficiently scale purge requests. As that happens, we will revise our rate limits and open up purge by tag, hostname, and prefix to all plan types! We expect to begin rolling out the additional purge types to all plans and users beginning in early 2025.
In addition, in the process of implementing this new approach, we have identified improvements that will shave a few more milliseconds off our single-file purge. Currently, single-file purges have a P50 of 234ms. However, we want to, and can, bring that number down to below 200ms.
If you want to come work on the world’s fastest purge system, check out our open positions.
Building modern full-stack applications requires connecting to many hosted third party services, from observability platforms to databases and more. All too often, this means spending time doing busywork, managing credentials and writing glue code just to get started. This is why we’re building out the Cloudflare Integrations Marketplace to allow developers to easily discover, configure and deploy products to use with Workers.
Earlier this year, we introduced integrations with Supabase, PlanetScale, Neon and Upstash. Today, we are thrilled to introduce our newest additions to Cloudflare’s Integrations Marketplace – Sentry, Turso and Momento.
Let's take a closer look at some of the exciting integration providers that are now part of the Workers Integration Marketplace.
Improve performance and reliability by connecting Workers to Sentry
When your Worker encounters an error you want to know what happened and exactly what line of code triggered it. Sentry is an application monitoring platform that helps developers identify and resolve issues in real-time.
The Workers and Sentry integration automatically sends errors, exceptions and console.log() messages from your Worker to Sentry with no code changes required. Here’s how it works:
You enable the integration from the Cloudflare Dashboard.
The credentials from the Sentry project of your choice are automatically added to your Worker.
You can configure sampling to control the volume of events you want sent to Sentry. This includes selecting the sample rate for different status codes and exceptions.
Cloudflare deploys a Tail Worker behind the scenes that contains all the logic needed to capture and send data to Sentry.
Like magic, errors, exceptions, and log messages are automatically sent to your Sentry project.
In the future, we’ll be improving this integration by adding support for uploading source maps and stack traces so that you can pinpoint exactly which line of your code caused the issue. We’ll also be tying in Workers deployments with Sentry releases to correlate new versions of your Worker with events in Sentry that help pinpoint problematic deployments. Check out our developer documentation for more information.
Develop at the Data Edge with Turso + Workers
Turso is an edge-hosted, distributed database based on libSQL, an open-source fork of SQLite. Turso focuses on providing a global service that minimizes query latency (and thus, application latency!). It’s perfect for use with Cloudflare Workers – both compute and data are served close to users.
Turso follows the model of having one primary database with replicas that are located globally, close to users. Turso automatically routes requests to a replica closest to where the Worker was invoked. This model works very efficiently for read heavy applications since read requests can be served globally. If you’re running an application that has heavy write workloads, or want to cut down on replication costs, you can run Turso with just the primary instance and use Smart Placement to speed up queries.
The Turso and Workers integration automatically pulls in Turso API credentials and adds them as secrets to your Worker, so that you can start using Turso by simply establishing a connection using the libsql SDK. Get started with the Turso and Workers Integration today by heading to our developer documentation.
Cache responses from data stores with Momento
Momento Cache is a low latency serverless caching solution that can be used on top of relational databases, key-value databases or object stores to get faster load times and better performance. Momento abstracts details like scaling, warming and replication so that users can deploy cache in a matter of minutes.
The Momento and Workers integration automatically pulls in your Momento API key using an OAuth2 flow. The Momento API key is added as a secret in Workers and, from there, you can start using the Momento SDK in Workers. Head to our developer documentation to learn more and use the Momento and Workers integration!
Try integrations out today
We want to give you back time, so that you can focus less on configuring and connecting third party tools to Workers and spend more time building. We’re excited to see what you build with integrations. Share your projects with us on Twitter (@CloudflareDev) and stay tuned for more exciting updates as we continue to grow our Integrations Marketplace!
If you would like to build an integration with Cloudflare Workers, fill out the integration request form and we’ll be in touch.
We’re excited to announce a significant performance improvement coming to Workers KV, focused on dramatically improving cold read performance and reducing latency, even for long tail access patterns.
Developers using KV have seen great performance on hot reads, but ask why their 95th percentile latency — often on a key (or set of keys) that hadn’t been accessed recently or in that region — was higher than expected. We took this feedback to heart: we’ve been working feverishly on a new caching layer for KV behind the scenes, which enables customers to achieve much more frequent hot reads, reduced worst case latency times, better flexibility and control over cache TTLs, and much faster consistency over our previous iterations, and it’s now live for all KV users.
The best part? Developers using KV don’t need to change anything to benefit from this increased performance.
What is Workers KV?
Workers KV is a key value store designed for read heavy use-cases and applications powered by Cloudflare’s network. KV’s focus on read-heavy use-cases allows it to serve hot (cached) reads in milliseconds, which makes it ideal for storing per-application or customer configuration data, routing configuration, multivariate (A/B testing) configurations, and even small asset data that you need to serve quickly. Anything that you can serialize and need quickly you can store in KV, all the way up to 25 MiB worth of data per each individual key, with no cap on total data stored.
The problem
KV might be optimized for read-heavy workloads, but it’s critical that writes are globally available quickly enough that they’re useful for your application. Under typical conditions, the convergence delay for an eventually consistent system like KV is approximately one minute, globally: a write from one location should be able to be observed by all readers. Typical conditions are great, but typical unfortunately didn’t mean “always”. It could take significant time to restore global consistency where regions like North America and Europe are reading the same value. We needed to improve not just the average convergence, but the worst case as well.
Speaking of consistency, setting a long cache Time to Live (cacheTTL) for reads would result in a situation where you won’t notice a write for the entire cacheTTL duration, as the existing cached data had not timed out yet. This means you have to trade off read latency for infrequently accessed keys against noticing writes. Developers using KV have been consistent in their feedback: a higher cache TTL should improve performance, but not multiply the time it takes for KV to converge on a write to that key.
Lastly, our cold read times also left room for improvement. While cache hits are fast in KV, a cache miss would result in a request being routed all the way to our storage backends. While this is slow for everyone, it was particularly slow for folks in regions not immediately in the US or EU.This is poor performance that doesn’t represent what we can achieve with our global presence.
Our solution
A new horizontally scaled tiered cache
We’ve revamped Workers KV to be powered by a new tiered cache implementation. This implementation is written as a Worker service. We reuse the Dynamic Dispatch infrastructure developed for Workers for Platforms which lets us jump from our old KV worker into our new caching service within hundreds of microseconds. Importantly, this means we don’t impact cache hit performance to implement this new transparent caching layer. We leverage the same infrastructure powering Smart Placement to implement the tiering.
Before we re-designed KV, our topology looked like this:
All data centers in Cloudflare’s network can reach out to the origin in the event of a cache miss or to do a background refresh.
Cache TTL and efficiency
Our design goal was clear and ambitious: “can we relax honoring the cacheTTL constraint without violating it”? While this seems contradictory, the motivation is clear: we want to minimize the need to communicate with our storage backends while honoring the user-facing semantics of the cacheTTL setting, as it can have security implications if violated (e.g. if you use it to store and validate security tokens). Answering this design question also manages to simultaneously solve many of the problems outlined earlier.
Comparing existing solutions
First, let’s look at the design constraints for two eventually consistent storage systems at Cloudflare: Quicksilver and Tiered CDN.
Quicksilver gives us global consistency within seconds using a push architecture to replicate the data across all machines at Cloudflare. That architecture however doesn’t scale for Workers KV’s needs, which can have terabytes of data just within one namespace. This would be too much to replicate to every single data center.
By comparison, the tiered CDN cache is a pull mechanism where each hop pulls a more recent version of the asset into the local cache on access. That scales better because we only use storage for assets that are accessed, which works well with most use-cases where the vast majority of data is never retrieved. However, a pull based architecture is insufficient because it can only let us aggregate traffic across broader regions but we still can’t decouple how long we serve from the cache from the cacheTTL.
Push based architectures let us know when an asset is updated and enable scalable storage. By blending the properties of both systems, we can decouple how long we store the assets in cache from the cacheTTL. And that’s exactly what we did: KV now uses a hybrid push/pull caching layer where data centers closest to customers will pull from the regional data centers that are a little bit farther away. Writes will broadcast to all regional data centers that a key has been updated, so that the regional data center will remove that key from the local cache.
We can solve this problem by taking advantage of the fact that we semantically understand the write operations that are happening within Workers KV:
Workers KV doesn’t have one data center per region as might be typical for your zone in a Cloudflare CDN regional tiered cache topology. Instead, each key in a KV namespace is deterministically assigned a data center by performing a weighted rendezvous hash. The rendezvous hash ensures that load is distributed equally across the region and outages result in optimal shifts of traffic.
When the data center closest to a customer has a miss, it computes the regional data center affinity and provides that information to our Smart Placement infrastructure. When a regional tier misses, we repeat this process except using data centers in the KV origin region.
Finally, a miss at the upper tier exits to our storage nodes located in that origin region.
When we do a write, we only purge (invalidate) the key from the regional and upper tier data centers. This is a fixed number of data centers in our network regardless of how many data centers we add, which ensures that we aren’t reducing cache hit rates as our network continues to grow Compared with a global purge that delivers the event to every data center in our network, because we only need to deliver this purge to a random fixed set of data centers in our network, our aggregate write capacity for Workers KV automatically scales horizontally as we add more data centers.
All lower-tier data centers will reach out to a regional tier responsible for a given key in the event of a cache miss. If the regional tier doesn’t have the content, the regional tier will then ask an upper-tier out of region for the content. On a write for a given key, the responsible regional and upper tiers have that key deleted from cache.
Why do we call this a hybrid topology? The data centers closest to customers pull from the regional data centers as normal, but we automatically push invalidation events to the regional tier data centers on every write. That way, those customer data center pulls know to get an updated value when there is one. This means that while the cacheTTL parameter controls the caching behavior closest to the customer, it’s treated as a suggestion at best at the regional and upper tiers.
This way we’ve combined the push design principles behind Quicksilver, which delivers global consistency within seconds, with the pull-based design of our CDN tiered caching which can scale to handle “infinite” size workloads and prioritizes the assets that are most frequently accessed.
Visualizing it
It can be a bit hard to follow what’s happening in the new caching layer since there’s so many moving parts.
Here’s a video of a simplified version of how it works:
Small yellow balls represent KV read requests, larger green balls represent read responses. A larger purple ball represents a KV write request, while a read response ball represents a KV write response. Teal balls represent purge requests being broadcast. The “E” is a data center that doesn’t participate as a regional tier. The R represents the regional tier for key N while O is the upper tier for key N.
Decoupled cache TTL and consistency parameters
As a refresher, the objects written to KV can specify a cacheTTL: by default this is set to 1 minute, which is also the minimum acceptable value. This means that if an asset has been in the cache for longer than a minute, we bypass the cache and read instead from our durable storage nodes. In order to prevent eyeballs noticing origin fetches every minute, we implement stale while revalidate logic in our caching layer that automatically refreshes from the storage nodes in the background as requests come in.
Here’s an example from a Worker that’s constantly reading the same key
Notice the absence of any spikes indicating a cache miss? You’d expect to see them regularly every minute or so in the tens or even hundreds of milliseconds when the cacheTTL should expire. The reason this doesn’t happen is because as the expiry time is approaching, a background request to the storage nodes occurs and the cache is updated with an expiry time one more minute into the future; thus the asset in cache is never too stale and eyeball requests are always served from cache. Let’s take a look at requests to our storage layer before and after adding tiering:
Yellow is the estimated number of requests that would have occurred to origin without the new caching layer. Blue is the number of requests we’re making now.
The above chart is for a system with conservative parameters set. The upper tier doesn’t store the data for much longer than the cacheTTL currently and the upper tier will itself still do a background refresh probabilistically even though it doesn’t actually need to since we see all writes.
The new caching layer we’ve built inherits the old background refresh mechanism and expands on it. The first thing we did is decouple the background refresh period from the cacheTTL as a separate parameter (also defaulting to 1 minute). This means that even if you set a cacheTTL for 1 hour, KV will still check every minute from the regional tier to see if the value has been updated. If the data you’re storing within KV doesn’t have strict requirements on stale reads (think a key that’s accessed once every 10 minutes but needs to honor a write within 1 minute like security tokens), then you can increase the cacheTTL so that infrequently accessed keys stick around in the cache without changing the observed consistency.
Consistency improvements
Speaking of consistency, we’ve improved the worst case performance of that as well. Historically, we’ve had a background system that crawls all data in the storage nodes to figure out which region has the most up to date value and update accordingly. This gives us complete consistency coverage, but could take a significant amount of time to confirm. We would also periodically check both backends to see if network conditions had changed to pick the primary storage region to use for a given customer-close data center. Of course inconsistencies would be resolved then, but in practice this happens randomly, and at a low probability that won’t typically catch any meaningful values served inconsistently.
With the new caching layer all this changes. Since we’re now only reading keys on first access or after a write, we have enough storage capacity that we can check both backends on every read. When a customer requests data, we make a call to each origin data center, with the fastest response being returned immediately to reduce read latency. If the other data center has a newer value than what was returned first, we synchronize both data centers and notify our caching layer to purge that key from all regional data centers. If the other data center instead has an older value, we just synchronize the data centers without purging since we served the latest value. This means that even if our data centers are inconsistent, readers will notice new values much more quickly.
Latency improvements
Here’s the latency improvement at 10% rollout on a logarithmic x-axis:
Architecture that just gets better
This is just the start of what we can do. We now have a solid foundation for making further improvements, including making our best case reads even faster. We’ll be working on cutting out parts of our traditional stack that add unnecessary latency, and adding new high performance features that were too difficult to integrate otherwise. We can also explore features like setting the consistency TTL parameter for sub one minute consistency for additional cost. Similarly, we could create a best effort global purge feature if you want to choose to signal writes that way. Finally, we’re looking at exposing this new caching layer as a general Worker binding anyone can use within a Worker in front of their own service or to put in front of their Worker. If these sound like the killer features you need, please reach out to us if you’re interested in trying them out.
What next?
Developers don’t have to do anything to benefit from KV’s new performance improvements. We are currently in the process of rolling out our new architecture, and you don’t have to redeploy your Worker or change the way you use KV to benefit.
Workers KV is a natural fit for any application built on top of our Workers platform. We provide a native API that enables any Worker script to read, write, list, and manageyour Workers KV storage. You can also interact with Workers KV directly via our REST API from any client that can make a HTTP request, and the Cloudflare Dashboard provides an easy way to create, list, and delete keys to be used with the rest of your Workers setup.
Regardless of how you use Workers KV, it will be faster than ever before. We’re excited to see what you build with us, and you can dive into our documentation to start building with it.
Today we’re excited to announce an update to our Tiered Cache offering: Regional Tiered Cache.
Tiered Cache allows customers to organize Cloudflare data centers into tiers so that only some “upper-tier” data centers can request content from an origin server, and then send content to “lower-tiers” closer to visitors. Tiered Cache helps content load faster for visitors, makes it cheaper to serve, and reduces origin resource consumption.
Regional Tiered Cache provides an additional layer of caching for Enterprise customers who have a global traffic footprint and want to serve content faster by avoiding network latency when there is a cache miss in a lower-tier, resulting in an upper-tier fetch in a data center located far away. In our trials, customers who have enabled Regional Tiered Cache have seen a 50-100ms improvement in tail cache hit response times from Cloudflare’s CDN.
What problem does Tiered Cache help solve?
First, a quick refresher on caching: a request for content is initiated from a visitor on their phone or computer. This request is generally routed to the closest Cloudflare data center. When the request arrives, we look to see if we have the content cached to respond to that request with. If it’s not in cache (it’s a miss), Cloudflare data centers must contact the origin server to get a new copy of the content.
Getting content from an origin server suffers from two issues: latency and increased origin egress and load.
Latency
Origin servers, where content is hosted, can be far away from visitors. This is especially true the more global of an audience a particular piece of content has relative to where the origin is located. This means that content hosted in New York can be served in dramatically different amounts of time for visitors in London, Tokyo, and Cape Town. The farther away from New York a visitor is, the longer they must wait before the content is returned. Serving content from cache helps provide a uniform experience to all of these visitors because the content is served from a data center that’s close.
Origin load
Even when using a CDN, many different visitors can be interacting with different data centers around the world and each data center, without the content visitors are requesting, will need to reach out to the origin for a copy. This can cost customers money because of egress fees origins charge for sending traffic to Cloudflare, and it places needless load on the origin by opening multiple connections for the same content, just headed to different data centers.
When Tiered Cache is not enabled, all data centers in Cloudflare’s network can reach out to the origin in the event of a cache miss.
Performance improvements and origin load reductions are the promise of tiered cache.
Tiered Caching means that instead of every data center reaching out to the origin when there is a cache miss, the lower-tier data center that is closest to the visitor will reach out to a larger upper-tier data center to see if it has the requested content cached before the upper-tier asks the origin for the content. Organizing Cloudflare’s data centers into tiers means that fewer requests will make it back to the origin for the same content, preserving origin resources, reducing load, and saving the customer money in egress fees.
What options are there to maximize the benefits of tiered caching?
Cloudflare customers are given access to different Tiered Cache topologies based on their plan level. There are currently two predefined Tiered Cache topologies to select from – Smart and Generic Global. If either of those don’t work for a particular customer’s traffic profile, Enterprise customers can also work with us to define a custom topology.
In 2021, we announced that we’d allow all plans to access Smart Tiered Cache. Smart Tiered Cache dynamically finds the single closest data center to a customer’s origin server and chooses that as the upper-tier that all lower-tier data centers reach out to in the event of a cache miss. All other data centers go through that single upper-tier for content and that data center is the only one that can reach out to the origin. This helps to drastically boost cache hit ratios and reduces the connections to the origin. However, this topology can come at the cost of increased latency for visitors that are farther away from that single upper-tier.
When Smart Tiered Cache is enabled, a single upper tier data center can communicate with the origin, helping to conserve origin resources.
Enterprise customers may select additional tiered cache topologies like the Generic Global topology which allows all of Cloudflare’s large data centers on our network (about 40 data centers) to serve as upper-tiers. While this topology may help reduce the long tail latencies for far-away visitors, it does so at the cost of increased connections and load on a customer's origin.
When Generic Global Tiered Cache is enabled, lower-tier data centers are mapped to all upper-tier data centers in Cloudflare’s network which can all reach out to the origin in the event of a cache miss.
To describe the latency problem with Smart Tiered Cache in more detail let’s use an example. Suppose the upper-tier data center is selected to be in New York using Smart Tiered Cache. The traffic profile for the website with the New York upper-tier is relatively global. Visitors are coming from London, Tokyo, and Cape Town. For every cache miss in a lower-tier it will need to reach out to the New York upper-tier for content. This means these requests from Tokyo will need to traverse the Pacific Ocean and most of the continental United States to check the New York upper-tier cache. Then turn around and go all the way back to Tokyo. This is a giant performance hit for visitors outside the US for the sake of improving origin resource load.
Regional Tiered Cache brings the best of both worlds
With Regional Tiered Cache we introduce a middle-tier in each region around the world. When a lower-tier fetches on a cache miss it tries the regional-tier first if the upper-tier is in a different region. If the regional-tier does not have the asset then it asks the upper-tier for it. On the response the regional-tier writes to its cache so other lower-tiers in the same region benefit.
By putting an additional tier in the same region as the lower-tier, there’s an increased chance that the content will be available in the region before heading to a far-away upper-tier. This can drastically improve the performance of assets while still reducing the number of connections that will eventually need to be made to the customer’s origin.
When Regional Tiered Cache is enabled, all lower-tier data centers will reach out to a regional tier close to them in the event of a cache miss. If the regional tier doesn’t have the content, the regional tier will then ask an upper-tier out of region for the content. This can help improve latency for Smart and Custom Tiered Cache topologies.
Who will benefit from regional tiered cache?
Regional Tiered Cache helps customers with Smart Tiered Cache or a Custom Tiered Cache topology with upper-tiers in one or two regions. Regional Tiered Cache is not beneficial for customers with many upper-tiers in many regions like Generic Global Tiered Cache .
How to enable Regional Tiered Cache
Enterprise customers can enable Regional Tiered Cache via the Cloudflare Dashboard or the API:
UI
To enable Regional Tiered Cache, simply sign in to your account and select your website
Navigate to the Cache Tab of the dashboard, and select the Tiered Cache Section
If you have Smart or Custom Tiered Cache Topology Selected, you should have the ability to choose Regional Tiered Cache
API
Please see the documentation for detailed information about how to configure Regional Tiered Cache from the API.
Regional Tiered Cache is the first of many planned improvements to Cloudflare’s Tiered Cache offering which are currently in development. We look forward to hearing what you think about Regional Tiered Cache, and if you’re interested in helping us improve our CDN, we’re hiring.
Ten years ago, in 2012, we released a product that put “a powerful new set of tools” in the hands of Cloudflare customers, allowing website owners to control how Cloudflare would cache, apply security controls, manipulate headers, implement redirects, and more on any page of their website. This product is called Page Rules and since its introduction, it has grown substantially in terms of popularity and functionality.
Page Rules are a common choice for customers that want to have fine-grained control over how Cloudflare should cache their content. There are more than 3.5 million caching Page Rules currently deployed that help websites customize their content. We have spent the last ten years learning how customers use those rules to cache content, and it’s clear the time is ripe for evolving rules-based caching on Cloudflare. This evolution will allow for greater flexibility in caching different types of content through additional rule configurability, while providing more visibility into when and how different rules interact across Cloudflare’s ecosystem.
Today, we’ve announced that Page Rules will be re-imagined into four product-specific rule sets: Origin Rules, Cache Rules, Configuration Rules, and Redirect Rules.
In this blog we’re going to discuss Cache Rules, and how we’re applying ten years of product iteration and learning from Page Rules to give you the tools and options to best optimize your cache.
Activating Page Rules, then and now
Adding a Page Rule is very simple: users either make an API call or navigate to the dashboard, enter a full or wildcard URL pattern (e.g. example.com/images/scr1.png or example.com/images/scr*), and tell us which actions to perform when we see that pattern. For example a Page Rule could tell browsers– keep a copy of the response longer via “Browser Cache TTL”, or tell our cache that via “Edge Cache TTL”. Low effort, high impact. All this is accomplished without fighting origin configuration or writing a single line of code.
Under the hood, a lot is happening to make that rule scale: we turn every rule condition into regexes, matching them against the tens of millions of requests per second across 275+ data centers globally. The compute necessary to process and apply new values on the fly across the globe is immense and corresponds directly to the number of rules we are able to offer to users. By moving cache actions from Page Rules to Cache Rules we can allow for users to not only set more rules, but also to trigger these rules more precisely.
More than a URL
Users of Page Rules are limited to specific URLs or URL patterns to define how browsers or Cloudflare cache their websites files. Cache Rules allows users to set caching behavior on additional criteria, such as the HTTP request headers or the requested file type. Users can continue to match on the requested URL also, as used in our Page Rules example earlier. With Cache Rules, users can now define this behavior on one or more fields available.
For example, if a user wanted to specify cache behavior for all image/png content-types, it’s now as simple as pushing a few buttons in the UI or writing a small expression in the API. Cache Rules give users precise control over when and how Cloudflare and browsers cache their content. Cache Rules allow for rules to be triggered on request header values that can be simply defined like
Which triggers the Cache Rule to be applied to all image/png media types. Additionally, users may also leverage other request headers like cookie values, user-agents, or hostnames.
As a plus, these matching criteria can be stacked and configured with operators like AND and OR, providing additional simplicity in building complex rules from many discrete blocks, e.g. if you would like to target both image/png AND image/jpeg.
For the full list of fields available conditionals you can apply Cache Rules to, please refer to the Cache Rules documentation.
Visibility into how and when Rules are applied
Our current offerings of Page Rules, Workers, and Transform Rules can all manipulate caching functionality for our users’ content. Often, there is some trial and error required to make sure that the confluence of several rules and/or Workers are behaving in an expected manner.
As part of upgrading Page Rules we have separated it into four new products:
Origin Rues
Cache Rules
Configuration Rules
Redirect Rules
This gives users a better understanding into how and when different parts of the Cloudflare stack are activated, reducing the spin-up and debug time. We will also be providing additional visibility in the dashboard for when rules are activated as they go through Cloudflare. As a sneak peek please see:
Our users may take advantage of this strict precedence by chaining the results of one product into another. For example, the output of URL rewrites in Transform Rules will feed into the actions of Cache Rules, and the output of Cache Rules will feed into IP Access Rules, and so on.
In the future, we plan to increase this visibility further to allow for inputs and outputs across the rules products to be observed so that the modifications made on our network can be observed before the rule is even deployed.
Cache Rules. What are they? Are they improved? Let’s find out!
To start, Cache Rules will have all the caching functionality currently available in Page Rules. Users will be able to:
Tell Cloudflare to cache an asset or not,
Alter how long Cloudflare should cache an asset,
Alter how long a browser should cache an asset,
Define a custom cache key for an asset,
Configure how Cloudflare serves stale, revalidates, or otherwise uses header values to direct cache freshness and content continuity,
And so much more.
Cache Rules are intuitive and work similarly to our other ruleset engine-based products announced today: API or UI conditionals for URL or request headers are evaluated, and if matching, Cloudflare and browser caching options are configured on behalf of the user. For all the different options available, see our Cache Rules documentation.
Under the hood, Cache Rules apply targeted rule applications so that additional rules can be supported per user and across the whole engine. What this means for our users is that by consuming less CPU for rule evaluations, we’re able to support more rules per user. For specifics on how many additional Cache Rules you’ll be able to use, please see the Future of Rules Blog.
How can you use Cache Rules today?
Cache Rules are available today in beta and can be configured via the API, Terraform, or UI in the Caching tab of the dashboard. We welcome you to try the functionality and provide us feedback for how they are working or what additional features you’d like to see via community posts, or however else you generally get our attention 🙂.
If you have Page Rules implemented for caching on the same path, Cache Rules will take precedence by design. For our more patient users, we plan on releasing a one-click migration tool for Page Rules in the near future.
What’s in store for the future of Cache Rules?
In addition to granular control and increased visibility, the new rules products also opens the door to more complex features that can recommend rules to help customers achieve better cache hit ratios and reduce their egress costs, adding additional caching actions and visibility, so you can see precisely how Cache Rules will alter headers that Cloudflare uses to cache content, and allowing customers to run experiments with different rule configurations and see the outcome firsthand. These possibilities represent the tip of the iceberg for the next iteration of how customers will use rules on Cloudflare.
Try it out!
We look forward to you trying Cache Rules and providing feedback on what you’d like to see us build next.
The collective thoughts of the interwebz
Manage Consent
To provide the best experiences, we use technologies like cookies to store and/or access device information. Consenting to these technologies will allow us to process data such as browsing behavior or unique IDs on this site. Not consenting or withdrawing consent, may adversely affect certain features and functions.
Functional
Always active
The technical storage or access is strictly necessary for the legitimate purpose of enabling the use of a specific service explicitly requested by the subscriber or user, or for the sole purpose of carrying out the transmission of a communication over an electronic communications network.
Preferences
The technical storage or access is necessary for the legitimate purpose of storing preferences that are not requested by the subscriber or user.
Statistics
The technical storage or access that is used exclusively for statistical purposes.The technical storage or access that is used exclusively for anonymous statistical purposes. Without a subpoena, voluntary compliance on the part of your Internet Service Provider, or additional records from a third party, information stored or retrieved for this purpose alone cannot usually be used to identify you.
Marketing
The technical storage or access is required to create user profiles to send advertising, or to track the user on a website or across several websites for similar marketing purposes.