Post Syndicated from original https://www.backblaze.com/blog/backblaze-drive-stats-for-q3-2022/
As of the end of Q3 2022, Backblaze was monitoring 230,897 hard drives and SSDs in our data centers around the world. Of that number, 4,200 are boot drives, with 2,778 SSDs and 1,422 HDDs. The SSDs were previously covered in our recently published Midyear SSD Report. Today, we’ll focus on the 226,697 data drives under management as we review their quarterly and lifetime failure rates as of the end of Q3 2022.
We’ll also take a look at the relationship between hard drive failure rates and hard drive cost. Along the way, we’ll share our observations and insights on the data presented, and, as always, we look forward to you doing the same in the comments section at the end of the post.
Q3 2022 Hard Drive Failure Rates
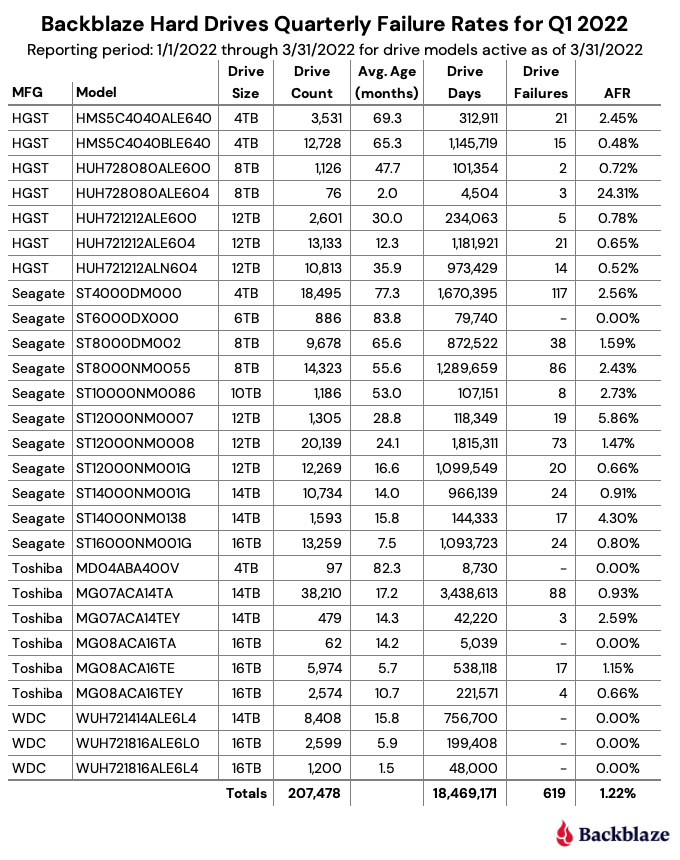
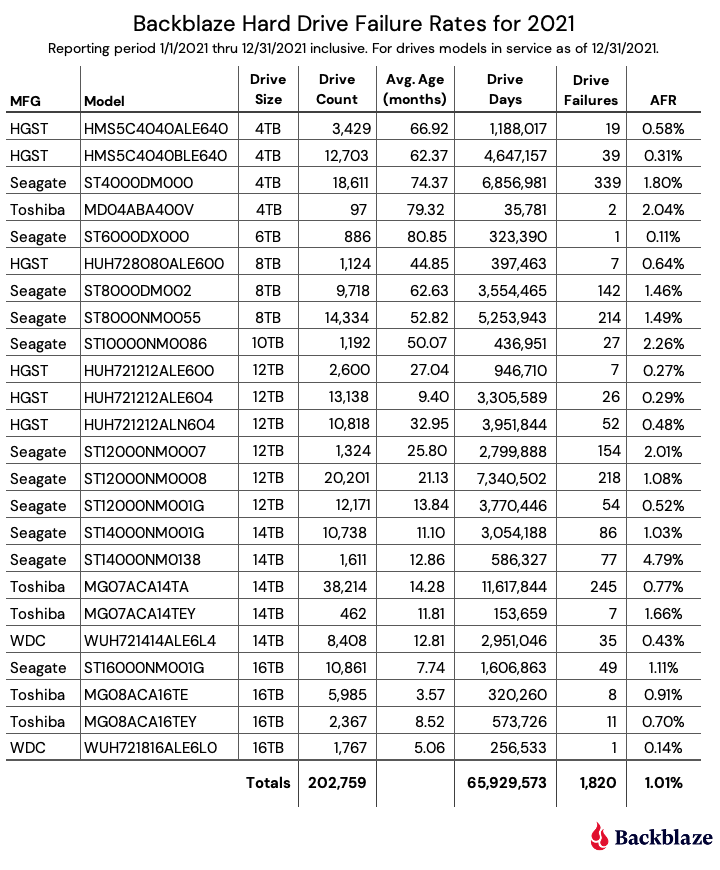
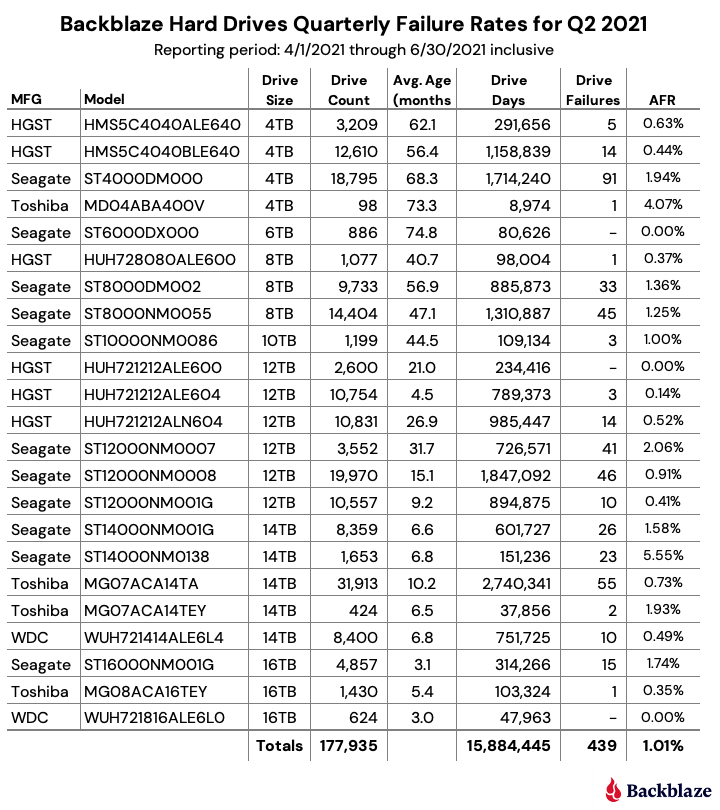
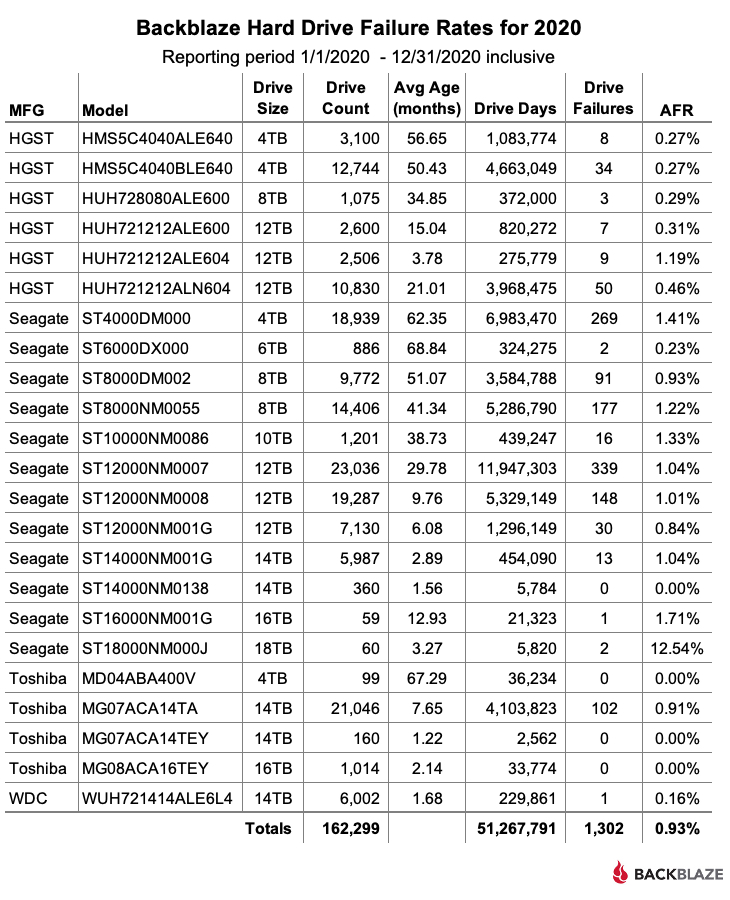
Let’s start with reviewing our data for the Q3 2022 period. In that quarter, we tracked 226,697 hard drives used to store data. For our evaluation, we removed 388 drives from consideration as they were used for testing purposes or drive models which did not have at least 60 drives. This leaves us with 226,309 hard drives grouped into 29 different models to analyze.
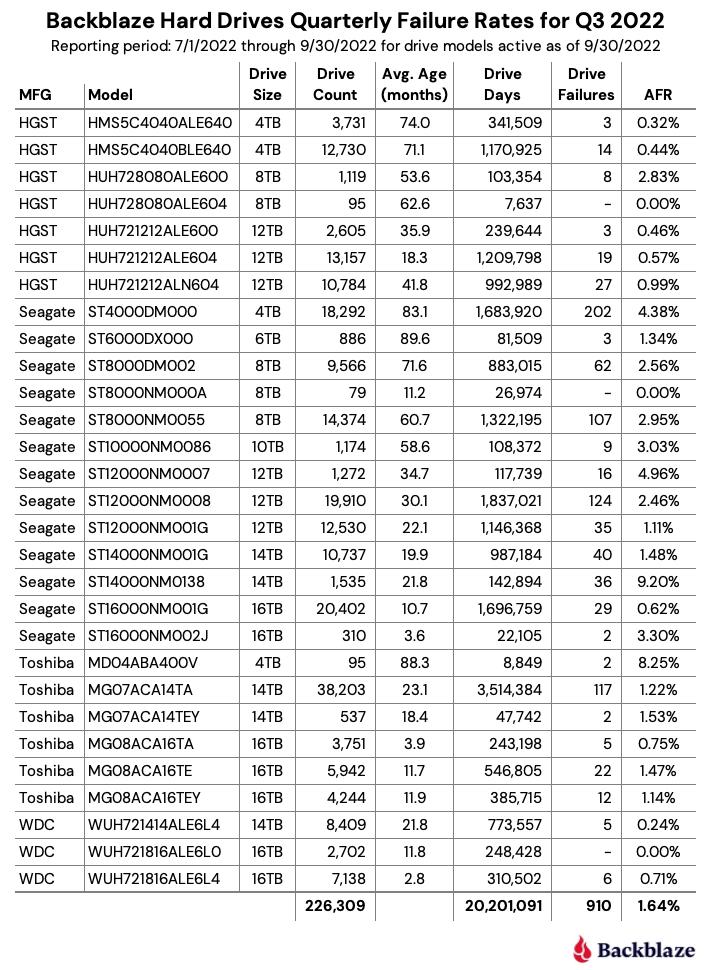
Notes and Observations on the Q2 2022 Stats
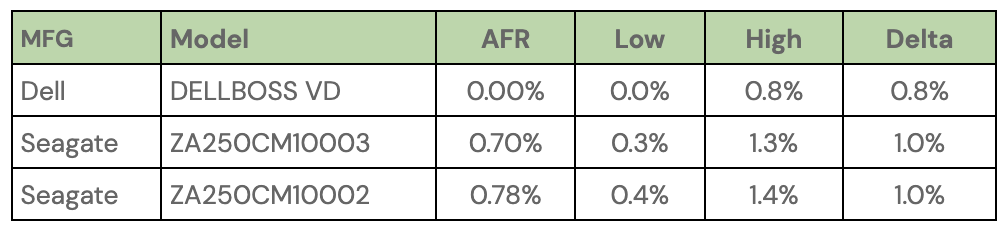
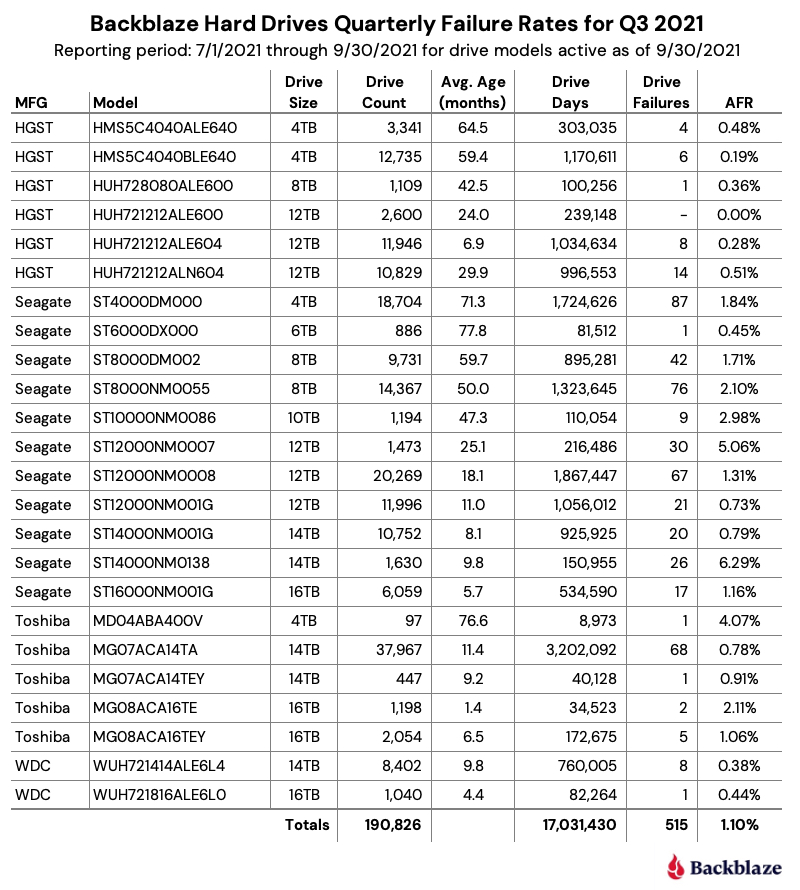
Zero failures for Q3: Three drives had zero failures this quarter: the 8TB HGST (model: HUH728080ALE604), the 8TB Seagate (model: ST8000NM000A), and the 16TB WDC (model: WUH721816ALE6L0). For the 8TB HGST, that was the second quarter in a row with zero failures. Of the three, only the WDC model has enough lifetime data (drive days) to be comfortable with the calculated annualized failure rate (AFR). As we will see later in this review, this 14TB WDC model has a lifetime AFR of 0.11% with the confidence interval range of just 0.30 at a 95% confidence level.
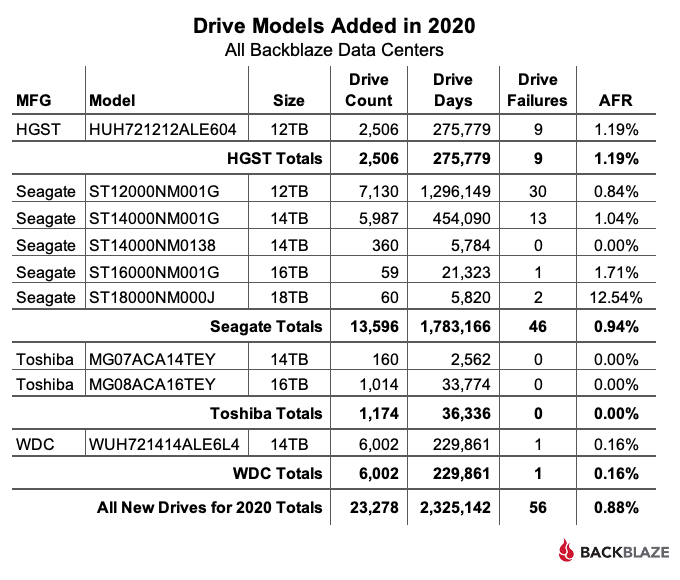
The new disks in town: There are two new models in this quarter’s data: the 8TB Seagate (model: ST8000NM000A) and the 16TB Seagate (model: ST16000NM002J). Neither has enough data to be interesting yet, but as noted above, the 8TB Seagate had zero failures in its first quarter in operation. These additions give us 29 different models we are tracking, up from 27 in the previous quarter.
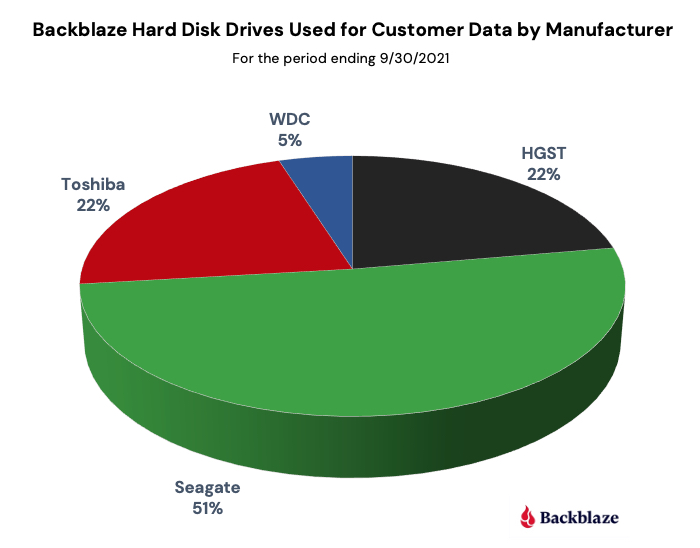
The 29 models break down by manufacturer as:
- HGST: 7 models
- Seagate: 13 models
- Toshiba: 6 models
- WDC: 3 models
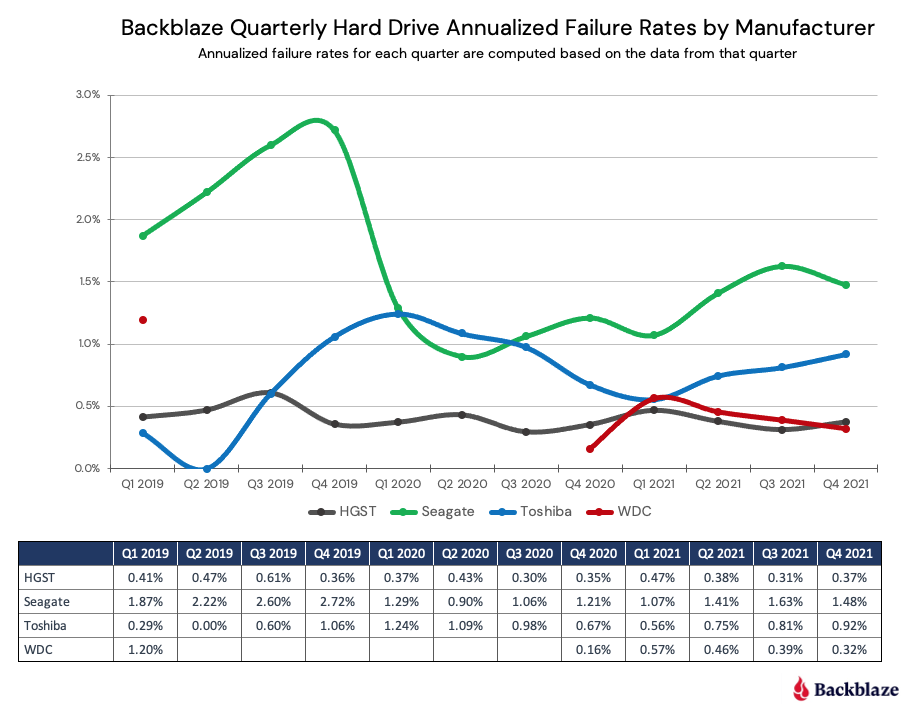
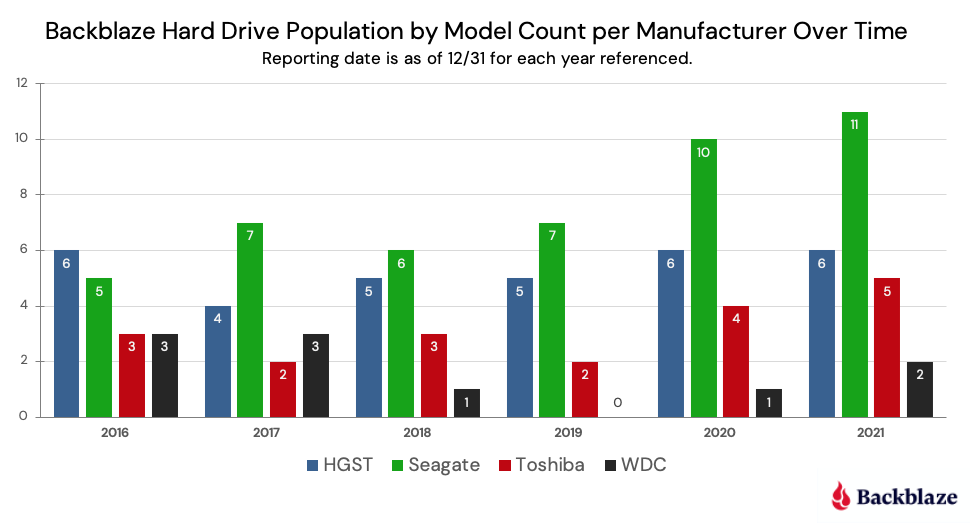
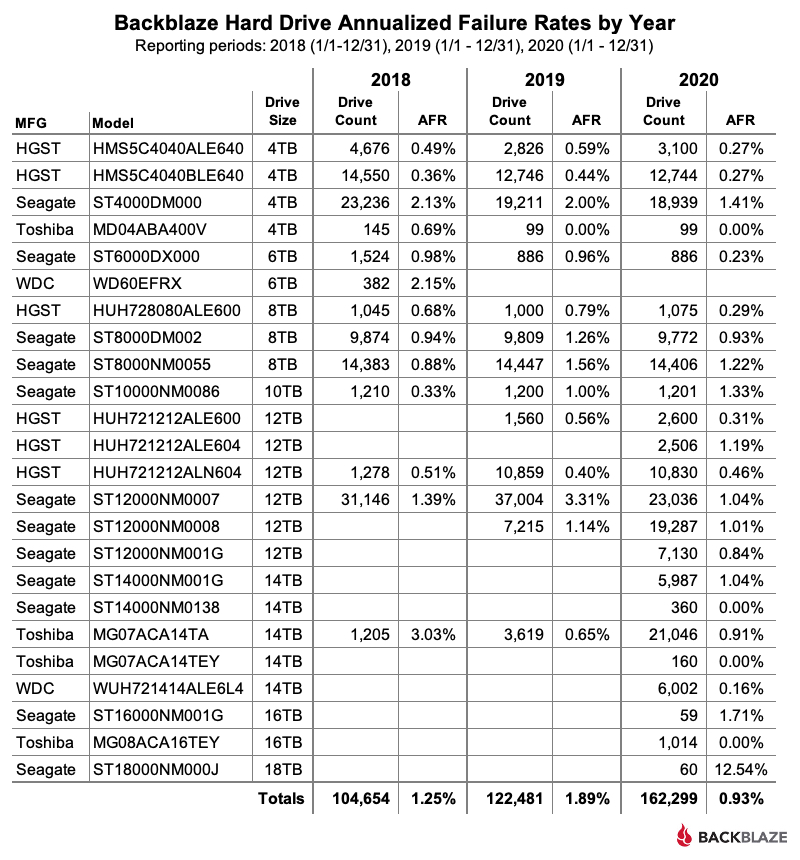
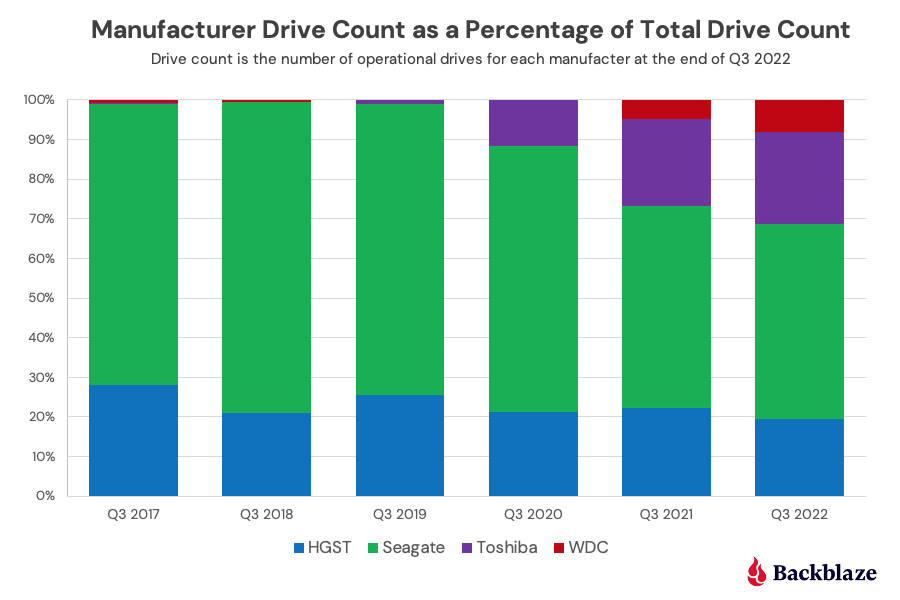
The chart below shows, by manufacturer, how our drive fleet has changed over the past six years.
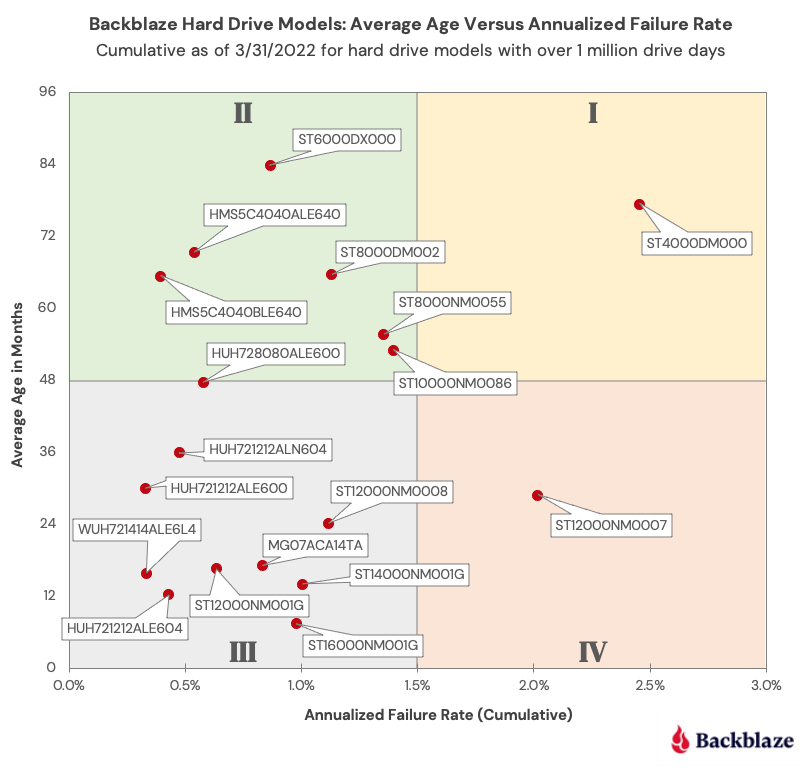
The old guard is feeling old: All three of the oldest drives we currently use are showing signs of their age as each experienced an increase in AFR from Q2 to Q3 2022 as shown below.
| MFG | Model | Size | Q3 2022 Avg Age | Q2 AFR | Q3 AFR |
|---|---|---|---|---|---|
| Seagate | ST4000DM000 | 4TB | 83.1 | 3.42% | 4.38% |
| Seagate | ST6000DX000 | 6TB | 89.6 | 0.91% | 1.34% |
| TOSHIBA | MD04ABA400V | 4TB | 88.3 | 0.00% | 8.25% |
Note that the 4TB Toshiba only had two failures in Q3 2022. The high AFR (8.25%) is due to the limited number of drive days in the quarter (8,849) from only 95 drives. For all three, it seems their spindles, actuators, and media are starting to wear out after seven years or so of constant spinning.
The Quarterly AFR continues to rise: The AFR for Q3 2022 was 1.64%, increasing from 1.46% in Q2 2022 and from 1.10% a year ago. As noted previously, this is related to the aging of the entire drive fleet and we would expect this number to go down as older drives are retired and replaced over the next year. A possible harbinger of what is to come can be seen in the 16TB models which as a group had an 0.80% AFR in Q3 2022. As these drives are used to replace the aging 4TB drives, the quarterly AFR should decrease.
Hard Drive Failure Versus Hard Drive Cost
One question that comes up is why we would continue to buy a drive model that has a higher annualized failure rate versus a comparably sized, but more expensive, model. Two primary reasons: First, we are able to do so as our cloud storage Backblaze Vault architecture is designed for drive failure. Second, by studying data like drive stats and such, we work hard to understand our environment from the inside out. Understanding the relationship between cost and drive failure is one of those learnings. Here’s a simple example below using three fictitious models of 14TB drives, Model 1, Model 2, and Model 3.
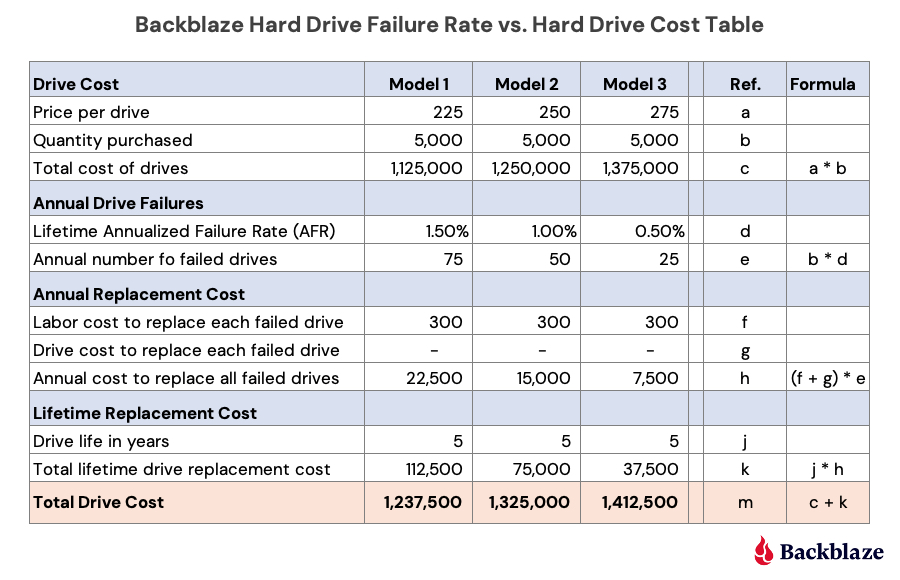
Let’s take a look at the different sections (i.e. blue rows) of this table.
Drive Cost: Each model has a different price: low ($225), medium ($250), and high ($275). We would buy the same number of drives (5,000) of each model and we get the cost of each model.
Annual Drive Failures: This is the AFR of each drive model. For this example, we assigned the lowest price model to the highest failure rate, the highest price model to the lowest failure rate, and so on. In practice, we would use our own AFR numbers for a given model that we are considering purchasing. Regardless, we get the annual number of failed drives for each model.
Annual Replacement Cost: Labor cost covers the human cost involved from identifying the failure to returning and replacing the drive. Drive cost is zero here as the assumption is that all drives are returned for credit or replacement to the manufacturer or their agent. A zero value here may not always be the case; hence the line item. In either case, the annual cost to replace the failed drives for each model is computed.
Lifetime Replacement Cost: Take the number of years you expect the drive model to be in service times the annual cost to replace the failed drives. All of this gets us the total cost of each drive model—the peach section. In our example, the most expensive model (Model 3) is the most expensive drive over the five-year life expectancy and the lowest cost drive model (Model 1) is the least expensive over the same period, even with a higher annualized failure rate.
But we’re not done. The next question is: What would the annualized failure rate for the least expensive choice, Model 1, need to be such that the total cost after five years would be the same as Model 2 and then Model 3? In other words, how much failure can we tolerate before our original purchase decision is wrong? When we crunch the numbers we come out with the following:
- Model 1 and Model 2 have the same total drive cost ($1,325,000) when the annualized failure rate for Model 1 is 2.67%.
- Model 1 and Model 3 have the same total drive cost ($1,412,500) when the annualized failure rate for Model 1 is 3.83%.
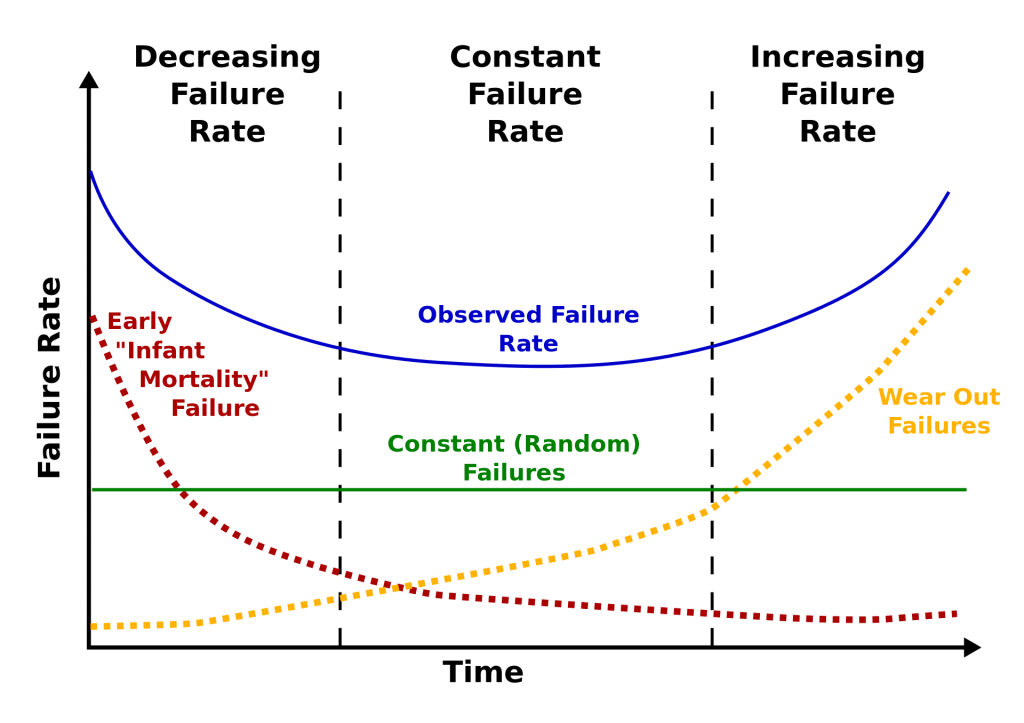
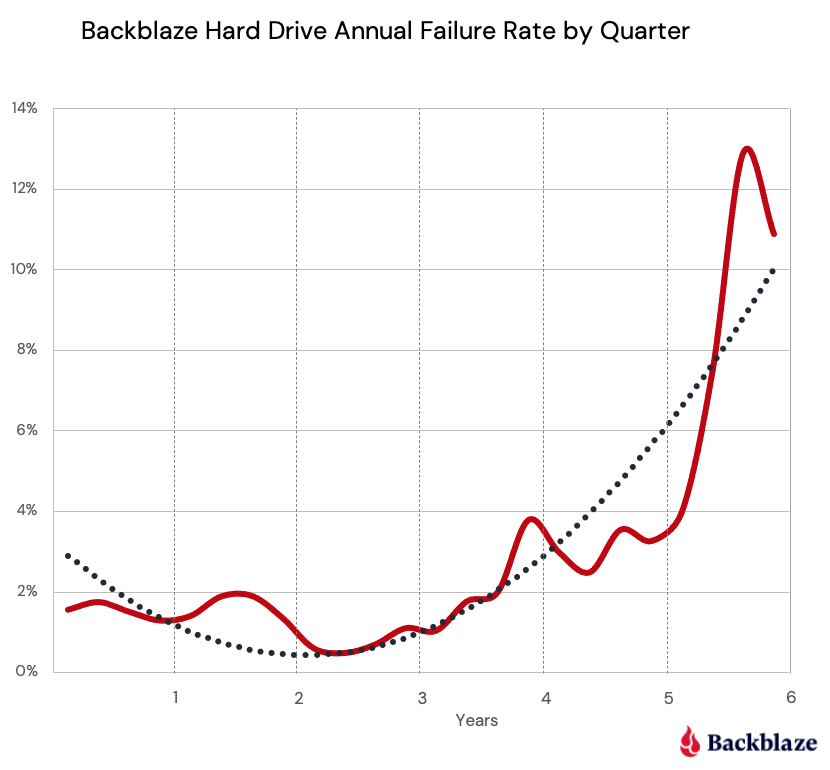
The model presented is a simplified version of how we think about drive purchase decisions using annualized drive failure rates as part of the equation. You can make this model more accurate, and complicated, by adding in the drive failure rate changes over time (the bathtub curve) and prorating the cost of returning failed drives over the years. Whether that is needed is up to you.
The need for such a model is important in our business if you are interested in optimizing the efficiency of your cloud storage platform. Otherwise, just robotically buying the most expensive, or least expensive, drives is turning a blind eye to the expense side of the ledger.
On an individual or small office/home office level, your drive purchasing decision requires a lot less math, and often comes down to what drive can you afford. Even so, you should still try to do some research. Our drive stats can help, but in all cases you should have a solid backup plan in place as no drive you can buy is failure proof.
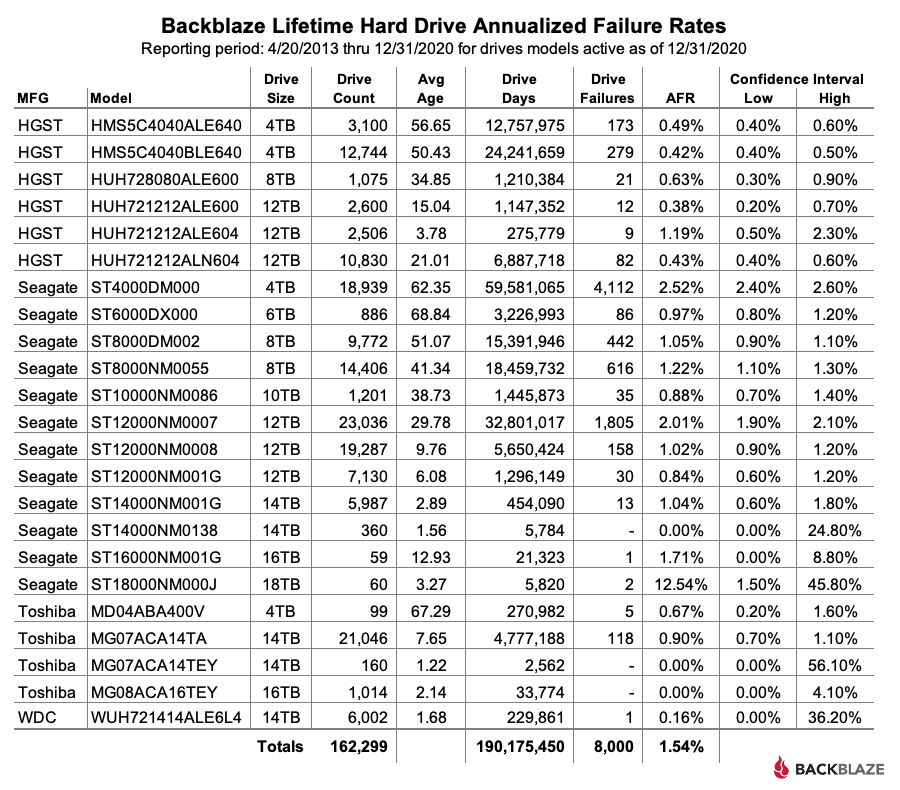
Lifetime Hard Drive Failure Rates
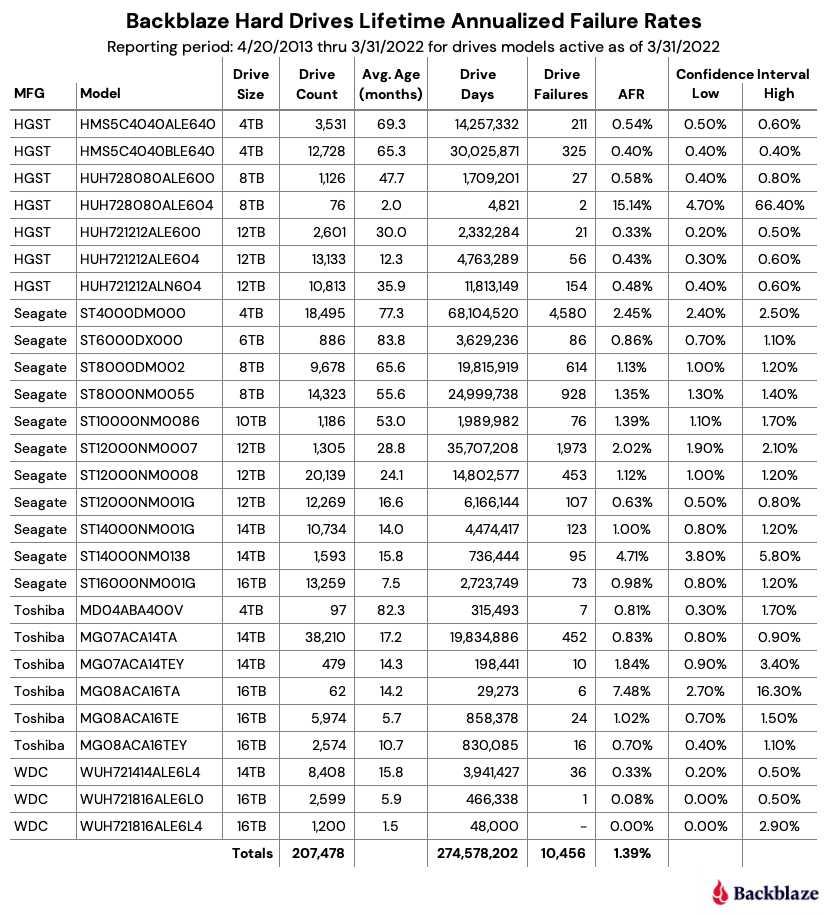
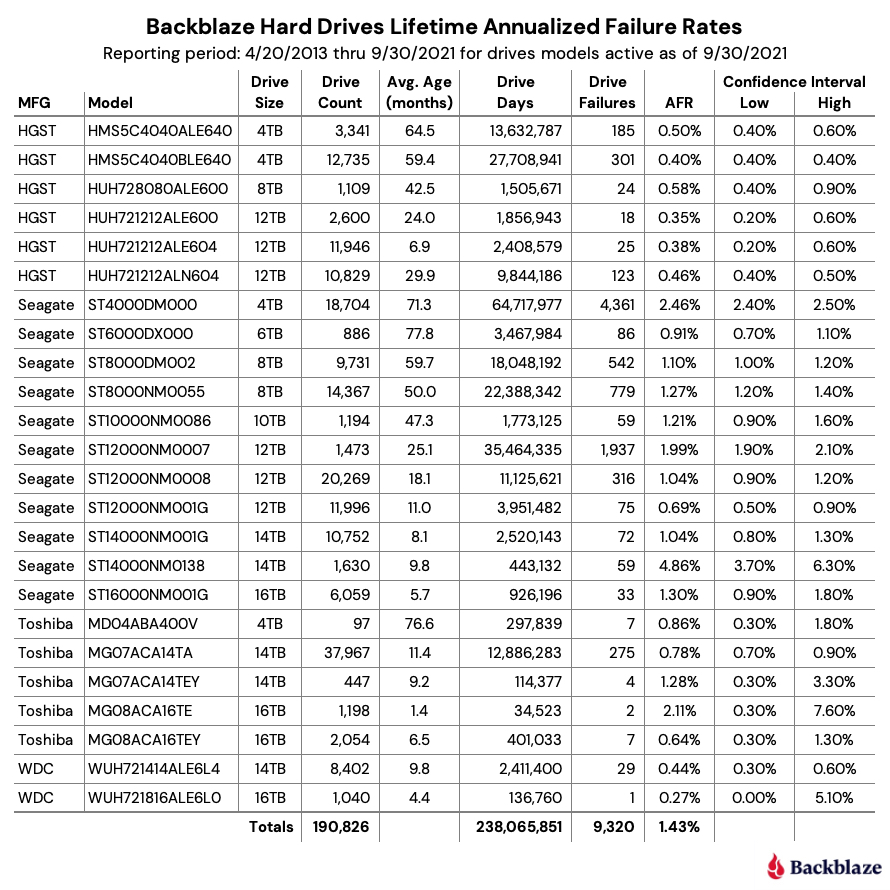
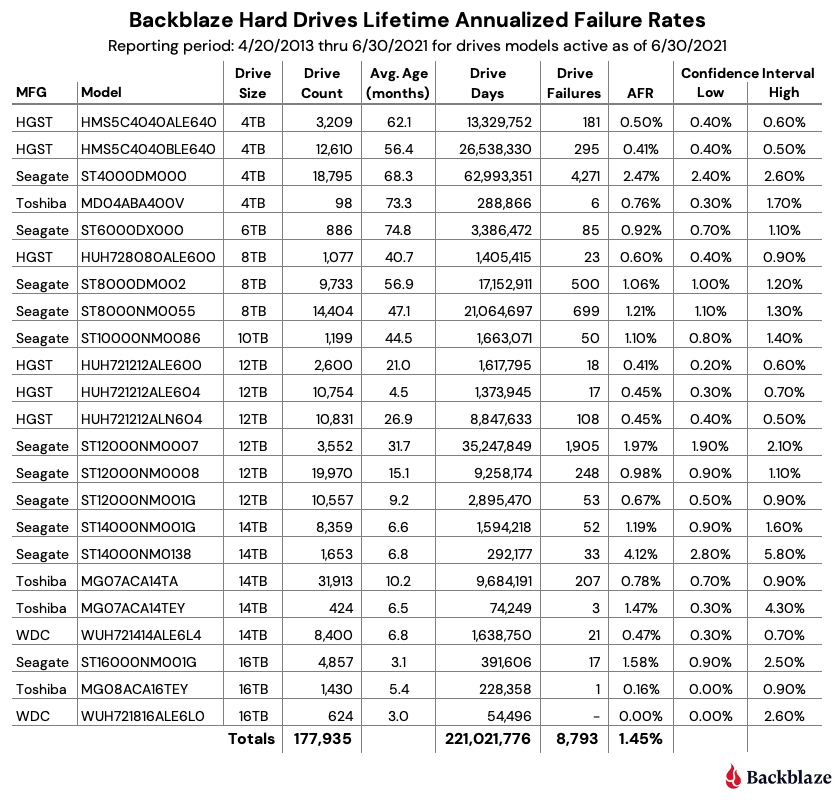
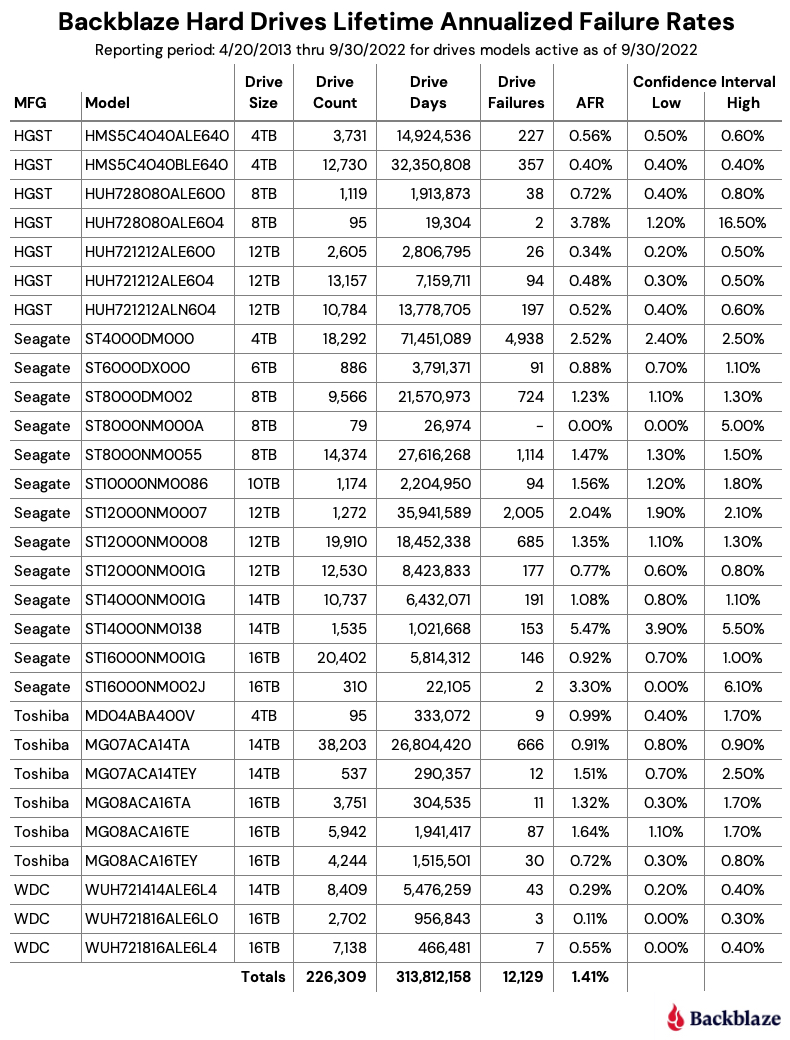
As of September 30, 2022, Backblaze was monitoring 226,697 hard drives used to store data. For our evaluation, we removed 388 drives from consideration as they were used for testing purposes or drive models which did not have at least 60 drives. This leaves us with 226,309 hard drives grouped into 29 different models to analyze for the lifetime report.
Notes and Observations About the Lifetime Stats
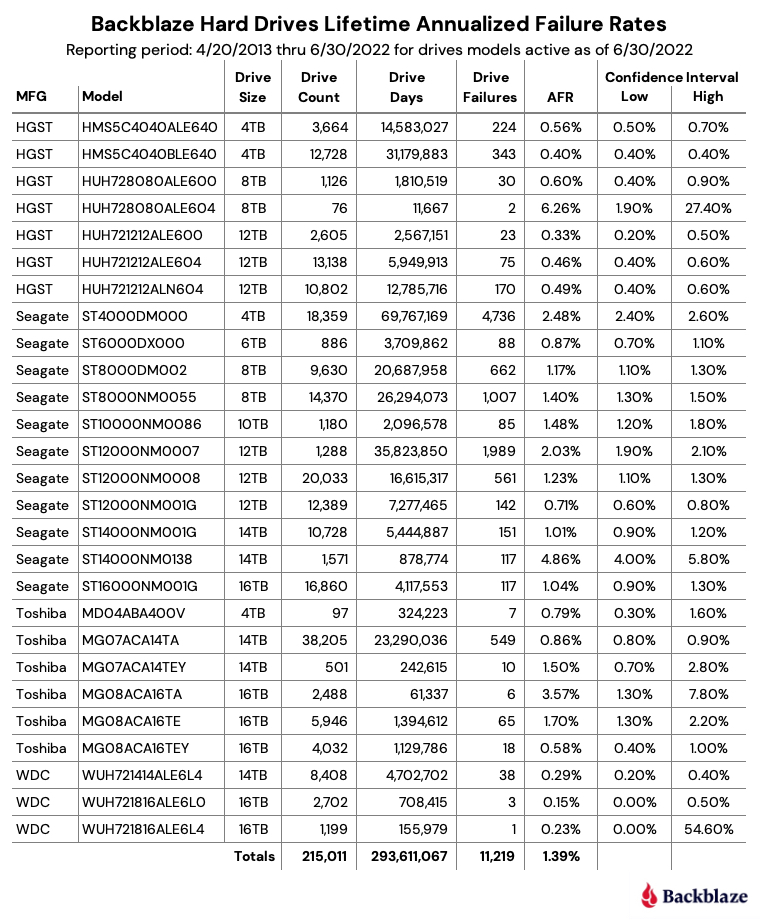
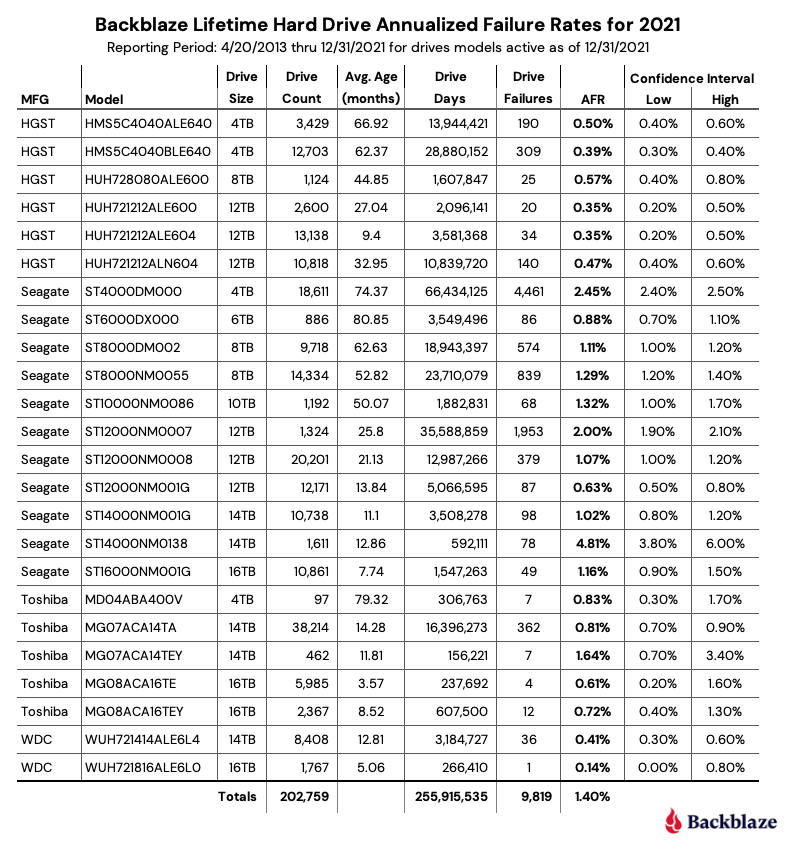
The lifetime annualized failure rate for all the drives listed above is 1.41%. That is a slight increase from the previous quarter of 1.39%, but lower than one year ago (Q3 2021) which was 1.45%.
The usual caution should be applied to those drive models that have wide confidence intervals, one percent or greater. Such a gap indicates there is not enough data or that the data we do have is not readily predictable.
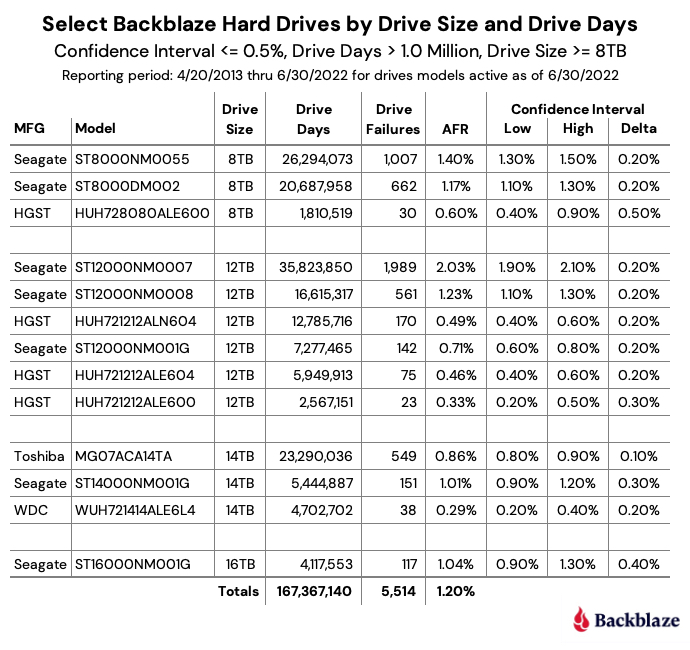
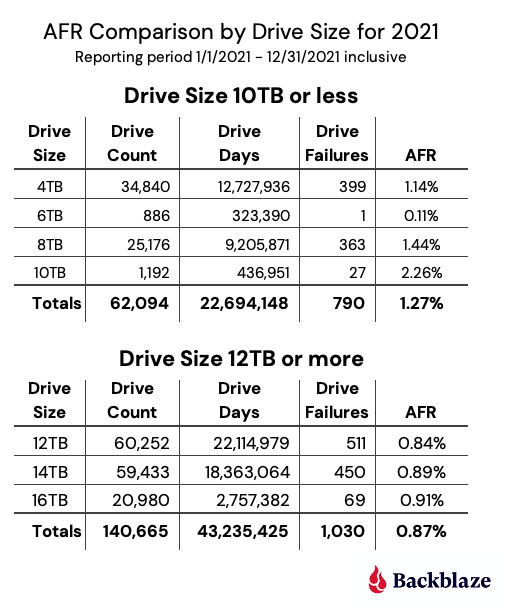
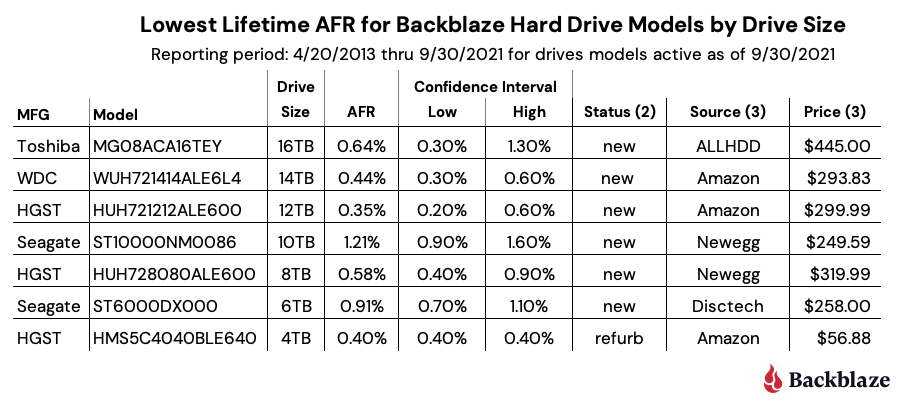
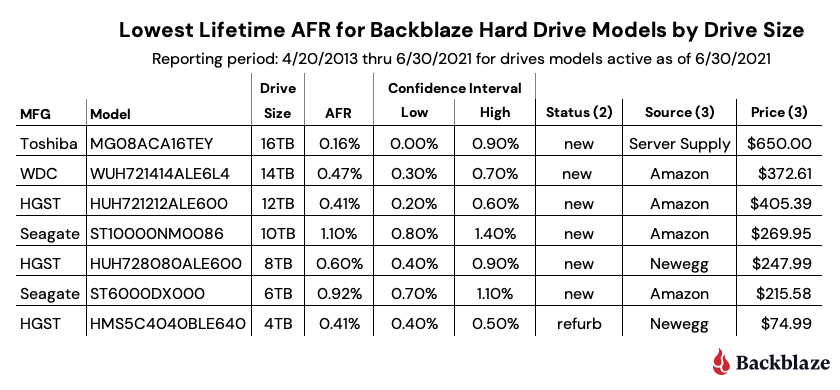
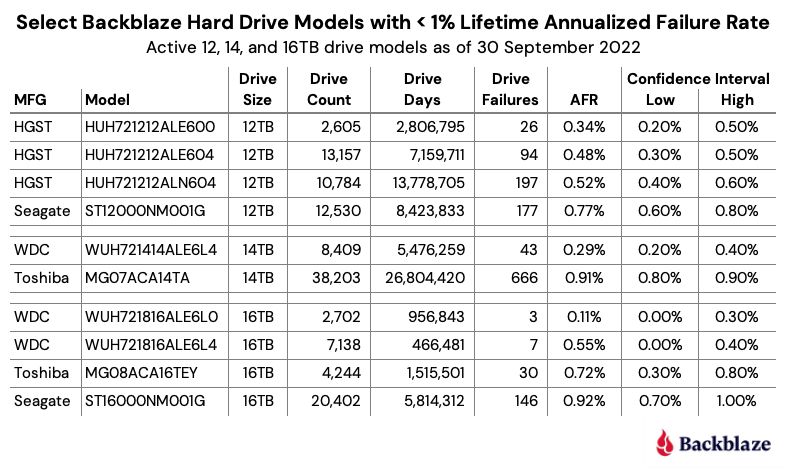
That said, we do have plenty of drive models for which we have solid data. Below we’ve extracted the 12TB, 14TB, and 16TB models from the lifetime table above that have a Lifetime AFR of less than 1% and have a confidence interval of 0.5% or less. These are hard drives which, up to this point, have shown solid reliability in our environment.
The Hard Drive Stats Data
The complete data set used to create the information in this review is available on our Hard Drive Test Data page. You can download and use this data for free for your own purpose. All we ask are three things: 1) you cite Backblaze as the source if you use the data, 2) you accept that you are solely responsible for how you use the data, and 3) you do not sell this data to anyone; it is free.
If you want the tables and charts used in this report, you can download the .zip file from Backblaze B2 Cloud Storage which contains the .jpg and/or .xlsx files as applicable.
Good luck, and let us know if you find anything interesting.
The post Backblaze Drive Stats for Q3 2022 appeared first on Backblaze Blog | Cloud Storage & Cloud Backup.