Post Syndicated from Opeyemi Onikute original https://blog.cloudflare.com/finding-the-grain-of-sand-in-a-heap-of-salt/
How do you find the root cause of a configuration management failure when you have a peak of hundreds of changes in 15 minutes on thousands of servers?
That was the challenge we faced as we built the infrastructure to reduce release delays due to failures of Salt, a configuration management tool. (We eventually reduced such failures on the edge by over 5%, as we’ll explain below.) We’ll explore the fundamentals of Salt, and how it is used at Cloudflare. We then describe the common failure modes and how they delay our ability to release valuable changes to serve our customers.
By first solving an architectural problem, we provided the foundation for self-service mechanisms to find the root cause of Salt failures on servers, datacenters and groups of datacenters. This system is able to correlate failures with git commits, external service failures and ad hoc releases. The result of this has been a reduction in the duration of software release delays, and an overall reduction in toilsome, repetitive triage for SRE.
To start, we will go into the basics of the Cloudflare network and how Salt operates within it. And then we’ll get to how we solved the challenge akin to finding a grain of sand in a heap of Salt.
Configuration management (CM) ensures that a system corresponds to its configuration information, and maintains the integrity and traceability of that information over time. A good configuration management system ensures that a system does not “drift” – i.e. deviate from the desired state. Modern CM systems include detailed descriptions of infrastructure, version control for these descriptions, and other mechanisms to enforce the desired state across different environments. Without CM, administrators must manually configure systems, a process that is error-prone and difficult to reproduce.
Salt is an example of such a CM tool. Designed for high-speed remote execution and configuration management, it uses a simple, scalable model to manage large fleets. As a mature CM tool, it provides consistency, reproducibility, change control, auditability and collaboration across team and organisational boundaries.
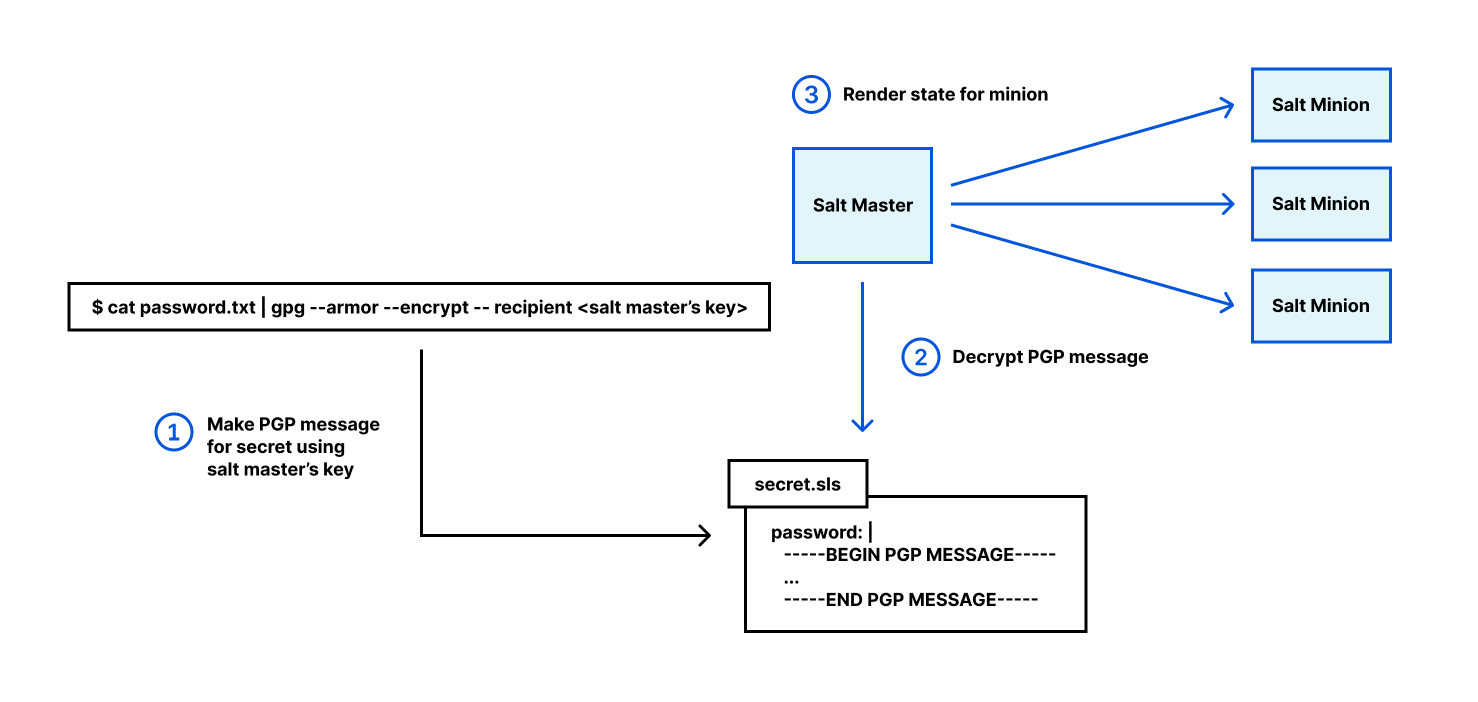
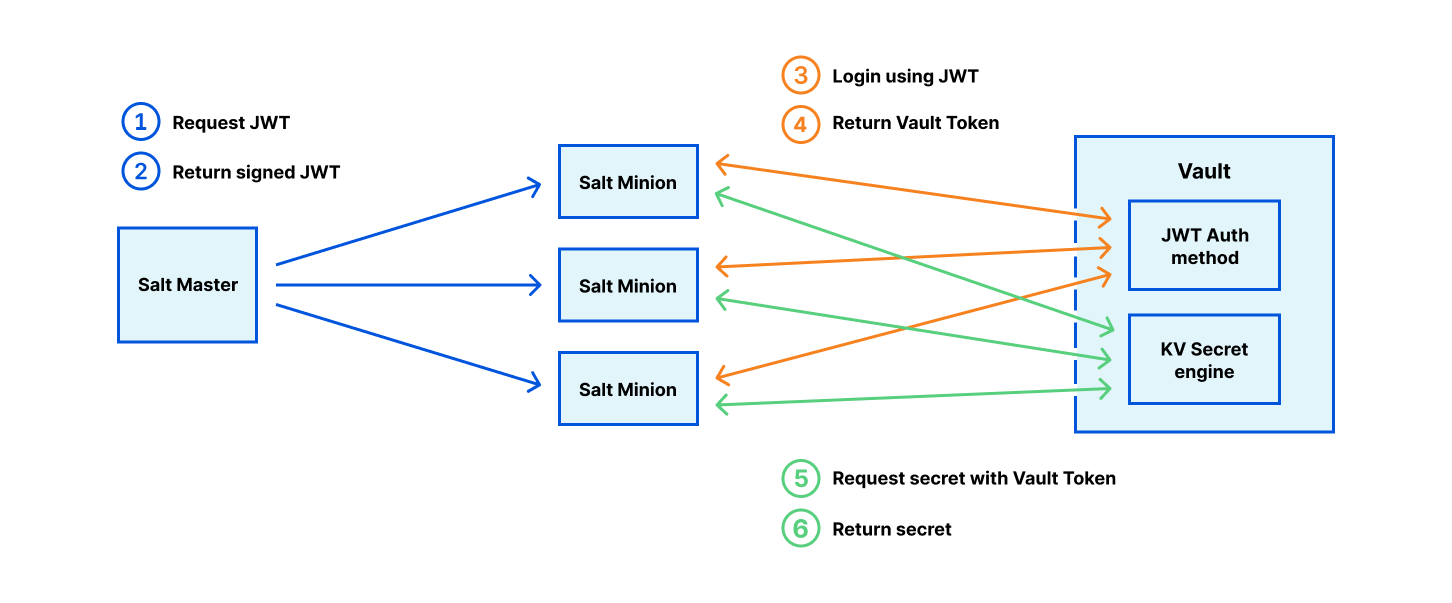
Salt’s design revolves around a master/minion architecture, a message bus built on ZeroMQ, and a declarative state system. (At Cloudflare we generally avoid the terms “master” and “minion.” But we will use them here because that’s how Salt describes its architecture.) The salt master is a central controller that distributes jobs and configuration data. It listens for requests on the message bus and dispatches commands to targeted minions. It also stores state files, pillar data and cache files. The salt minion is a lightweight agent installed on each managed host/server. Each minion maintains a connection to the master via ZeroMQ and subscribes to published jobs. When a job matches the minion, it executes the requested function and returns results.
The diagram below shows a simplification of the Salt architecture described in the docs, for the purpose of this blog post.

The state system provides declarative configuration management. States are often written in YAML and describe a resource (package, file, service, user, etc.) and the desired attributes. A common example is a package state, which ensures that a package is installed at a specified version.
# /srv/salt/webserver/init.sls
include:
  - common

nginx:
  pkg.installed: []

/etc/nginx/nginx.conf:
  file.managed:
    - source: salt://webserver/files/nginx.conf
    - require:
      - pkg: nginx
States can call execution modules, which are Python functions that implement system actions. When applying states, Salt returns a structured result containing whether the state succeeded (result: True/False), a comment, changes made, and duration.
We use Salt to manage our ever-growing fleet of machines, and have previously written about our extensive usage. The master-minion architecture described above allows us to push configuration in the form of states to thousands of servers, which is essential for maintaining our network. We’ve designed our change propagation to involve blast radius protection. With these protections in place, a highstate failure becomes a signal, rather than a customer-impacting event.
This release design was intentional – we decided to “fail safe” instead of failing hard. By further adding guardrails to safely release new code before a feature reaches all users, we are able to propagate a change with confidence that failures will halt the Salt deployment pipeline by default. However, every halt blocks other configuration deployments and requires human intervention to determine the root cause. This can quickly become a toilsome process as the steps are repetitive and bring no enduring value.
Part of our deployment pipeline for Salt changes uses Apt. Every X minutes a commit is merged into the master branch, per Y minutes those merges are bundled and deployed to APT servers. The key file to retrieving Salt Master configuration from that APT server is the APT source file:
# /etc/apt/sources.list.d/saltcodebase.sources
# MANAGED BY SALT -- DO NOT MODIFY

Types: deb
URIs: mirror+file:/etc/apt/mirrorlists/saltcodebase.txt
Suites: stable canary
Components: cloudflare
Signed-By: /etc/apt/keyrings/cloudflare.gpg
This file directs a master to the correct suite for its specific environment. Using that suite, it retrieves the latest package containing the relevant Salt Debian package with the latest changes. It installs that package and begins deploying the included configuration. As it deploys the configuration on machines, the machines report their health using Prometheus. If a version is healthy, it will be progressed into the next environment. Before it can be progressed, a version has to pass a certain soak threshold to allow a version to develop its errors, making more complex issues become apparent. That is the happy case.
The unhappy case brings a myriad of complications: As we do progressive deployments, if a version is broken, any subsequent version is also broken. And because broken versions are continuously overtaken by newer versions, we need to stop deployments altogether. In a broken version scenario, it is crucial to get a fix out as soon as possible. This touches upon the core question of this blog post: What if a broken Salt version is propagated across the environment, we are abandoning deployments, and we need to get a fix out as soon as possible?
While Salt aims for idempotent and predictable configuration, failures can occur during the render, compile, or runtime stages. These failures are commonly due to misconfiguration. Errors in Jinja templates or invalid YAML can cause the render stage to fail. Examples include missing colons, incorrect indentation, or undefined variables. A syntax error is often raised with a stack trace pointing to the offending line.
Another frequent cause of failure is missing pillar or grain data. Since pillar data is compiled on the master, forgetting to update pillar top files or refreshing pillar can result in KeyError exceptions. As a system that maintains order using requisites, misconfigured requisites can lead to states executing out-of-order or being skipped. Failures can also happen when minions are unable to authenticate with the master, or cannot reach the master due to network or firewall issues.
Salt reports errors in several ways. By default, the salt and salt-call commands exit with a retcode 1 when any state fails. Salt also sets internal retcodes for specific cases: 1 for compile errors, 2 when a state returns False, and 5 for pillar compilation errors. Test mode shows what changes would be made without actually executing them, but is useful for catching syntax or ordering issues. Debug logs can be toggled using the -l debug CLI option (salt <minion> state.highstate -l debug).
The state return also includes the details of the individual state failures – the durations, timestamps, functions and results. If we introduce a failure to the file.managed state by referencing a file that doesn’t exist in the Salt fileserver, we see this failure:
web1:
----------
          ID: nginx
    Function: pkg.installed
      Result: True
     Comment: Package nginx is already installed
     Started: 15:32:41.157235
    Duration: 256.138 ms
     Changes:

----------
          ID: /etc/nginx/nginx.conf
    Function: file.managed
      Result: False
     Comment: Source file salt://webserver/files/nginx.conf not found in saltenv 'base'
     Started: 15:32:41.415128
    Duration: 14.581 ms
     Changes:

Summary for web1
------------
Succeeded: 1 (changed=0)
Failed:    1
------------
Total states run:     2
Total run time: 270.719 ms
The return can also be displayed in JSON:
{
  "web1": {
    "pkg_|-nginx_|-nginx_|-installed": {
      "comment": "Package nginx is already installed",
      "name": "nginx",
      "start_time": "15:32:41.157235",
      "result": true,
      "duration": 256.138,
      "changes": {}
    },
    "file_|-/etc/nginx/nginx.conf_|-/etc/nginx/nginx.conf_|-managed": {
      "comment": "Source file salt://webserver/files/nginx.conf not found in saltenv 'base'",
      "name": "/etc/nginx/nginx.conf",
      "start_time": "15:32:41.415128",
      "result": false,
      "duration": 14.581,
      "changes": {}
    }
  }
}
The flexibility of the output format means that humans can parse them in custom scripts. But more importantly, it can also be consumed by more complex, interconnected automation systems. We knew we could easily parse these outputs to attribute the cause of a Salt failure with an input – e.g. a change in source control, an external service failure, or a software release. But something was missing.
Configuration errors are a common cause of failure in large-scale systems. Some of these could even lead to full system outages, which we prevent with our release architecture. When a new release or configuration breaks in production, our SRE team needs to find and fix the root cause to avoid release delays. As we’ve previously noted, this triage is tedious and increasingly difficult due to system complexity.
While some organisations use formal techniques such as automated root cause analysis, most triage is still frustratingly manual. After evaluating the scope of the problem, we decided to adopt an automated approach. This section describes the step-by-step approach to solving this broad, complex problem in production.
When a Salt highstate fails on a minion, SRE teams faced a tedious investigation process: manually SSHing into minions, searching through logs for error messages, tracking down job IDs (JIDs), and locating the job associated with the JID on one of multiple associated masters. This is all while racing against a 4-hour retention window on master logs. The fundamental problem was architectural: Job results live on Salt Masters, not on the minions where they’re executed, forcing operators to guess which master processed their job (SSHing into each one) and limiting visibility for users without master access.
We built a solution that caches job results directly on minions, similar to the local_cache returner that exists for masters. That enables local job retrieval and extended retention periods. This transformed a multistep, time-sensitive investigation into a single query — operators can retrieve job details, automatically extract error context, and trace failures back to specific file changes and commit authors, all from the minion itself. The custom returner filters and manages cache size intelligently, eliminating the “which master?” problem while also enabling automated error attribution, reducing time to resolution, and removing human toil from routine troubleshooting.
By decentralizing job history and making it queryable at the source, we moved significantly closer to a self-service debugging experience where failures are automatically contextualized and attributed, letting SRE teams focus on fixes rather than forensics.
Once job information was available on the minion, we no longer needed to resolve which master triggered the job that failed. The next step was to write a Salt execution module that would allow an external service to query for job information, and more specifically failed job information, without needing to know Salt internals. This led us to write a module called Salt Blame. Cloudflare prides itself on its blameless culture, our software on the other hand…
The blame module is responsible for pulling together three things:
-
Local job history information
-
CM inputs (latest commit present during the job)
-
Git repo commit history
We chose to write an execution module for simplicity, decoupling external automation from the need to understand Salt internals, and potential usage by operators for further troubleshooting. Writing execution modules is already well established within operational teams and adheres to well-defined best practices such as unit tests, linting and extensive peer-review.
The module is understandably very simple. It iterates in reverse chronological order through the jobs in the local cache and looks for the first job failure chronologically, and then the successful job immediately prior to it. This is for no other reason than narrowing down the true first failure and giving us before and after state results. At this stage, we have several avenues to present context to the caller: To find possible commit culprits, we look through all commits between the last successful Job ID and the failure to determine if any of these changed files relevant to the failure. We also provided the list of failed states and their outputs as another avenue to spot the root cause. We’ve learned that this flexibility is important to cover the wide range of failure possibilities.
We also make a distinction between normal failed states, and compile errors. As described in the Salt docs, each job returns different retcodes based on the outcome.
-
Compile Error: 1 is set when any error is encountered in the state compiler.
-
Failed State: 2 is set when any state returns a
Falseresult.
Most of our failures manifest as failed states as a result of a change in source control. An engineer building a new feature for our customers may unintentionally introduce a failure that was uncaught by our CI and Salt Master tests. In the first iteration of the module, listing all the failed states was sufficient to pinpoint the root cause of a highstate failure.
However, we noticed that we had a blind spot. Compile errors do not result in a failed state, since no state runs. Since these errors returned a different retcode from what we checked for, the module was completely blind to them. Most compile errors happen when a Salt service dependency fails during the state compile phase. They can also happen as a result of a change in source control, although that is rare.
With both state failures and compile errors accounted for, we drastically improved our ability to pinpoint issues. We released the module to SREs who immediately realised the benefits of faster Salt triage.
# List all the recent failed states
minion~$ salt-call -l info blame.last_failed_states
local:
    |_
      ----------
      __id__:
          /etc/nginx/nginx.conf
      __run_num__:
          5221
      __sls__:
          foo
      changes:
          ----------
      comment:
          Source file salt://webserver/files/nginx.conf not found in saltenv 'base'
      duration:
          367.233
      finish_time_stamp:
          2025-10-22T10:00:17.289897+00:00
      fun:
          file.managed
      name:
          /etc/nginx/nginx.conf
      result:
          False
      start_time:
          10:00:16.922664
      start_time_stamp:
          2025-10-22T10:00:16.922664+00:00

# List all the commits that correlate with a failed state
minion~$ salt-call -l info blame.last_highstate_failure
local:
    ----------
    commits:
        |_
          ----------
          author_email:
              [email protected]
          author_name:
              John Doe
          commit_datetime:
              2025-06-30T15:29:26.000+00:00
          commit_id:
              e4a91b2c9f7d3b6f84d12a9f0e62a58c3c7d9b5a
          path:
              /srv/salt/webserver/init.sls
    message:
        reviewed 5 change(s) over 12 commit(s) looking for 1 state failure(s)
    result:
        True

# List all the compile errors
minion~$ salt-call -l info blame.last_compile_errors
local:
    |_
      ----------
      error_types:
      job_timestamp:
          2025-10-24T21:55:54.595412+00:00
      message: A service failure has occured
      state: foo
      traceback:
          Full stack trace of the failure
urls: http://url-matching-external-service-if-foundFaster triage is always a welcome development, and engineers were comfortable running local commands on minions to triage Salt failures. But in a busy shift, time is of the essence. When failures spanned across multiple datacenters or machines, it easily became cumbersome to run commands across all these minions. This solution also required context-switches between multiple nodes and datacenters. We needed a way to aggregate common failure types using a single command – single minions, pre-production datacenters and production datacenters.
We implemented several mechanisms to simplify triage and eliminate manual triggers. We aimed to get this tooling as close to the triage location as possible, which is often chat. With three distinct commands, engineers were now able to triage Salt failures right from chat threads.
With a hierarchical approach, we made individual triage possible for minions, data centers and groups of data centers. A hierarchy makes this architecture fully extensible, flexible and self-organising. An engineer is able to triage a failure on one minion, and at the same time the entire data center as needed.

The ability to triage multiple data centers at the same time became immediately useful for tracking the root cause of failures in pre-production data centers. These failures delay the propagation of changes to other data centers, and hinder our ability to release changes for customer features, bug fixes or incident remediation. The addition of this triage option has cut down the time to debug and remediate Salt failures by over 5%, allowing us to consistently release important changes for our customers.
While 5% does not immediately look like a drastic improvement, the magic is in the cumulative effect. We won’t release actual figures of the amount of time releases are delayed for, but we can do a simple thought experiment. If the average amount of time spent is even just 60 minutes per day, a reduction by 5% saves us 90 minutes (one hour 30 minutes) per month.
Another indirect benefit lies in more efficient feedback loops. Since engineers spend less time fiddling with complex configurations, that energy is diverted towards preventing reoccurrence, further reducing the overall time by an immeasurable amount. Our future plans include measurement and data analytics to understand the outcomes of these direct and indirect feedback loops.
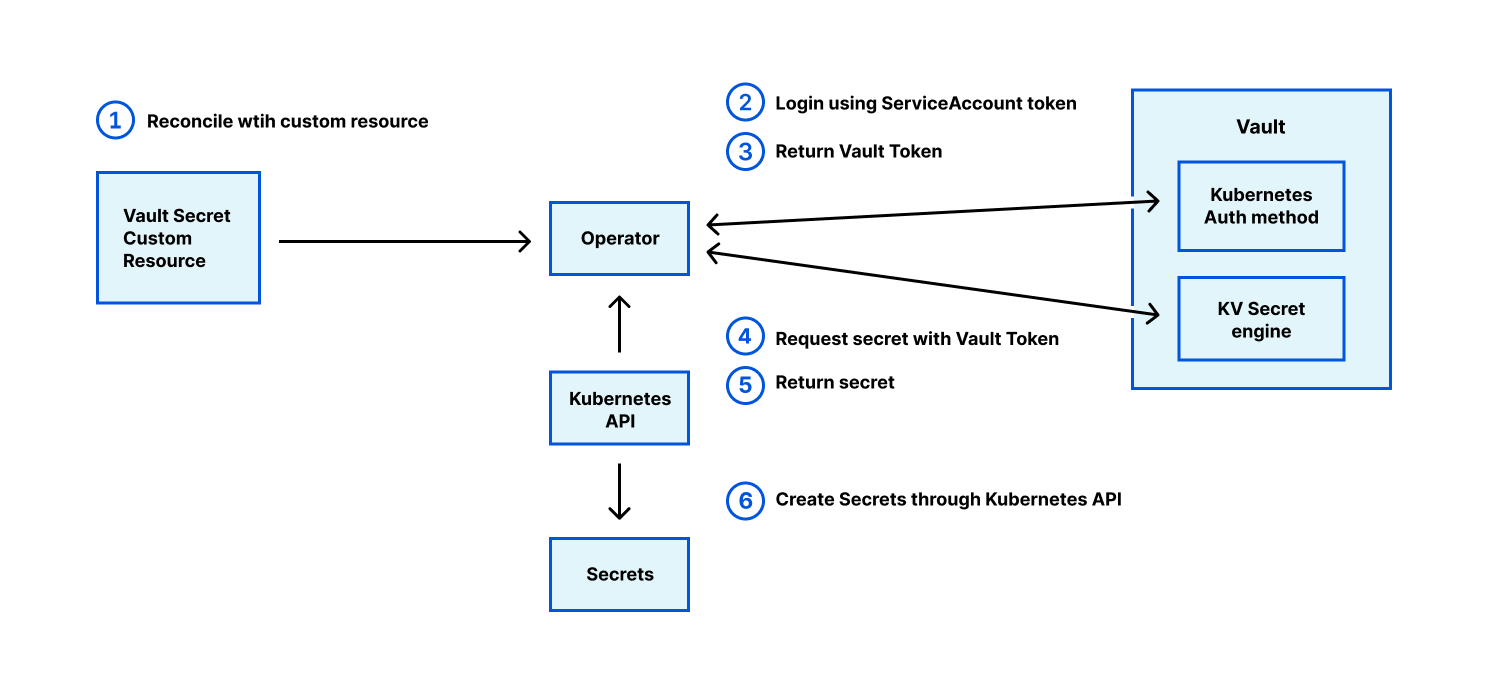
The image below shows an example of pre-production triage output. We are able to correlate failures with git commits, releases, and external service failures. During a busy shift, this information is invaluable for quickly fixing breakage. On average, each minion “blame” takes less than 30 seconds, while multiple data centers are able to return a result in a minute or less.

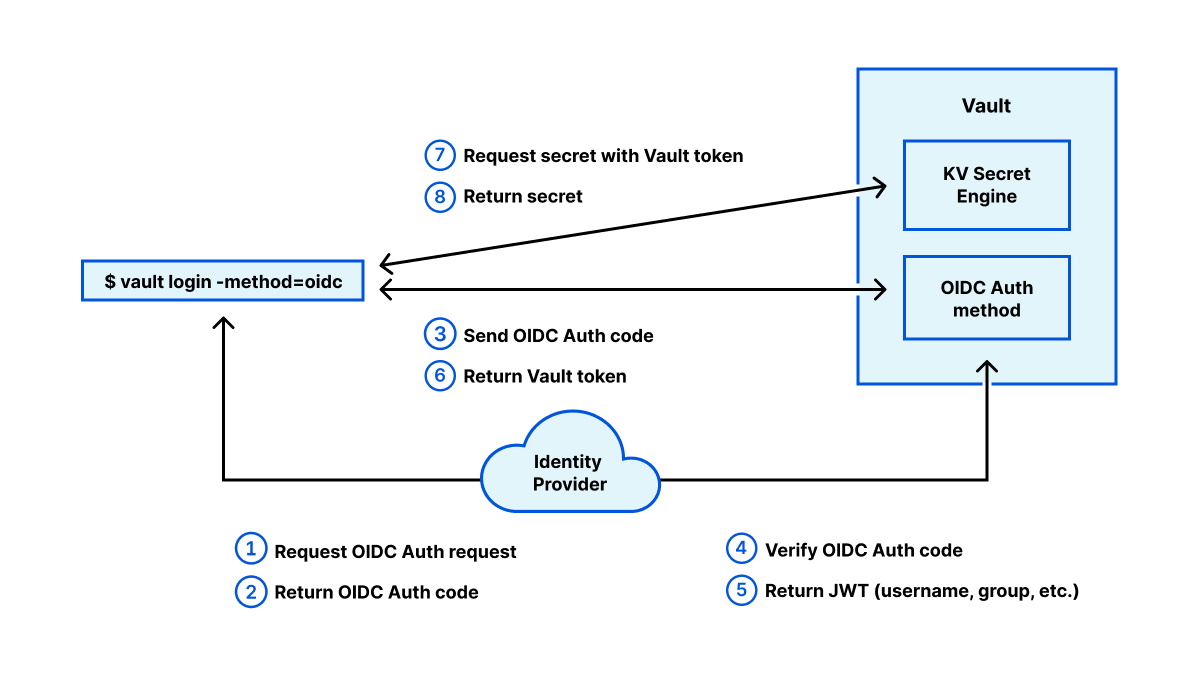
The image below describes the hierarchical model. Each step in the hierarchy is executed in parallel, allowing us to achieve blazing fast results.

With these mechanisms available, we further cut down triage time by triggering the triage automation on known conditions, especially those with impact to the release pipeline. This directly improved the velocity of changes to the edge since it took less time to find a root cause and fix-forward or revert.
After we got blazing fast Salt triage, we needed a way to measure the root causes. While individual root causes are not immediately valuable, historical analysis was deemed important. We wanted to understand the common causes of failure, especially as they hinder our ability to deliver value to customers. This knowledge creates a feedback loop that can be used to keep the number of failures low.

Using Prometheus and Grafana, we track the top causes of failure: git commits, releases, external service failures and unattributed failed states. The list of failed states is particularly useful because we want to know repeat offenders and drive better adoption of stable releasing practices. We are also particularly interested in root causes — a spike in the number of failures due to git commits indicates a need to adopt better coding practices and linting, a spike in external service failures indicates a regression in an internal system to be investigated, and a spike in release-based failures indicates a need for better gating and release-shepherding.
We analyse these metrics on a monthly cycle, providing feedback mechanisms through internal tickets and escalations. While the immediate impact of these efforts is not yet visible as the efforts are nascent, we expect to improve the overall health of our Saltstack infrastructure and release process by reducing the amount of breakage we see.
Much of operational work is often seen as a “necessary evil”. Humans in ops are conditioned to intervene when failures happen and remediate them. This cycle of alert-response is necessary to keep the infrastructure running, but it often leads to toil. We have discussed the effect of toil in a previous blog post.
This work represents another step in the right direction – removing more toil for our on-call SREs, and freeing up valuable time to work on novel issues. We hope that this encourages other operations engineers to share the progress they are making towards reducing overall toil in their organizations. We also hope that this sort of work can be adopted within Saltstack itself, although the lack of homogeneity in production systems across several companies makes it unlikely.
In the future, we plan to improve the accuracy of detection and rely less on external correlation of inputs to determine the root cause of failed outcomes. We will investigate how to move more of this logic into our native Saltstack modules, further streamlining the process and avoiding regressions as external systems drift.
If this sort of work is exciting to you, we encourage you to take a look at our careers page.