Post Syndicated from Ahmed Bakry original https://aws.amazon.com/blogs/security/how-to-set-up-least-privilege-access-to-your-encrypted-amazon-sqs-queue/
Amazon Simple Queue Service (Amazon SQS) is a fully-managed message queueing service that enables you to decouple and scale microservices, distributed systems, and serverless applications. Amazon SQS provides authentication mechanisms so that you can control who has access to the queue. It also provides encryption in transit with HTTP over SSL or TLS, and it supports server-side encryption using AWS Key Management Service (AWS KMS) to help protect the data passing through Amazon SQS. These controls allow you to use Amazon SQS to exchange sensitive data between applications. With the integration of Amazon SQS and AWS KMS, you can centrally-manage the keys that protect Amazon SQS, as well as the keys that protect your other AWS resources.
AWS services, such as Amazon Simple Storage Service (Amazon S3) and Amazon Simple Notification Service (Amazon SNS), can act as event sources that send events to Amazon SQS. To enable an event source to access an encrypted SQS queue, you will need to configure the queue with a customer managed key in AWS KMS, and then use the key policy to allow the event source to use the required AWS KMS API methods. The event source also requires permissions to authenticate access to the queue to send events. You can achieve this by using an SQS policy, which is a resource-based policy that you can use to control access to the SQS queue and its data.
In this blog post, we will show you how to control access to your encrypted SQS queue through the key policy and the SQS policy. The policies introduced in this post will guide you towards achieving least privilege. We will also describe how the resource-based policies defined in this post address the confused deputy problem by using the aws:SourceArn, aws:SourceAccount, and aws:PrincipalOrgID global AWS Identity and Access Management (IAM) condition context keys.
Solution overview
In this post, we will walk you through a common use case to illustrate how you can build the key policy and the SQS queue policy. This use case is shown in Figure 1.
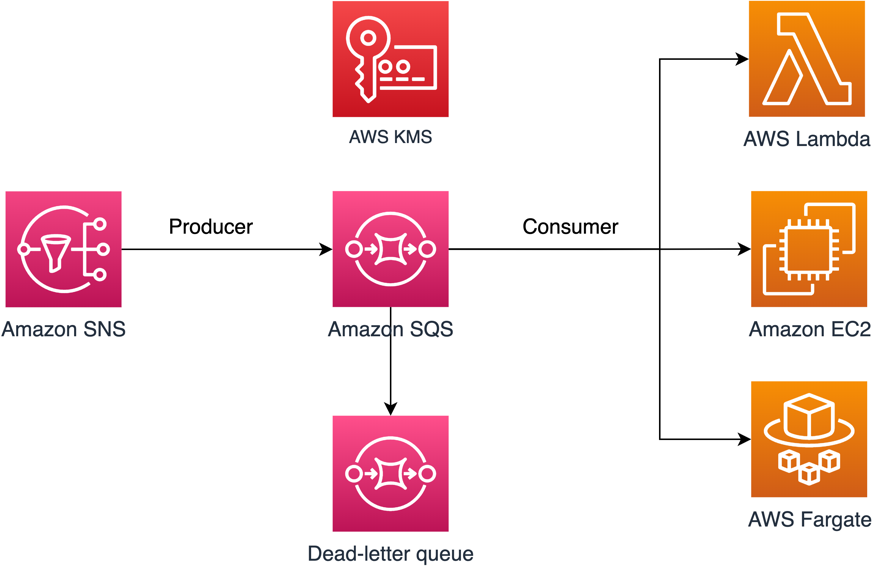
Figure 1: Architecture to publish Amazon SNS messages to Amazon SQS
As shown in Figure 1, the solution has the following steps:
- The message producer is an Amazon SNS topic. The topic is configured to send messages to an encrypted Amazon SQS queue. The queue is encrypted by using an AWS KMS customer-managed key.
- The message consumer is a compute service such as an AWS Lambda function, an Amazon Elastic Compute Cloud (Amazon EC2) instance, or an AWS Fargate container. The message consumer is configured to process messages from the queue.
- The SQS queue is configured to send failed messages to a dead-letter queue (DLQ). This can help you debug your application or messaging system because DLQs let you isolate unconsumed messages to determine why their processing didn’t succeed.
Note: If the message consumer is located in an Amazon Virtual Private Cloud (Amazon VPC) and you need to restrict message reception to that specific VPC, then you should attach the DenyReceivingIfNotThroughVPCE policy statement to your SQS queue policy.
The SQS policy defined in this post doesn’t support redriving messages directly to the same or a different SQS queue.
Prerequisites
This post contains only the required IAM permissions in the form of policy statements. To construct the policy, you need to add the statements to your SQS policy or your AWS KMS key policy. This post doesn’t walk you through how to create the SQS queue or the AWS KMS key. Therefore, to use the policies included in this post, make sure that you’ve completed the following prerequisites:
- Set up an SQS queue. For instructions, see Create a queue (console) in the Amazon SQS documentation.
- Create an AWS KMS key. For instructions, see Creating keys in the AWS KMS documentation.
Least-privilege key policy for Amazon SQS
In this section, we describe the required least-privilege permissions in AWS KMS for the customer-managed key that you use to encrypt your SQS queue. With these permissions, you can limit access to only the intended entities while implementing least privilege. The key policy must consist of the following policy statements, which we describe in detail below:
- Grant administrator permissions to the KMS key
- Grant read-only access to the key metadata
- Grant AWS KMS permissions to Amazon SNS to publish messages to the queue
- Allow consumers to decrypt messages from the queue
Grant administrator permissions to the KMS key
To create an AWS KMS key, you need to provide AWS KMS administrator permissions to the IAM role that you use to deploy the KMS key. These administrator permissions are defined in the AllowKeyAdminPermissions policy statement that follows. When you add this statement to your key policy, make sure to replace <admin-role ARN> with the Amazon Resource Name (ARN) of the IAM role used to deploy the KMS key, manage the KMS key, or both. This can be the IAM role of your deployment pipeline or the administrator role for your organization in AWS Organizations.
Note: In a key policy, the value of the Resource element needs to be “*”, which means “this KMS key”. The asterisk (“*”) identifies the KMS key to which the key policy is attached.
Grant read-only access to the key metadata
To grant other IAM roles read-only access to your key metadata, add the following AllowReadAccessToKeyMetaData statement to your key policy. This statement allows you, for example, to list the KMS keys in your account for auditing purposes. The statement grants the AWS account root user read-only access to the key metadata. Therefore, an IAM principal in the account can have access to the key metadata when their identity-based policies have the following permissions listed in the statement: kms:Describe*, kms:Get*, and kms:List*. Make sure to replace <account-ID> with your own information.
Grant AWS KMS permissions to Amazon SNS to publish messages to the queue
To allow your SNS topic to publish messages to your encrypted SQS queue, add the following AllowSNSToSendToSQS policy statement to your key policy. This statement grants Amazon SNS permissions to use the KMS key to publish to your SQS queue. Make sure to replace <account-id> with your own information.
Note: The Condition element limits access to the SNS service in the same AWS account where the SNS topic exists.
Allow consumers to decrypt messages from the queue
The following AllowConsumersToReceiveFromTheQueue statement grants the SQS message consumer the required permissions to decrypt messages received from the encrypted SQS queue. When you attach the policy statement, replace <consumer’s runtime role ARN> with the ARN for the IAM runtime role of the message consumer.
Least-privilege Amazon SQS policy
In this section, we will walk you through least-privilege SQS queue policies to help you send Amazon SNS messages to Amazon SQS. The defined policy is designed to prevent unintended access by using a mix of both allow and deny statements. The allow statements grant access to the intended entity or entities. The deny statements prevent other unintended entities from accessing the SQS queue, while excluding the intended entity within the policy condition. The SQS policy includes the following statements, which we describe in detail below:
- Restrict Amazon SQS management permissions
- Restrict SQS queue actions from the specified organization
- Grant SQS permissions to consumers
- Enforce encryption in transit
- Restrict message transmission to a specific SNS topic
- (Optional) Restrict message reception to a specific VPC endpoint
Restrict Amazon SQS management permissions
The following RestrictAdminQueueActions policy statement restricts the Amazon SQS management permissions to only the IAM role or roles that you use to deploy the queue, manage the queue, or both.
Make sure to replace the <placeholder values> with your own information. Specify the ARN of the IAM role used to deploy the SQS queue, as well as the ARNs of each administrator role that should have SQS management permissions. For the Resource element, you can specify either “*” or the ARN of the SQS queue.
Restrict SQS queue actions from the specified organization
To help protect your Amazon SQS resources from external access (that is, access by an entity outside your AWS Organizations organization), use the following statement. The statement limits SQS queue access to the organization that you specify in the Condition element. Make sure to replace <org-id> with your organization ID. For the Resource element, you can specify either “*” or the ARN of the SQS queue.
Grant SQS permissions to consumers
To receive messages from the SQS queue, you need to provide the message consumer with the necessary permissions. The following policy statement grants the consumer, which you specify, the required permissions to consume messages from the SQS queue. When adding the statement to your SQS policy, make sure to replace <consumer’s IAM runtime role ARN> with the ARN of the IAM runtime role used by the consumer. For the Resource element, you can specify either “*” or the ARN of the SQS queue.
To prevent other entities from receiving messages from the SQS queue, add the following DenyOtherConsumersFromReceiving statement to the SQS queue policy. This statement restricts message consumption to the consumer that you specify—allowing no other consumer to have access, even when their identity permissions would grant them access. Make sure to replace <consumer’s runtime role ARN> with your own information. For the Resource element, you can specify either “*” or the ARN of the SQS queue.
Enforce encryption in transit
The following DenyUnsecureTransport policy statement enforces the consumers and producers to use secure channels (TLS connections) to send and receive messages to and from the SQS queue. For the Resource element, you can specify either “*” or the ARN of the SQS queue.
Restrict message transmission to a specific SNS topic
The following AllowSNSToSendToTheQueue policy statement allows the specified SNS topic to send messages to the SQS queue. Make sure to replace <SNS topic ARN> with the SNS topic ARN. For the Resource element, you can specify either “*” or the ARN of the SQS queue.
The following DenyAllProducersExceptSNSFromSending policy statement prevents other producers from sending messages to the queue. Replace <SNS topic ARN> with your own information. For the Resource element, you can specify either “*” or the ARN of the SQS queue.
(Optional) Restrict message reception to a specific VPC endpoint
To restrict the receipt of messages to only a specific VPC endpoint, add the following DenyReceivingIfNotThroughVPCE policy statement to your SQS queue policy. This statement prevents a message consumer from receiving messages from the queue unless the messages are from the desired VPC endpoint. Replace <vpce_id> with the ID of the VPC endpoint that you created for your SQS queue. For the Resource element, you can specify either “*” or the ARN of the SQS queue.
SQS policy statements for the dead-letter queue
In this section, we will walk you through how to manage access to your SQS queue when you are using it as a dead-letter queue (DLQ) for another SQS queue.
Add policy statements to your DLQ access policy
Add the following policy statements, identified by their statement ID, to your DLQ access policy. These are the same policy statements introduced earlier in this post.
- RestrictAdminQueueActions
- DenyQueueActionsOutsideOrg
- AllowConsumersToReceiveFromTheQueue
- DenyOtherConsumersFromReceiving
- DenyUnsecureTransport
In addition to adding the preceding policy statements to your DLQ access policy, you should add a statement to restrict message transmission to SQS queues, which we describe in the next section.
Restrict message transmission to SQS queues
To restrict access to only SQS queues from the same account, add the following DenyAnyProducersExceptSQS policy statement to the DLQ access policy. This statement doesn’t limit message transmission to a specific queue because you need to deploy the DLQ before you create the main queue, so you won’t know the SQS queue ARN when you create the DLQ. If you need to limit access to only one SQS queue, modify the aws:SourceArn in the Condition element with the ARN of your SQS source queue when you know it.
Important: The SQS queue policies defined in this post don’t restrict the sqs:PurgeQueue action to a certain IAM role or roles. The sqs:PurgeQueue action enables you to delete all messages in the SQS queue. You can also use this action to make changes to the message format without replacing the SQS queue. When debugging an application, you can clear the SQS queue to remove potentially erroneous messages. When testing the application, you can drive a high message volume through the SQS queue and then purge the queue to start fresh before entering production. The reason for not restricting this action to a certain role is that this role might not be known when deploying the SQS queue. You will need to add this permission to the role’s identity-based policy to be able to purge the queue.
Prevent the cross-service confused deputy problem
The confused deputy problem is a security issue where an entity that doesn’t have permission to perform an action can coerce a more privileged entity to perform the action. To help prevent this problem, AWS provides tools that help you protect your account if you provide third parties (known as cross-account) or other AWS services (known as cross-service) access to resources in your account. The policy statements in this post can help you prevent the cross-service confused deputy problem.
Cross-service impersonation can occur when one service (the calling service) calls another service (the called service). The calling service can be manipulated to use its permissions to act on another customer’s resources in a way it shouldn’t otherwise have permission to access. To help protect against this issue, the resource-based policies defined in this post use the aws:SourceArn, aws:SourceAccount, and aws:PrincipalOrgID global IAM condition context keys. These limit the permissions that a service has to a specific resource, a specific account, or a specific organization in AWS Organizations.
For example, the following AllowS3ToSendToTheQueue policy statement allows Amazon S3 to deliver messages to your Amazon SQS queue; the aws:SourceArn condition in this policy grants access to a specific S3 bucket only.
If a bad actor creates an S3 bucket to try to deliver messages to your Amazon SQS queue, the source ARN will not match that of the S3 bucket specified in this policy, so the policy will deny access. Without the aws:SourceArn condition, the unauthorized S3 bucket would be granted access unintentionally because any S3 bucket would be granted to deliver messages to our queue through the S3 service principal. Adding the aws:SourceArn condition prevents cross-service impersonation.
Use IAM Access Analyzer to review cross-account access
You can use IAM Access Analyzer to review your SQS queue policies and AWS KMS key policies and alert you when an SQS queue or a KMS key grants access to an external entity. IAM Access Analyzer helps identify resources in your organization and accounts that are shared with an entity outside the zone of trust. This zone of trust can be either an AWS account or the organization within AWS Organizations that you specify when you enable IAM Access Analyzer.
IAM Access Analyzer also helps identify resources shared with external principals by using logic-based reasoning to analyze the resource-based policies in your AWS environment. For each instance of a resource shared outside of your zone of trust, IAM Access Analyzer generates a finding. Figure 2 shows an IAM Access Analyzer finding, in which a sqs:SendMessage API call was made to our SQS queue from an account that is outside of our zone of trust.

Figure 2: IAM Access Analyzer example finding for an Amazon SQS queue
Findings include information about the access and the external principal granted to it. To determine whether the access is intended and safe, or unintended and a security risk, review the findings. For unintended access, review the affected policy and modify it by using the policy statements introduced in this blog post to further restrict access. For more information on how IAM Access Analyzer identifies unintended access to your AWS resources, see the blog post Identify Unintended Resource Access with IAM Access Analyzer.
Conclusion
In this post, you learned how to manage access to your encrypted Amazon SQS queue to help you achieve least privilege. We presented an SQS queue policy and an AWS KMS key policy so that you can use Amazon SQS to receive messages from an SNS topic. We addressed the confused deputy problem, specifying the exact source allowed to emit events. You also learned how to use IAM Access Analyzer to review the external access provided by your existing SQS queue policies and key policies.
You can follow the instructions in this post to resolve findings based on your SQS use case. You can also use the provided policies for newly created SQS queues and their KMS keys, or to modify existing queues (for example, to address IAM Access Analyzer findings). For more use cases, see the AWS SQS documentation.
If you have feedback about this post, submit comments in the Comments section below. If you have questions about this post, start a new thread on the Amazon Simple Queue Service re:Post or contact AWS Support.
Want more AWS Security news? Follow us on Twitter.