Customers building event-driven applications on AWS rely on Amazon Simple Queue Service (Amazon SQS) and AWS Lambdaevent source mappings (ESMs) to process millions of events every day. The fully managed polling infrastructure of ESMs eliminates the need to write and maintain custom code. You can focus on business logic while Lambda handles scaling, batching, and error handling automatically.
As workloads grow, many customers need to meet demanding requirements for low-latency message processing, high-concurrency execution, and high-throughput event processing. Use cases such as real-time payment processing, fraud detection, IoT telemetry pipelines, and flash-sale order fulfillment require the ESM to scale rapidly and sustain peak performance without queue backlog.
To address these needs, AWS launched provisioned mode for SQS event source mappings. Provisioned mode gives you direct control over the number of event pollers assigned to your ESM for predictable and rapid scaling. With Provisioned mode, you can configure event pollers up to 10,000, supporting concurrency of up to 100,000 concurrent Lambda executions and throughput of 10 GB/s. You can process up to a million events per second.
When you configure an SQS queue as an event source for a Lambda function, Lambda automatically creates an ESM resource. The ESM manages a fleet of internal event pollers that continuously poll the SQS queue, retrieve messages, and invoke your Lambda function with batches of events.
In default ESM mode, Lambda automatically manages the number of event pollers based on queue depth and processing throughput. The system starts with five pollers and scales up as the queue backlog builds, supporting up to 1,250 concurrent invocations. This automatic scaling works well for the majority of event processing workloads. However, the scale-up rate in default mode (approximately 300 additional concurrent executions per minute) can leave latency-sensitive workloads with growing queue backlogs during sudden traffic spikes.
What is provisioned mode?
Provisioned mode gives you explicit control over the minimum and maximum number of event pollers assigned to your ESM. Instead of relying solely on automatic scaling, you define:
MinimumPollers: the number of event pollers always active and ready to process messages (range: 2–200).
MaximumPollers: the upper bound on event pollers the ESM can scale to (range: 2–10,000).
These pollers remain active and continuously poll your SQS queue, eliminating cold-start delays in the polling infrastructure. When traffic spikes arrive, your ESM already has capacity allocated to handle the burst.
To see the performance profile with provisioned mode for SQS, deploy a Lambda function that has an SQS queue as its trigger. Use the reference pattern on Serverless Land or follow the Creating and configuring an Amazon SQS event source mapping guide to configure provisioned mode for your SQS event source mapping. In the following scenarios, a producer writes 40 million messages, each with a 1 KB payload size, to an SQS queue. Batch size is set to 10, with function duration at about 200 ms.
Scenario 1: Baseline (default mode)
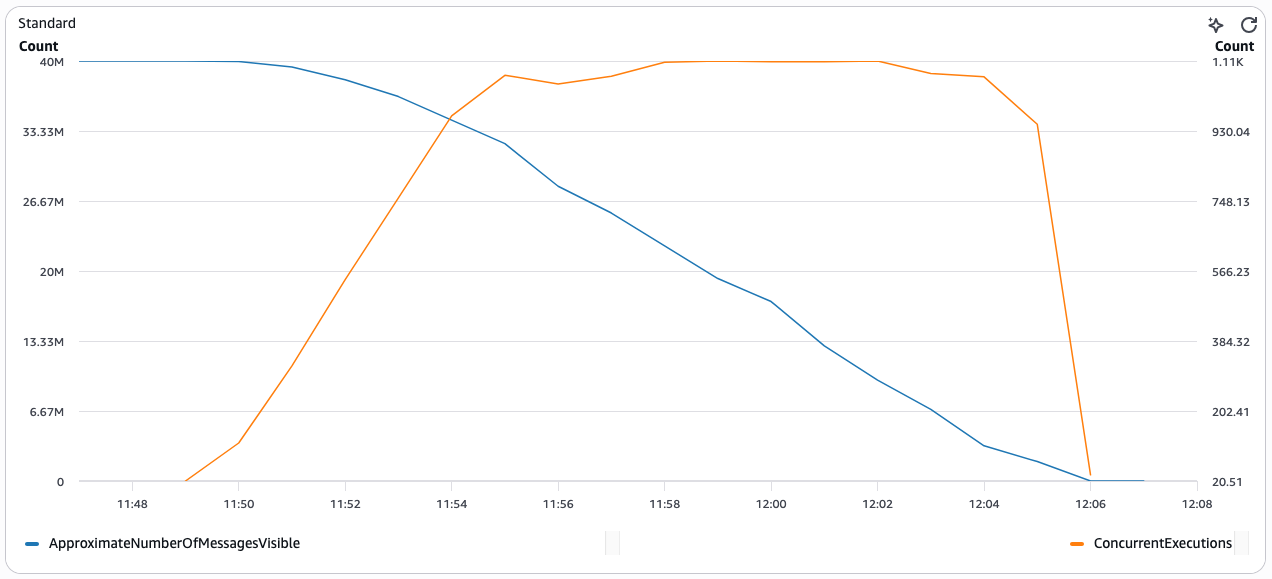
The following chart shows the relationship between ApproximateNumberOfMessagesVisible (blue) and ConcurrentExecutions (orange) over time for the baseline scenario using default mode with no provisioned pollers. With provisioned mode disabled, Lambda takes approximately 17 minutes to drain the backlog of 40 million messages. It takes about 6 minutes to reach the maximum concurrent executions.
Scenario 2: Configuring minimum event pollers and auto-scaling
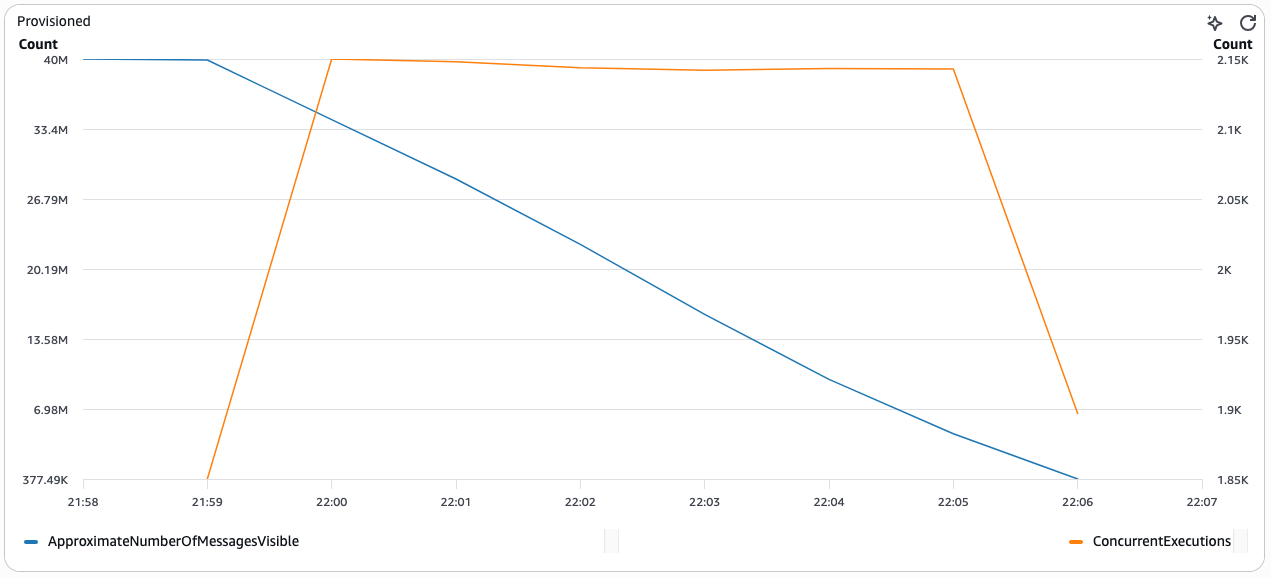
To optimize the ESM throughput for these kinds of workloads and reduce the time to drain the message backlog, set the minimum event pollers to a higher than default value. In this scenario, the minimum pollers are set to 100 and maximum pollers are set to 1000.
Lambda drains the backlog of 40 million messages in approximately 7 minutes. This is more than 55% faster than the baseline without provisioned mode. It takes only about 1 minute to reach maximum concurrent executions.
Scenario 3: Default minimum event pollers and auto-scaling
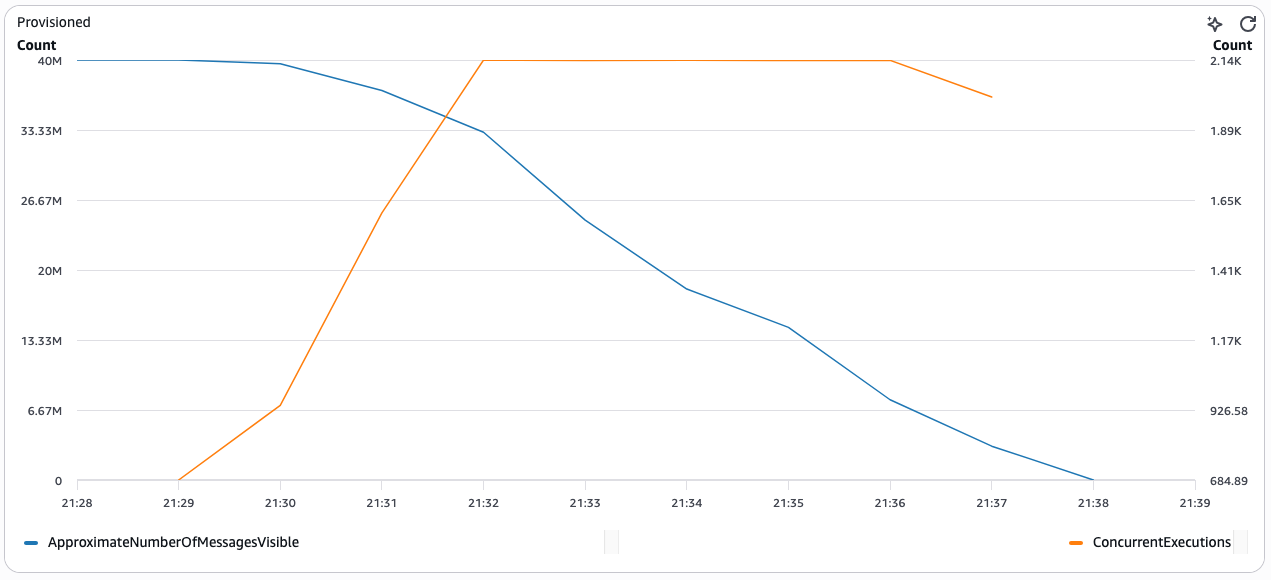
In some cases, the workload might not be as performance-sensitive. With the same volume of 40M messages in your SQS queue, activate provisioned mode for ESM. Start with the default minimum event pollers (set to 2) and let Lambda automatically scale the event pollers based on incoming traffic.
With this configuration, Lambda drains the backlog in approximately 9 minutes. This is still more than 45% faster than the baseline without provisioned mode. It takes about 3 minutes to reach maximum concurrent executions.
Best practices for configuring provisioned pollers
When configuring provisioned mode, keep the following recommendations in mind:
Right-size your minimum pollers
Each event poller supports up to 10 concurrent Lambda invocations and approximately 1 MB/s throughput. Use this formula to estimate your minimum poller count:
For example, if your workload requires 500 concurrent executions and 200 MB/s throughput, set MinimumPollers to at least 200. To estimate the number of event pollers required to verify optimal message processing performance when using provisioned mode for SQS ESM, follow the steps described in determining the required event pollers.
Set maximum pollers for burst capacity
Set MaximumPollers to handle your peak traffic scenario. The ESM scales between your minimum and maximum based on queue depth. A good starting point is 2–5x your minimum pollers.
Align with Lambda concurrency limits
Provisioned pollers invoke your Lambda function concurrently. Verify that your account’s concurrent execution quota accommodates the maximum concurrency your pollers can drive:
MaxConcurrency = MaximumPollers × 10
If you set MaximumPollers to 5,000, your account needs at least 50,000 concurrent execution capacity. Request a quota increase through the Lambda quotas page if needed.
Start conservatively and iterate
Begin with a lower MinimumPollers value and monitor the CloudWatch metrics described in the following section. Increase the minimum if you observe queue depth growth during traffic spikes, or decrease it if pollers remain underutilized during off-peak hours.
Use FIFO queues for ordered workloads
When processing order-sensitive workloads, use FIFO queues with high-throughput mode activated. Provisioned mode works with both SQS standard and FIFO queue types.
Set up dead-letter queues
Configure dead-letter queues to manage messages that fail processing after multiple attempts.
Adjust batch size as needed
The batch size parameter remains adjustable, with a default value of 10 messages and a maximum of 10,000 messages for standard queues.
Cost considerations
Provisioned mode billing is based on event poller unit (EPU) hours. You pay for the number of provisioned pollers allocated, regardless of whether they are actively processing messages. See AWS Lambda pricing for details. Key optimization strategies are:
Match minimum pollers to your sustained baseline traffic to avoid over-provisioning during low-traffic periods.
Use maximum pollers for burst capacity as you only pay for pollers that scale up while they are active.
Monitoring provisioned mode with CloudWatch
Lambda publishes the following CloudWatch metrics for provisioned mode ESMs:
Metric
Description
ProvisionedPollers
Current number of provisioned event pollers allocated
ConcurrentExecutions
Number of concurrent Lambda invocations driven by the ESM
ApproximateNumberOfMessagesVisible
SQS queue depth (from SQS metrics)
Duration
Function execution time per invocation
Set CloudWatch alarms on ApproximateNumberOfMessagesVisible to detect queue backlogs, and on ProvisionedPollers to track the number of provisioned pollers. To understand how your ESM processes messages at each stage, from polling through invocation to completion, opt in to the EventCount metric group. This provides detailed metrics including PolledEventCount, FilteredOutEventCount, InvokedEventCount, FailedInvokeEventCount, and DeletedEventCount.
Conclusion
Provisioned mode for SQS event source mappings gives you control over scaling behavior for your most demanding workloads. By configuring minimum and maximum event pollers, you achieve predictable low-latency processing, scale to 100,000 concurrent executions, and sustain throughput of up to a million events per second, without waiting for automatic scale-up.
Dedicated pollers deliver predictable, low-latency performance. This makes them well-suited for workloads like real-time financial transactions, high-volume IoT data ingestion, or flash sale order processing. You can achieve 3x faster scaling compared to default mode. Combined with CloudWatch observability and flexible configuration through CLI, SAM, and CloudFormation, provisioned mode integrates into your existing deployment workflows.
Building event-driven multi-tenant SaaS applications typically requires compute isolation between tenants to prevent data leakage, maintain security boundaries, and ensure compliance. Traditionally, you had to choose between two approaches: sharing execution environments across tenants (risking cross-tenant contamination of in-memory state) or managing separate Lambda functions per tenant (which introduces operational overhead, increasing costs, and complicating deployments). Both approaches required you to make trade-offs between security, operational complexity, and cost efficiency.
AWS Lambdatenant isolation mode with Event Source Mappings addresses this trade-off. This approach reduces operational complexity, improves your security posture, and removes the need to manage separate functions per tenant, all while maintaining strict compute-level isolation boundaries. You can now build event-driven architectures using services like Amazon SQS and Amazon EventBridge where each tenant’s workloads run in dedicated execution environments, but you manage only a single Lambda function.
In this post, you’ll learn how to propagate tenant identity from event payloads, implement IAM permissions for tenant-isolated invocations, apply validation strategies to verify tenant context, and use a lightweight routing mechanism that invokes tenant-isolated backends. Complete sample code demonstrating this pattern is available in the AWS samples repository.
Understanding Lambda tenant isolation mode
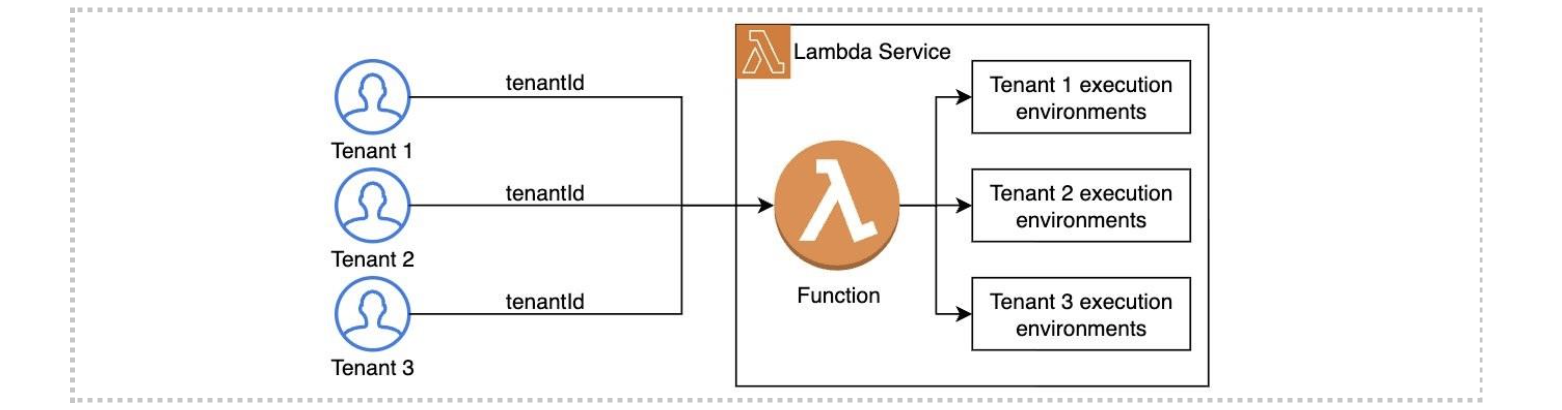
AWS Lambda tenant isolation mode extends Lambda’s execution model by introducing tenant-aware routing of invocations. Instead of reusing execution environments across all invocations of a function, Lambda associates each execution environment with a specific tenant identifier. When a new request is received, Lambda routes it to an existing environment for that specific tenant or creates a new one if none exists.
Figure 1. Using Lambda tenant isolation mode for compute isolation
This simplifies how you build multi-tenant SaaS systems, while maintaining isolation boundaries at the compute level. Execution environments are never shared across tenants but still reused within the same tenant for maximum efficiency. That means you can safely cache tenant-specific configurations, such as feature flags or database connection strings, without adding isolation logic manually in your code.
To use the tenant isolation mode, every invocation must include a tenant ID parameter. For synchronous, direct invocations, such as originating from Amazon API Gateway or AWS SDKs, you pass it using the X-Amz-Tenant-Id header, as described in the launch blog and service documentation. Lambda service uses this header to route the invocation to tenant-specific execution environments. Inside your function handler, the tenant ID is available using the context.tenantId property, so you can implement tenant-aware logic.
port const handler = async (event, context) => {
    const tenantId = context.tenantId;

    // Tenant-specific business logic here
    console.log(`Processing request for tenant: ${tenantId}`);
};
Figure 2. Accessing tenant ID from function handler.
When using API Gateway, you can extract the tenant ID value from incoming request metadata, such as HTTP headers, path parameters, query parameters, or JWT claims, and map it directly to the downstream X-Amz-Tenant-Id in the API Gateway integration request configuration. See the launch blog for detailed guidance.
This model works well for direct, synchronous invocations. However, many serverless applications rely on event-driven patterns, where Lambda is invoked through Event Source Mappings.
Using tenant isolation mode with event sources
Many serverless applications use event-driven architectures built on services like Amazon SQS, Amazon EventBridge, Amazon Kinesis, or Amazon DynamoDB Streams. In these cases, Lambda is invoked by an Event Source Mapping (ESM), which polls the event source and invokes your function when new events arrive.
With these services, you’ll commonly find the tenant identity embedded in the event payload or metadata – for example, in an SQS message body or EventBridge event detail. Each event source has its own payload schema. Below are example payloads when using SQS and EventBridge, where you can see the tenantId parameter present in the payload.
However, event sources don’t provide a built-in mechanism to map message properties to HTTP headers. As a result, if you try to invoke a function with tenant isolation mode enabled directly from an event source mapping, it fails because the tenant ID isn’t propagated as the X-Amz-Tenant-Id header. The following section describes how to address this and integrate ESMs with tenant-isolated Lambda functions.
Propagating tenant identity with Event Source Mappings
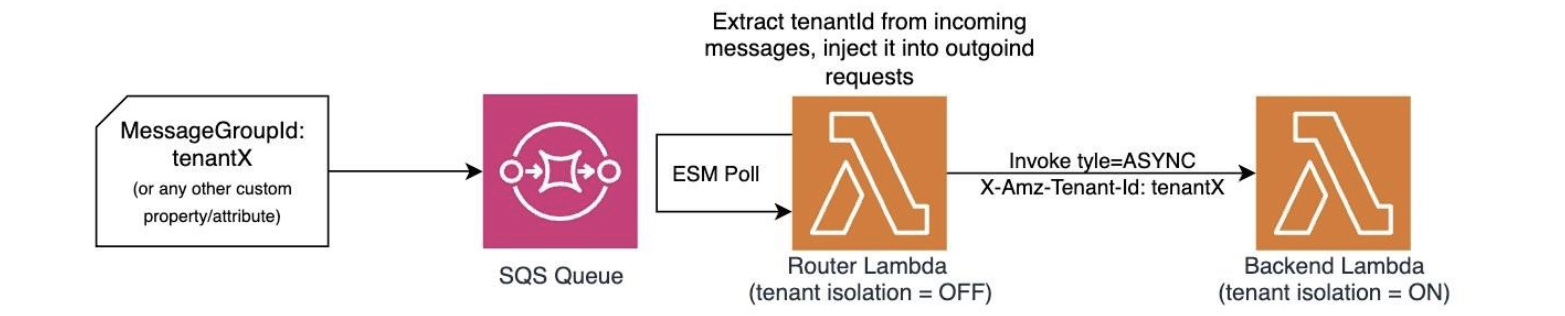
To propagate tenant identity from ESM messages, you can introduce a routing component – a lightweight Lambda function that sits between the event source and your tenant-isolated backend function. Your routing function receives events from the ESM, extracts the tenant ID from each message, and invokes your backend function using the Lambda Invoke API, passing the required X-Amz-Tenant-Id header. See the following diagram for an example architecture using SQS ESM.
Figure 3. Propagating tenant ID from SQS messages to Lambda with tenant isolation mode enabled
You don’t need to enable tenant isolation mode on the routing function itself – it acts as a stateless dispatcher. Your multi-tenant backend function, which contains your core business logic, runs with tenant isolation mode enabled and receives properly scoped, tenant-aware invocations. This pattern keeps tenant isolation at the backend layer while preserving a shared event ingestion model.
The following example illustrates a routing function that processes incoming SQS messages, extracts the tenant ID from each message body, and invokes your backend function with the appropriate tenant context. This example assumes MessageGroupId is used to carry the tenant identifier, which ensures messages from the same tenant are processed in order when you’re using FIFO queues.
export const handler = async (event) => {
    for (const record of event.Records) {
        const body = record.body;
        const messageGroupId = record.attributes?.MessageGroupId;

        const command = new InvokeCommand({
            FunctionName: BACKEND_FUNCTION_NAME,
            InvocationType: 'Event',
            TenantId: messageGroupId,
            Payload: Buffer.from(body)
        });

        await lambdaClient.send(command);
    }
}
Figure 4. Routing SQS messages to a Lambda function with tenant isolation mode enabled
The following example illustrates how you can achieve the same routing functionality when processing EventBridge events.
Figure 5. Routing EventBridge events to a Lambda function with tenant isolation mode enabled
IAM permissions
Your routing function’s execution role needs permission to:
Poll the event source: You can apply this policy either to your function execution role or as a resource policy on the event source itself.
Invoke the downstream backend function: Additionally, your router function requires the lambda:InvokeFunction permission scoped to your backend function ARN.
Below is an example execution role policy to allow the router function to poll from an SQS queue
Figure 6. IAM permissions used for implementing the tenant ID router function mechanism.
Best practices and considerations
When implementing the pattern described in this post, keep these important considerations in mind regarding validation, scaling, and overall system design.
Validate tenant identity before invocation. Tenant identity comes from event payloads, you shouldn’t automatically assume it’s trustworthy. Here’s how to protect your system:
Validate incoming payloads and reject messages with missing, malformed, or unauthorized tenant IDs at the routing layer before invoking your backend function
Maintain an authoritative tenant registry and validate incoming tenant IDs against it
Use dead-letter queues (DLQs) on your SQS queues to capture messages that fail validation for investigation and replay
When using EventBridge Pipes, use the enrichment step to validate or normalize tenant IDs before they reach your routing function
Enable partial batch response for applicable ESMs, such as SQS, so your routing function can report individual message failures without failing the entire batch
Plan for scaling considerations. Tenant isolation mode creates separate execution environments per tenant. This can increase the number of cold starts compared to shared environments. Each tenant consumes concurrency independently, so monitor your usage and request quota increases as your tenant base grows.
Optimize the routing function. Your routing function introduces an additional invocation segment. Use asynchronous invocation (InvocationType: ‘Event’) to reduce idle waiting time and size your function accordingly.
Understand permission boundaries. Tenants share your backend function’s execution role. If you need fine-grained per-tenant permissions, consider propagating tenant-scoped credentials (for example, using AWS STS AssumeRole) from the upstream segment.
Sample code
A complete, deployable sample project demonstrating this pattern – including SQS routing functions, a tenant-isolated backend function, and AWS SAM infrastructure – is available in this GitHub repository. Follow the instructions in README.md to provision the sample project in your account
Conclusion
Lambda tenant isolation mode introduces cross-tenant compute isolation for your multi-tenant SaaS applications by routing each invocation to a tenant-specific execution environment. When you combine this with event-driven architectures built on services like SQS, EventBridge, and Kinesis, the routing function pattern described in this post allows you to propagate tenant identity from event payloads and invoke your tenant-isolated backend with the correct context.
This approach extends tenant isolation mode to your asynchronous workloads without changing your core business logic. You retain per-tenant execution environment isolation while continuing to use Lambda’s native event source integrations, scaling model, and operational tooling. Together, these patterns provide you with a practical foundation for building secure, scalable, event-driven multi-tenant SaaS applications on AWS.
Next steps: Consider extending this pattern to other event sources like Kinesis Data Streams or DynamoDB Streams. You can also explore combining this approach with AWS Step Functions for orchestrating complex multi-tenant workflows while maintaining tenant isolation boundaries.
Amazon Simple Queue Service (Amazon SQS) is a fully-managed message queueing service that enables you to decouple and scale microservices, distributed systems, and serverless applications. Amazon SQS provides authentication mechanisms so that you can control who has access to the queue. It also provides encryption in transit with HTTP over SSL or TLS, and it supports server-side encryption using AWS Key Management Service (AWS KMS) to help protect the data passing through Amazon SQS. These controls allow you to use Amazon SQS to exchange sensitive data between applications. With the integration of Amazon SQS and AWS KMS, you can centrally-manage the keys that protect Amazon SQS, as well as the keys that protect your other AWS resources.
AWS services, such as Amazon Simple Storage Service (Amazon S3) and Amazon Simple Notification Service (Amazon SNS), can act as event sources that send events to Amazon SQS. To enable an event source to access an encrypted SQS queue, you will need to configure the queue with a customer managed key in AWS KMS, and then use the key policy to allow the event source to use the required AWS KMS API methods. The event source also requires permissions to authenticate access to the queue to send events. You can achieve this by using an SQS policy, which is a resource-based policy that you can use to control access to the SQS queue and its data.
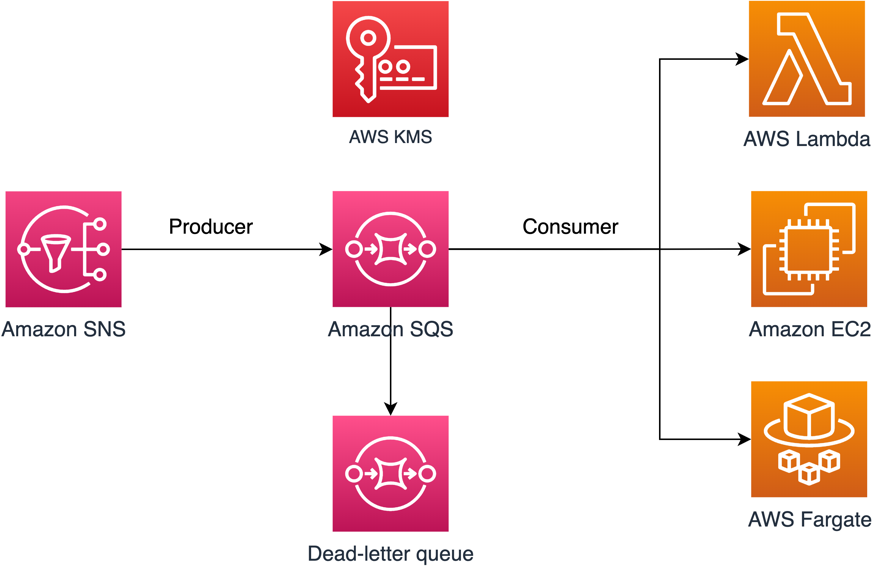
In this post, we will walk you through a common use case to illustrate how you can build the key policy and the SQS queue policy. This use case is shown in Figure 1.
Figure 1: Architecture to publish Amazon SNS messages to Amazon SQS
As shown in Figure 1, the solution has the following steps:
The message producer is an Amazon SNS topic. The topic is configured to send messages to an encrypted Amazon SQS queue. The queue is encrypted by using an AWS KMS customer-managed key.
The SQS queue is configured to send failed messages to a dead-letter queue (DLQ). This can help you debug your application or messaging system because DLQs let you isolate unconsumed messages to determine why their processing didn’t succeed.
The SQS policy defined in this post doesn’t support redriving messages directly to the same or a different SQS queue.
Prerequisites
This post contains only the required IAM permissions in the form of policy statements. To construct the policy, you need to add the statements to your SQS policy or your AWS KMS key policy. This post doesn’t walk you through how to create the SQS queue or the AWS KMS key. Therefore, to use the policies included in this post, make sure that you’ve completed the following prerequisites:
Set up an SQS queue. For instructions, see Create a queue (console) in the Amazon SQS documentation.
Create an AWS KMS key. For instructions, see Creating keys in the AWS KMS documentation.
Least-privilege key policy for Amazon SQS
In this section, we describe the required least-privilege permissions in AWS KMS for the customer-managed key that you use to encrypt your SQS queue. With these permissions, you can limit access to only the intended entities while implementing least privilege. The key policy must consist of the following policy statements, which we describe in detail below:
Grant administrator permissions to the KMS key
Grant read-only access to the key metadata
Grant AWS KMS permissions to Amazon SNS to publish messages to the queue
Allow consumers to decrypt messages from the queue
Grant administrator permissions to the KMS key
To create an AWS KMS key, you need to provide AWS KMS administrator permissions to the IAM role that you use to deploy the KMS key. These administrator permissions are defined in the AllowKeyAdminPermissions policy statement that follows. When you add this statement to your key policy, make sure to replace <admin-role ARN> with the Amazon Resource Name (ARN) of the IAM role used to deploy the KMS key, manage the KMS key, or both. This can be the IAM role of your deployment pipeline or the administrator role for your organization in AWS Organizations.
Note: In a key policy, the value of the Resource element needs to be “*”, which means “this KMS key”. The asterisk (“*”) identifies the KMS key to which the key policy is attached.
Grant read-only access to the key metadata
To grant other IAM roles read-only access to your key metadata, add the following AllowReadAccessToKeyMetaData statement to your key policy. This statement allows you, for example, to list the KMS keys in your account for auditing purposes. The statement grants the AWS account root user read-only access to the key metadata. Therefore, an IAM principal in the account can have access to the key metadata when their identity-based policies have the following permissions listed in the statement: kms:Describe*, kms:Get*, and kms:List*. Make sure to replace <account-ID> with your own information.
Grant AWS KMS permissions to Amazon SNS to publish messages to the queue
To allow your SNS topic to publish messages to your encrypted SQS queue, add the following AllowSNSToSendToSQS policy statement to your key policy. This statement grants Amazon SNS permissions to use the KMS key to publish to your SQS queue. Make sure to replace <account-id> with your own information.
Note: The Condition element limits access to the SNS service in the same AWS account where the SNS topic exists.
Allow consumers to decrypt messages from the queue
The following AllowConsumersToReceiveFromTheQueue statement grants the SQS message consumer the required permissions to decrypt messages received from the encrypted SQS queue. When you attach the policy statement, replace <consumer’s runtime role ARN> with the ARN for the IAM runtime role of the message consumer.
In this section, we will walk you through least-privilege SQS queue policies to help you send Amazon SNS messages to Amazon SQS. The defined policy is designed to prevent unintended access by using a mix of both allow and deny statements. The allow statements grant access to the intended entity or entities. The deny statements prevent other unintended entities from accessing the SQS queue, while excluding the intended entity within the policy condition. The SQS policy includes the following statements, which we describe in detail below:
Restrict Amazon SQS management permissions
Restrict SQS queue actions from the specified organization
Grant SQS permissions to consumers
Enforce encryption in transit
Restrict message transmission to a specific SNS topic
(Optional) Restrict message reception to a specific VPC endpoint
Restrict Amazon SQS management permissions
The following RestrictAdminQueueActions policy statement restricts the Amazon SQS management permissions to only the IAM role or roles that you use to deploy the queue, manage the queue, or both.
Make sure to replace the <placeholder values> with your own information. Specify the ARN of the IAM role used to deploy the SQS queue, as well as the ARNs of each administrator role that should have SQS management permissions. For the Resource element, you can specify either “*” or the ARN of the SQS queue.
Restrict SQS queue actions from the specified organization
To help protect your Amazon SQS resources from external access (that is, access by an entity outside your AWS Organizations organization), use the following statement. The statement limits SQS queue access to the organization that you specify in the Condition element. Make sure to replace <org-id> with your organization ID. For the Resource element, you can specify either “*” or the ARN of the SQS queue.
To receive messages from the SQS queue, you need to provide the message consumer with the necessary permissions. The following policy statement grants the consumer, which you specify, the required permissions to consume messages from the SQS queue. When adding the statement to your SQS policy, make sure to replace <consumer’s IAM runtime role ARN> with the ARN of the IAM runtime role used by the consumer. For the Resource element, you can specify either “*” or the ARN of the SQS queue.
To prevent other entities from receiving messages from the SQS queue, add the following DenyOtherConsumersFromReceiving statement to the SQS queue policy. This statement restricts message consumption to the consumer that you specify—allowing no other consumer to have access, even when their identity permissions would grant them access. Make sure to replace <consumer’s runtime role ARN> with your own information. For the Resource element, you can specify either “*” or the ARN of the SQS queue.
The following DenyUnsecureTransport policy statement enforces the consumers and producers to use secure channels (TLS connections) to send and receive messages to and from the SQS queue. For the Resource element, you can specify either “*” or the ARN of the SQS queue.
Restrict message transmission to a specific SNS topic
The following AllowSNSToSendToTheQueue policy statement allows the specified SNS topic to send messages to the SQS queue. Make sure to replace <SNS topic ARN> with the SNS topic ARN. For the Resource element, you can specify either “*” or the ARN of the SQS queue.
The following DenyAllProducersExceptSNSFromSending policy statement prevents other producers from sending messages to the queue. Replace <SNS topic ARN> with your own information. For the Resource element, you can specify either “*” or the ARN of the SQS queue.
(Optional) Restrict message reception to a specific VPC endpoint
To restrict the receipt of messages to only a specific VPC endpoint, add the following DenyReceivingIfNotThroughVPCE policy statement to your SQS queue policy. This statement prevents a message consumer from receiving messages from the queue unless the messages are from the desired VPC endpoint. Replace <vpce_id> with the ID of the VPC endpoint that you created for your SQS queue. For the Resource element, you can specify either “*” or the ARN of the SQS queue.
In this section, we will walk you through how to manage access to your SQS queue when you are using it as a dead-letter queue (DLQ) for another SQS queue.
Add policy statements to your DLQ access policy
Add the following policy statements, identified by their statement ID, to your DLQ access policy. These are the same policy statements introduced earlier in this post.
RestrictAdminQueueActions
DenyQueueActionsOutsideOrg
AllowConsumersToReceiveFromTheQueue
DenyOtherConsumersFromReceiving
DenyUnsecureTransport
In addition to adding the preceding policy statements to your DLQ access policy, you should add a statement to restrict message transmission to SQS queues, which we describe in the next section.
Restrict message transmission to SQS queues
To restrict access to only SQS queues from the same account, add the following DenyAnyProducersExceptSQS policy statement to the DLQ access policy. This statement doesn’t limit message transmission to a specific queue because you need to deploy the DLQ before you create the main queue, so you won’t know the SQS queue ARN when you create the DLQ. If you need to limit access to only one SQS queue, modify the aws:SourceArn in the Condition element with the ARN of your SQS source queue when you know it.
Important: The SQS queue policies defined in this post don’t restrict the sqs:PurgeQueue action to a certain IAM role or roles. The sqs:PurgeQueue action enables you to delete all messages in the SQS queue. You can also use this action to make changes to the message format without replacing the SQS queue. When debugging an application, you can clear the SQS queue to remove potentially erroneous messages. When testing the application, you can drive a high message volume through the SQS queue and then purge the queue to start fresh before entering production. The reason for not restricting this action to a certain role is that this role might not be known when deploying the SQS queue. You will need to add this permission to the role’s identity-based policy to be able to purge the queue.
Prevent the cross-service confused deputy problem
The confused deputy problem is a security issue where an entity that doesn’t have permission to perform an action can coerce a more privileged entity to perform the action. To help prevent this problem, AWS provides tools that help you protect your account if you provide third parties (known as cross-account) or other AWS services (known as cross-service) access to resources in your account. The policy statements in this post can help you prevent the cross-service confused deputy problem.
Cross-service impersonation can occur when one service (the calling service) calls another service (the called service). The calling service can be manipulated to use its permissions to act on another customer’s resources in a way it shouldn’t otherwise have permission to access. To help protect against this issue, the resource-based policies defined in this post use the aws:SourceArn, aws:SourceAccount, and aws:PrincipalOrgID global IAM condition context keys. These limit the permissions that a service has to a specific resource, a specific account, or a specific organization in AWS Organizations.
For example, the following AllowS3ToSendToTheQueue policy statement allows Amazon S3 to deliver messages to your Amazon SQS queue; the aws:SourceArn condition in this policy grants access to a specific S3 bucket only.
If a bad actor creates an S3 bucket to try to deliver messages to your Amazon SQS queue, the source ARN will not match that of the S3 bucket specified in this policy, so the policy will deny access. Without the aws:SourceArn condition, the unauthorized S3 bucket would be granted access unintentionally because any S3 bucket would be granted to deliver messages to our queue through the S3 service principal. Adding the aws:SourceArn condition prevents cross-service impersonation.
Use IAM Access Analyzer to review cross-account access
You can use IAM Access Analyzer to review your SQS queue policies and AWS KMS key policies and alert you when an SQS queue or a KMS key grants access to an external entity. IAM Access Analyzer helps identify resources in your organization and accounts that are shared with an entity outside the zone of trust. This zone of trust can be either an AWS account or the organization within AWS Organizations that you specify when you enable IAM Access Analyzer.
IAM Access Analyzer also helps identify resources shared with external principals by using logic-based reasoning to analyze the resource-based policies in your AWS environment. For each instance of a resource shared outside of your zone of trust, IAM Access Analyzer generates a finding. Figure 2 shows an IAM Access Analyzer finding, in which a sqs:SendMessage API call was made to our SQS queue from an account that is outside of our zone of trust.
Figure 2: IAM Access Analyzer example finding for an Amazon SQS queue
Findings include information about the access and the external principal granted to it. To determine whether the access is intended and safe, or unintended and a security risk, review the findings. For unintended access, review the affected policy and modify it by using the policy statements introduced in this blog post to further restrict access. For more information on how IAM Access Analyzer identifies unintended access to your AWS resources, see the blog post Identify Unintended Resource Access with IAM Access Analyzer.
Conclusion
In this post, you learned how to manage access to your encrypted Amazon SQS queue to help you achieve least privilege. We presented an SQS queue policy and an AWS KMS key policy so that you can use Amazon SQS to receive messages from an SNS topic. We addressed the confused deputy problem, specifying the exact source allowed to emit events. You also learned how to use IAM Access Analyzer to review the external access provided by your existing SQS queue policies and key policies.
You can follow the instructions in this post to resolve findings based on your SQS use case. You can also use the provided policies for newly created SQS queues and their KMS keys, or to modify existing queues (for example, to address IAM Access Analyzer findings). For more use cases, see the AWS SQS documentation.
This blog post is written by Wassim Benhallam, Sr Cloud Application Architect AWS WWCO ProServe, and Rajesh Kesaraju, Sr. Specialist Solution Architect, EC2 Flexible Compute.
Scaling an Amazon EC2 Auto Scaling group based on Amazon Simple Queue Service (Amazon SQS) is a commonly used design pattern in decoupled applications. For example, an EC2 Auto Scaling Group can be used as a worker tier to offload the processing of audio files, images, or other files sent to the queue from an upstream tier (e.g., web tier). For latency-sensitive applications, AWS guidance describes a common pattern that allows an Auto Scaling group to scale in response to the backlog of an Amazon SQS queue while accounting for the average message processing duration (MPD) and the application’s desired latency.
This post builds on that guidance to focus on latency-sensitive applications where the MPD varies over time. Specifically, we demonstrate how to dynamically update the target value of the Auto Scaling group’s target tracking policy based on observed changes in the MPD. We also cover the utilization of Amazon EC2 Spot instances, mixed instance policies, and attribute-based instance selection in the Auto Scaling Groups as well as best practice implementation to achieve greater cost savings.
The challenge
The key challenge that this post addresses is applications that fail to honor their acceptable/target latency in situations where the MPD varies over time. Latency refers here to the time required for any queue message to be consumed and fully processed.
Consider the example of a customer using a worker tier to process image files (e.g., resizing, rescaling, or transformation) uploaded by users within a target latency of 100 seconds. The worker tier consists of an Auto Scaling group configured with a target tracking policy. To achieve the target latency mentioned previously, the customer assumes that each image can be processed in one second, and configures the target value of the scaling policy so that the average image backlog per instance is maintained at approximately 100 images.
In the first week, the customer submits 1000 images to the Amazon SQS queue for processing, each of which takes one second of processing time. Therefore, the Auto Scaling group scales to 10 instances, each of which processes 100 images in 100s, thereby honoring the target latency of 100s.
In the second week, the customer submits 1000 slightly larger images for processing. Since an image’s processing duration scales with its size, each image takes two seconds to process. As in the first week, the Auto Scaling group scales to 10 instances, but this time each instance processes 100 images in 200s, which is twice as long as was needed in the first round. As a result, the application fails to process the latter images within its acceptable latency.
Therefore, the challenge is common to any latency-sensitive application where the MPD is subject to change. Applications where the processing duration scales with input data size are particularly vulnerable to this problem. This includes image processing, document processing, computational jobs, and others.
Solution overview
Before we dive into the solution, let’s briefly review the target tracking policy’s scaling metric and its corresponding target value. A target tracking scaling policy works by adjusting the capacity to keep a scaling metric at, or close to, the specified target value. When scaling in response to an Amazon SQS backlog, it’s good practice to use a scaling metric known as the Backlog Per Instance (BPI) and a target value based on the acceptable BPI. These are computed as follows:
Given the acceptable BPI equation, a longer MPD requires us to use a smaller target value if we are to process these messages in the same acceptable latency, and vice versa. Therefore, the solution we propose here works by monitoring the average MPD over time and dynamically adjusting the target value of the Auto Scaling group’s target tracking policy (acceptable BPI) based on the observed changes in the MPD. This allows the scaling policy to adapt to variations in the average MPD over time, and thus enables the application to honor its acceptable latency.
Solution architecture
To demonstrate how the approach above can be implemented in practice, we put together an example architecture highlighting the services involved (see the following figure). We also provide an automated deployment solution for this architecture using an AWS Serverless Application Model (AWS SAM) template and some Python code (repository link). The repository also includes a README file with detailed instructions that you can follow to deploy the solution. The AWS SAM template deploys several resources, including an autoscaling group, launch template, target tracking scaling policy, an Amazon SQS queue, and a few AWS Lambda functions that serve various functions described as follows.
The Amazon SQS queue is used to accumulate messages intended for processing, while the Auto Scaling group instances are responsible for polling the queue and processing any messages received. To do this, a launch template defines a bootstrap script that allows the group’s instances to download and execute a Python code when first launched. The Python code consumes messages from the Amazon SQS queue and simulates their processing by sleeping for the MPD duration specified in the message body. After processing each message, the instance publishes the MPD as an Amazon CloudWatch metric (see the following figure).
Figure 1: Architecture diagram showing the components deployed by the AWS SAM template.
To enable scaling, the Auto Scaling group is configured with a target tracking scaling policy that specifies BPI as the scaling metric and with an initial target value provided by the user.
The BPI CloudWatch metric is calculated and published by the “Metric-Publisher” Lambda function which is invoked every one minute using an Amazon EventBridge rate expression. To calculate BPI, the Lambda function simply takes the ratio of the number of messages visible in the Amazon SQS queue by the total number of in-service instances in the Auto Scaling group, as shown in equation (2) above.
On the other hand, the scaling policy’s target value is updated by the “Target-Setter” Lambda function, which is invoked every 30 minutes using another EventBridge rate expression. To calculate the new target value, the Lambda function simply takes the ratio of the user-defined acceptable latency value by the current average MPD queried from the corresponding CloudWatch metric, as shown in the previous equation (1).
Finally, to help you quickly test this solution, a Lambda function “Testing Lambda” is also provided and can be used to send messages to the Amazon SQS queue with a processing duration of your choice. This is specified within each message’s body. You can invoke this Lambda function with different MPDs (by modifying the corresponding environment variable) to verify how the Auto Scaling group scales in response. A CloudWatch dashboard is also deployed to enable you to track key scaling metrics through time. These include the number of messages visible in the queue, the number of in-service instances in the Auto Scaling group, the MPD, and BPI vs acceptable BPI.
Solution testing
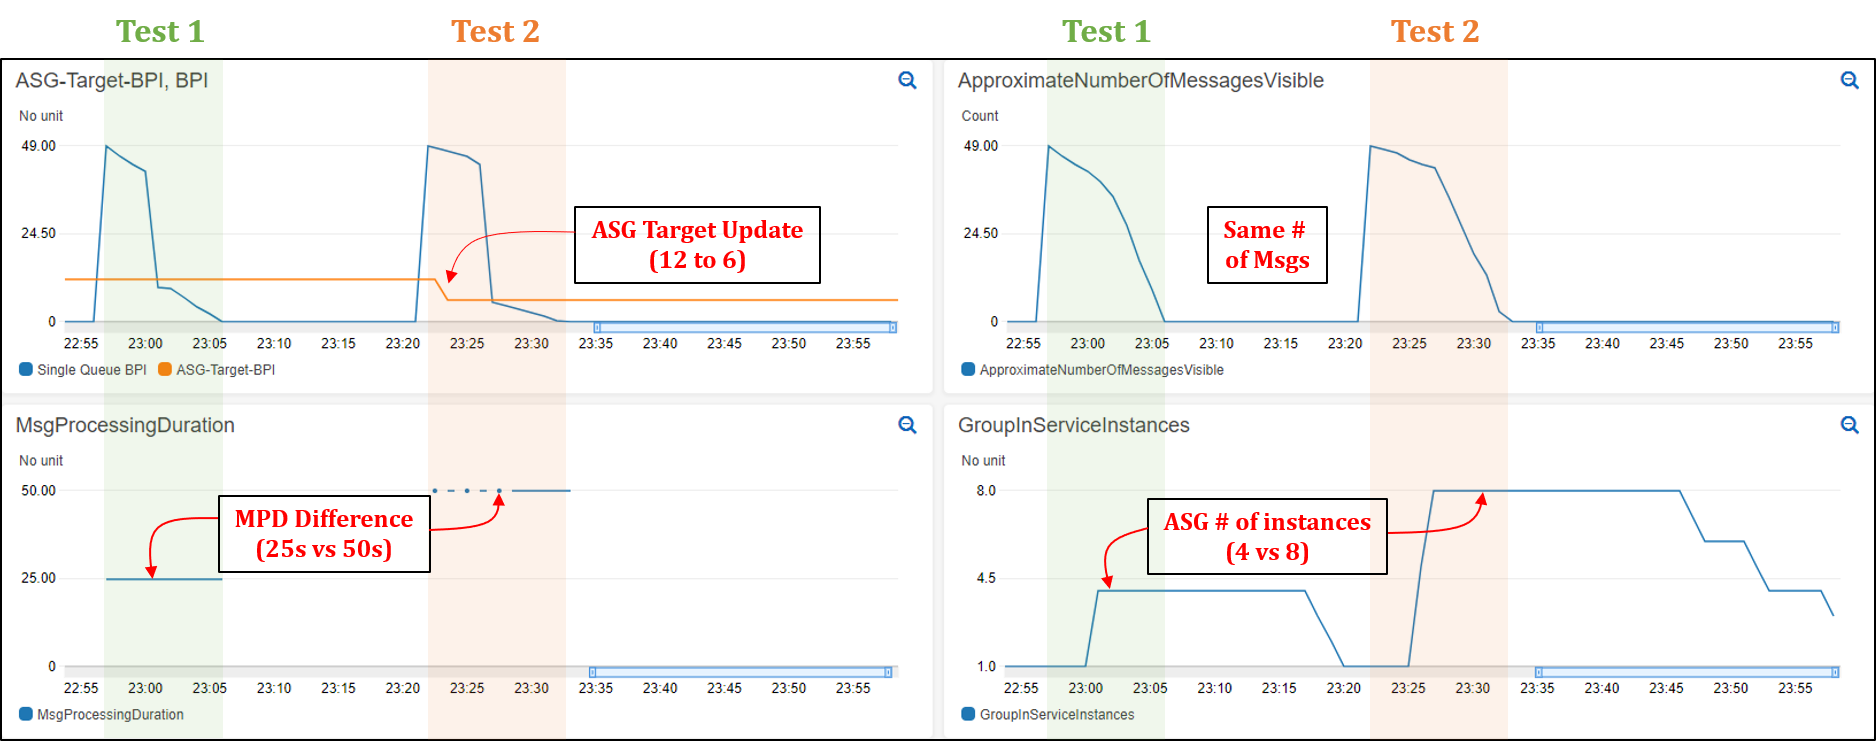
To demonstrate the solution in action and its impact on application latency, we conducted two tests that you can reproduce by following the instructions described in the “Testing” section of the repository’s README file (repository link). In both tests, we assume a hypothetical application with a target latency of 300s. We also modified the invocation frequency of the “Target Setter” Lambda function to one minute to quickly assess the impact of target value changes. In both tests, we submit 50 messages to the Amazon SQS queue through the provided helper lambda. An MPD of 25s and 50s was used for the first and second test, respectively. The provided CloudWatch dashboard shows that the ASG scales to a total of four instances in the first test, and eight instances in the second (see the following figure). See README file for a detailed description of how various metrics evolve over time.
Comparison of Tests 1 and 2
Since Test 2 messages take twice as long to process, the Auto Scaling group launched twice as many instances to attempt to process all of the messages in the same amount of time as Test 1 (latency). The following figure shows that the total time to process all 50 messages in Test 1 was 9 mins vs 10 mins in Test 2. In contrast, if we were to use a static/fixed acceptable BPI of 12, then a total of four instances would have been operational in Test 2, thereby requiring double the time of Test 1 (~20 minutes) to process all of the messages. This demonstrates the value of using a dynamic scaling target when processing messages from Amazon SQS queues, especially in circumstances where the MPD is prone to vary with time.
Figure 2: CloudWatch dashboard showing Auto Scaling group scaling test results (Test 1 and 2).
Recommended best practices for Auto Scaling groups
This section highlights a few key best practices that we recommend adopting when deploying and working with Auto Scaling groups.
Reducing cost using EC2 Spot instances
Amazon SQS helps build loosely coupled application architectures, while providing reliable asynchronous communication between the various layers/components of an application. If a worker node fails to process a message within the Amazon SQS message visibility time-out, then the message is returned to the queue and another worker node can pick up and process that message. This makes Amazon SQS-backed applications fault-tolerant by design and thus a great fit for EC2 Spot instances. EC2 spot instances are spare compute capacity in the AWS cloud that is available to you at steep discounts as compared to On-Demand prices.
Maximizing capacity using attribute-based instance selection
With the recently released attribute-based instance selection feature, you can define infrastructure requirements based on application needs such as vCPU, RAM, and processor family (e.g., x86, ARM). This removes the need to define specific instances in your Auto Scaling group configuration, and it eliminates the burden of identifying the correct instance families and sizes. In addition, newly released instance types will be automatically considered if they fit your requirements. Attribute-based instance selection lets you tap into hundreds of different EC2 instance pools, which increases the chance of getting EC2 (Spot/On-demand) instances. When using attribute-based instance selection with the capacity optimized allocation strategy, Amazon EC2 allocates instances from deeper Spot capacity pools, thereby further reducing the chance of Spot interruption.
The following sample configuration creates an Auto Scaling group with attribute-based instance selection:
As can be seen from the test results, this approach demonstrates how an Auto Scaling group can honor a user-provided acceptable latency constraint while accomodating variations in the MPD over time. This is possible because the average MPD is monitored and regularly updated as a CloudWatch metric. In turn, this is continously used to update the target value of the group’s target tracking policy. Moreover, we have covered additional Auto Scaling group best practices suitable for this use case, including the use of Spot instances to reduce costs and attribute-based instance selection to simplify the selection of relevant instance types.
This post is written by Ankur Sethi, Sr. Product Manager, EC2, and Kinnar Sen, Sr. Specialist Solution Architect, AWS Compute.
Amazon EC2 Auto Scaling helps customers optimize their Amazon EC2 capacity by dynamically responding to varying demand. Based on customer feedback, we enhanced the scaling experience with the launch of predictive scaling policies. Predictive scaling proactively adds EC2 instances to your Auto Scaling group in anticipation of demand spikes. This results in better availability and performance for your applications that have predictable demand patterns and long initialization times. We recently launched a couple of features designed to help you assess the value of predictive scaling – prescriptive recommendations on whether to use predictive scaling based on its potential availability and cost impact, and integration withAmazon CloudWatch to continuously monitor the accuracy of predictions. In this post, we discuss the features in detail and the steps that you can easily adopt to enjoy the benefits of predictive scaling.
Recap: Predictive Scaling
EC2 Auto Scaling helps customers maintain application availability by managing the capacity and health of the underlying cluster. Prior to predictive scaling, EC2 Auto Scaling offered dynamic scaling policies such as target tracking and step scaling. These dynamic scaling policies are configured with an Amazon CloudWatch metric that represents an application’s load. EC2 Auto Scaling constantly monitors this metric and responds according to your policies, thereby triggering the launch or termination of instances. Although it’s extremely effective and widely used, this model is reactive in nature, and for larger spikes, may lead to unfulfilled capacity momentarily as the cluster is scaling out. Customers mitigate this by adopting aggressive scale out and conservative scale in to manage the additional buffer of instances. However, sometimes applications take a long time to initialize or have a recurring pattern with a sudden spike of high demand. These can have an impact on the initial response of the system when it is scaling out. Customers asked for a proactive scaling mechanism that can scale capacity ahead of predictable spikes, and so we delivered predictive scaling.
Predictive scaling was launched to make the scaling action proactive as it anticipates the changes required in the compute demand and scales accordingly. The scaling action is determined by ensemble machine learning (ML) built with data from your Auto Scaling group’s scaling patterns, as well as billions of data points from our observations. Predictive scaling should be used for applications where demand changes rapidly but with a recurring pattern, instances require a long time to initialize, or where you’re manually invoking scheduled scaling for routine demand patterns. Predictive scaling not only forecasts capacity requirements based on historical usage, but also learns continuously, thereby making forecasts more accurate with time. Furthermore, predictive scaling policy is designed to only scale out and not scale in your Auto Scaling groups, eliminating the risk of ending with lesser capacity because of inexact predictions. You must use dynamic scaling policy, scheduled scaling, or your own custom mechanism for scale-ins. In case of exceptional demand spikes, this addition of dynamic scaling policy can also improve your application performance by bridging the gap between demand and predicted capacity.
What’s new with predictive scaling
Predictive scaling policies can be configured in a non-mutative ‘Forecast Only’ mode to evaluate the accuracy of forecasts. When you’re ready to start scaling, you can switch to the ‘Forecast and Scale’ mode. Now we prescriptively recommend whether your policy should be switched to ‘Forecast and Scale’ mode if it can potentially lead to better availability and lower costs, saving you the time and effort of doing such an evaluation manually. You can test different configurations by creating multiple predictive scaling policies in ‘Forecast Only’ mode, and choose the one that performs best in terms of availability and cost improvements.
Monitoring and observability are key elements of AWS Well Architected Framework. Now we also offer CloudWatch metrics for your predictive scaling policies so that that you can programmatically monitor your predictive scaling policy for demand pattern changes or prolonged periods of inaccurate predictions. This will enable you to monitor the key performance metrics and make it easier to adopt AWS Well-Architected best practices.
In the following sections, we deep dive into the details of these two features.
Recommendations for predictive scaling
Once you set up an Auto Scaling group with predictive scaling policy in Forecast Only mode as explained in this introduction to predictive scaling blog post , you can review the results of the forecast visually and adjust any parameters to more accurately reflect the behavior that you desire. Evaluating simply on the basis of visualization may not be very intuitive if the scaling patterns are erratic. Moreover, if you keep higher minimum capacities, then the graph may show a flat line for the actual capacity as your Auto Scaling group capacity is an outcome of existing scaling policy configurations and the minimum capacity that you configured. This makes it difficult to contemplate whether the lower capacity predicted by predictive scaling wouldn’t leave your Auto Scaling group under-scaled.
This new feature provides a prescriptive guidance to switch on predictive scaling in Forecast and Scale mode based on the factors of availability and cost savings. To determine the availability and cost savings, we compare the predictions against the actual capacity and the optimal, required capacity. This required capacity is inferred based on whether your instances were running at a higher or lower value than the target value for scaling metric that you defined as part of the predictive scaling policy configuration. For example, if an Auto Scaling group is running 10 instances at 20% CPU Utilization while the target defined in predictive scaling policy is 40%, then the instances are running under-utilized by 50% and the required capacity is assumed to be 5 instances (half of your current capacity). For an Auto Scaling group, based on the time range in which you’re interested (two weeks as default), we aggregate the cost saving and availability impact of predictive scaling. The availability impact measures for the amount of time that the actual metric value was higher than the target value that you defined to be optimal for each policy. Similarly, cost savings measures the aggregated savings based on the capacity utilization of the underlying Auto Scaling group for each defined policy. The final cost and availability will lead us to a recommendation based on:
If availability increases (or remains same) and cost reduces (or remains same), then switch on Forecast and Scale
If availability reduces, then disable predictive scaling
If availability increase comes at an increased cost, then the customer should take the call based on their cost-availability tradeoff threshold
Figure 1: Predictive Scaling Recommendations on EC2 Auto Scaling console
The preceding figure shows how the console reflects the recommendation for a predictive scaling policy. You get information on whether the policy can lead to higher availability and lower cost, which leads to a recommendation to switch to Forecast and Scale. To achieve this cost saving, you might have to lower your minimum capacity and aim for higher utilization in dynamic scaling policies.
To get the most value from this feature, we recommend that you create multiple predictive scaling policies in Forecast Only mode with different configurations, choosing different metrics and/or different target values. Target value is an important lever that changes how aggressive the capacity forecasts must be. A lower target value increases your capacity forecast resulting in better availability for your application. However, this also means more dollars to be spent on the Amazon EC2 cost. Similarly, a higher target value can leave you under-scaled while reactive scaling bridges the gap in just a few minutes. Separate estimates of cost and availability impact are provided for each of the predictive scaling policies. We recommend using a policy if either availability or cost are improved and the other variable improves or stays the same. As long as there is a predictable pattern, Auto Scaling enhanced with predictive scaling maintains high availability for your applications.
Continuous Monitoring of predictive scaling
Once you’re using a predictive scaling policy in Forecast and Scale mode based on the recommendation, you must monitor the predictive scaling policy for demand pattern changes or inaccurate predictions. We introduced two new CloudWatch Metrics for predictive scaling called ‘PredictiveScalingLoadForecast’ and ‘PredictiveScalingCapacityForecast’. Using CloudWatch mertic math feature, you can create a customized metric that measures the accuracy of predictions. For example, to monitor whether your policy is over or under-forecasting, you can publish separate metrics to measure the respective errors. In the following graphic, we show how the metric math expressions can be used to create a Mean Absolute Error for over-forecasting on the load forecasts. Because predictive scaling can only increase capacity, it is useful to alert when the policy is excessively over-forecasting to prevent unnecessary cost.Figure 2: Graphing an accuracy metric using metric math on CloudWatch
In the previous graph, the total CPU Utilization of the Auto Scaling group is represented by m1 metric in orange color while the predicted load by the policy is represented by m2 metric in green color. We used the following expression to get the ratio of over-forecasting error with respect to the actual value.
IF((m2-m1)>0, (m2-m1),0))/m1
Next, we will setup an alarm to automatically send notifications using Amazon Simple Notification Service (Amazon SNS). You can create similar accuracy monitoring for capacity forecasts, but remember that once the policy is in Forecast and Scale mode, it already starts influencing the actual capacity. Hence, putting alarms on load forecast accuracy might be more intuitive as load is generally independent of the capacity of an Auto Scaling group.
Figure 3: Creating a CloudWatch Alarm on the accuracy metric
In the above screenshot, we have set an alarm that triggers when our custom accuracy metric goes above 0.02 (20%) for 10 out of last 12 data points which translates to 10 hours of the last 12 hours. We prefer to alarm on a greater number of data points so that we get notified only when predictive scaling is consistently giving inaccurate results.
Conclusion
With these new features, you can make a more informed decision about whether predictive scaling is right for you and which configuration makes the most sense. We recommend that you start off with Forecast Only mode and switch over to Forecast and Scale based on the recommendations. Once in Forecast and Scale mode, predictive scaling starts taking proactive scaling actions so that your instances are launched and ready to contribute to the workload in advance of the predicted demand. Then continuously monitor the forecast to maintain high availability and cost optimization of your applications. You can also use the new predictive scaling metrics and CloudWatch features, such as metric math, alarms, and notifications, to monitor and take actions when predictions are off by a set threshold for prolonged periods.
Today we’re announcing two new capabilities for Amazon EventBridge – dead letter queues and custom retry policies. Both of these give you greater flexibility in how to handle any failures in the processing of events with EventBridge. You can easily enable them on a per target basis and configure them uniquely for each.
Dead letter queues (DLQs) are a common capability in queuing and messaging systems that allow you to handle failures in event or message receiving systems. They provide a way for failed events or messages to be captured and sent to another system, which can store them for future processing. With DLQs, you can have greater resiliency and improved recovery from any failure that happens.
You can also now configure a custom retry policy that can be set on your event bus targets. Today, there are two attributes that can control how events are retried: maximum number of retries and maximum event age. With these two settings, you could send events to a DLQ sooner and reduce the retries attempted.
For example, this could allow you to recover more quickly if an event bus target is overwhelmed by the number of events received, causing throttling to occur. The events are placed in a DLQ and then processed later.
Failures in event processing
Currently, EventBridge can fail to deliver an event to a target in certain scenarios. Events that fail to be delivered to a target due to client-side errors are dropped immediately. Examples of this are when EventBridge does not have permission to a target AWS service or if the target no longer exists. This can happen if the target resource is misconfigured or is deleted by the resource owner.
For service-side issues, EventBridge retries delivery of events for up to 24 hours. This can happen if the target service is unavailable or the target resource is not provisioned to handle the incoming event traffic and the target service is throttling the requests.
EventBridge failures
Previously, when all attempts to deliver an event to the target were exhausted, EventBridge published a CloudWatch metric indicating a failed target invocation. However, this provides no visibility into which events failed to be delivered and there was no way to recover the event that failed.
Dead letter queues
EventBridge’s DLQs are made possible today with Amazon Simple Queue Service (SQS) standard queues. With SQS, you get all of the benefits of a fully serverless queuing service: no servers to manage, automatic scalability, pay for what you consume, and high availability and security built in. You can configure the DLQs for your EventBridge bus and pay nothing until it is used, if and when a target experiences an issue. This makes it a great practice to follow and standardize on, and provides you with a safety net that’s active only when needed.
Optionally, you could later configure an AWS Lambda function to consume from that DLQ. The function is only invoked when messages exist in the queue, allowing you to maintain a serverless stack to recover from a potential failure.
DLQ configured per target
With DLQ configured, the queue receives the event that failed in the message with important metadata that you can use to troubleshoot the issue. This can include: Error Code, Error Message, Exhausted Retry Condition, Retry Attempts, Rule ARN, and the Target ARN.
You can use this data to more easily troubleshoot what went wrong with the original delivery attempt and take action to resolve or prevent such failures in the future. You could also use the information such as Exhausted Retry Condition and Retry Attempts to further tweak your custom retry policy.
You can configure a DLQ when creating or updating rules via the AWS Management Console and AWS Command Line Interface (AWS CLI). You can also use infrastructure as code (IaC) tools such as AWS CloudFormation.
In the console, select the queue to be used for your DLQ configuration from the drop-down as shown here:
DLQ configuration
When configured via API, AWS CLI, or IaC tools, you must specify the ARN of the queue:
When you configure a DLQ, the target SQS queue requires a resource-based policy that grants EventBridge access. One is created and applied automatically via the console when you create or update an EventBridge rule with a DLQ that exists in your own account.
For any queues created in other accounts, or via API, AWS CLI, or IaC tools, you must add a policy that allows SQS’s SendMessage permission to the EventBridge rule ARN, as shown below:
Once configured, you can monitor CloudWatch metrics for the DLQ queue. This shows both the successful delivery of messages via the InvocationsSentToDLQ metric, in addition to any failures via the InvocationsFailedToBeSentToDLQ. Note that these metrics do not exist if your queue is not considered “active”.
Retry policies
By default, EventBridge retries delivery of an event to a target so long as it does not receive a client-side error as described earlier. Retries occur with a back-off, for up to 185 attempts or for up to 24 hours, after which the event is dropped or sent to a DLQ, if configured. Due to the jitter of the back-off and retry process you may reach the 24-hour limit before reaching 185 retries.
For many workloads, this provides an acceptable way to handle momentary service issues or throttling that might occur. For some however, this model of back-off and retry can cause increased and on-going traffic to an already overloaded target system.
For example, consider an Amazon API Gateway target that has a resource constrained backend service behind it.
Constrained target service
Under a consistently high load, the bus could end up generating too many API requests, tripping the API Gateway’s throttling configuration. This would cause API Gateway to respond with throttling errors back to EventBridge.
Throttled API reply
You may decide that allowing the failed events to retry for 24 hours puts too much load into this system and it may not properly recover from the load. This could lead to potential data loss unless a DLQ was configured.
Added DLQ
With a DLQ, you could choose to process these events later, once the overwhelmed target service has recovered.
DLQ drained back to API
Or the events in question may no longer have the same value as they did previously. This can occur in systems where data loss is tolerated but the timeliness of data processing matters. In these situations, the DLQ would have less value and dropping the message is acceptable.
For either of these situations, configuring the maximum number of retries or the maximum age of the event could be useful.
Now with retry policies, you can configure per target the following two attributes:
MaximumEventAgeInSeconds: between 60 and 86400 seconds (86400, or 24 hours the default)
MaximumRetryAttempts: between 0 and 185 (185 is the default)
When either condition is met, the event fails. It’s then either dropped, which generates an increase to the FailedInvocations CloudWatch metric, or sent to a configured DLQ.
You can configure retry policy attributes when creating or updating rules via the AWS Management Console and AWS Command Line Interface (AWS CLI). You can also use infrastructure as code (IaC) tools such as AWS CloudFormation.
Retry policy
There is no additional cost for configuring either of these new capabilities. You only pay for the usage of the SQS standard queue configured as the dead letter queue during a failure and any application that handles the failed events. SQS pricing can be found here.
Conclusion
With dead letter queues and custom retry policies, you have improved handling and control over failure in distributed systems built with EventBridge. With DLQs you can capture failed events and then process them later, potentially saving yourself from data loss. With custom retry policies, you gain the improved ability to control the number of retries and for how long they can be retried.
I encourage you to explore how both of these new capabilities can help make your applications more resilient to failures, and to standardize on using them both in your infrastructure.
Over the last year, I have been talking about “storage first” serverless patterns. With these patterns, data is stored persistently before any business logic is applied. The advantage of this pattern is increased application resiliency. By persisting the data before processing, the original data is still available, if or when errors occur.
Common pattern for serverless API backend
Using Amazon API Gateway as a proxy to an AWS Lambda function is a common pattern in serverless applications. The Lambda function handles the business logic and communicates with other AWS or third-party services to route, modify, or store the processed data. One option is to place the data in an Amazon Simple Queue Service (SQS) queue for processing downstream. In this pattern, the developer is responsible for handling errors and retry logic within the Lambda function code.
The storage first pattern flips this around. It uses native error handling with retry logic or dead-letter queues (DLQ) at the SQS layer before any code is run. By directly integrating API Gateway to SQS, developers can increase application reliability while reducing lines of code.
Storage first pattern for serverless API backend
Previously, direct integrations require REST APIs with transformation templates written in Velocity Template Language (VTL). However, developers tell us they would like to integrate directly with services in a simpler way without using VTL. As a result, HTTP APIs now offers the ability to directly integrate with five AWS services without needing a transformation template or code layer.
HTTP APIs service integration with Amazon EventBridge
The HTTP APIs direct integration for EventBridge uses the PutEvents API to enable client applications to place events on an EventBridge bus. Once the events are on the bus, EventBridge routes the event to specific targets based upon EventBridge filtering rules.
This integration is a storage first pattern because data is written to the bus before any routing or logic is applied. If the downstream target service has issues, then EventBridge implements a retry strategy with incremental back-off for up to 24 hours. Additionally, the integration helps developers reduce code by filtering events at the bus. It routes to downstream targets without the need for a Lambda function as a transport layer.
Use this direct integration when:
Different tasks are required based upon incoming event details
Only data ingestion is required
Payload size is less than 256 kb
Expected requests per second are less than the Region quotas.
Amazon Kinesis Data Streams
HTTP APIs service integration with Amazon Kinesis Data Streams
The HTTP APIs direct integration for Kinesis Data Streams offers the PutRecord integration action, enabling client applications to place events on a Kinesis data stream. Kinesis Data Streams are designed to handle up to 1,000 writes per second per shard, with payloads up to 1 mb in size. Developers can increase throughput by increasing the number of shards in the data stream. You can route the incoming data to targets like an Amazon S3 bucket as part of a data lake or a Kinesis data analytics application for real-time analytics.
This integration is a storage first option because data is stored on the stream for up to seven days until it is processed and routed elsewhere. When processing stream events with a Lambda function, errors are handled at the Lambda layer through a configurable error handling strategy.
Use this direct integration when:
Ingesting large amounts of data
Ingesting large payload sizes
Order is important
Routing the same data to multiple targets
Amazon SQS
HTTP APIs service integration with Amazon SQS
The HTTP APIs direct integration for Amazon SQS offers the SendMessage, ReceiveMessage, DeleteMessage, and PurgeQueue integration actions. This integration differs from the EventBridge and Kinesis integrations in that data flows both ways. Events can be created, read, and deleted from the SQS queue via REST calls through the HTTP API endpoint. Additionally, a full purge of the queue can be managed using the PurgeQueue action.
This pattern is a storage first pattern because the data remains on the queue for four days by default (configurable to 14 days), unless it is processed and removed. When the Lambda service polls the queue, the messages that are returned are hidden in the queue for a set amount of time. Once the calling service has processed these messages, it uses the DeleteMessage API to remove the messages permanently.
When triggering a Lambda function with an SQS queue, the Lambda service manages this process internally. However, HTTP APIs direct integration with SQS enables developers to move this process to client applications without the need for a Lambda function as a transport layer.
Use this direct integration when:
Data must be received as well as sent to the service
HTTP APIs service integration with AWS Systems Manager AppConfig
The HTTP APIs direct integration for AWS AppConfig offers the GetConfiguration integration action and allows applications to check for application configuration updates. By exposing the systems parameter API through an HTTP APIs endpoint, developers can automate configuration changes for their applications. While this integration is not considered a storage first integration, it does enable direct communication from external services to AppConfig without the need for a Lambda function as a transport layer.
Use this direct integration when:
Access to AWS AppConfig is required.
Managing application configurations.
AWS Step Functions
HTTP APIs service integration with AWS Step Functions
The HTTP APIs direct integration for Step Functions offers the StartExecution and StopExecution integration actions. These actions allow for programmatic control of a Step Functions state machine via an API. When starting a Step Functions workflow, JSON data is passed in the request and mapped to the state machine. Error messages are also mapped to the state machine when stopping the execution.
This pattern provides a storage first integration because Step Functions maintains a persistent state during the life of the orchestrated workflow. Step Functions also supports service integrations that allow the workflows to send and receive data without needing a Lambda function as a transport layer.
Use this direct integration when:
Orchestrating multiple actions.
Order of action is required.
Building HTTP APIs direct integrations
HTTP APIs service integrations can be built using the AWS CLI, AWS SAM, or through the API Gateway console. The console walks through contextual choices to help you understand what is required for each integration. Each of the integrations also includes an Advanced section to provide additional information for the integration.
Creating an HTTP APIs service integration
Once you build an integration, you can export it as an OpenAPI template that can be used with infrastructure as code (IaC) tools like AWS SAM. The exported template can also include the API Gateway extensions that define the specific integration information.
Exporting the HTTP APIs configuration to OpenAPI
OpenAPI template
An example of a direct integration from HTTP APIs to SQS is located in the Sessions With SAM repository. This example includes the following architecture:
The OpenAPI template handles the route definitions for the HTTP API configuration and configures the service integration. The template looks like this:
Because the OpenAPI template is included in the AWS SAM template via a transform, the API Gateway integration can reference the roles and services created within the AWS SAM template.
Conclusion
This post covers the concept of storage first integration patterns and how the new HTTP APIs direct integrations can help. I cover the five current integrations and possible use cases for each. Additionally, I demonstrate how to use AWS SAM to build and manage the integrated applications using infrastructure as code.
Using the storage first pattern with direct integrations can help developers build serverless applications that are more durable with fewer lines of code. A Lambda function is no longer required to transport data from the API endpoint to the desired service. Instead, use Lambda function invocations for differentiating business logic.
To provide the best experiences, we use technologies like cookies to store and/or access device information. Consenting to these technologies will allow us to process data such as browsing behavior or unique IDs on this site. Not consenting or withdrawing consent, may adversely affect certain features and functions.
Functional
Always active
The technical storage or access is strictly necessary for the legitimate purpose of enabling the use of a specific service explicitly requested by the subscriber or user, or for the sole purpose of carrying out the transmission of a communication over an electronic communications network.
Preferences
The technical storage or access is necessary for the legitimate purpose of storing preferences that are not requested by the subscriber or user.
Statistics
The technical storage or access that is used exclusively for statistical purposes.The technical storage or access that is used exclusively for anonymous statistical purposes. Without a subpoena, voluntary compliance on the part of your Internet Service Provider, or additional records from a third party, information stored or retrieved for this purpose alone cannot usually be used to identify you.
Marketing
The technical storage or access is required to create user profiles to send advertising, or to track the user on a website or across several websites for similar marketing purposes.