Post Syndicated from Ricardo Pacheco original https://blog.cloudflare.com/bot-attack-trends-for-jan-jul-2020/


Now that we’re a long way through 2020, let’s take a look at automated traffic, which makes up almost 40% of total Internet traffic.
This blog post is a high-level overview of bot traffic on Cloudflare’s network. Cloudflare offers a comprehensive Bot Management tool for Enterprise customers, along with an effective free tool called Bot Fight Mode. Because of the tremendous amount of traffic that flows through our network each day, Cloudflare is in a unique position to analyze global bot trends.
In this post, we will cover the basics of bot traffic and distinguish between automated requests and other human requests (What Is A Bot?). Then, we’ll move on to a global overview of bot traffic around the world (A RoboBird’s Eye View, A Bot Day and Bots All Over The World), and dive into North American traffic (A Look into North American Traffic). Lastly, we’ll finish with an overview of how the coronavirus pandemic affected global traffic, and we’ll take a deeper look at European traffic (Bots During COVID-19 In Europe).
On average, Cloudflare processes 18 million HTTP requests every second. This is a great opportunity to understand how bots shape the Internet, how much infrastructure is dedicated to these automated requests, and why our customers need a great bot management solution.
What Is A Bot?
Cloudflare groups traffic into four bot-related categories:
1. Verified
2. Definitely automated
3. Likely automated
4. Likely human
Our goal is to stop malicious and unwanted bots from harming our customers, while giving customers the opportunity to control how other automated traffic is managed.
We label each request that comes into Cloudflare with a “bot score” 1 through 99, where a lower score means that a request probably came from a bot. A higher score means that a request probably came from a human. This score is available in our Firewall, logs, and Workers, giving customers the flexibility to act on any score.
Cloudflare also maintains a challenge platform that customers can choose to deploy on suspected bots. You’ll recognize these as CAPTCHA challenges or JavaScript challenges. In fact, having the score available in Firewall Rules means that customers can take any action they choose. This platform can be used for mitigation, ensuring that unwanted traffic is stopped in its tracks.
To learn more about how Bot Management interacts with our firewall, check out our support page.
We track successes and failures during these challenges, which ultimately allows us to improve our detection systems. Assuming that our challenges are solvable by humans, effective detections should have low solve rates, given that they are usually presented to bots.
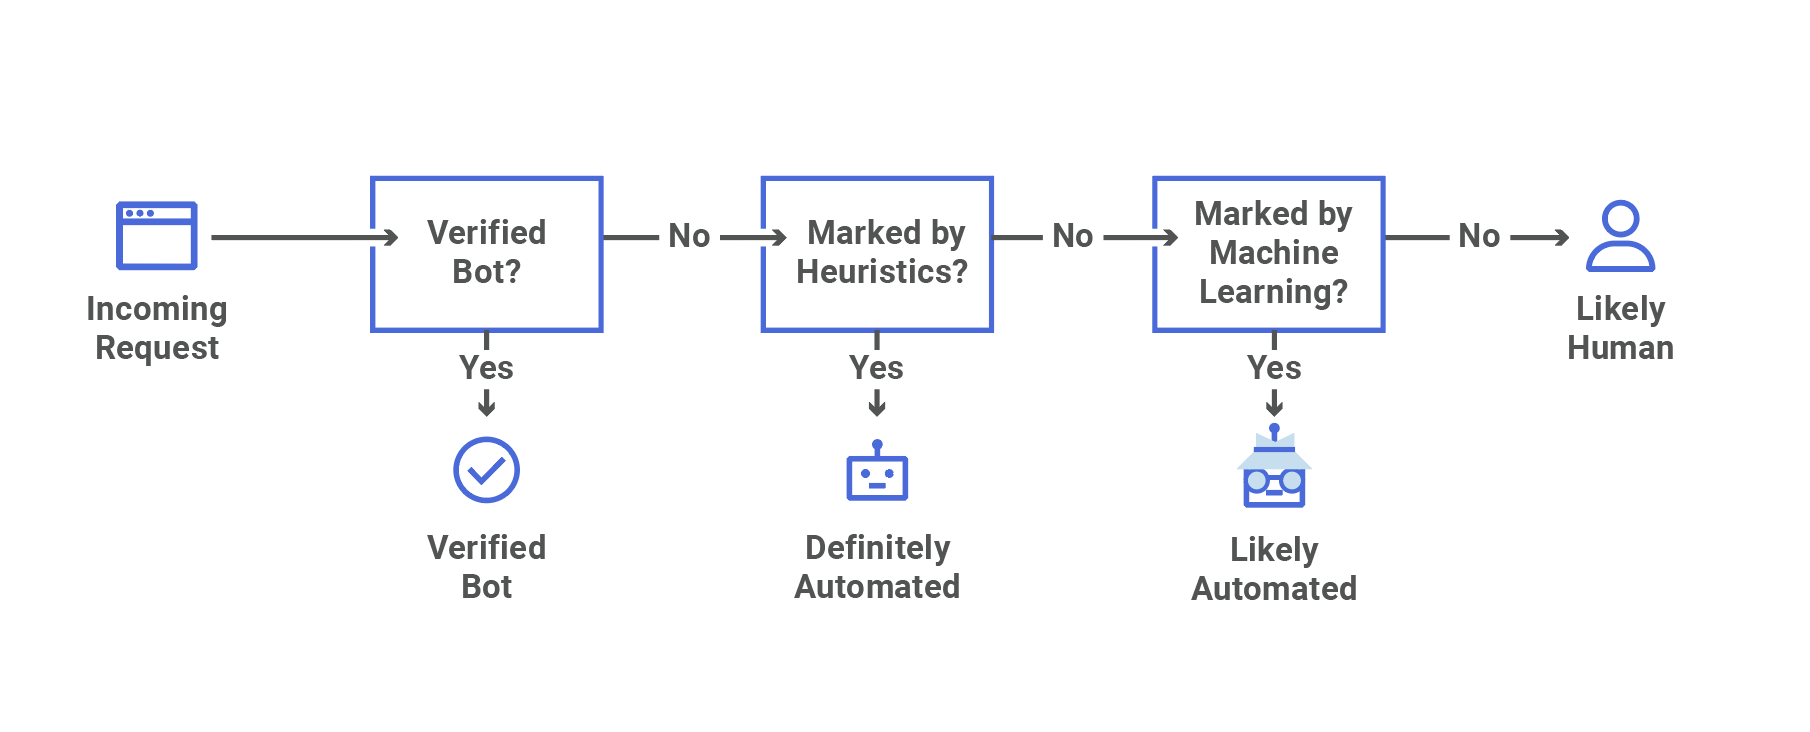
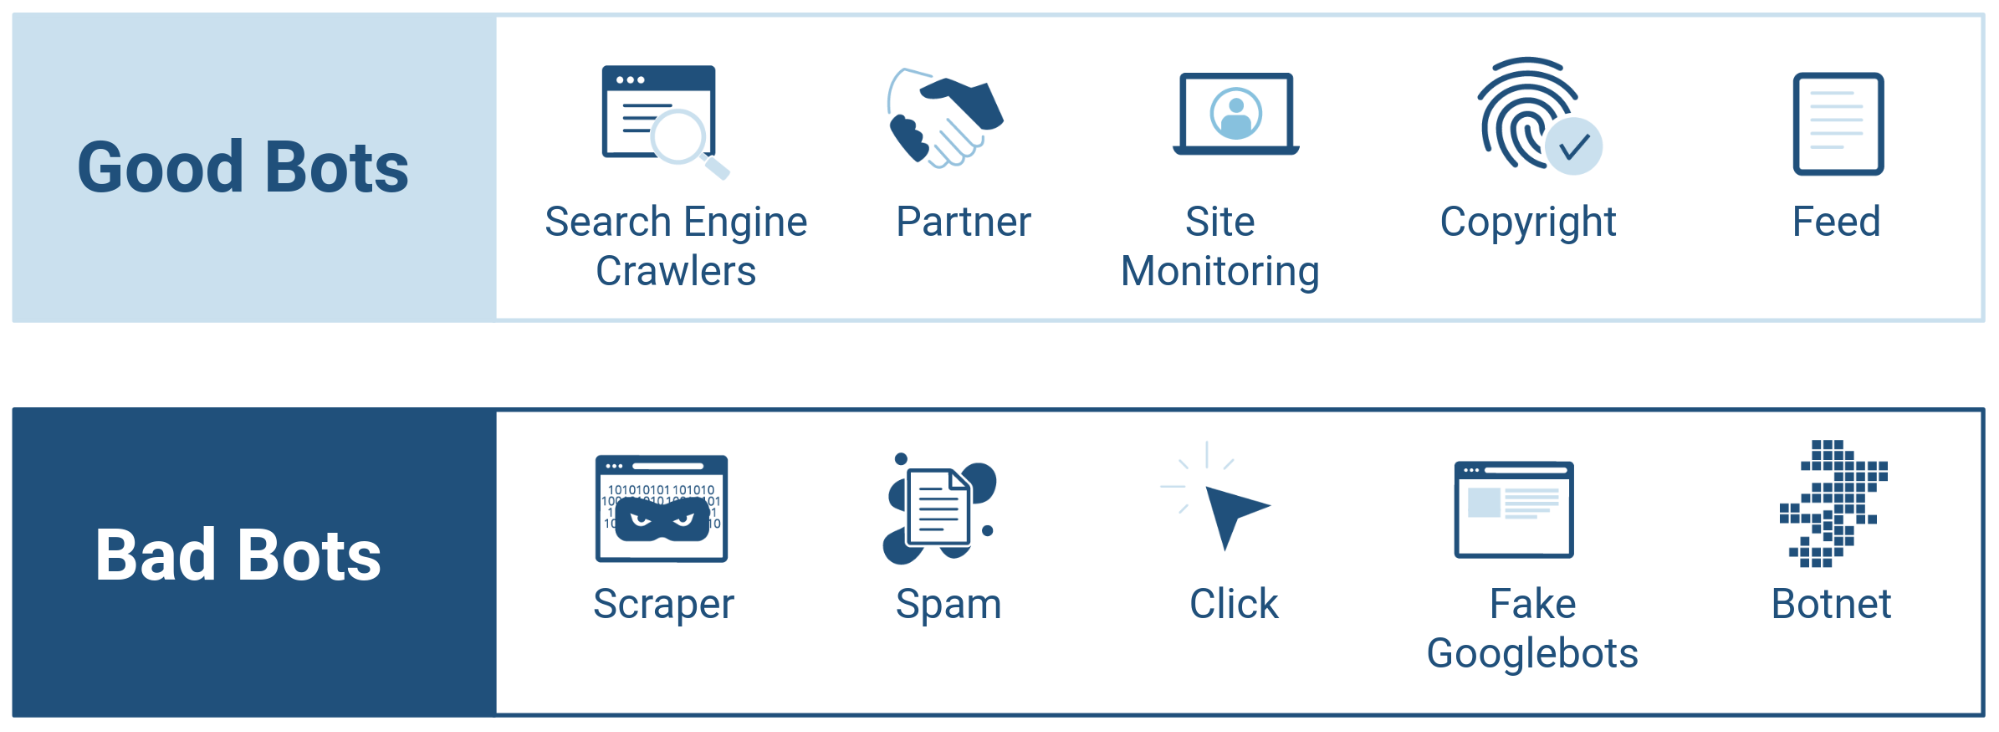
Verified bots are registered in an internal verified bot directory. These good bots power search engines and monitoring tools. Good bots enable our customers’ web pages to be found by search engines, for example.
For known non-verified bots (such as a scraper using a simple curl library), we keep a similar directory that is managed by our heuristics engine. If not otherwise verified, we consider requests caught by this engine to be definitely automated.
Our machine learning engine provides another way to identify potential bots. This engine identifies requests with a high probability of automation and marks them as likely automated. This detection mechanism benefits from models built on data from our global network.
If a request is not marked as automated, we mark it as likely human and pass along the bot score from our machine learning system.
We also have a behavioral analysis engine and a JavaScript detections engine. You can learn more about these systems by checking out Alex Bocharov’s previous post on Cloudflare Bot Management.
The two bot definitions for automated traffic are somewhat complementary. Requests caught by heuristic detections will not count towards machine learning detections. Requests that are reliably caught by our machine learning detections won’t need to be registered in our known heuristics bot directory. Because of this, we combine these two together when we discuss “automated traffic” in general.
A RoboBird’s Eye View
Data from this piece comes from information about Cloudflare’s customers, analyzed between January 15, 2020 and July 31, 2020.
First, let’s get a basic understanding of the traffic on our network.
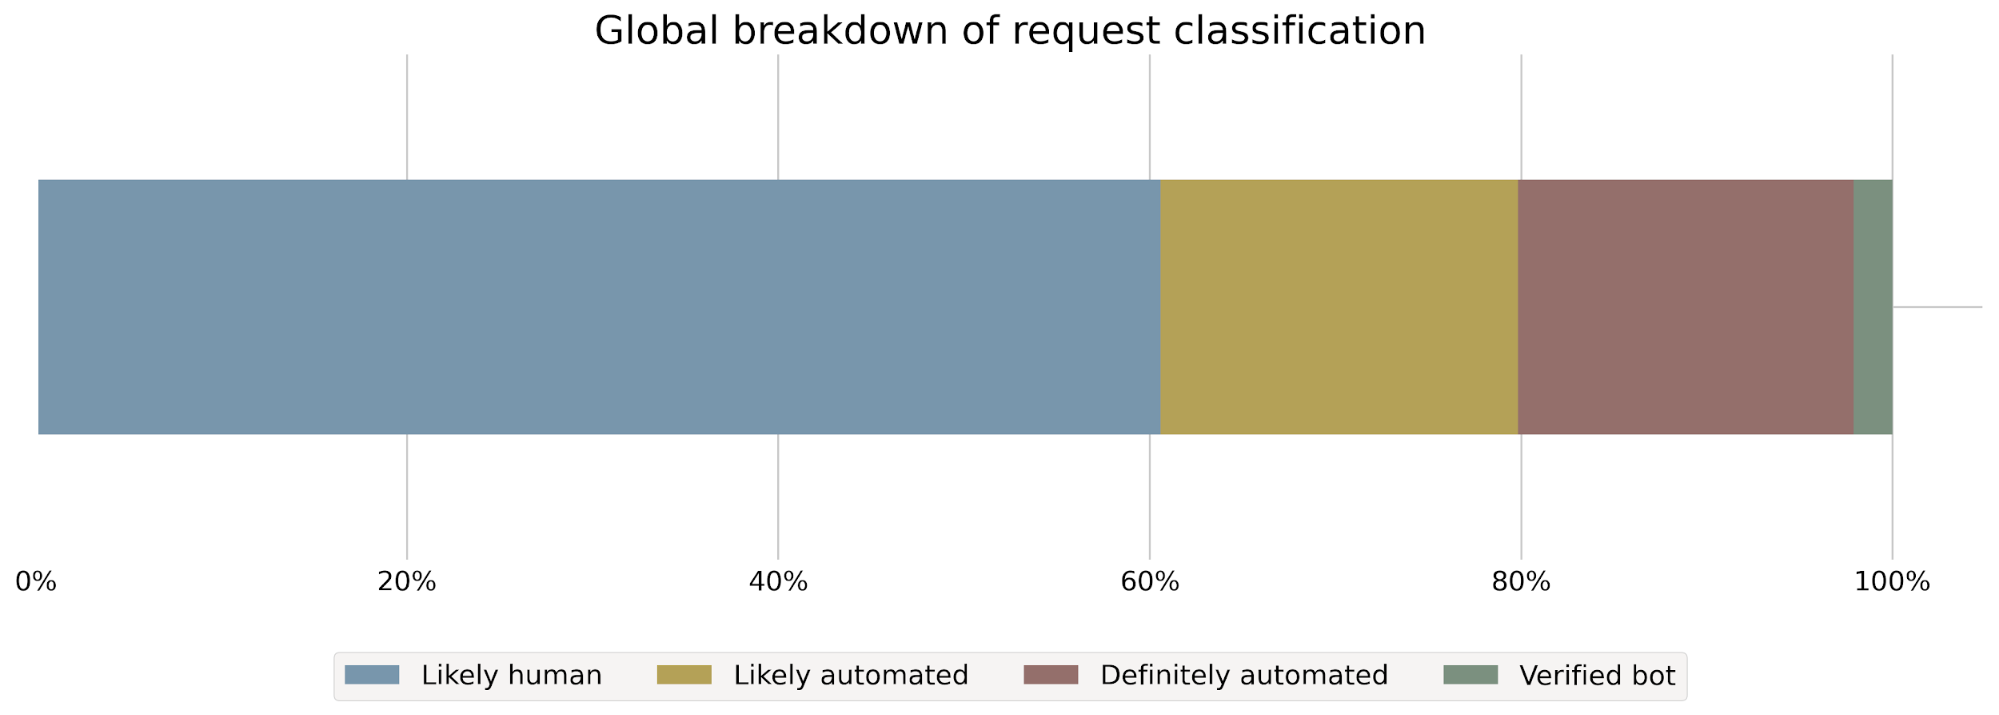
Figure 1.1 has a global breakdown regarding classification; 60.6% of traffic is likely human, 19.3% is likely automated, 18.1% is definitely automated and only 2.1% is from verified bots. In total, 39.5% of requests we score come from some kind of bot.
A Bot Day
Regular traffic fluctuates throughout the day. Do bots follow suit? Let’s check. Figure 2.1 represents traffic deviation from the average hourly traffic. An increase of 10% would mean that the hour is 10% busier than the average hour (measuring requests per hour). We include the total overall traffic in this chart to serve as a comparison to other types of traffic.
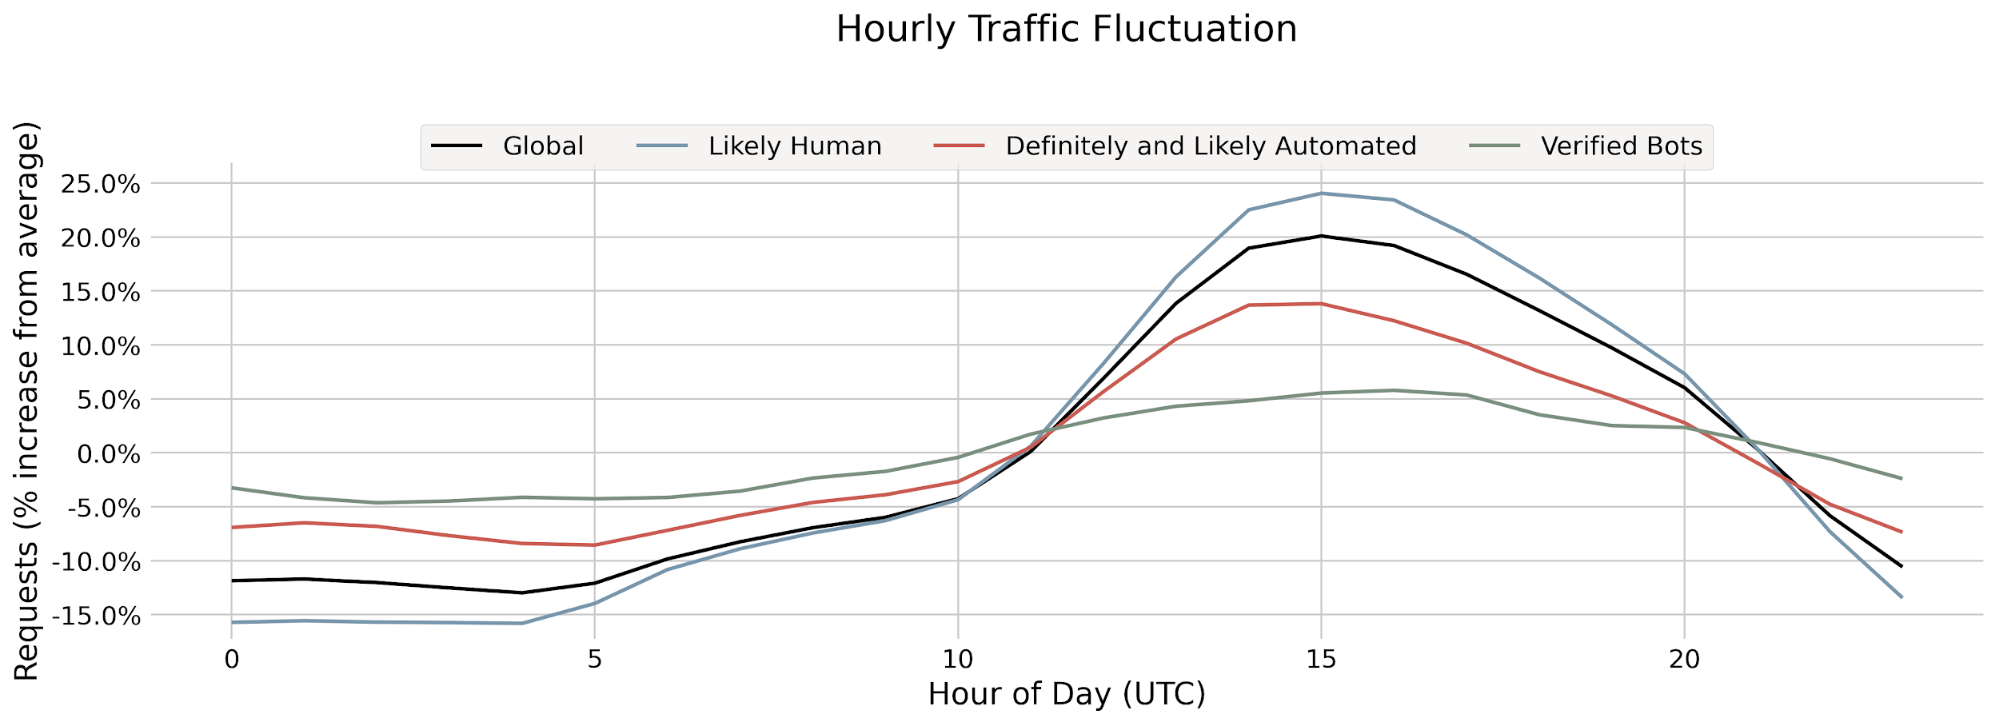
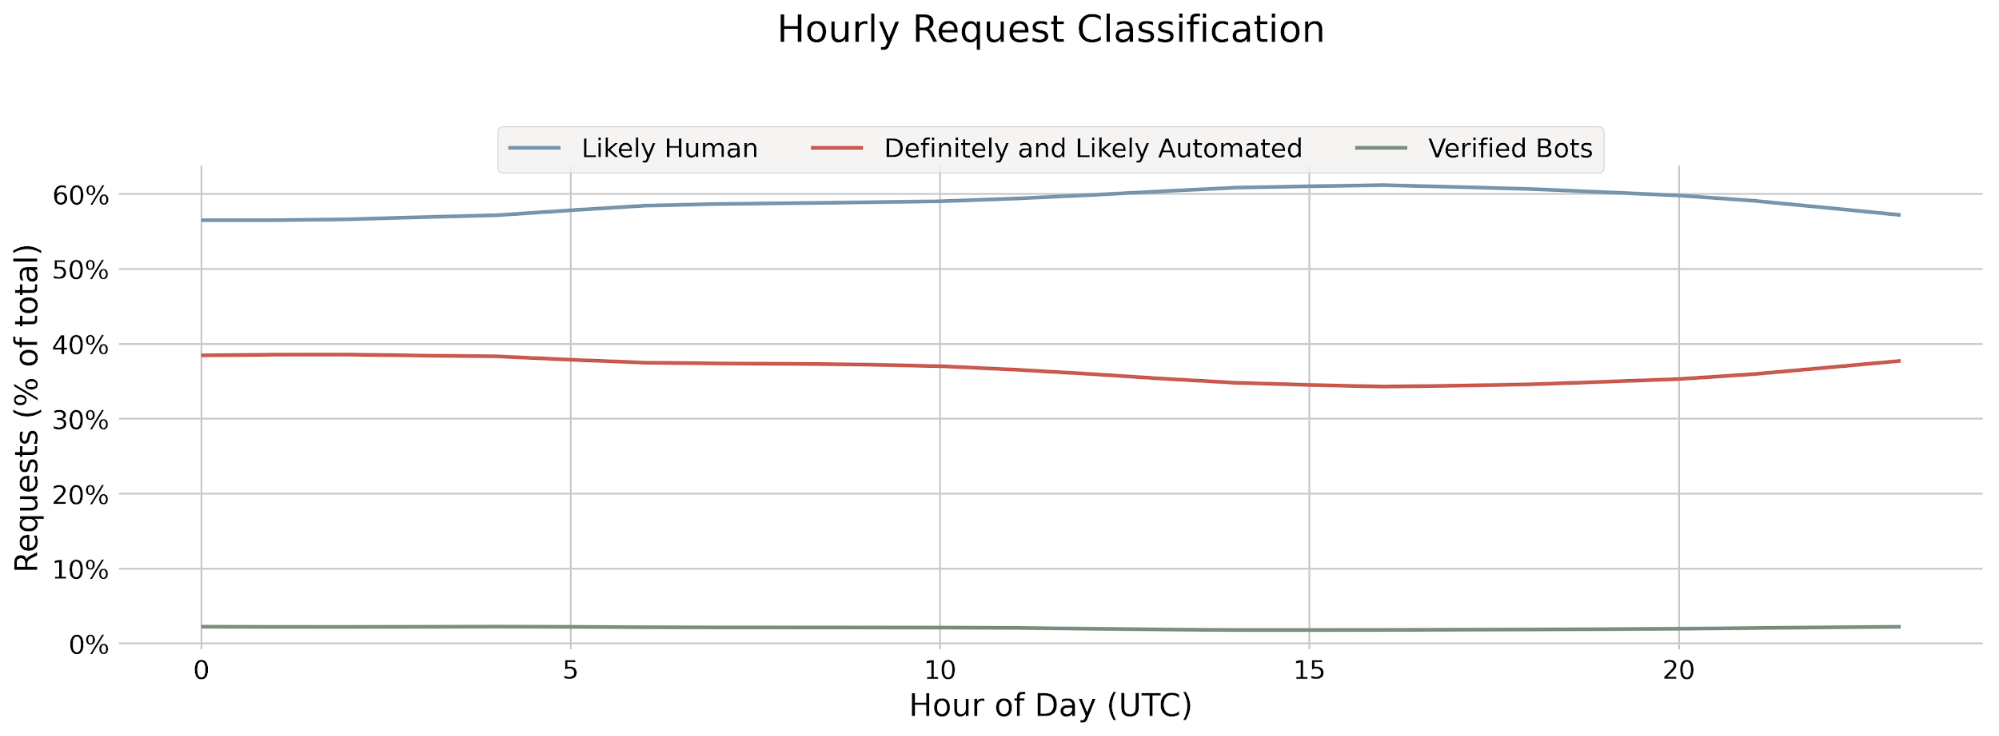
We can clearly see a difference between human traffic and bot traffic. Human traffic varies heavily, but predictably, throughout the day. We can see a 15% decrease in human traffic early in the day, between midnight and 05:00 UTC, corresponding to the end of business hours in the Americas, and up to a 25% increase during business hours, 14:00 to 17:00 UTC, where traffic is highest. Conversely, bot traffic is more consistent. Slow hours still see a smaller drop than overall traffic, and busy hours are less busy. The difference between good and bad bots is also apparent: good bots are even more consistent, with small fluctuations in hourly traffic.
But why would this happen? A large portion of bots, good and bad, perform the same task across the Internet. Bad bots may be scraping websites or looking to infect unprotected machines, and they will do this with little intervention from human operators. Good bots could be doing some of these operations, but less frequently and in a more targeted fashion. A good bot scraping a website may be doing so to add it to a search engine, while a bad bot will do the same thing at a much higher rate, for other reasons.
A lot of bots follow business hours. For example, sneaker bots—focused on nabbing exclusive items from sneaker stores—will naturally be active when new products launch.
This difference in volume does not mean that our classifications are affected: our scores remain consistent throughout the day, as Figure 2.1 shows.
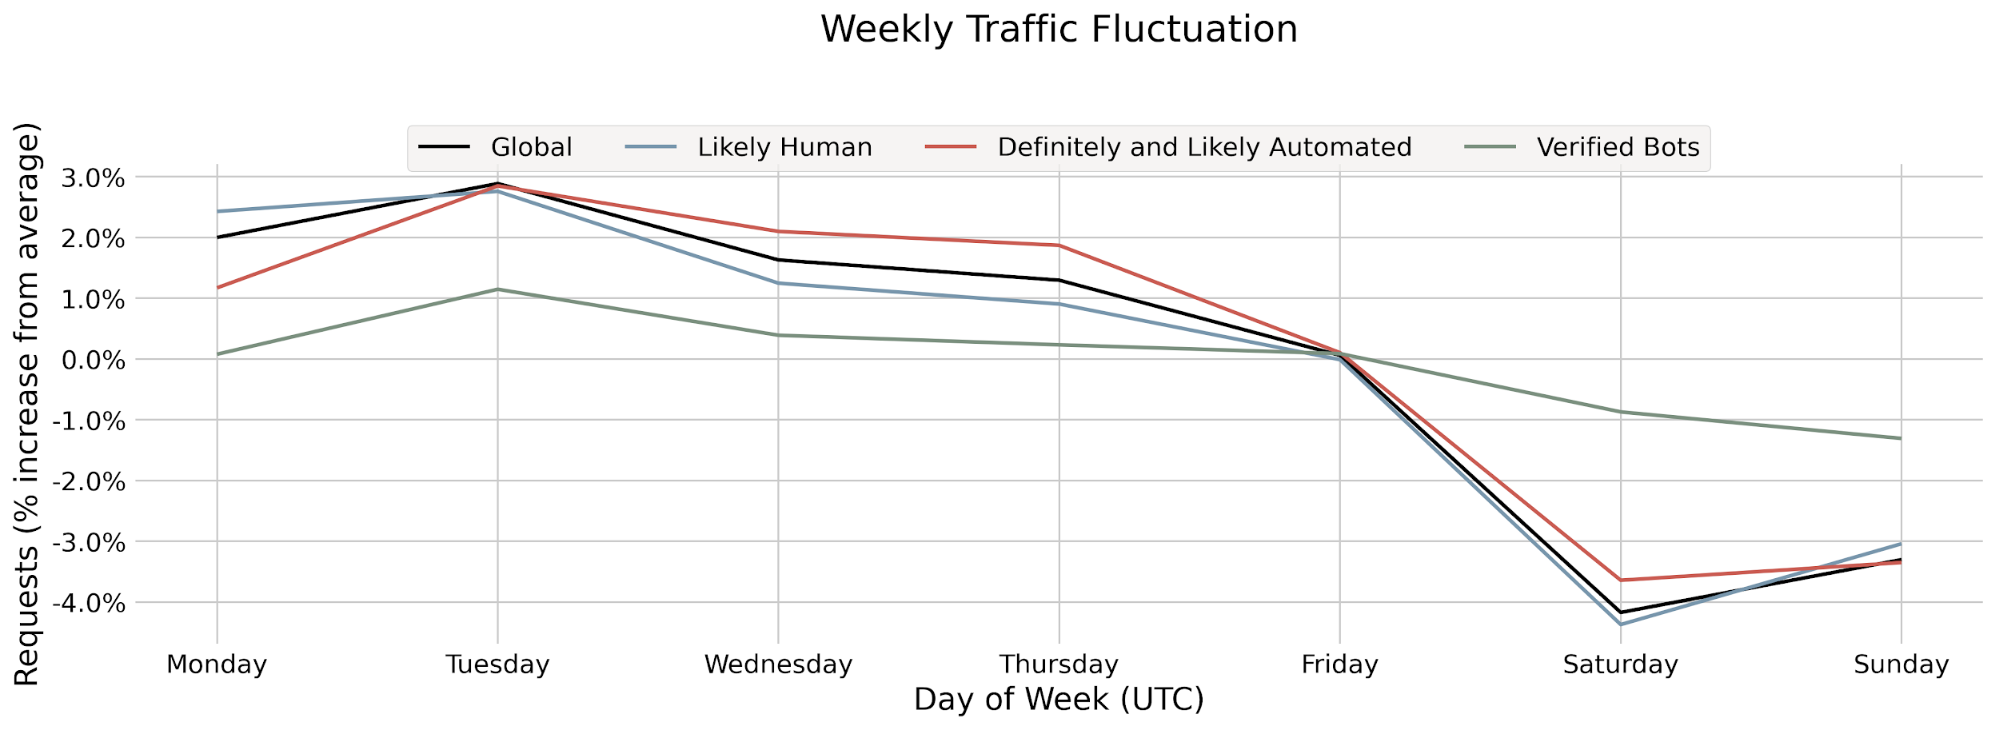
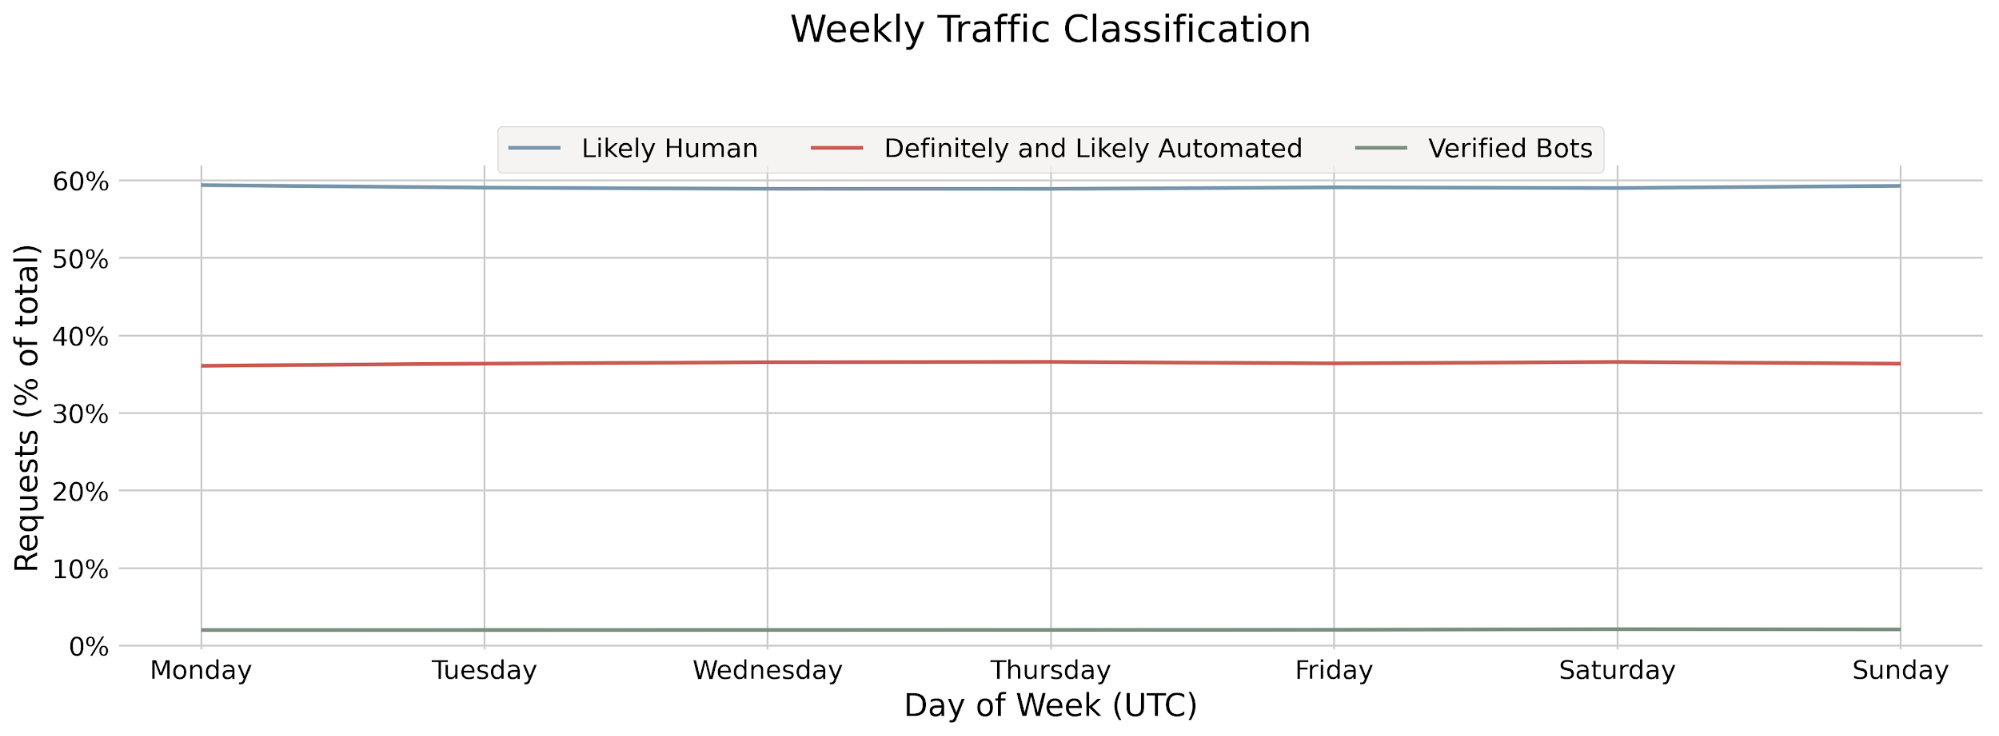
We can also see that good bots don’t take weekends off. Weekdays and weekends have fairly marked differences for most traffic, but good bots keep a consistent schedule. Whereas a typical weekday is slightly above average, we can see a drop of about 4% in overall traffic. This does not fully apply to verified bots, which only see a small 1% drop in traffic.
Bots All Over The World
Now that we’ve taken a look at global traffic, let’s dig a little deeper.
Different regions have distinct traffic landscapes regarding automated traffic.

Figure 3.1 breaks down traffic by region, letting us peek into where each type of traffic comes from. North America stands out as a major automated traffic source; over 50% of definitely automated traffic comes from there, and they also contribute almost 80% of all verified bot traffic. Europe makes up the second largest chunk of traffic, followed by Asia.
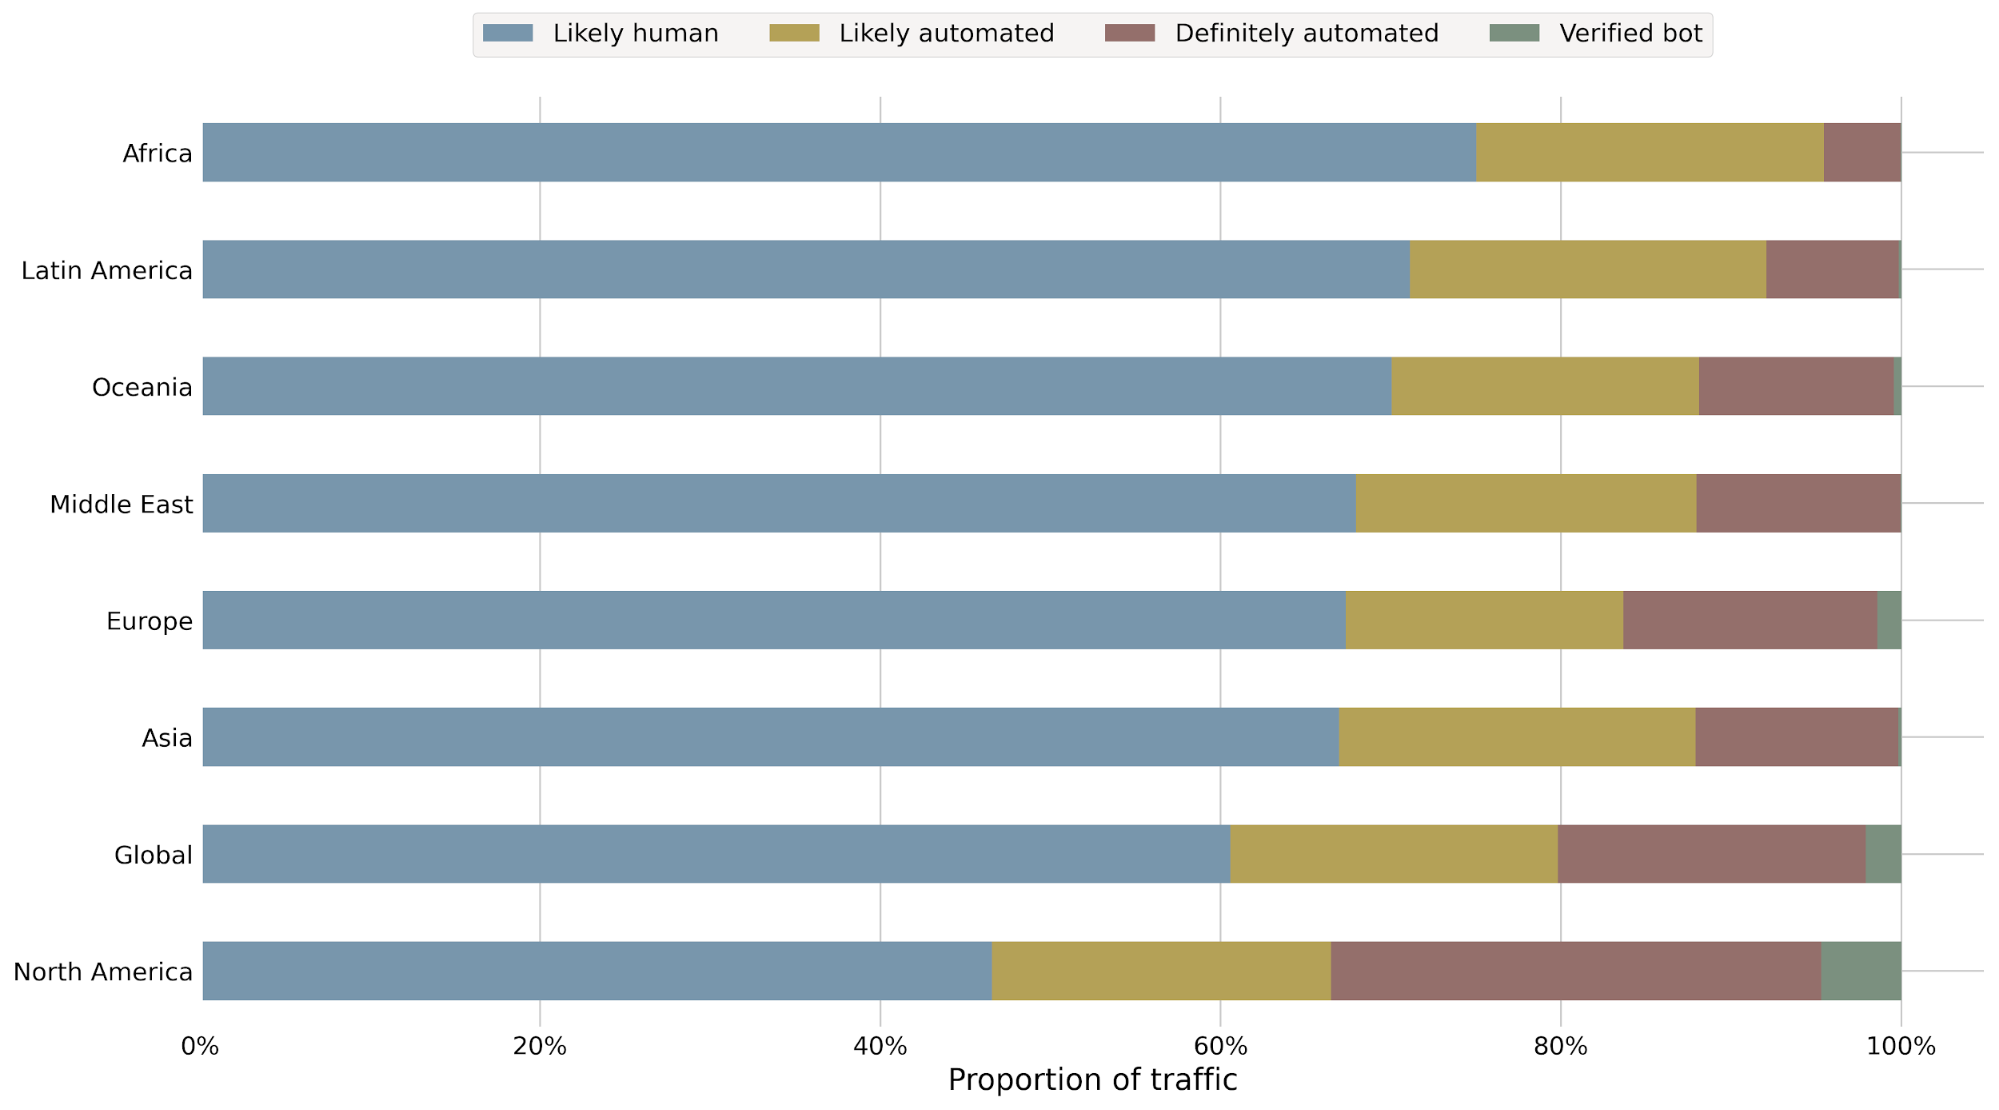
Looking at regional breakdown of traffic in Figure 3.2, we can see just how much North American traffic is automated, well above the global average.
A Look into North American Traffic
As the largest source of automated traffic, North America deserves a closer look.
First, we’ll start with a breakdown of each country.
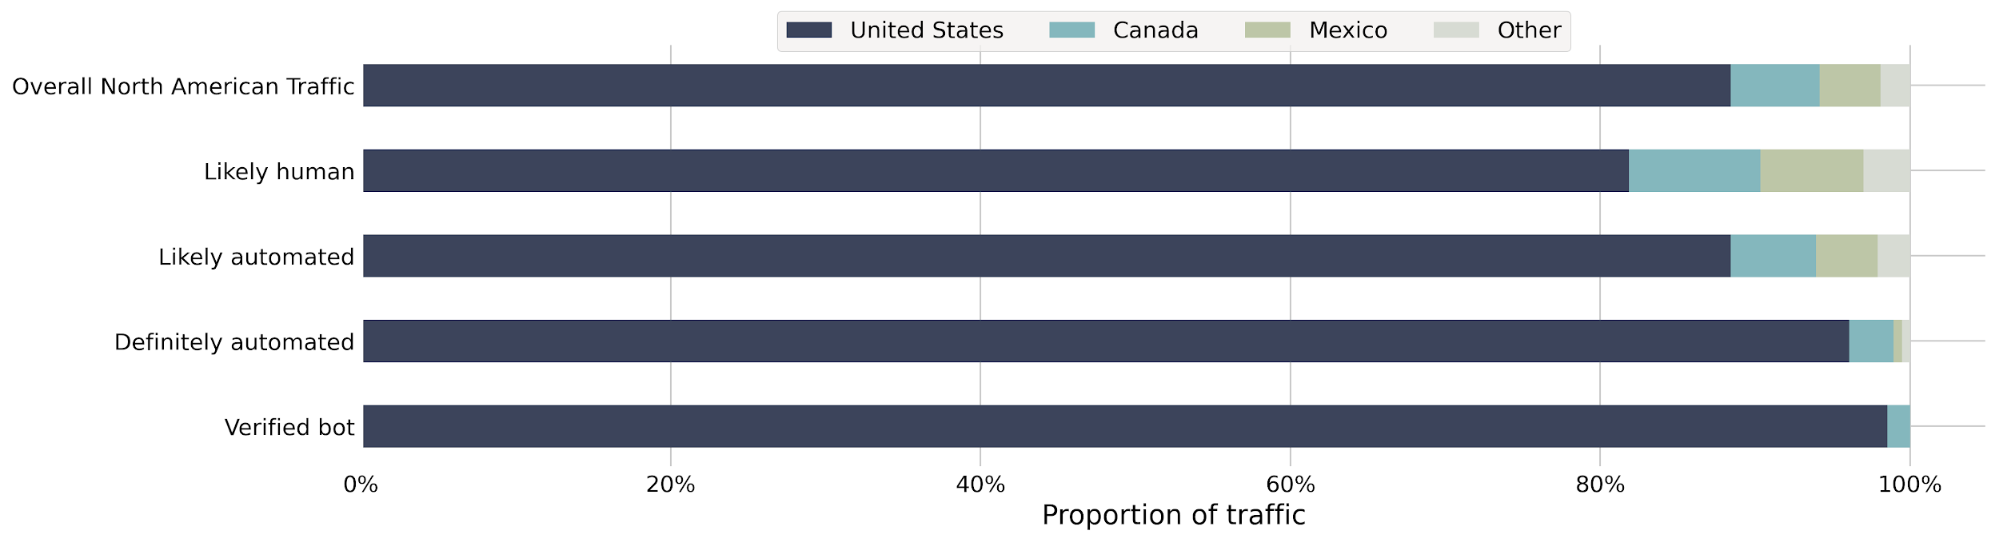
Most of our requests in North America come from just three countries—the United States, Canada and Mexico. These account for 98% of all requests from North America, 97% of all requests from likely human sources and 100% of requests from verified bots. The United States alone accounts for 88% of total requests, 82% of requests from likely human sources, 96% of requests from definitely automated sources, 88% of requests from likely automated traffic sources and 98% of requests from verified bot.
However, this alone does not mean that the United States has an unusual amount of activity. These countries have a combined population of roughly 497 million people. The United States accounts for 66.5% of that, Mexico 25.9% and Canada 7.6%. With this context, we can see that the United States is overrepresented in terms of raw requests, but underrepresented in terms of how much of that traffic is likely to be human. Conversely, Canadian traffic is more likely to be human.
Let’s take another look at each country.
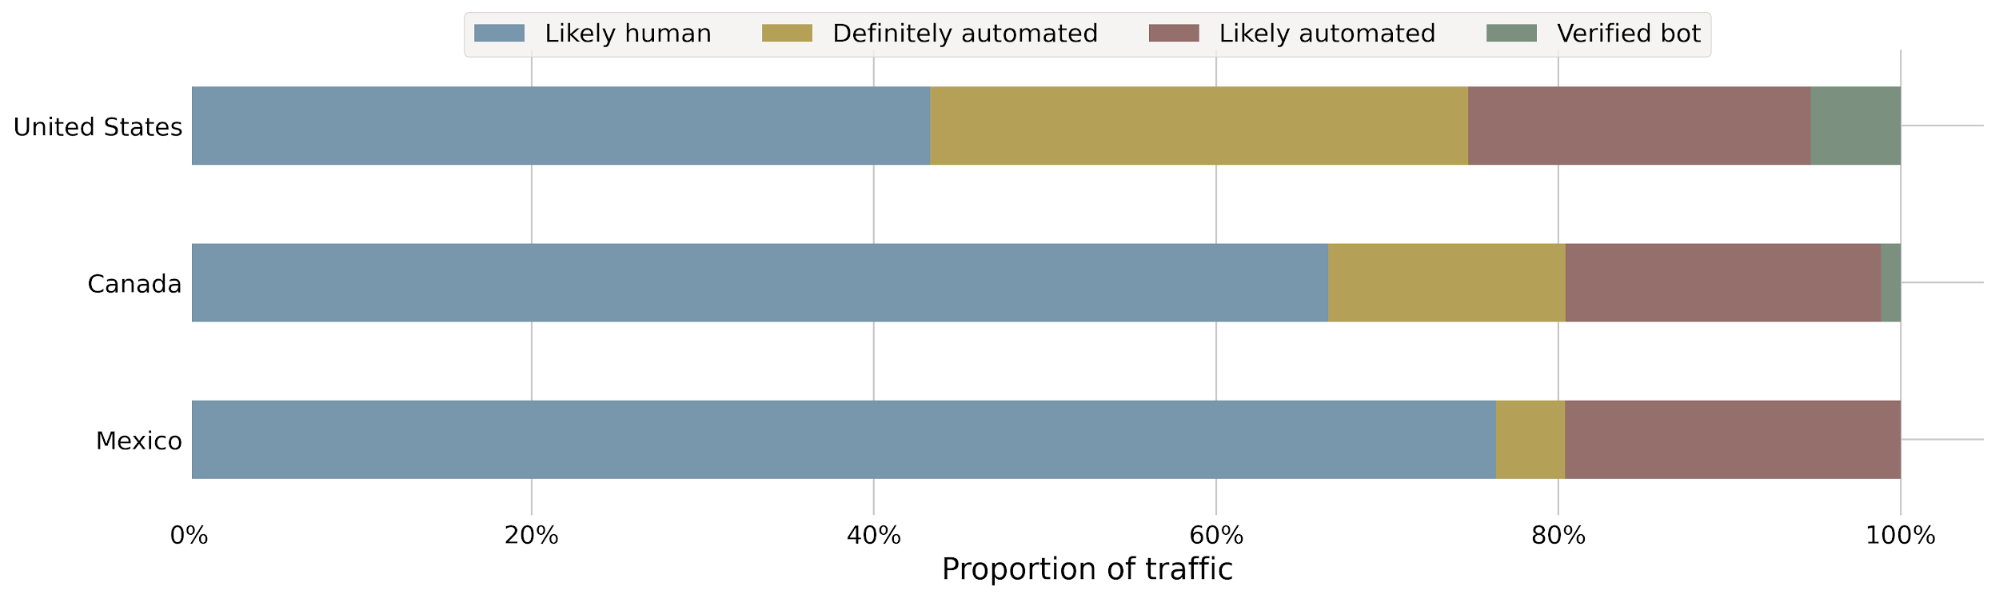
Over half of the traffic from the United States is automated in some way, which is a clear departure from trends in Mexico and Canada.
American Bots
So far, we’ve seen how much the United States contributes to automated traffic. If we want to go deeper, a good place to start is by understanding how these bots get online. We can do this by examining the networks from which the traffic originates. Networks are identified by Autonomous System Numbers, or ASNs. These form the backbone of the Internet infrastructure.
Think of these as Internet Service Providers, but facing inward towards the network instead of outward towards end consumers. ISPs like Comcast and Verizon are examples of residential ASNs, where we expect mostly human traffic. Cloud providers such as Google and Amazon are also ASNs, but targeted towards cloud services. We expect most of these requests to be automated in some way.
Looking at traffic on the ASN level is important because we can identify cloud-based traffic, or traffic using residential proxies, among others.
Let’s take a look at which ASNs are associated with visitors in the United States. We’ll restrict ourselves to “eyeball” traffic, which is the term we use for requests coming from site visitors.
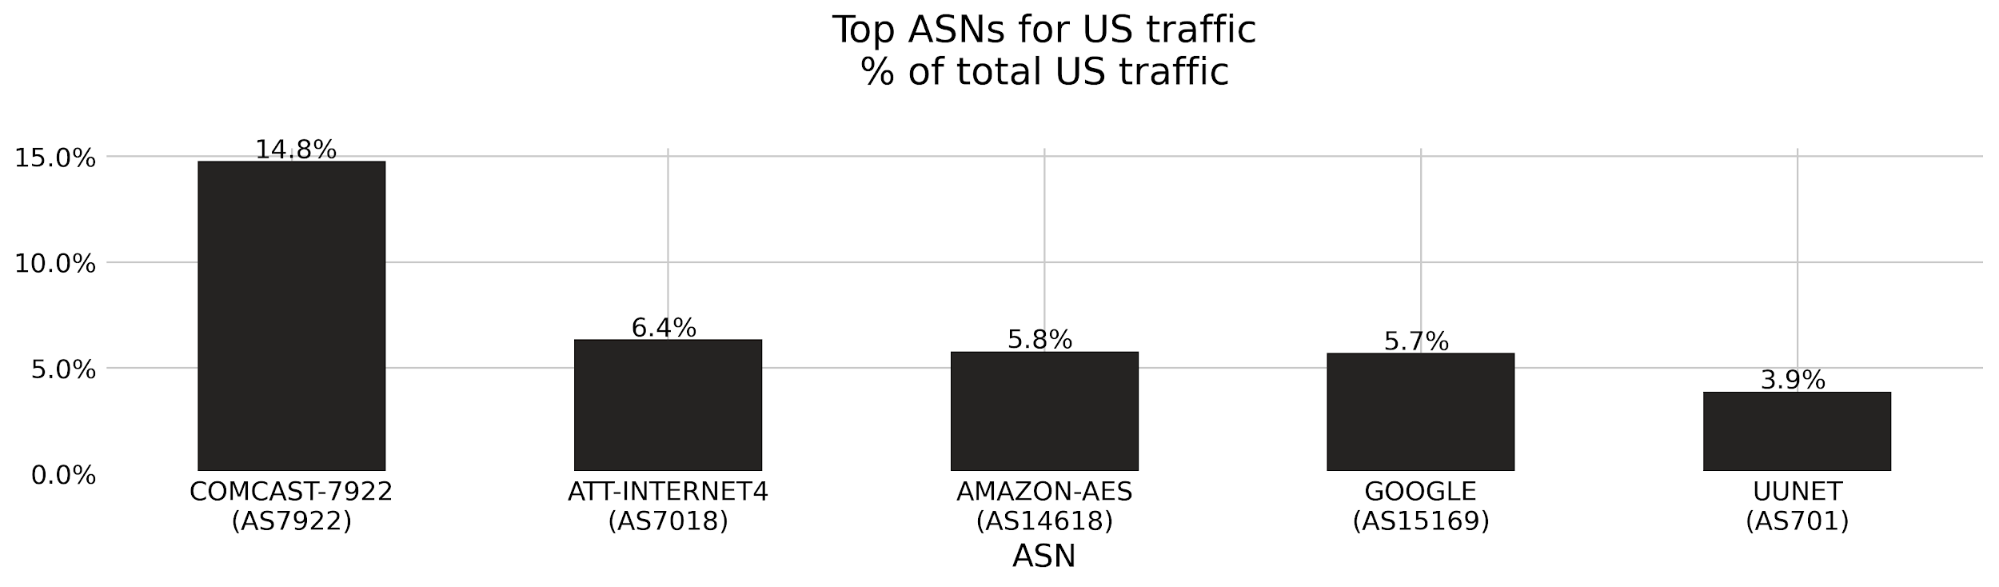
From figure 4.1 we can clearly see the impact that cloud services have on traffic; 11.5% of all eyeball traffic comes from Amazon and Google.
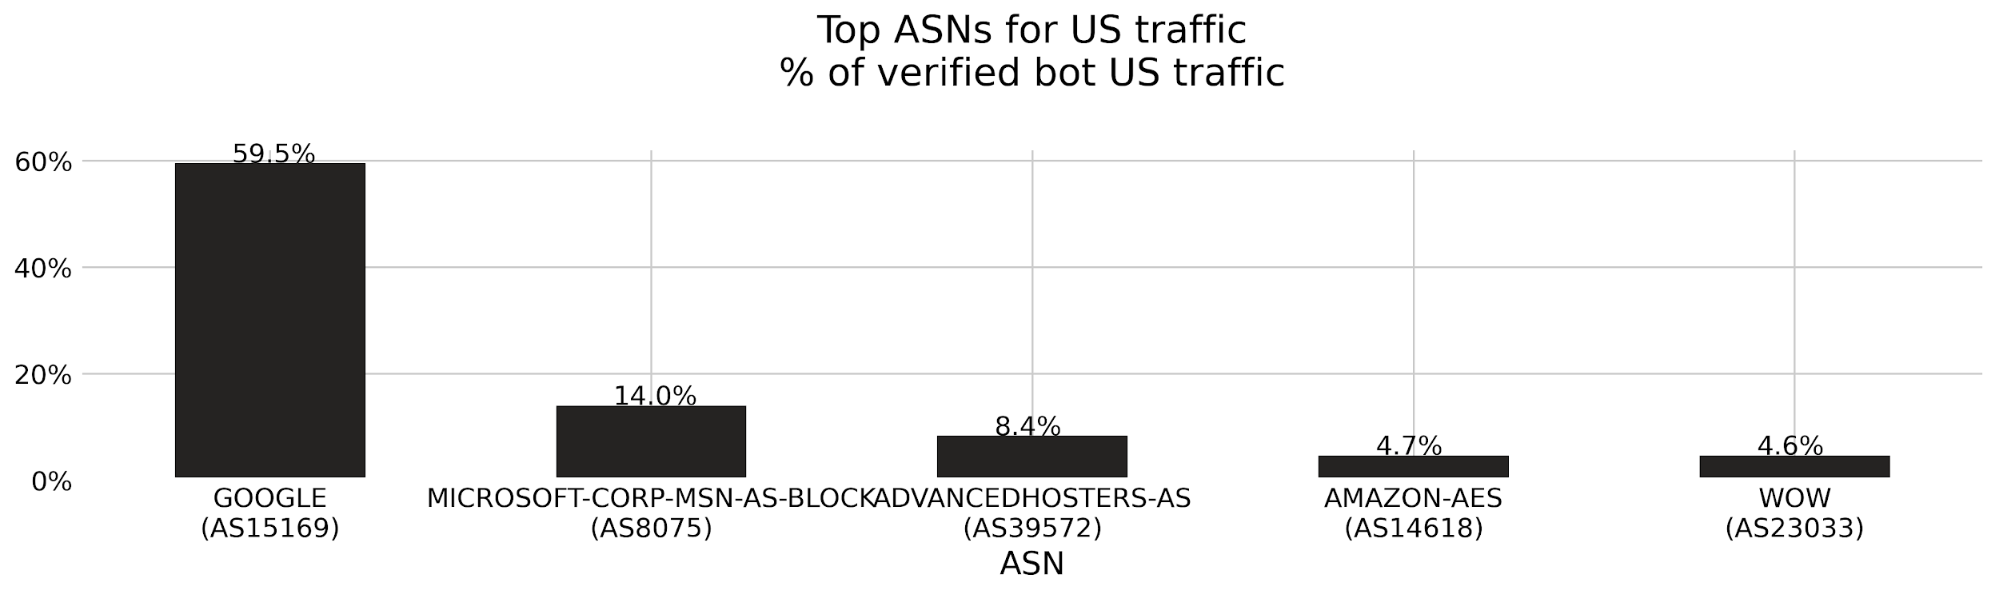
Verified bots operate in a different landscape, coming from cloud providers such as Amazon, Google, Microsoft, Advanced Hosting and Wowrack.
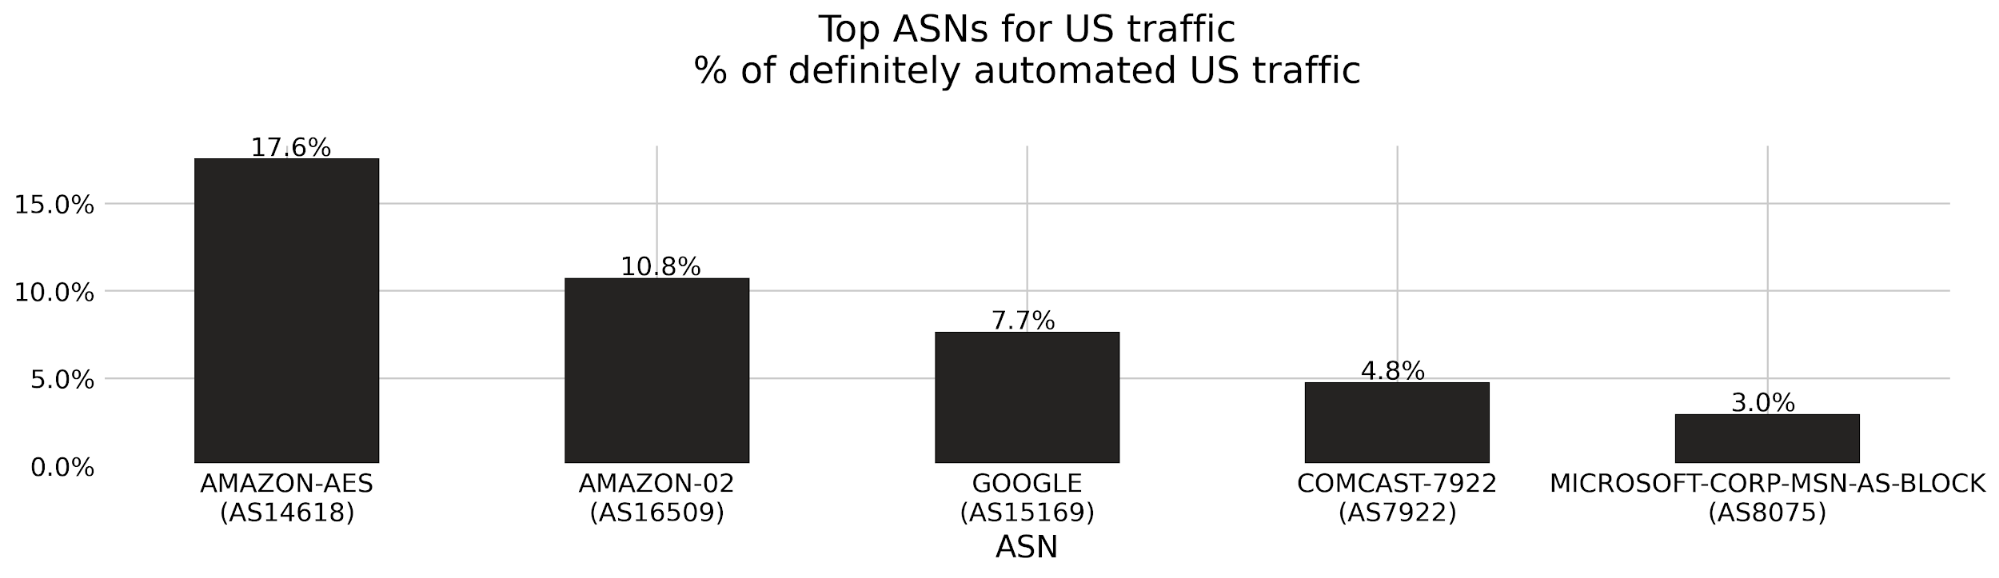
Automated traffic has a variety of ASNs. Cloud providers such as Amazon, Google and Microsoft make up the 30% of automated traffic. Comcast also makes up a significant portion of traffic at 4.8%, indicating that some bots come from residential services.
Bots During COVID-19 In Europe
Lockdowns and limits on public events came as a consequence of the ongoing coronavirus pandemic. Many people have been working from home, and even those who do not have this option are using the Internet in new ways. Overall, this has meant that Cloudflare’s network has grown tremendously.
But how does this impact bot traffic? First let’s get an idea of how it impacted traffic in general. Countries were impacted by the virus at different times, so we expect to see differences, right?
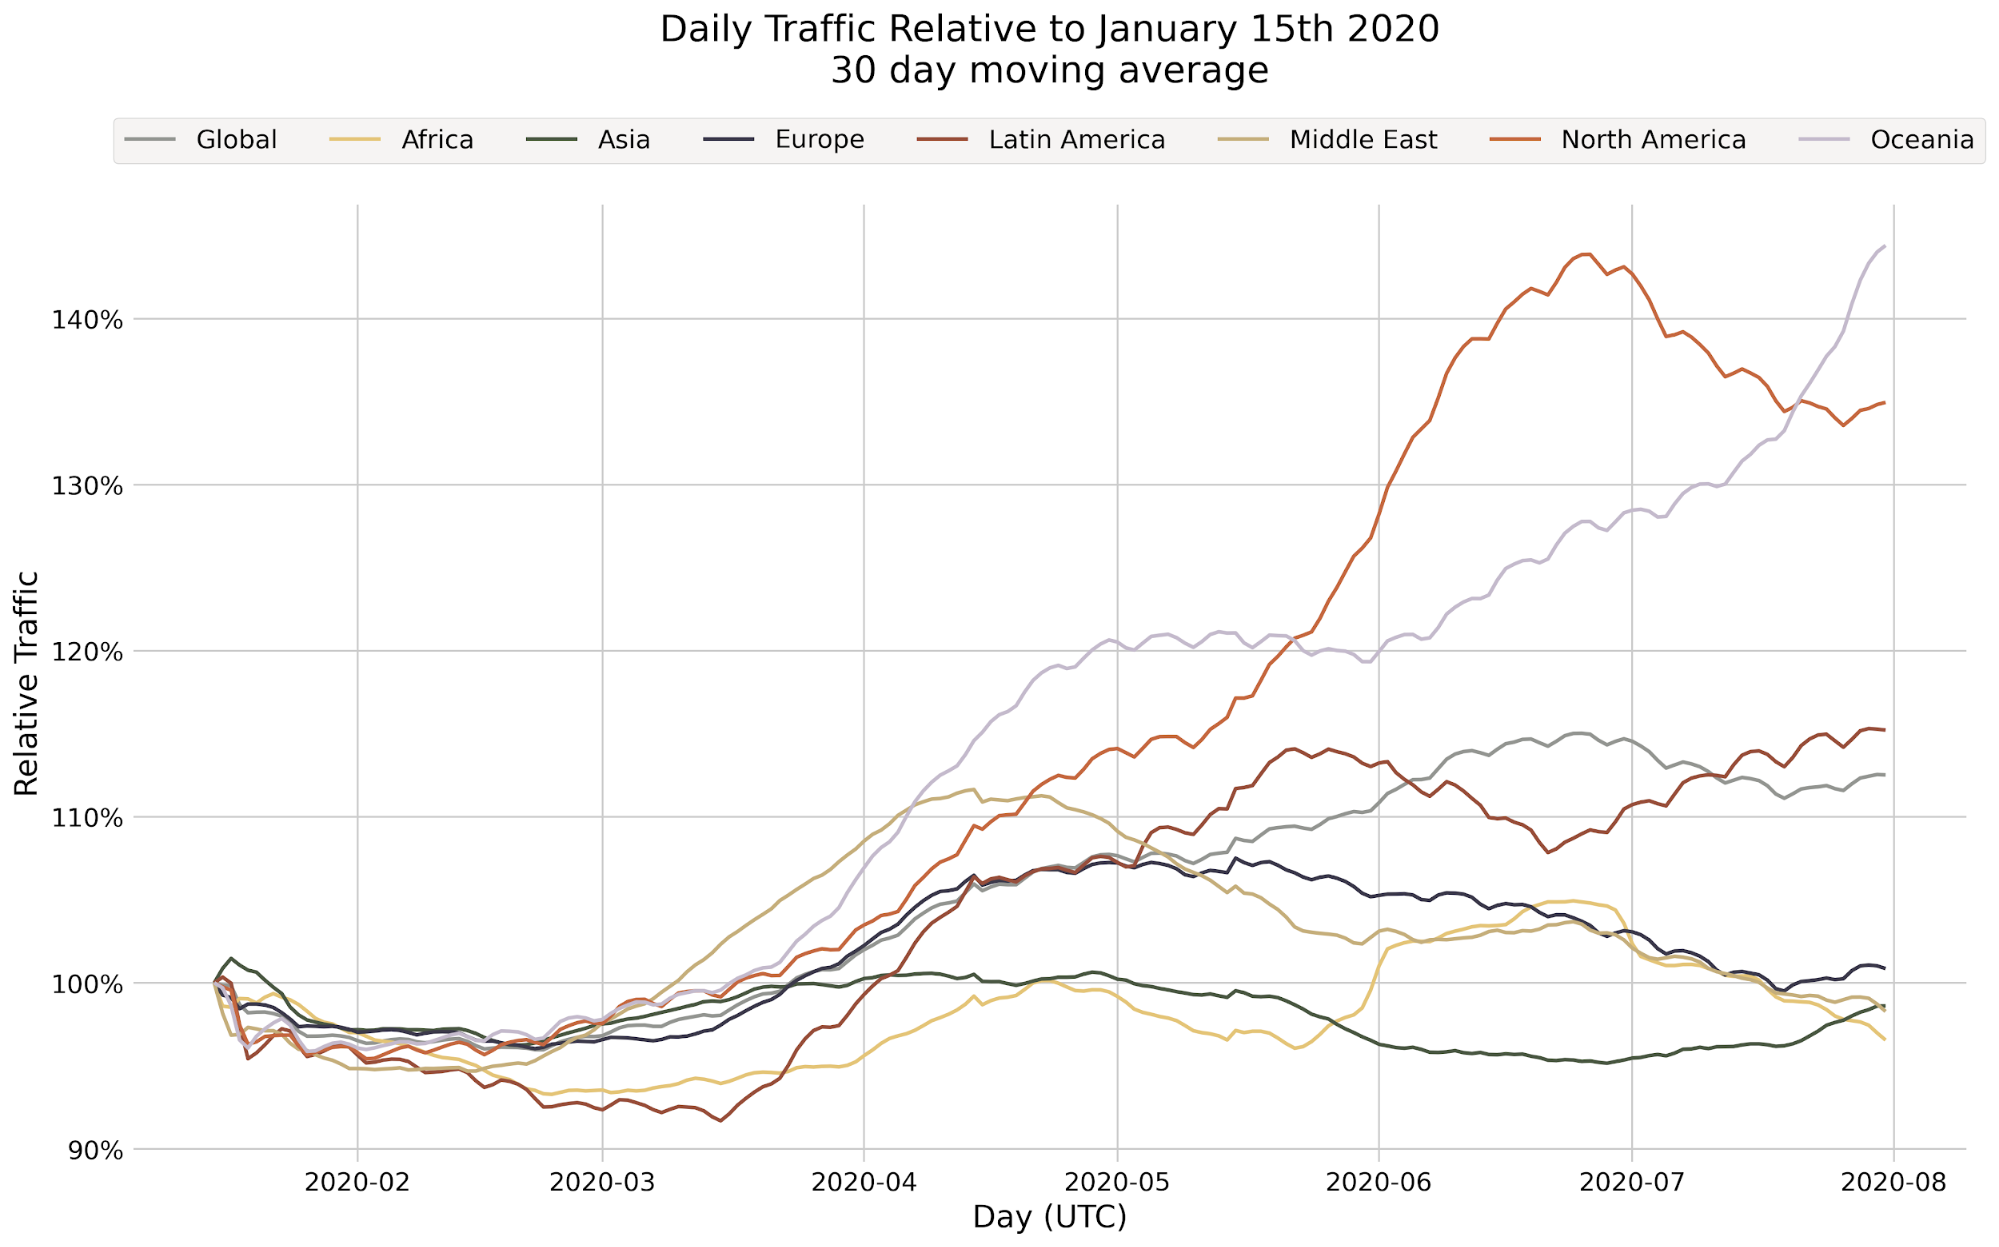
Figure 5.1 has just the traffic increase. Globally, we are seeing an average increase of 10%, while North America saw an increase of over 40% compared to the beginning of the year. Some regions did not change much, such as Africa and Asia, while others, such as Europe saw an increased period, but has since normalized to previous levels.
Let’s look at a few countries, so we can understand what this looks like.
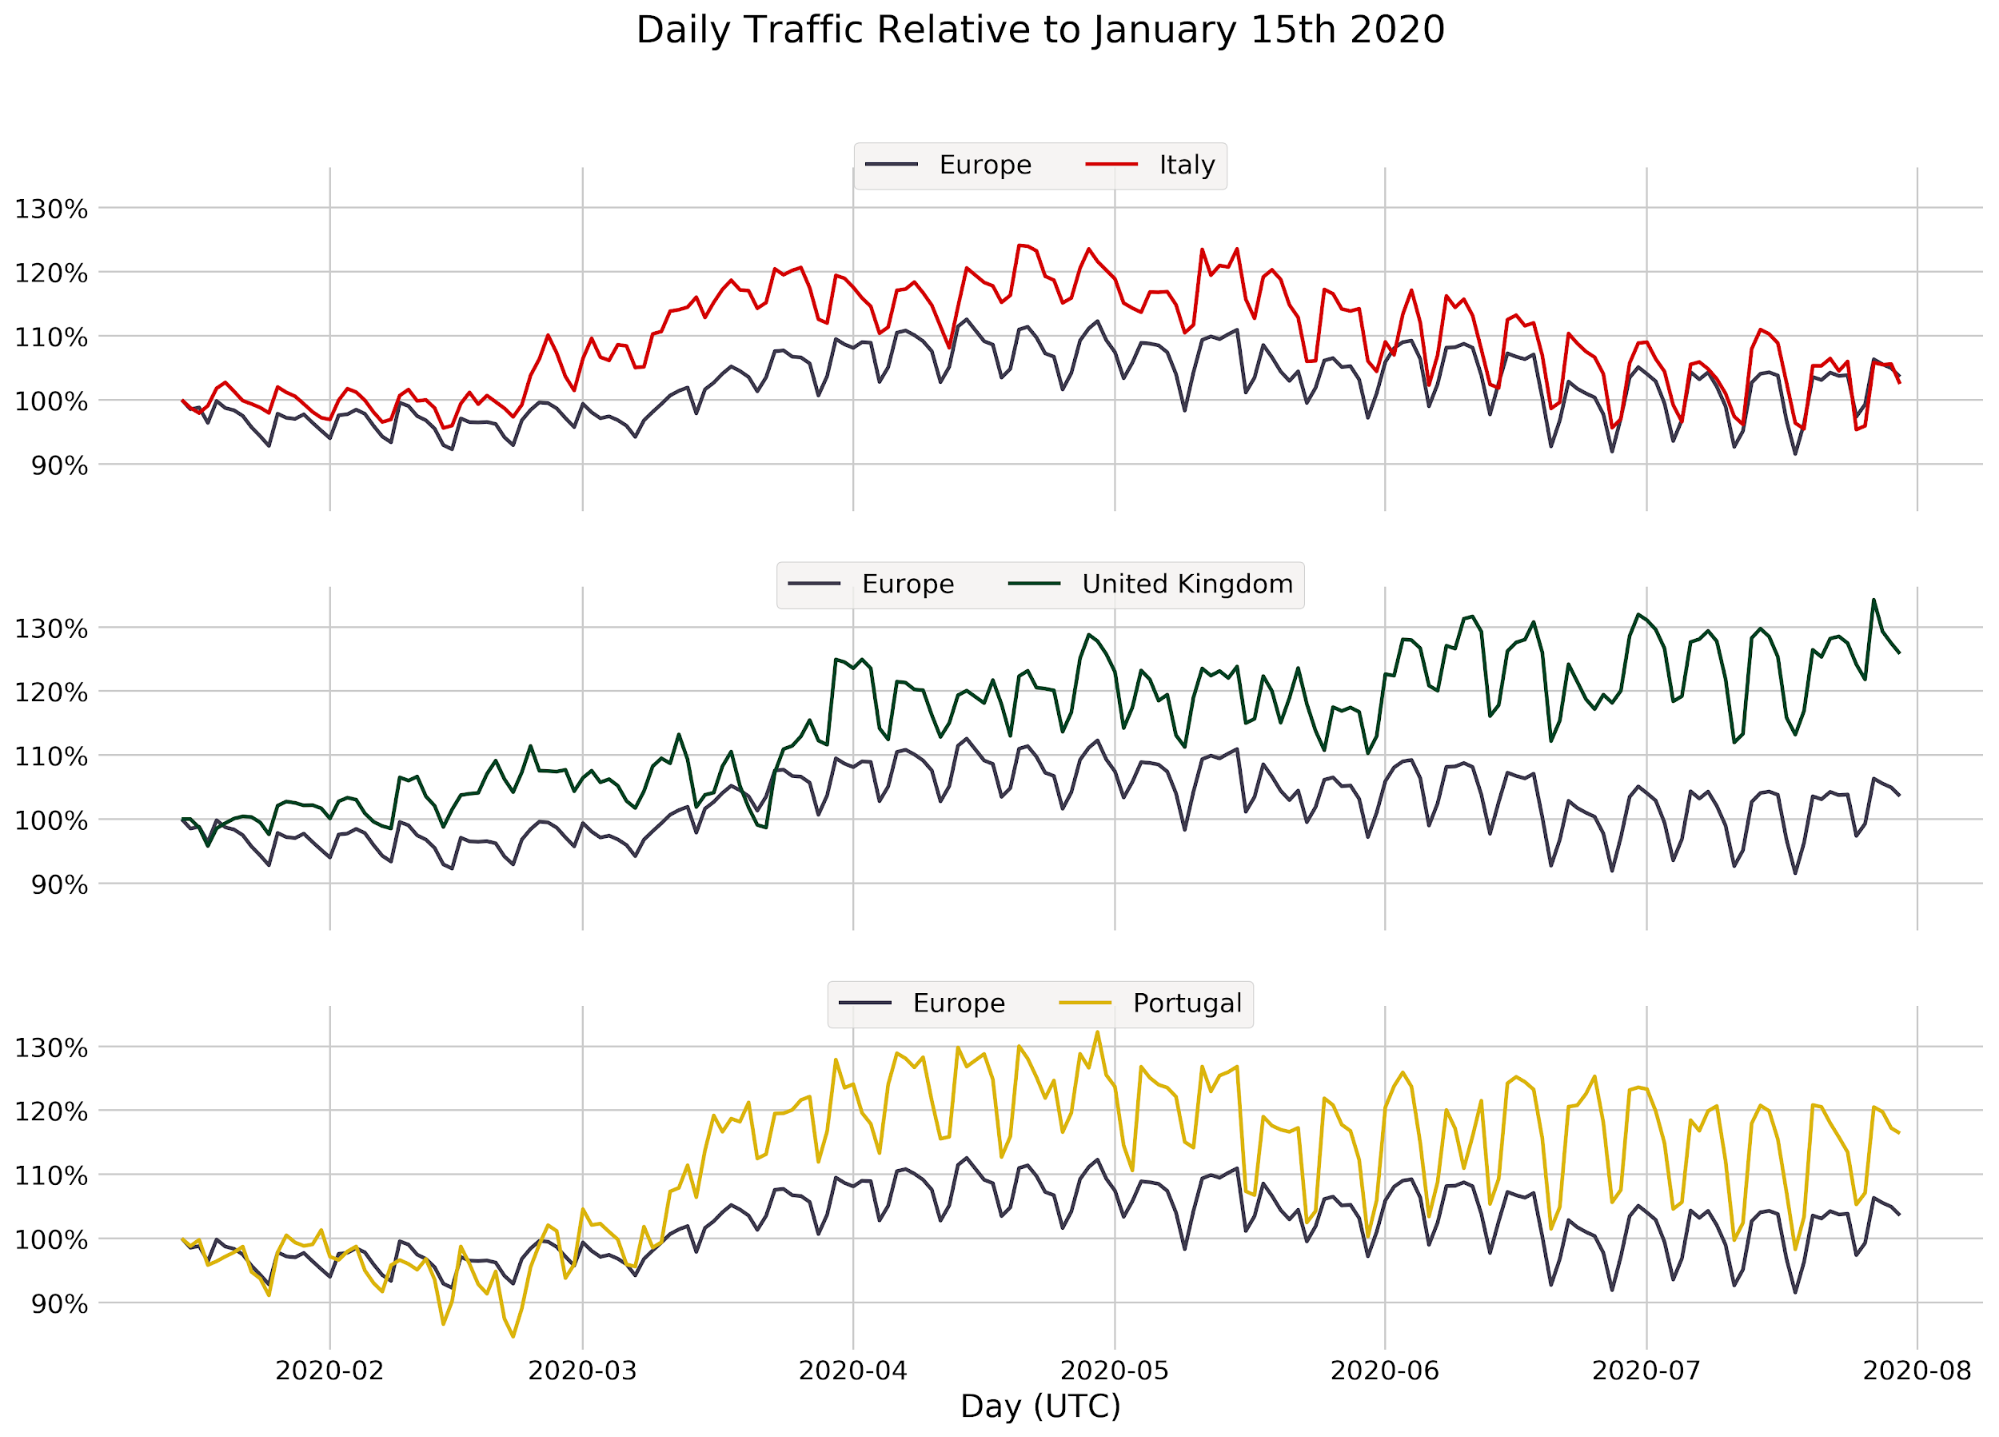
Figure 5.2 shows daily traffic relative to January 15, when data collection started. For comparison, we have overall European traffic, and three selected countries: Italy, the United Kingdom and Portugal. Italy was picked because it was one of the first countries in Europe to face the worst of the coronavirus and enact lockdown measures. The United Kingdom took another strategy, with an initial focus on herd immunity, and enacted measures later than the others. Portugal is somewhere in between, locking down later than Italy, in slightly different circumstances.
At the beginning of the year, traffic kept stable and fluctuations kept in line with the European average. As lockdown measures began, traffic increased. Italy was first out of these countries, rising a few weeks before the others, and keeping well above average. Eventually, all countries saw a growth in traffic, followed by a stabilization. Italy seems to have adjusted to a normal, with its growth in line with the European average. Portugal has also stabilized, but with busier weekdays. Conversely, the United Kingdom showed no signs of stopping, exceeding a growth of 40% compared to the beginning of the year.
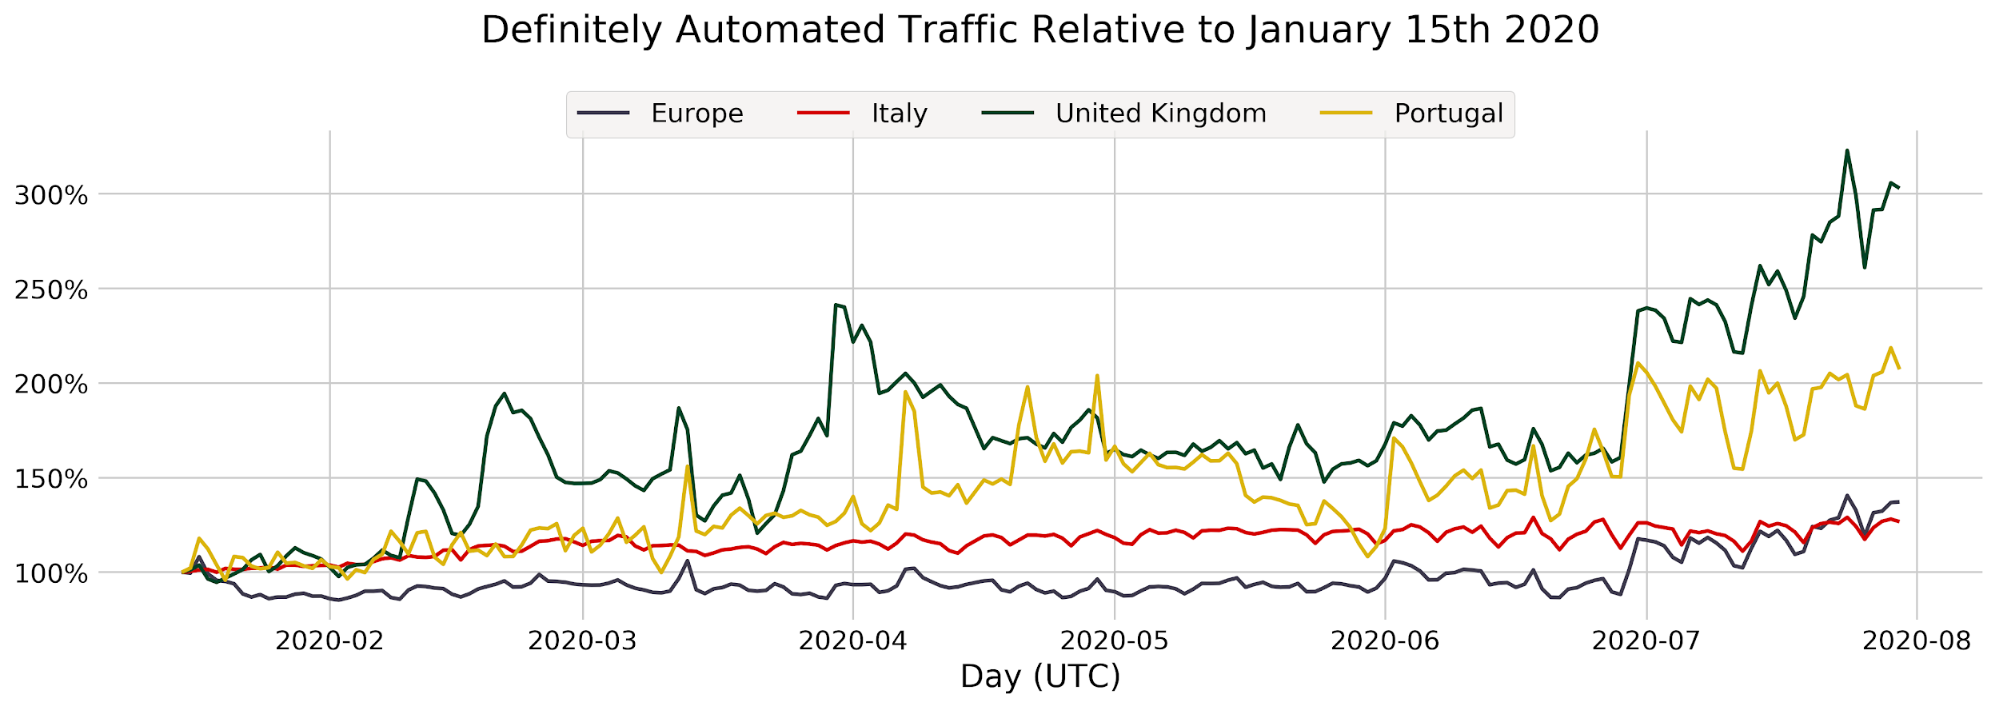
Definitely automated traffic did not have that much of a pronounced variation. Italian traffic kept steady throughout, and Portugal had a rather large increase. The biggest one, however, was the United Kingdom, which tripled its initial count.
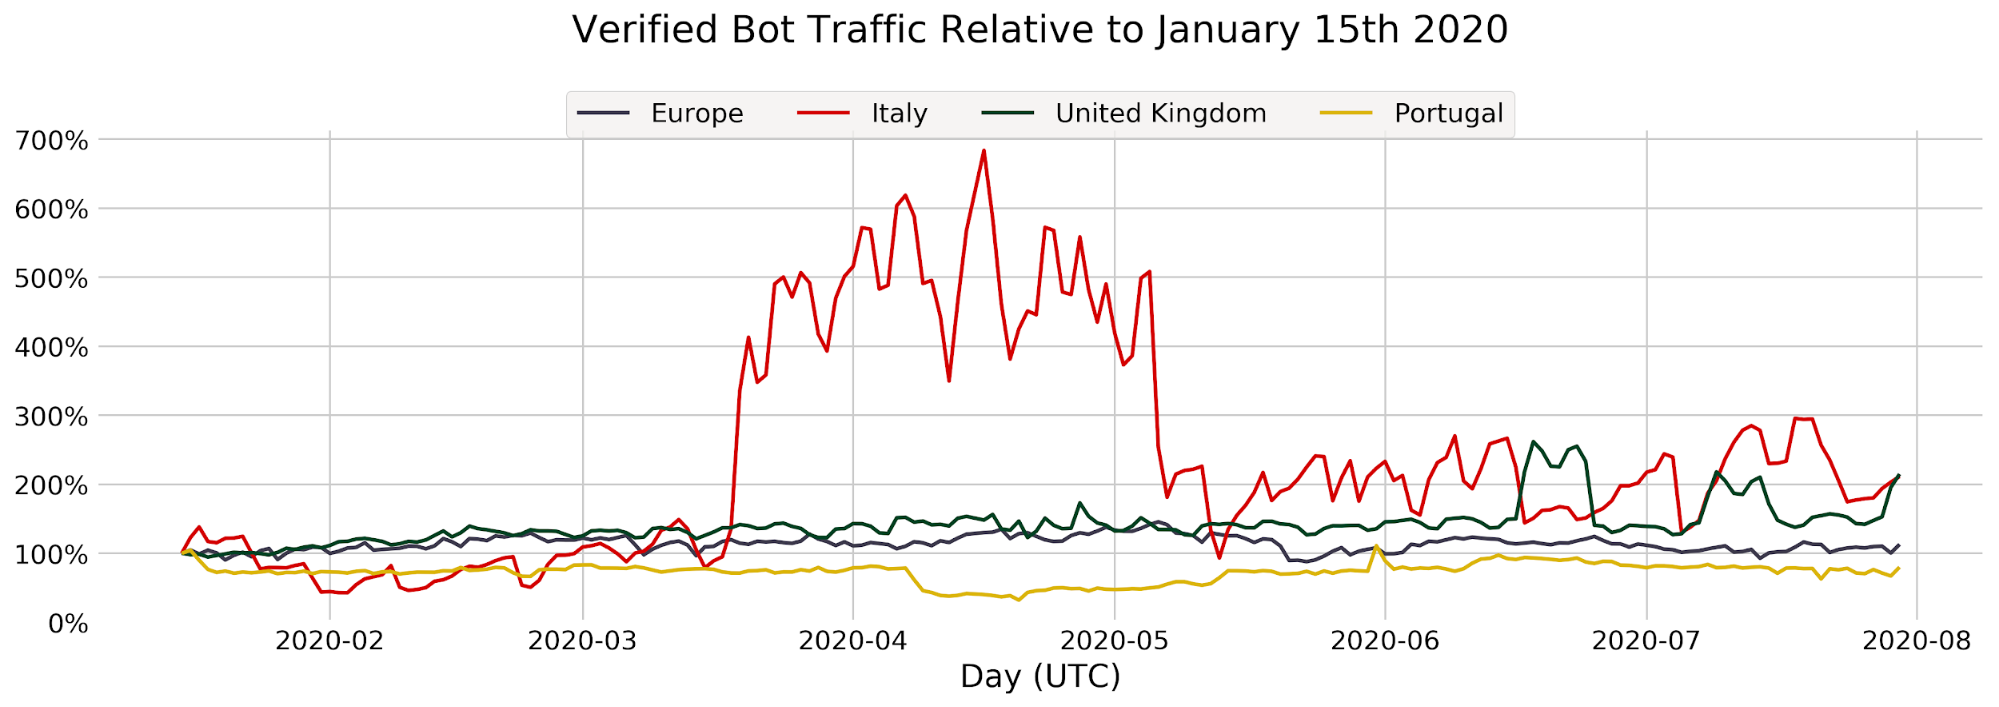
Verified bot traffic is steady, except in Italy, with a massive increase between March and May. What could be the cause of this? Are these a few zones, getting a massive number of requests?
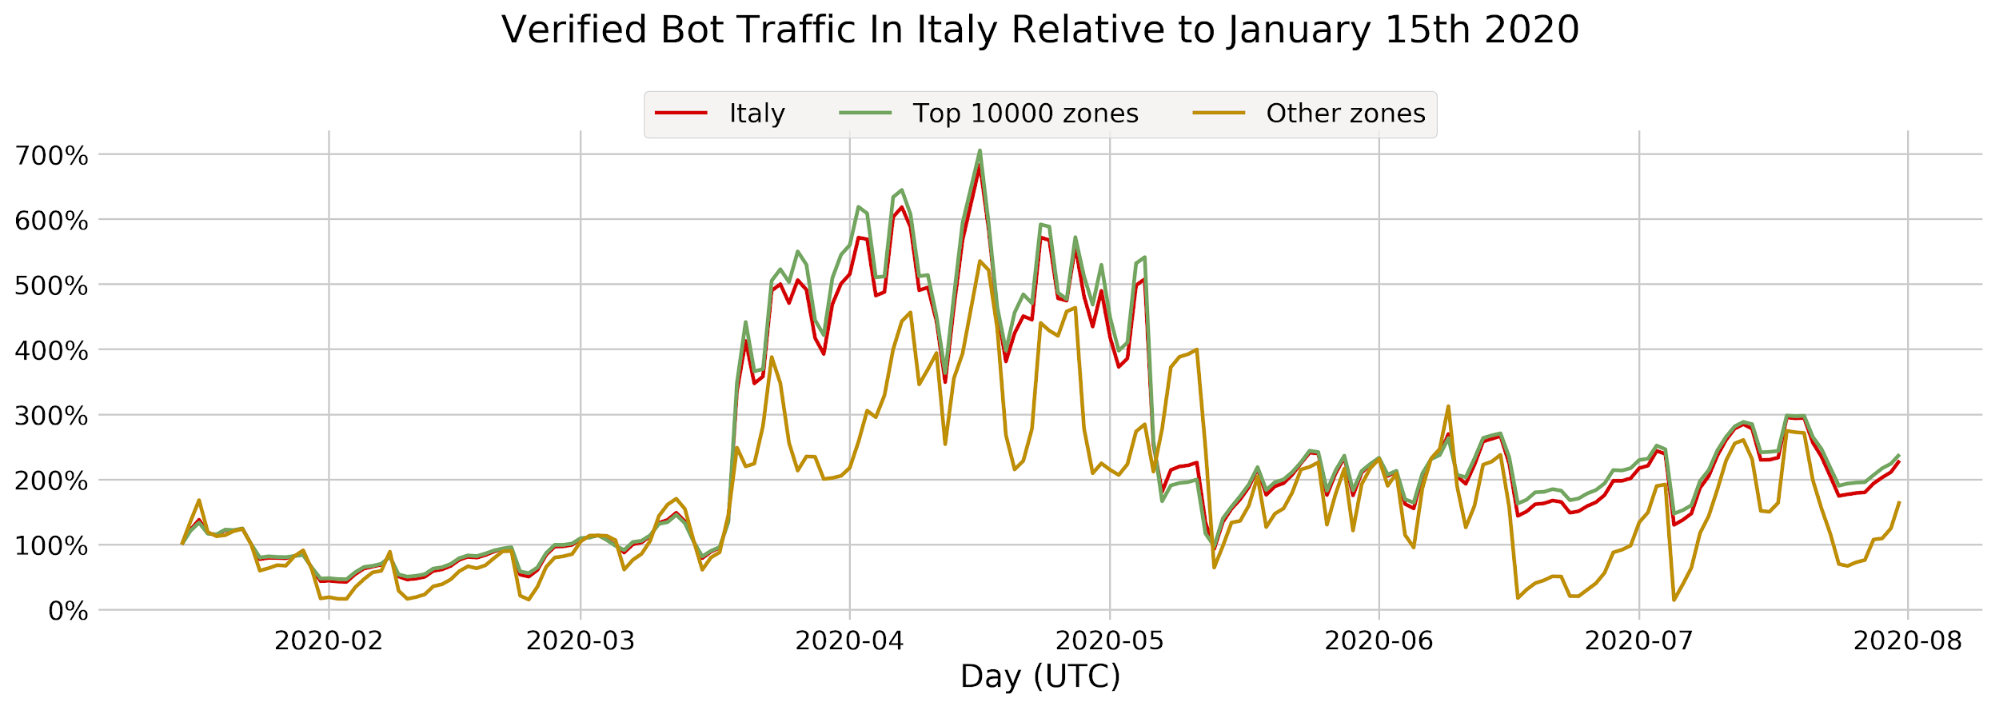
Well, no. If we only examine the top 10,000 zones (by total verified bot requests), we can still see a massive increase in traffic for other zones. So, what’s happening?
Let’s look at user agents. We can separate the top 10 user agents during the bump, and see how they evolve over time.
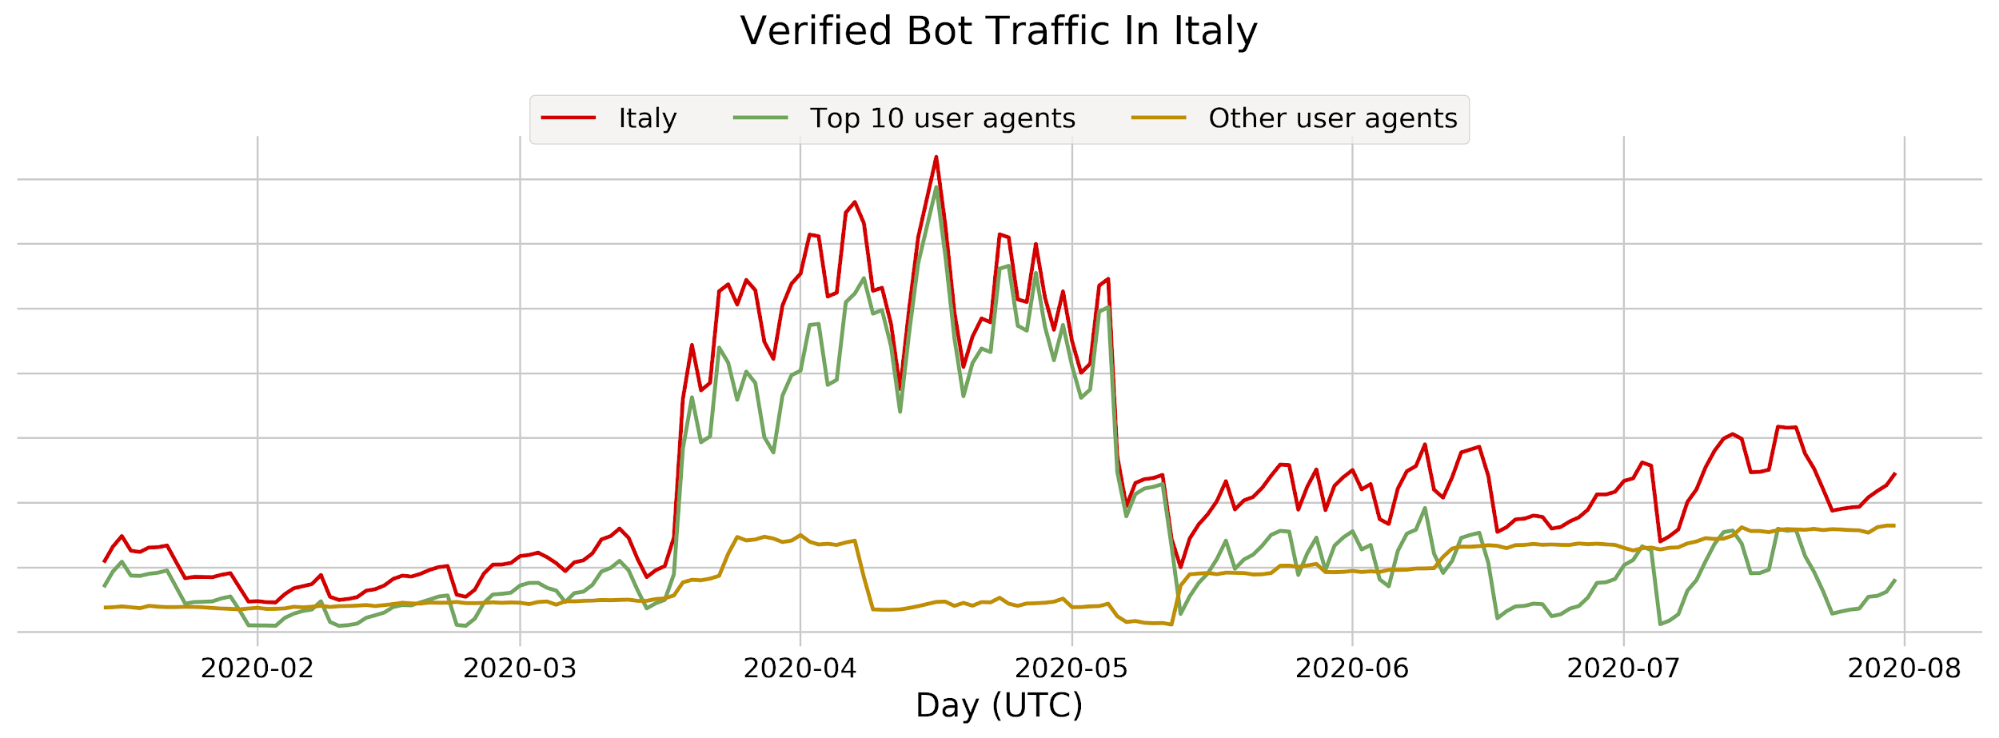
We can see that these 10 user agents are responsible for the majority of verified traffic coming from Italy.
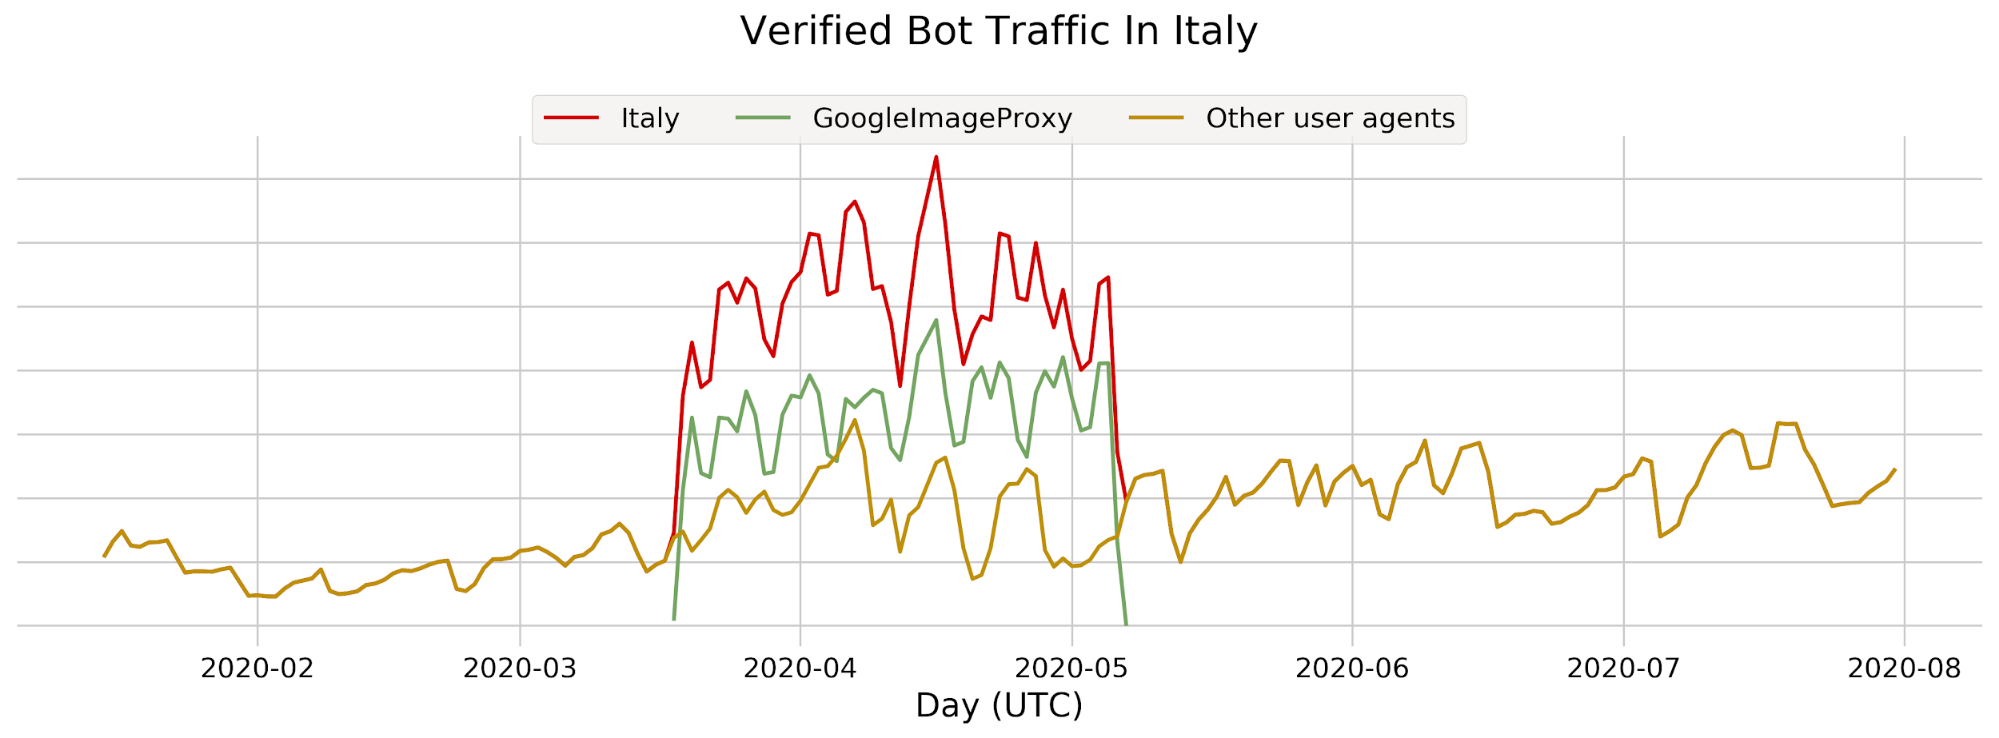
In fact, most of this increase is from a single user agent. This instance of Google image proxy anonymizes image requests from Gmail, which explains its popularity.
Where does this increase come from? Did this bot suddenly appear and disappear?
Not quite. One thing to keep in mind when dealing with bots is that they cross borders easily. As a proxy service, this bot is making calls on behalf of the end user – people opening emails. These requests will originate from a data center, which can be anywhere in the world. To see this in action, let’s take a look at traffic for this bot in a few select countries.
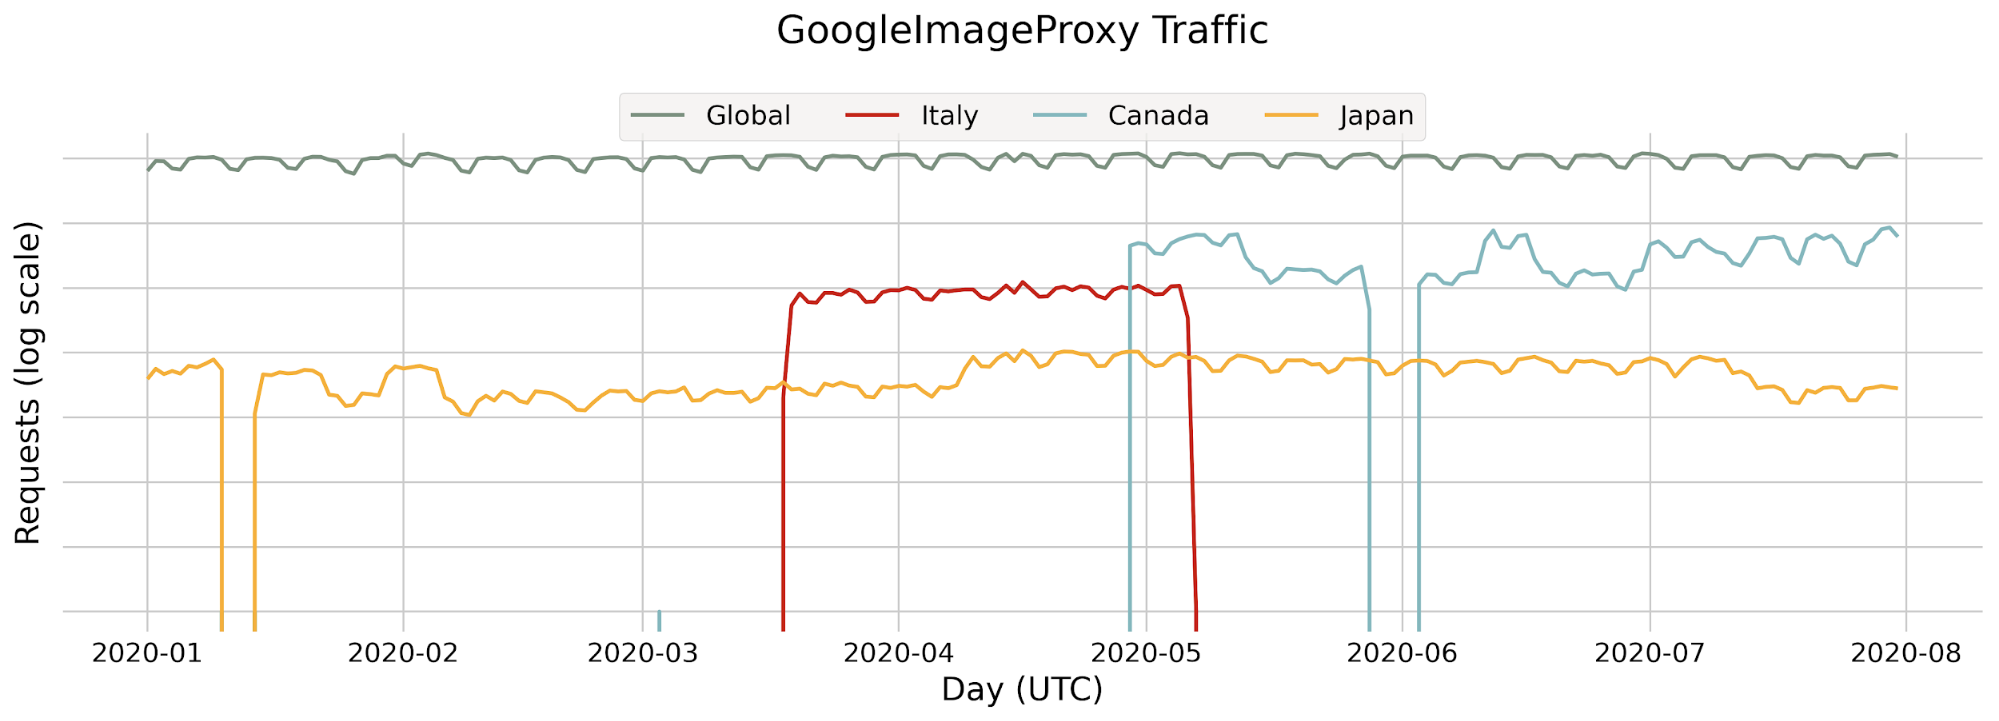
We can see that the global average barely budges. It appears that Google may be moving image proxy traffic between data centers and during the period we observed above that traffic was coming from Italy.
Summary
With Cloudflare’s global reach, we’re in a position to understand how bots behave.
The first half of 2020 saw a massive increase in web traffic of around 35% since the beginning of the year, driven by the ongoing coronavirus pandemic, and some bots have taken advantage of it.
We explained how bot management works for our customers, and how we distinguish between likely automated and human traffic.
We showed an overview of how much of our global traffic is automated, and how bots change their behavior throughout the day and the week. Notably, 39.4% of all traffic Cloudflare processes comes from a suspected automated source.
A regional overview of automated traffic lets us know which regions were the source of traffic from likely automated agents. North America, Europe and Asia were the primary sources of traffic, and also of automated traffic in particular.
We then focused on North America, where the majority of automated traffic originates. The United States alone accounted for the majority of requests, over half of which come from automated sources.
To explore this further, we briefly dived into ASN traffic in the United States, so we could see where these requests were coming from. ASNs like Comcast and AT&T were the top ASNs for overall traffic, but unsurprisingly, data centers like Google and Amazon AWS were the main drivers of automated traffic.
Finally, we examined how the coronavirus has impacted traffic in Europe, with a deeper dive on Italian traffic. This led to some interesting insights on verified bot traffic, which saw a massive increase in Italy for a few months.
This post is a small peek into bot management at Cloudflare. In the future, we hope to expand this series of blog posts on bot management, exposing even more insights about bots on the Internet.