Post Syndicated from Jon Handler original https://aws.amazon.com/blogs/big-data/monitor-your-amazon-es-domains-with-amazon-elasticsearch-service-monitor/
Amazon Elasticsearch Service (Amazon ES) is a fully managed service that you can use to deploy, secure, and run Elasticsearch cost-effectively at scale. The service provides support for open-source Elasticsearch APIs, managed Kibana, and integration with Logstash and other AWS services.
Amazon ES provides a wealth of information about your domain, surfaced through Amazon CloudWatch metrics (for more information, see Instance metrics). Your domain’s dashboard on the AWS Management Console collects key metrics and provides a view of what’s going on with that domain. This view is limited to that single domain, and for a subset of the available metrics. What if you’re running many domains? How can you see all their metrics in one place? You can set CloudWatch alarms at the single domain level, but what about anomaly detection and centralized alerting?
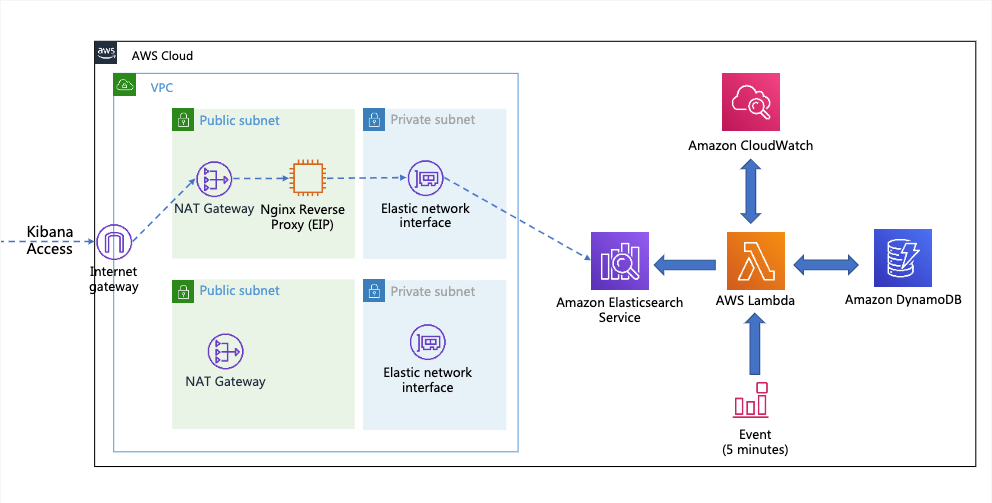
In this post, we detail Amazon Elasticsearch Service Monitor, an open-source monitoring solution for all the domains in your account, across all Regions, backed by a set of AWS CloudFormation templates delivered through the AWS Cloud Development Kit (AWS CDK). The templates deploy an Amazon ES domain in a VPC, an Nginx proxy for Kibana access, and an AWS Lambda function. The function is invoked by CloudWatch Events to pull metrics from all your Amazon ES domains and send them to the previously created monitoring domain for your review.
Your Amazon ES monitoring domain is an ideal way to monitor your Amazon ES infrastructure. We provide dashboards at the account and individual domain level. We also provide basic alerts that you can use as a template to build your own alerting solution.
Prerequisites
To bootstrap the solution, you need a few tools in your development environment:
- The latest version of the AWS CDK
- The latest version of the AWS Command Line Interface (AWS CLI)
- A Git client to pull down the AWS CDK source code
- Python 3.6 or later to run the code
- Node.js
Create and deploy the AWS CDK monitoring tool
Complete the following steps to set up the AWS CDK monitoring tool in your environment. Depending on your operating system, the commands may differ. This walkthrough uses Linux and bash.
Clone the code from the GitHub repo:

We provide a bash bootstrap script to prepare your environment for running the AWS CDK and deploying the architecture. The bootstrap.sh script is in the amazon-elasticsearch-service-monitor directory. The script creates a Python virtual environment and downloads some further dependencies. It creates an Amazon Elastic Compute Cloud (Amazon EC2) key pair to facilitate accessing Kibana, then adds that key pair to your local SSH setup. Finally, it prompts for an email address where the stack sends alerts. You can edit email_default in the script or enter it at the command line when you run the script. See the following code:
After the script is complete, enter the Python virtual environment:
Bootstrap the AWS CDK
The AWS CDK creates resources in your AWS account to enable it to track your deployments. You bootstrap the AWS CDK with the bootstrap command:

Deploy the architecture
The monitoring_cdk directory collects all the components that enable the AWS CDK to deploy the following architecture.
You can review amazon-elasticsearch-service-monitor/monitoring_cdk/monitoring_cdk_stack.py for further details.
The architecture has the following components:
- An Amazon Virtual Private Cloud (Amazon VPC) spanning two Amazon EC2 Availability Zones.
- An Amazon ES cluster with two t3.medium data nodes, one in each Availability Zone, with 100 GB of EBS storage.
- An Amazon DynamoDB table for tracking the timestamp for the last pull from CloudWatch.
- A Lambda function to fetch CloudWatch metrics across all Regions and all domains. By default, it fetches the data every 5 minutes, which you can change if needed.
- An EC2 instance that acts as an SSH tunnel to access Kibana, because our setup is secured and in a VPC.
- A default Kibana dashboard to visualize metrics across all domains.
- Default email alerts to the newly launched Amazon ES cluster.
- An index template and Index State Management (ISM) policy to delete indexes older than 366 days. (You can change this to a different retention period if needed.)
- A monitoring stack with the option to enable UltraWarm (UW), which is disabled by default. You can change the settings in the monitoring_cdk_stack.py file to enable UW.
The monitoring_cdk_stack.py file contains several constants at the top that let you control the domain configuration, its sizing, and the Regions to monitor. It also specifies the username and password for the admin user of your domain. You should edit and replace those constants with your own values.
For example, the following code indicates which Regions to monitor:
Run the following command:
The AWS CDK prompts you to apply security changes; enter y for yes.
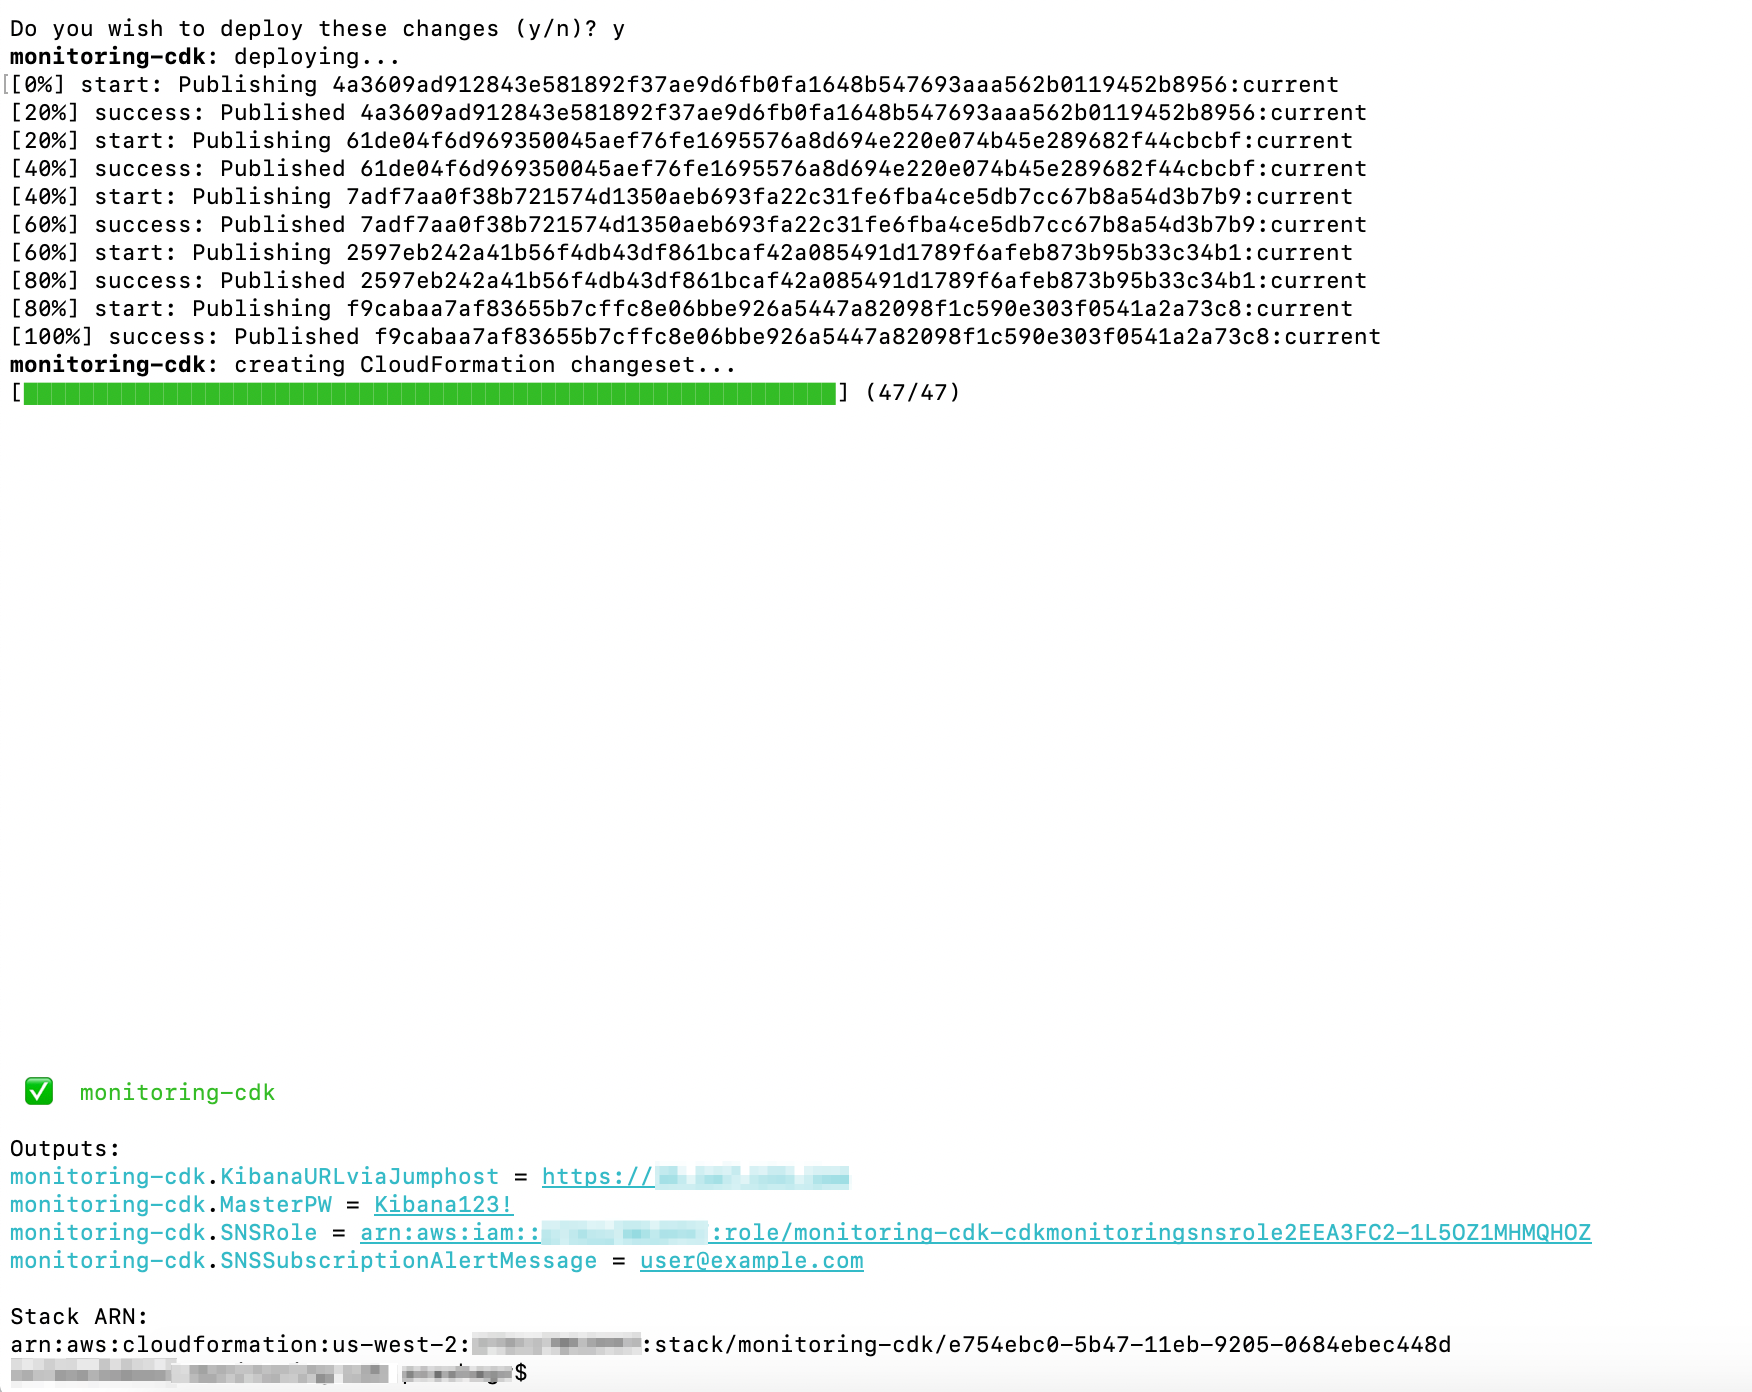
After the app is deployed, you get the Kibana URL, user, and password to access Kibana. After you log in, use the following sections to navigate around dashboards and alerts.
After the stack is deployed, you receive an email to confirm the subscription; make sure to confirm the email to start getting the alerts.
Pre-built monitoring dashboards
The monitoring tool comes with pre-built dashboards. To access them, complete the following steps:
- Navigate to the IP obtained after deployment.
- Log in to Kibana.
Be sure to use the endpoint you received, provided as an output from thecdk deploycommand
- In the navigation pane, choose Dashboard.


The Dashboards page displays the default dashboards.
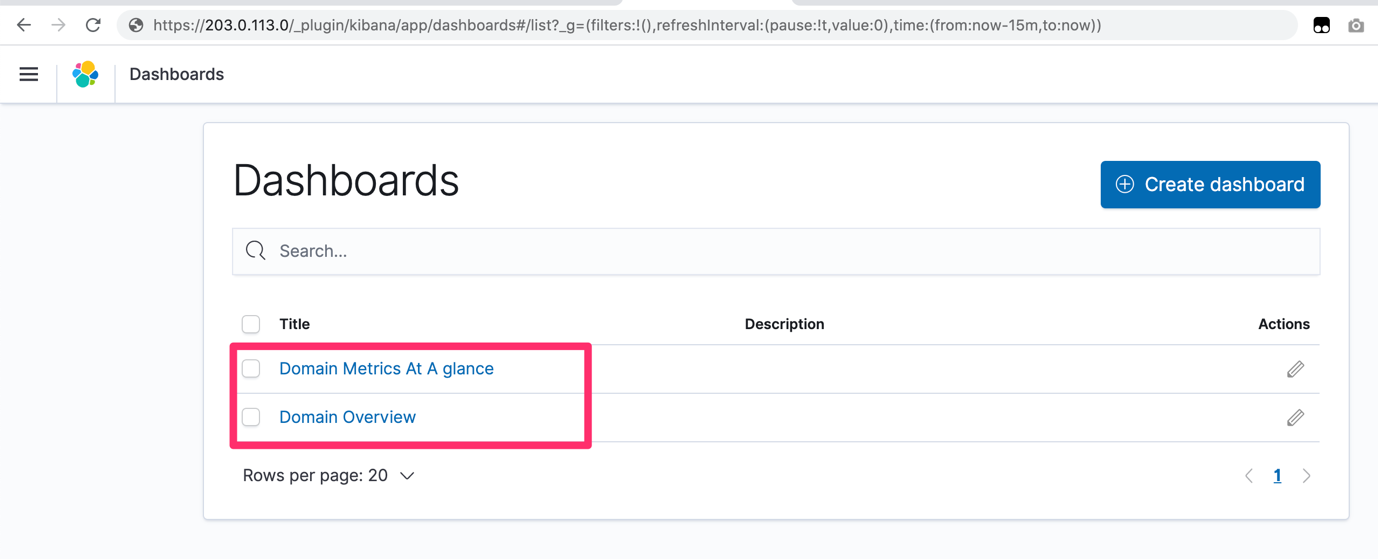
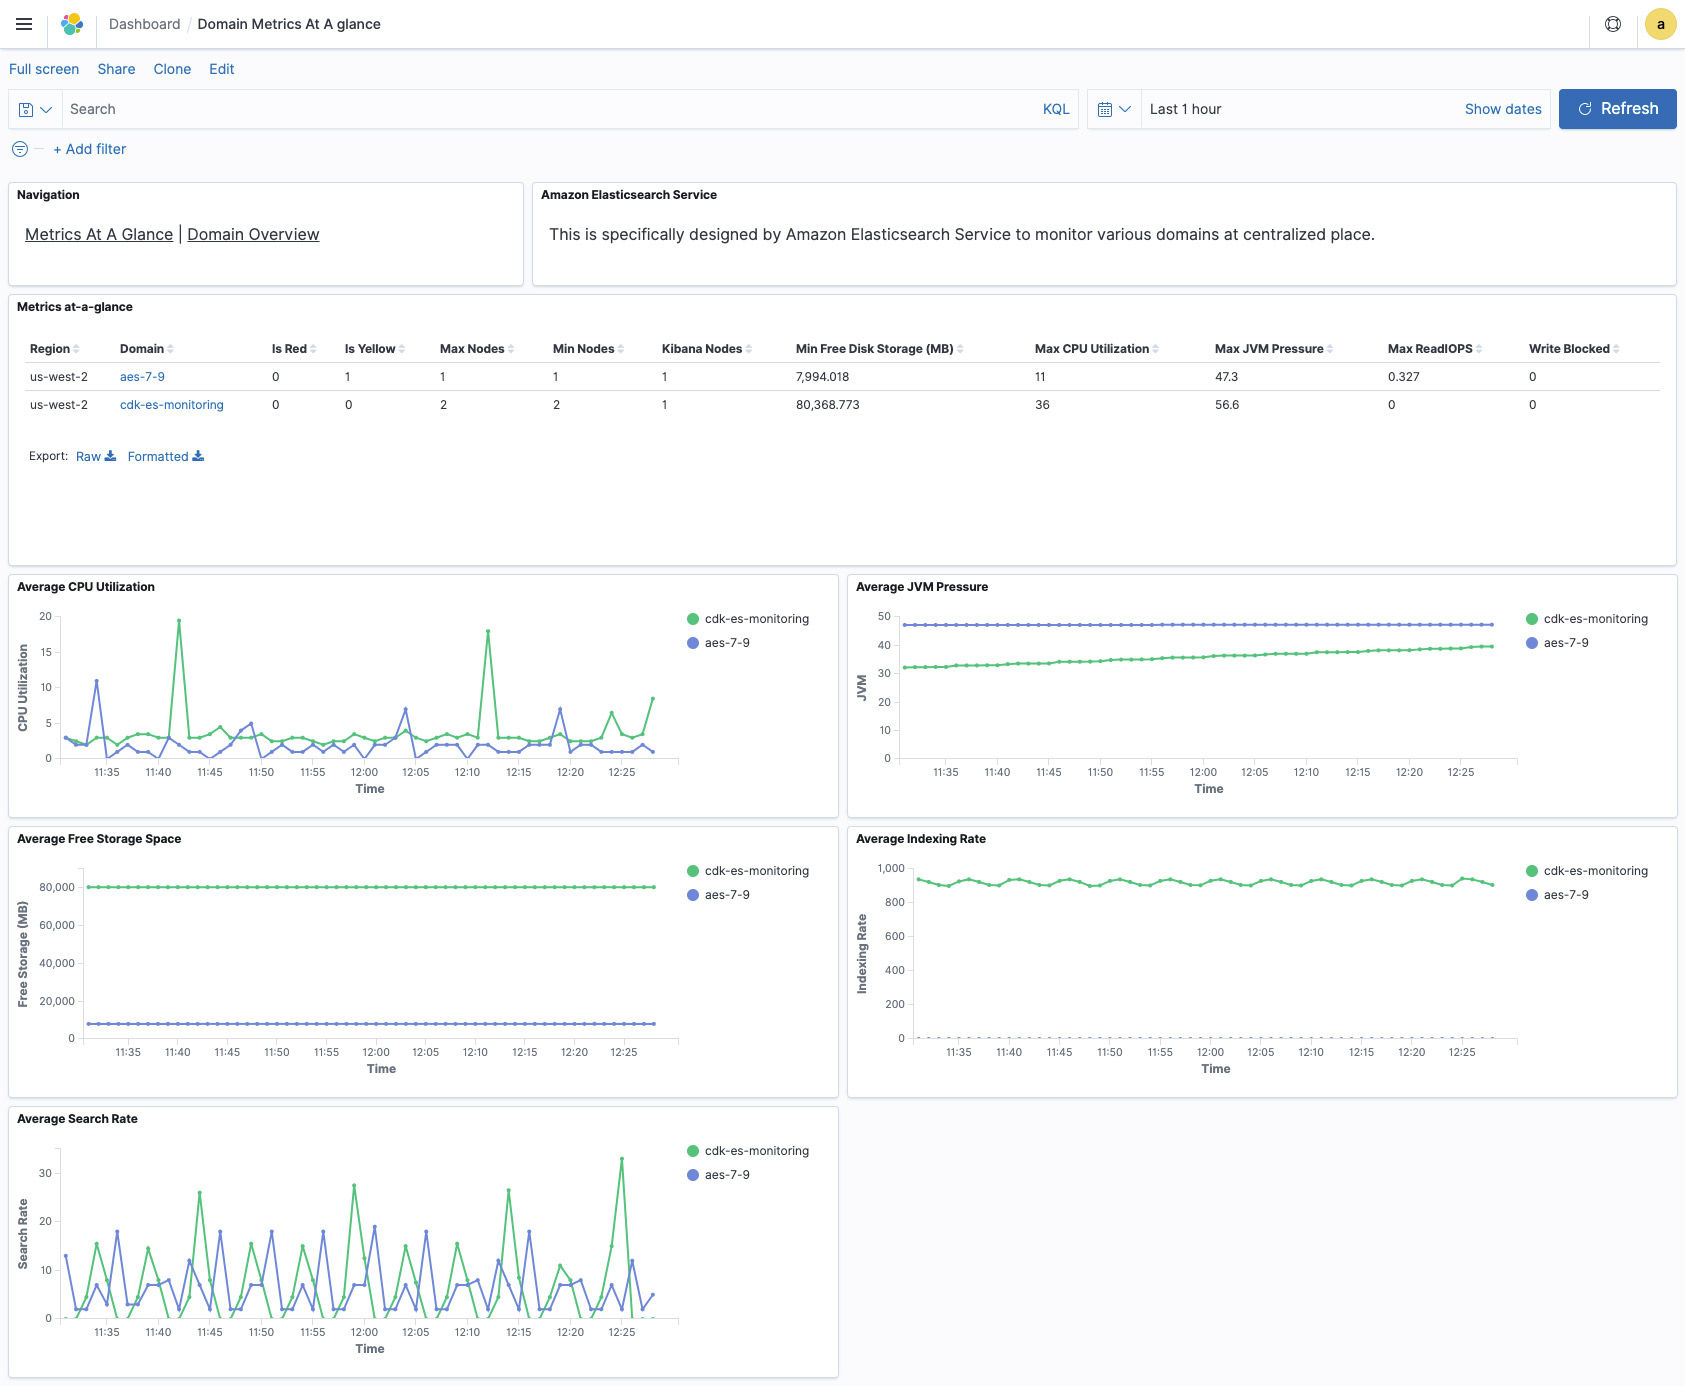
The Domain Metrics At A glance dashboard gives a 360-degree view of all Amazon ES domains across Regions.
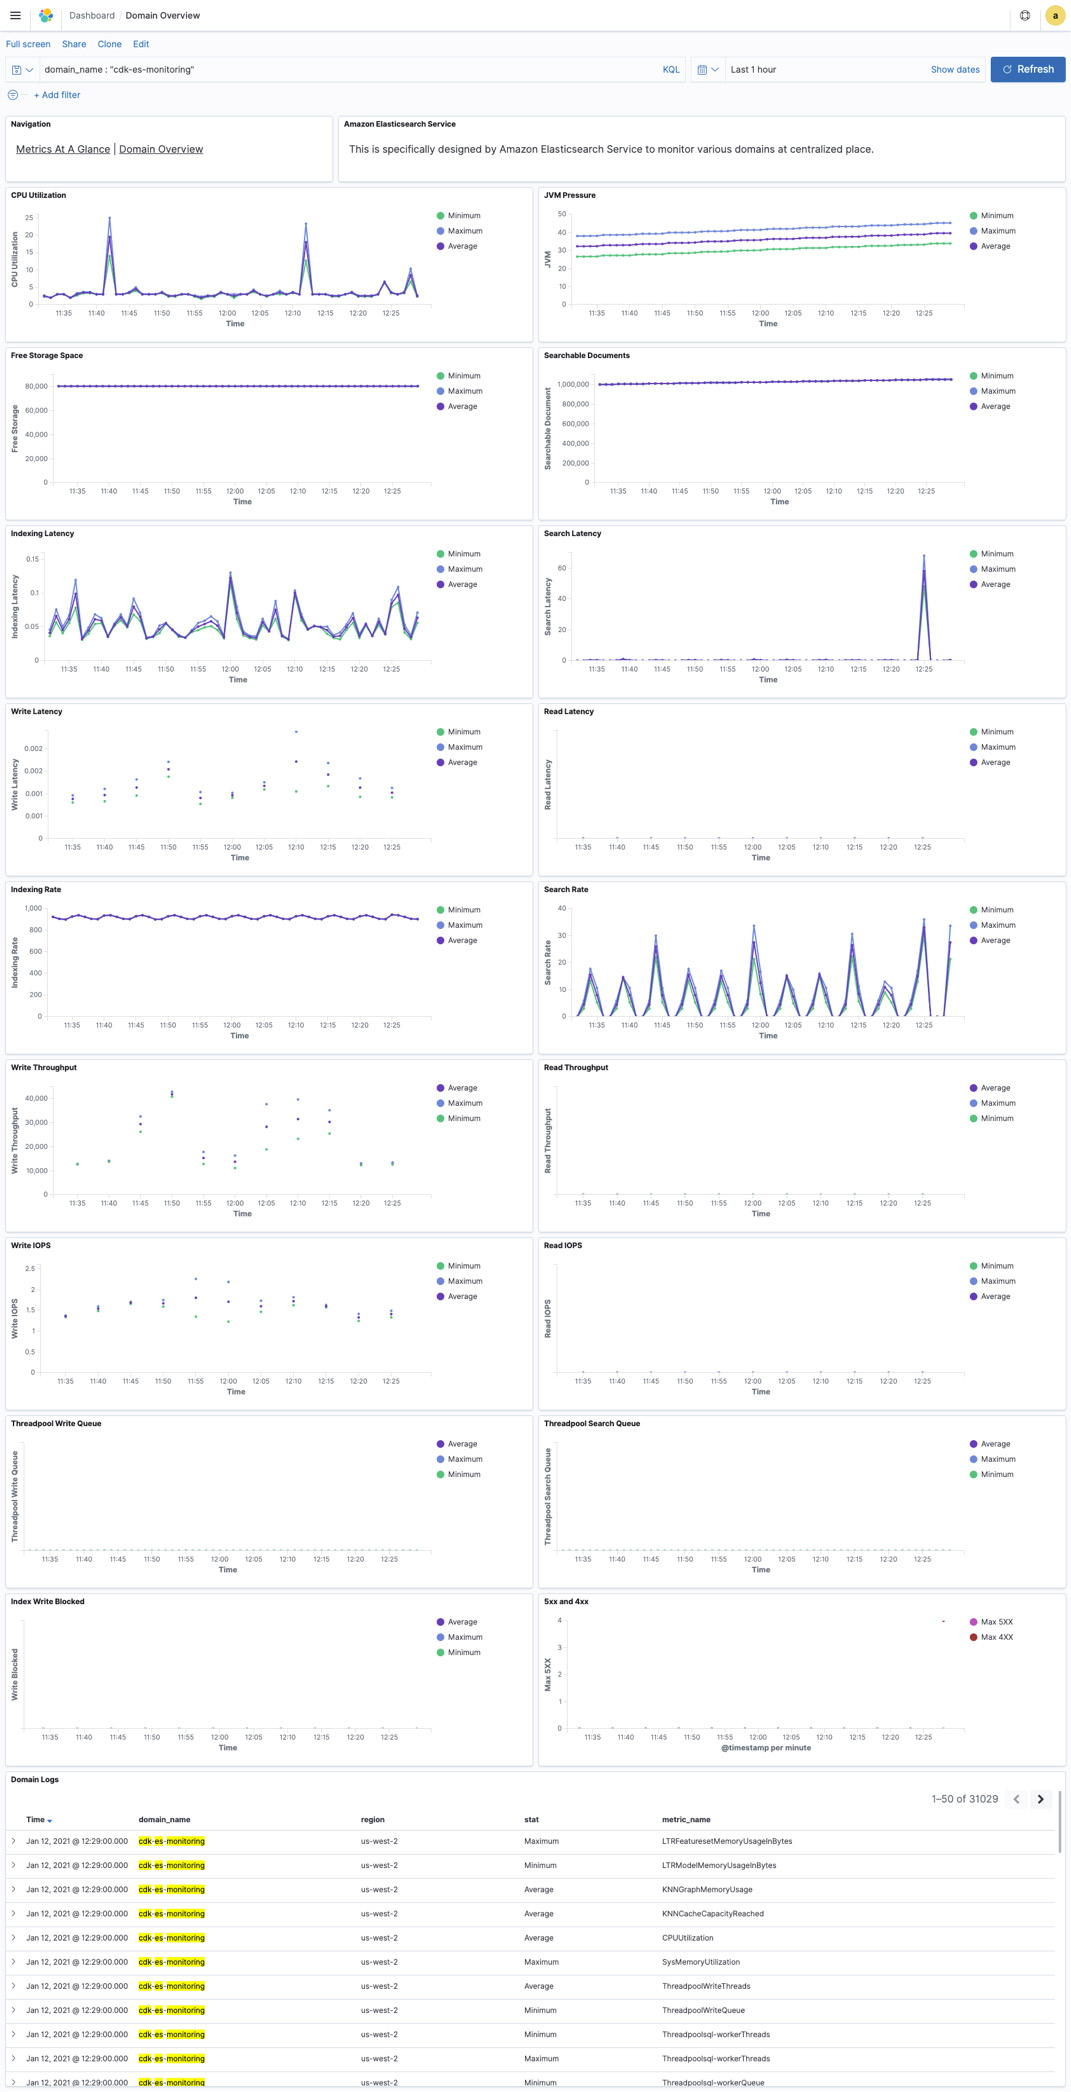
The Domain Overview dashboard gives more detailed metrics for a particular domain, to help you deep dive into issues in a specific domain.
Pre-built alerts
The monitoring framework comes with pre-built alerts, as summarized in the following table. These alerts notify you on key resources like CPU, disk space, and JVM. We also provide alerts for cluster status, snapshot failures, and more. You can use the following alerts as a template to create your own alerts and monitoring for search and indexing latencies and volumes, for example.
| Alert Type | Frequency |
| Cluster Health – Red | 5 Min |
| Cluster Index Writes Blocked | 5 Min |
| Automated Snapshot Failure | 5 Min |
| JVM Memory Pressure > 80% | 5 Min |
| CPU Utilization > 80% | 15 Min |
| No Kibana Healthy Nodes | 15 Min |
| Invalid Host Header Requests | 15 Min |
| Cluster Health – Yellow | 30 Min |
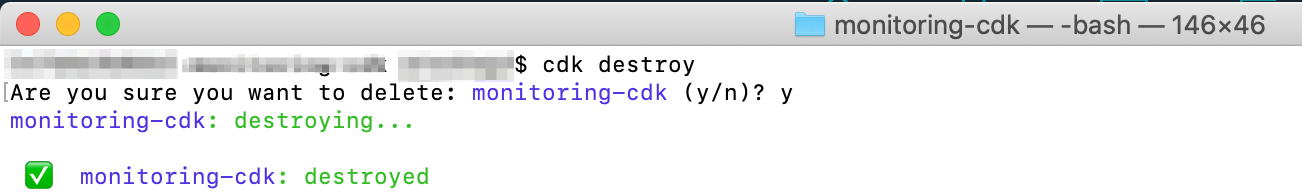
Clean up
To clean up the stacks, destroy the monitoring-cdk stack; all other stacks are torn down due to dependencies:
CloudWatch logs need to be removed separately.
Pricing
Running this solution incurs charges of less than $10 per day for one domain, with an additional $2 per day for each additional domain.
Conclusion
In this post, we discussed Amazon Elasticsearch Service Monitor, an open-source monitoring solution for all the domains in your account, across all Regions. Amazon ES monitoring domains are an ideal way to monitor your Amazon ES infrastructure. Try it out and leave your thoughts in the comments.
About the Authors
 Jon Handler (@_searchgeek) is a Principal Solutions Architect at Amazon Web Services based in Palo Alto, CA. Jon works closely with the CloudSearch and Elasticsearch teams, providing help and guidance to a broad range of customers who have search workloads that they want to move to the AWS Cloud. Prior to joining AWS, Jon’s career as a software developer included four years of coding a large-scale, eCommerce search engine.
 Prashant Agrawal is a Specialist Solutions Architect at Amazon Web Services based in Seattle, WA.. Prashant works closely with Amazon Elasticsearch team, helping customers migrate their workloads to the AWS Cloud. Before joining AWS, Prashant helped various customers use Elasticsearch for their search and analytics use cases.