Post Syndicated from Bharat Nallan Chakravarthy original https://blog.cloudflare.com/logpush-ui-update/
![]()
We are excited to announce a new look and new capabilities for Cloudflare Logs! Customers on our Enterprise plan can now configure Logpush for Firewall Events and Network Error Logs Reports directly from the dashboard. Additionally, it’s easier to send Logs directly to our analytics partners Microsoft Azure Sentinel, Splunk, Sumo Logic, and Datadog. This blog post discusses how customers use Cloudflare Logs, how we’ve made it easier to consume logs, and tours the new user interface.
New data sets for insight into more products
Cloudflare Logs are almost as old as Cloudflare itself, but we have a few big improvements: new datasets and new destinations.
Cloudflare has a large number of products, and nearly all of them can generate Logs in different data sets. We have “HTTP Request” Logs, or one log line for every L7 HTTP request that we handle (whether cached or not). We also provide connection Logs for Spectrum, our proxy for any TCP or UDP based application. Gateway, part of our Cloudflare for Teams suite, can provide Logs for HTTP and DNS traffic.
Today, we are introducing two new data sets:
Firewall Events gives insight into malicious traffic handled by Cloudflare. It provides detailed information about everything our WAF does. For example, Firewall Events shows whether a request was blocked outright or whether we issued a CAPTCHA challenge. About a year ago we introduced the ability to send Firewall Events directly to your SIEM; starting today, I’m thrilled to share that you can enable this directly from the dashboard!
Network Error Logging (NEL) Reports provides information about clients that can’t reach our network. To enable NEL Reports for your zone and start seeing where clients are having issues reaching our network, reach out to your account manager.
Take your Logs anywhere with an S3-compatible API
To start using logs, you need to store them first. Cloudflare has long supported AWS, Azure, and Google Cloud as storage destinations. But we know that customers use a huge variety of storage infrastructure, which could be hosted on-premise or with one of our Bandwidth Alliance partners.
Starting today, we support any storage destination with an S3-compatible API. This includes:
- Digital Ocean Spaces
- Backblaze B2
- Alibaba Cloud OSS
- JD Cloud Object Storage Service
- Oracle Cloud Object Storage
- Linode Object Storage
And best of all, it’s super easy to get data into these locations using our new UI!
“As always, we love that our partnership with Cloudflare allows us to seamlessly offer customers our easy, plug and play storage solution, Backblaze B2 Cloud Storage. Even better is that, as founding members of the Bandwidth Alliance, we can do it all with free egress.”
— Nilay Patel, Co-founder and VP of Solutions Engineering and Sales, Backblaze.
Push Cloudflare Logs directly to our analytics partners
While many customers like to store Logs themselves, we’ve also heard that many customers want to get Logs into their analytics provider directly — without going through another layer. Getting high volume log data out of object storage and into an analytics provider can require building and maintaining a costly, time-consuming, and fragile integration.
Because of this, we now provide direct integrations with four analytics platforms: Microsoft Azure Sentinel, Sumo Logic, Splunk, and Datadog. And starting today, you can push Logs directly into Sumo Logic, Splunk and Datadog from the UI! Customers can add Cloudflare to Azure Sentinel using the Azure Marketplace.
“Organizations are in a state of digital transformation on a journey to the cloud. Most of our customers deploy services in multiple clouds and have legacy systems on premise. Splunk provides visibility across all of this, and more importantly, with SOAR we can automate remediation. We are excited about the Cloudflare partnership, and adding their data into Splunk drives the outcomes customers need to modernize their security operations.”
— Jane Wong, Vice President, Product Management, Security at Splunk
“Securing enterprise IT environments can be challenging – from devices, to users, to apps, to data centers on-premises or in the cloud. In today’s environment of increasingly sophisticated cyber-attacks, our mutual customers rely on Microsoft Azure Sentinel for a comprehensive view of their enterprise. Azure Sentinel enables SecOps teams to collect data at cloud scale and empowers them with AI and ML to find the real threats in those signals, reducing alert fatigue by as much as 90%. By integrating directly with Cloudflare Logs we are making it easier and faster for customers to get complete visibility across their entire stack.”
— Sarah Fender, Partner Group Program Manager, Azure Sentinel at Microsoft
“As a long time Cloudflare partner we’ve worked together to help joint customers analyze events and trends from their websites and applications to provide end-to-end visibility to improve digital experiences. We’re excited to expand our partnership as part of the Cloudflare Analytics Ecosystem to provide comprehensive real-time insights for both observability and the security of mission-critical applications and services with our Cloud SIEM solution.”
— John Coyle, Vice President of Business Development for Sumo Logic
“Knowing that applications perform as well in the real world as they do in the datacenter is critical to ensuring great digital experiences. Combining Cloudflare Logs with Datadog telemetry about application performance in a single pane of glass ensures teams will have a holistic view of their application delivery.”
— Michael Gerstenhaber, Sr. Director of Product, Datadog
Why Cloudflare Logs?
Cloudflare’s mission is to help build a better Internet. We do that by providing a massive global network that protects and accelerates our customers’ infrastructure. Because traffic flows across our network before reaching our customers, it means we have a unique vantage point into that traffic. In many cases, we have visibility that our customers don’t have — whether we’re telling them about the performance of our cache, the malicious HTTP requests we drop at our edge, a spike in L3 data flows, the performance of their origin, or the CPU used by their serverless applications.
To provide this ability, we have analytics throughout our dashboard to help customers understand their network traffic, firewall, cache, load balancer, and much more. We also provide alerts that can tell customers when they see an increase in errors or spike in DDoS activity.
But some customers want more than what we currently provide with our analytics products. Many of our enterprise customers use SIEMs like Splunk and Sumo Logic or cloud monitoring tools like Datadog. These products can extend the capabilities of Cloudflare by showcasing Cloudflare data in the context of customers’ other infrastructure and providing advanced functionality on this data.
To understand how this works, consider a typical L7 DDoS attack against one of our customers. Very commonly, an attack like this might originate from a small number of IP addresses and a customer might choose to block the source IPs completely. After blocking the IP addresses, customers may want to:
- Search through their Logs to see all the past instances of activity from those IP addresses.
- Search through Logs from all their other applications and infrastructure to see all activity from those IP addresses
- Understand exactly what that attacker was trying to do by looking at the request payload blocked in our WAF (securely encrypted thanks to HPKE!)
- Set an alert for similar activity, to be notified if something similar happens again
All these are made possible using SIEMs and infrastructure monitoring tools. For example, our customer NOV uses Splunk to “monitor our network and applications by alerting us to various anomalies and high-fidelity incidents”.
“One of the most valuable sources of data is Cloudflare,” said John McLeod, Chief Information Security Officer at NOV. “It provides visibility into network and application attacks. With this integration, it will be easier to get Cloudflare Logs into Splunk, saving my team time and money.”
A new UI for our growing product base
With so many new data sets and new destinations, we realized that our existing user interface was not good enough. We went back to the drawing board to design a more intuitive user experience to help you quickly and easily set up Logpush.
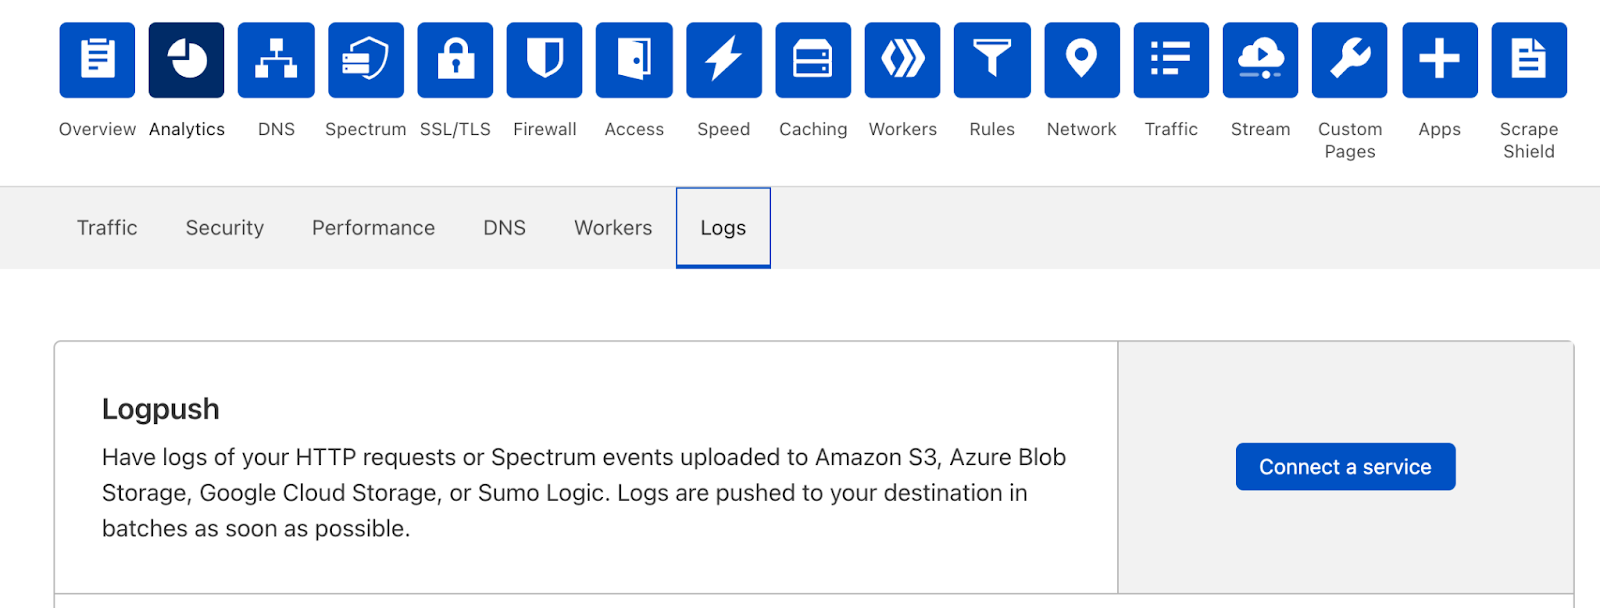
You can still set up Logpush in the same place in the dashboard, in the Analytics > Logs tab:
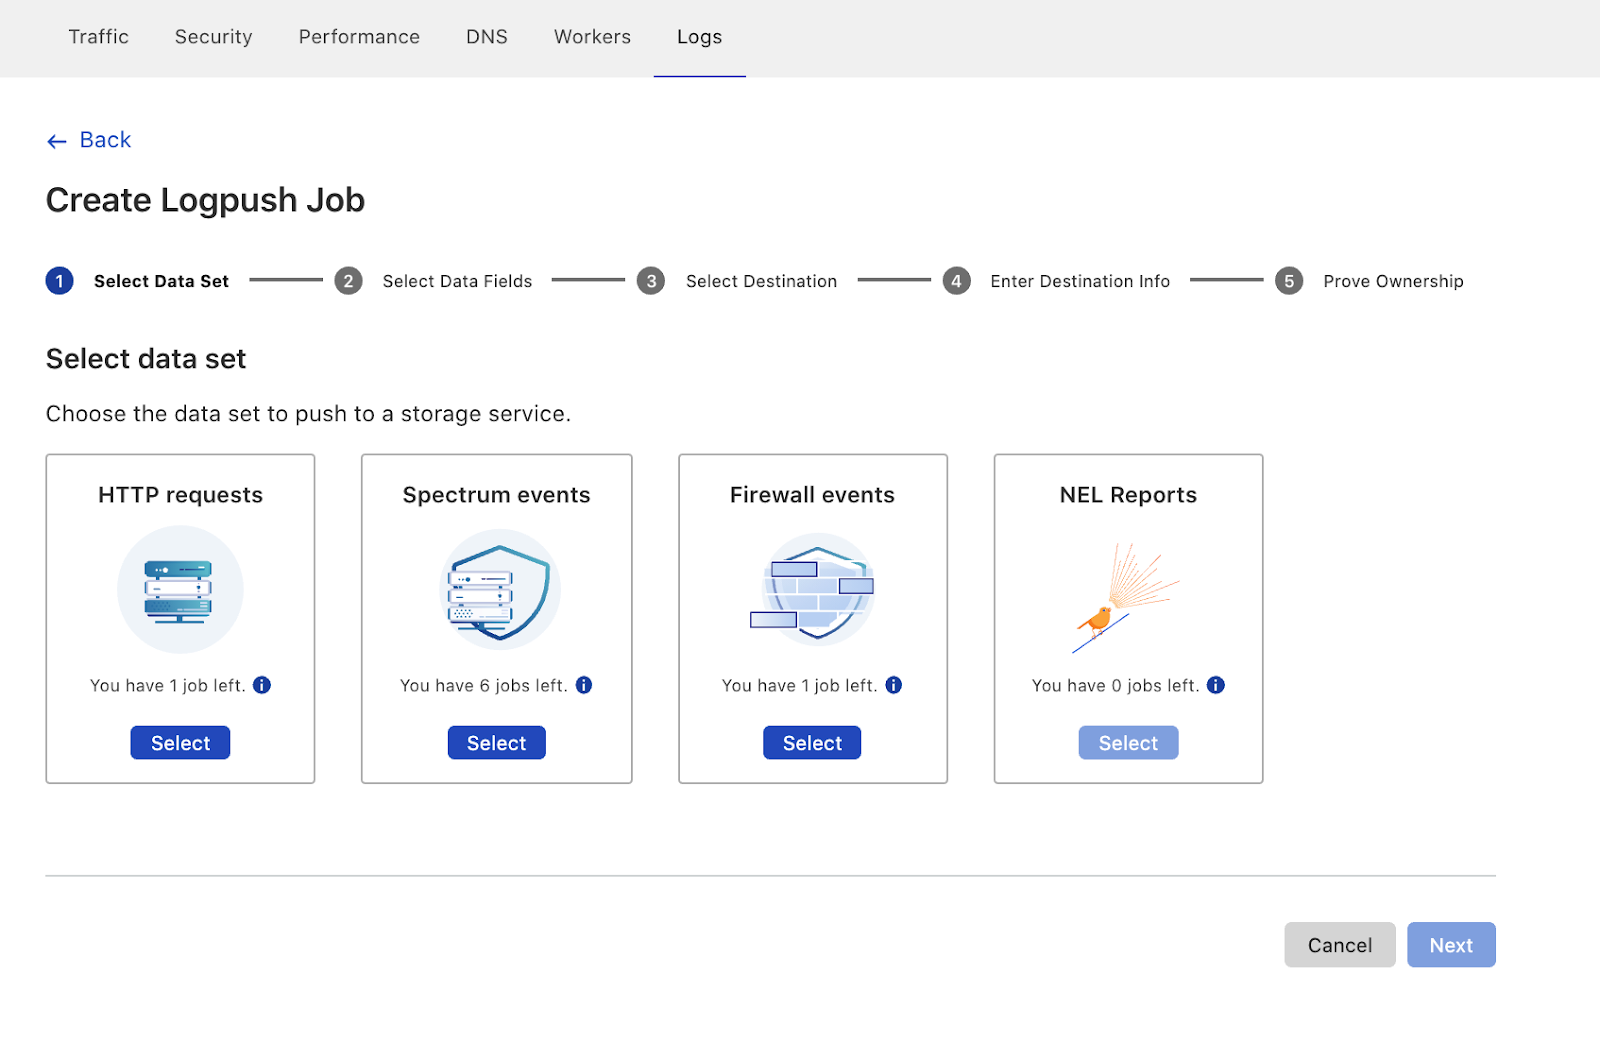
The new UI first prompts users to select the data set to push. Here you’ll also notice that we’ve added support for Firewall Events and NEL Reports!
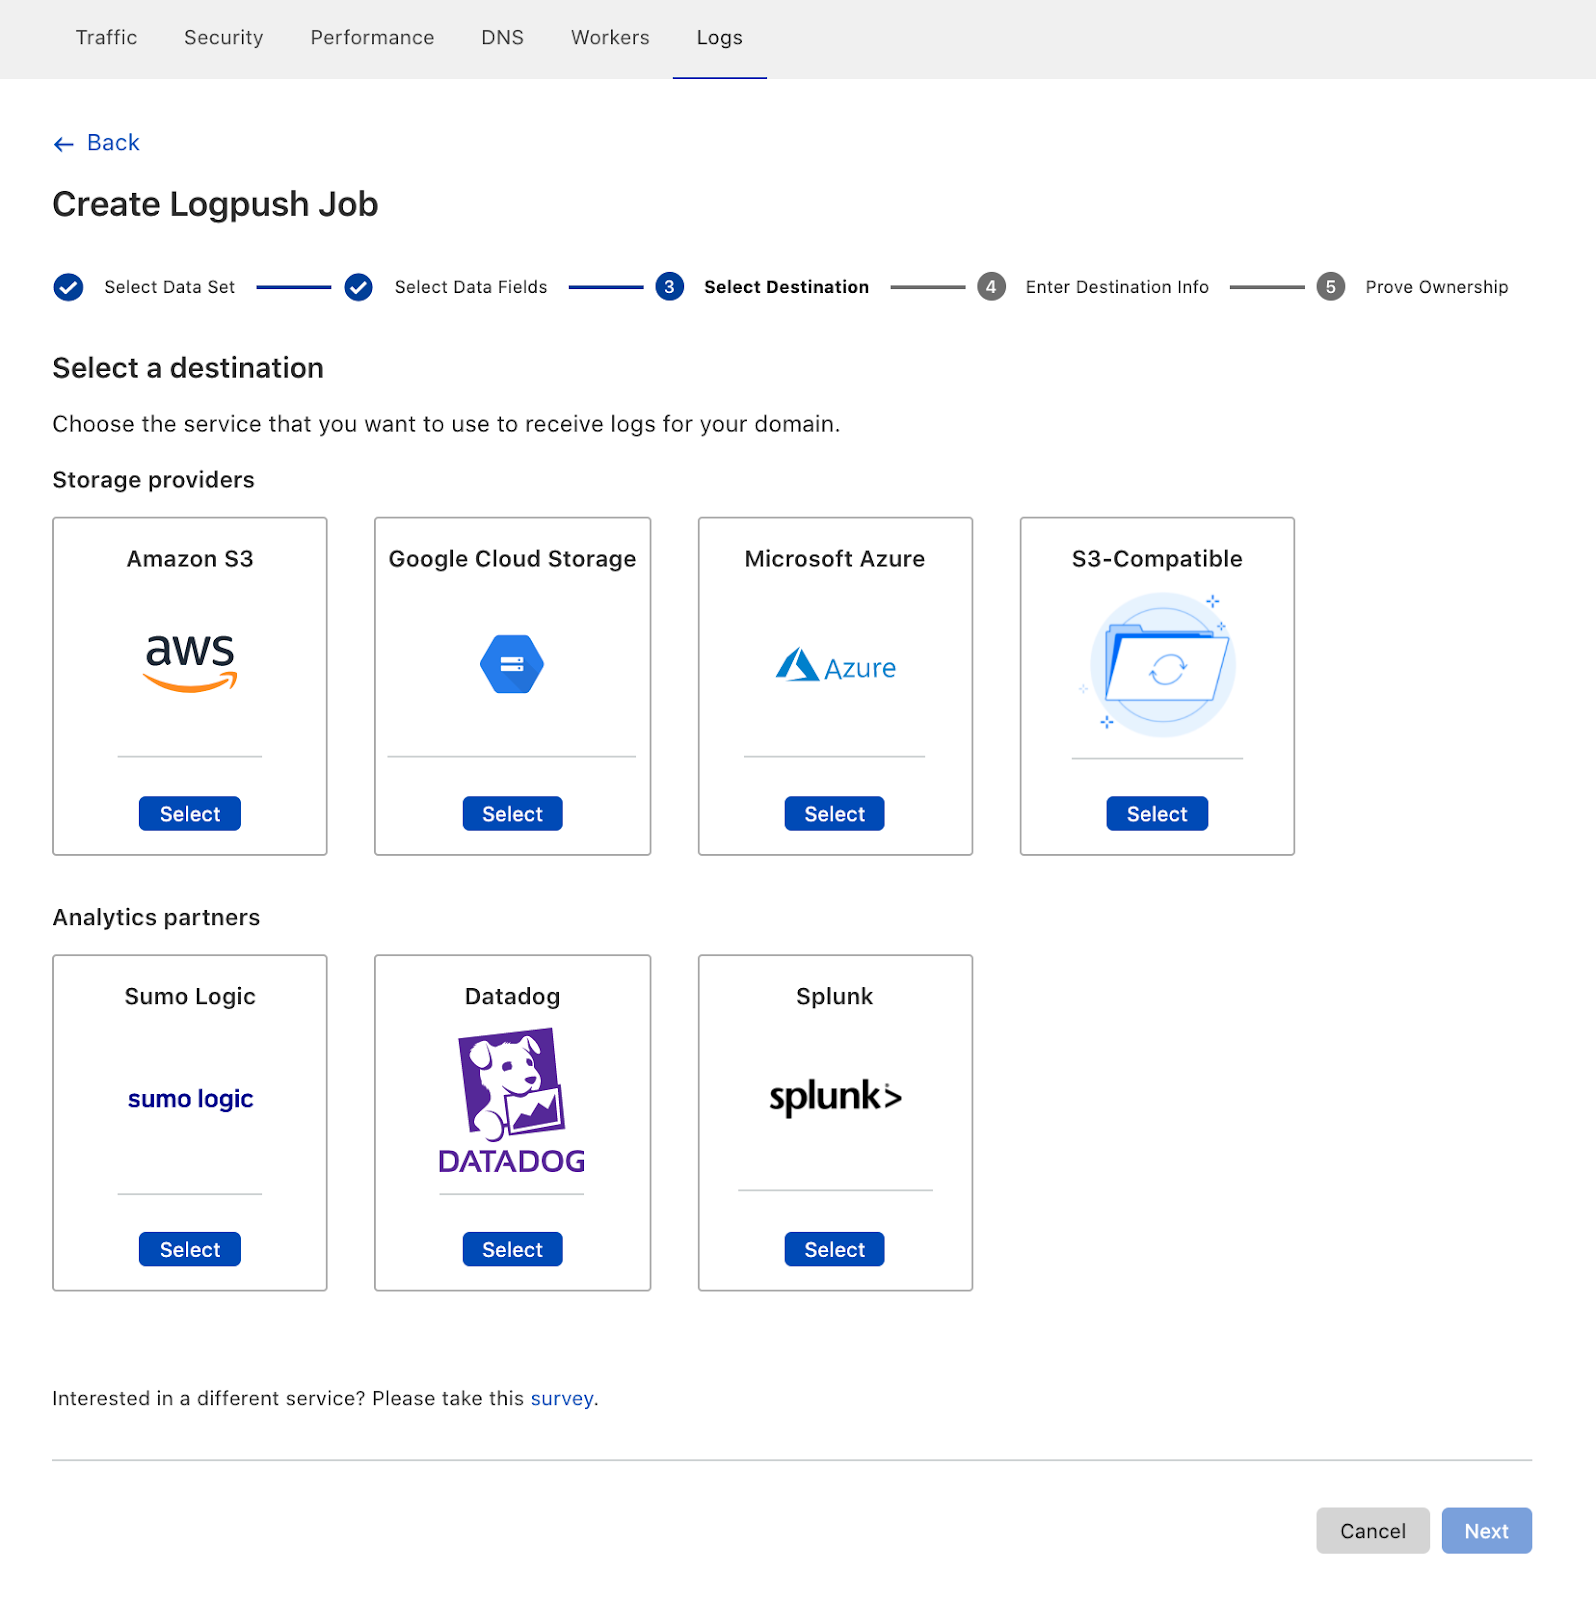
After configuring details like which fields to push, customers can then select where the Logs are going. Here you can see our three new destinations, S3-compatible storage, Sumo Logic, Datadog and Splunk:
Coming soon
Of course, we’re not done yet! We have more Cloudflare products in the pipeline and more destinations planned where customers can send their Logs. Additionally, we’re working on adding more flexibility to our logging pipeline so that customers can configure to send Logs for the entire account, plus filter Logs to just send error codes, for example.
Ultimately, we want to make working with Cloudflare Logs as useful as possible — on Cloudflare itself! We’re working to help customers solve their performance and security challenges with data at massive scale. If that sounds interesting, please join us! We’re hiring Systems Engineers for the Data team.