Post Syndicated from Jen Sells original https://blog.cloudflare.com/monitoring-and-forensics/
In 2024, we announced Log Explorer, giving customers the ability to store and query their HTTP and security event logs natively within the Cloudflare network. Today, we are excited to announce that Log Explorer now supports logs from our Zero Trust product suite. In addition, customers can create custom dashboards to monitor suspicious or unusual activity.
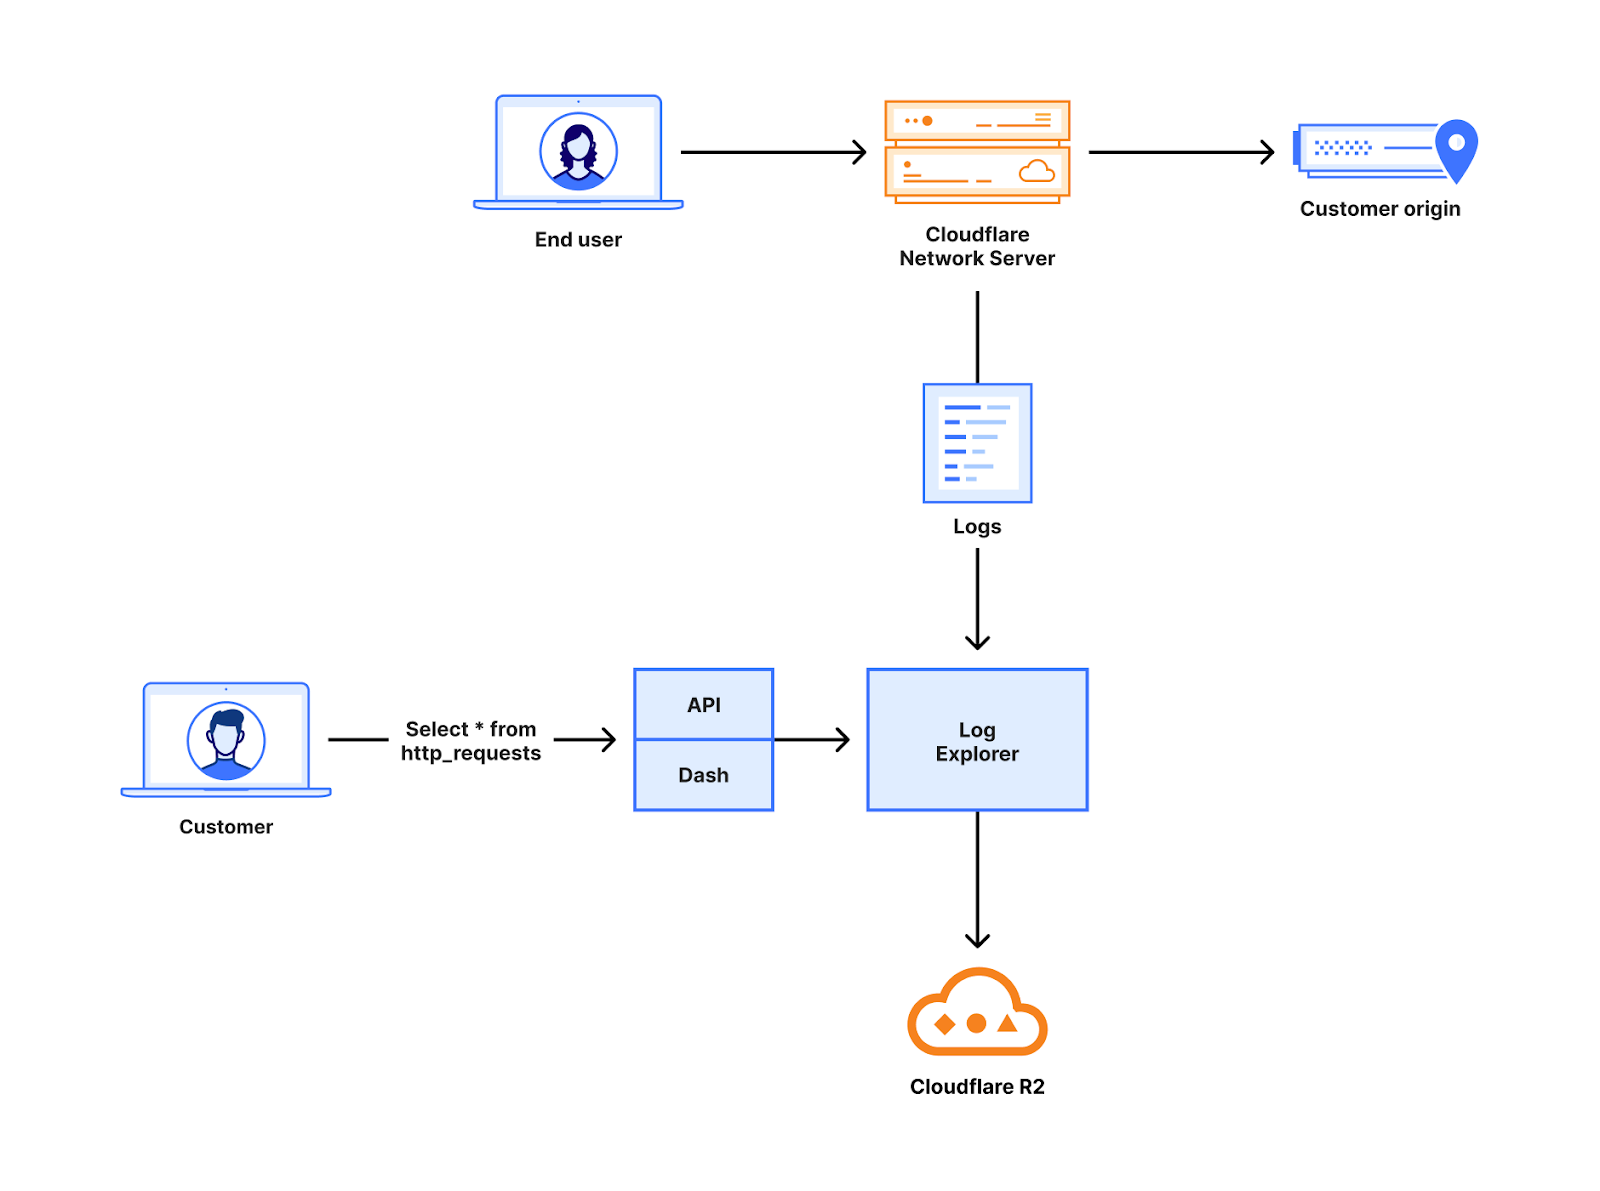
Every day, Cloudflare detects and protects customers against billions of threats, including DDoS attacks, bots, web application exploits, and more. SOC analysts, who are charged with keeping their companies safe from the growing spectre of Internet threats, may want to investigate these threats to gain additional insights on attacker behavior and protect against future attacks. Log Explorer, by collecting logs from various Cloudflare products, provides a single starting point for investigations. As a result, analysts can avoid forwarding logs to other tools, maximizing productivity and minimizing costs. Further, analysts can monitor signals specific to their organizations using custom dashboards.
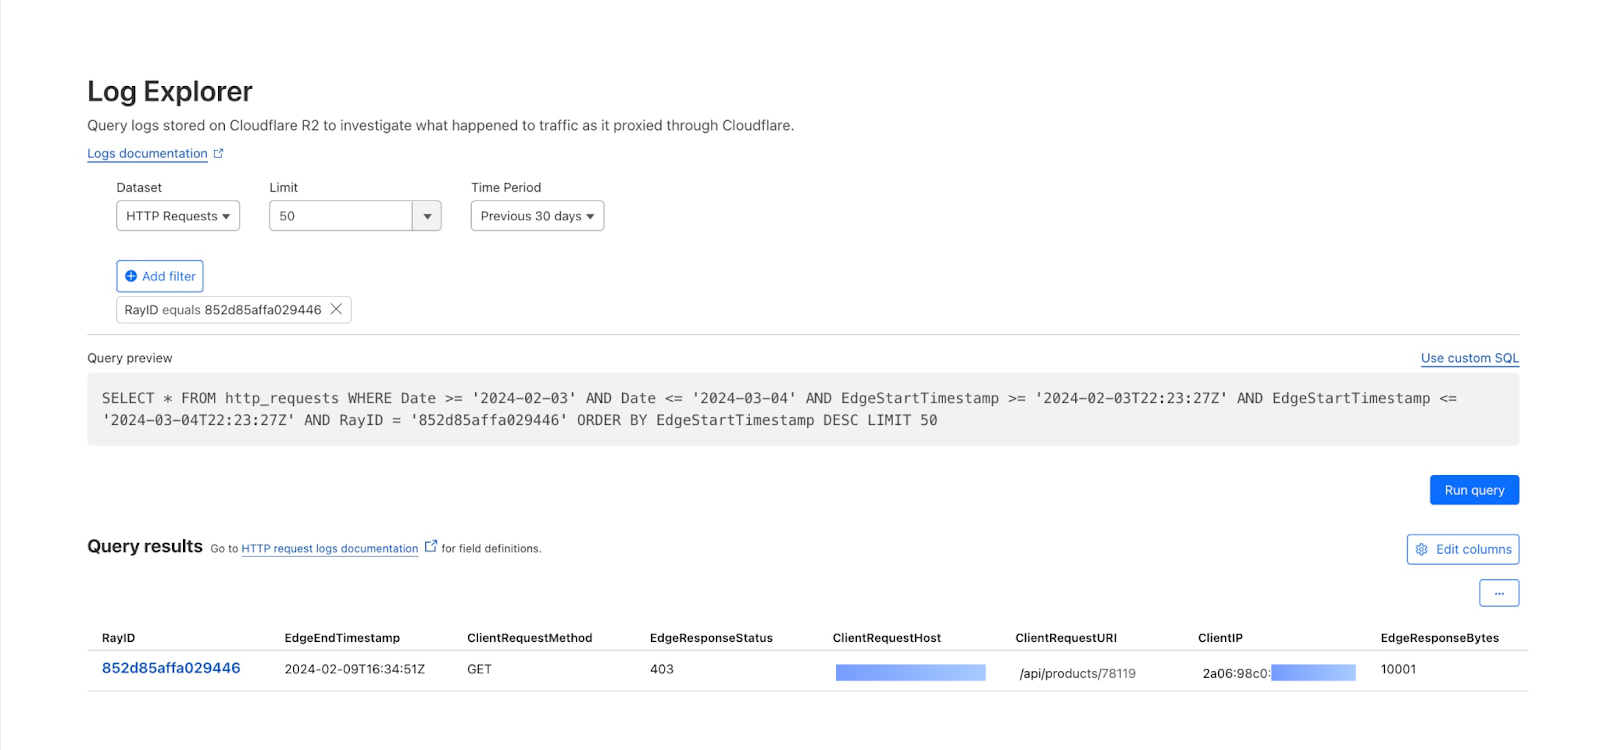
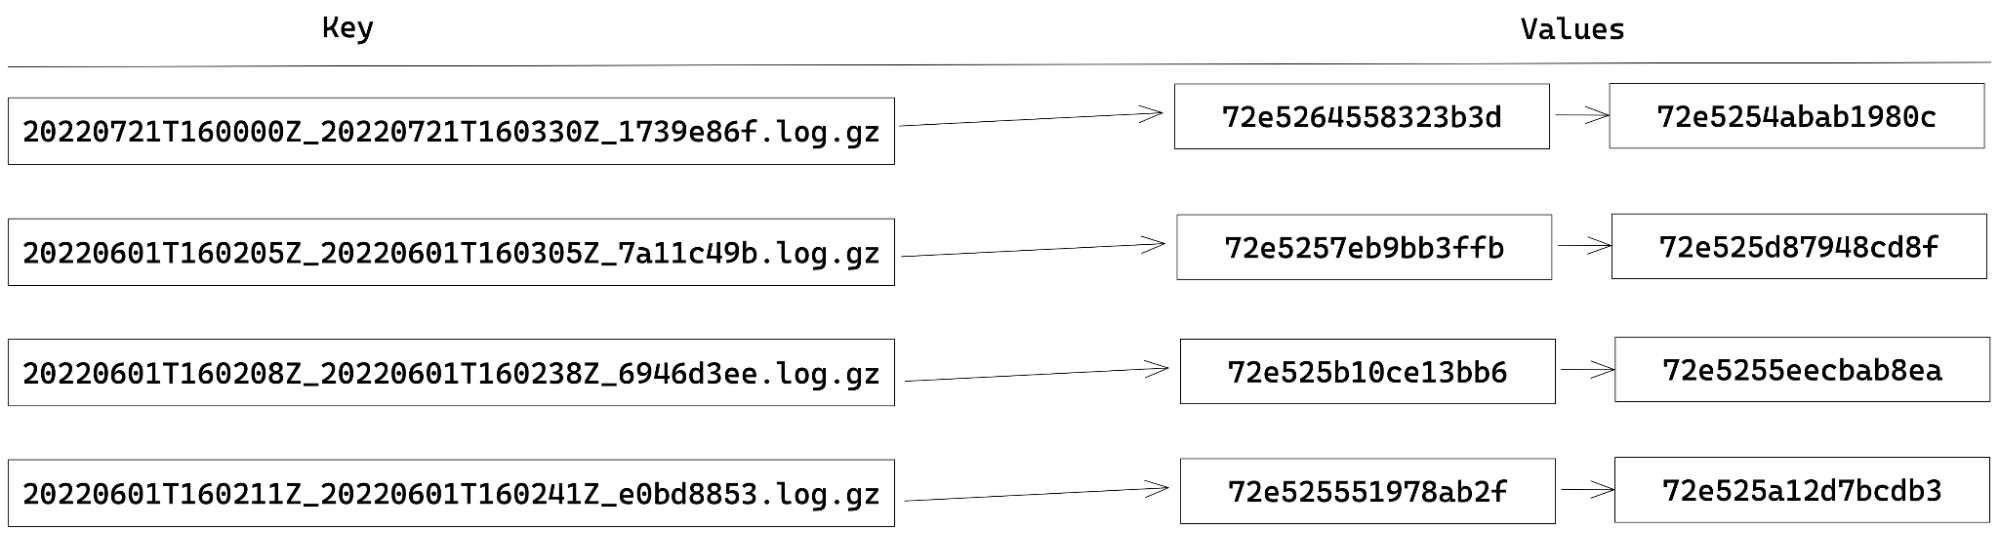
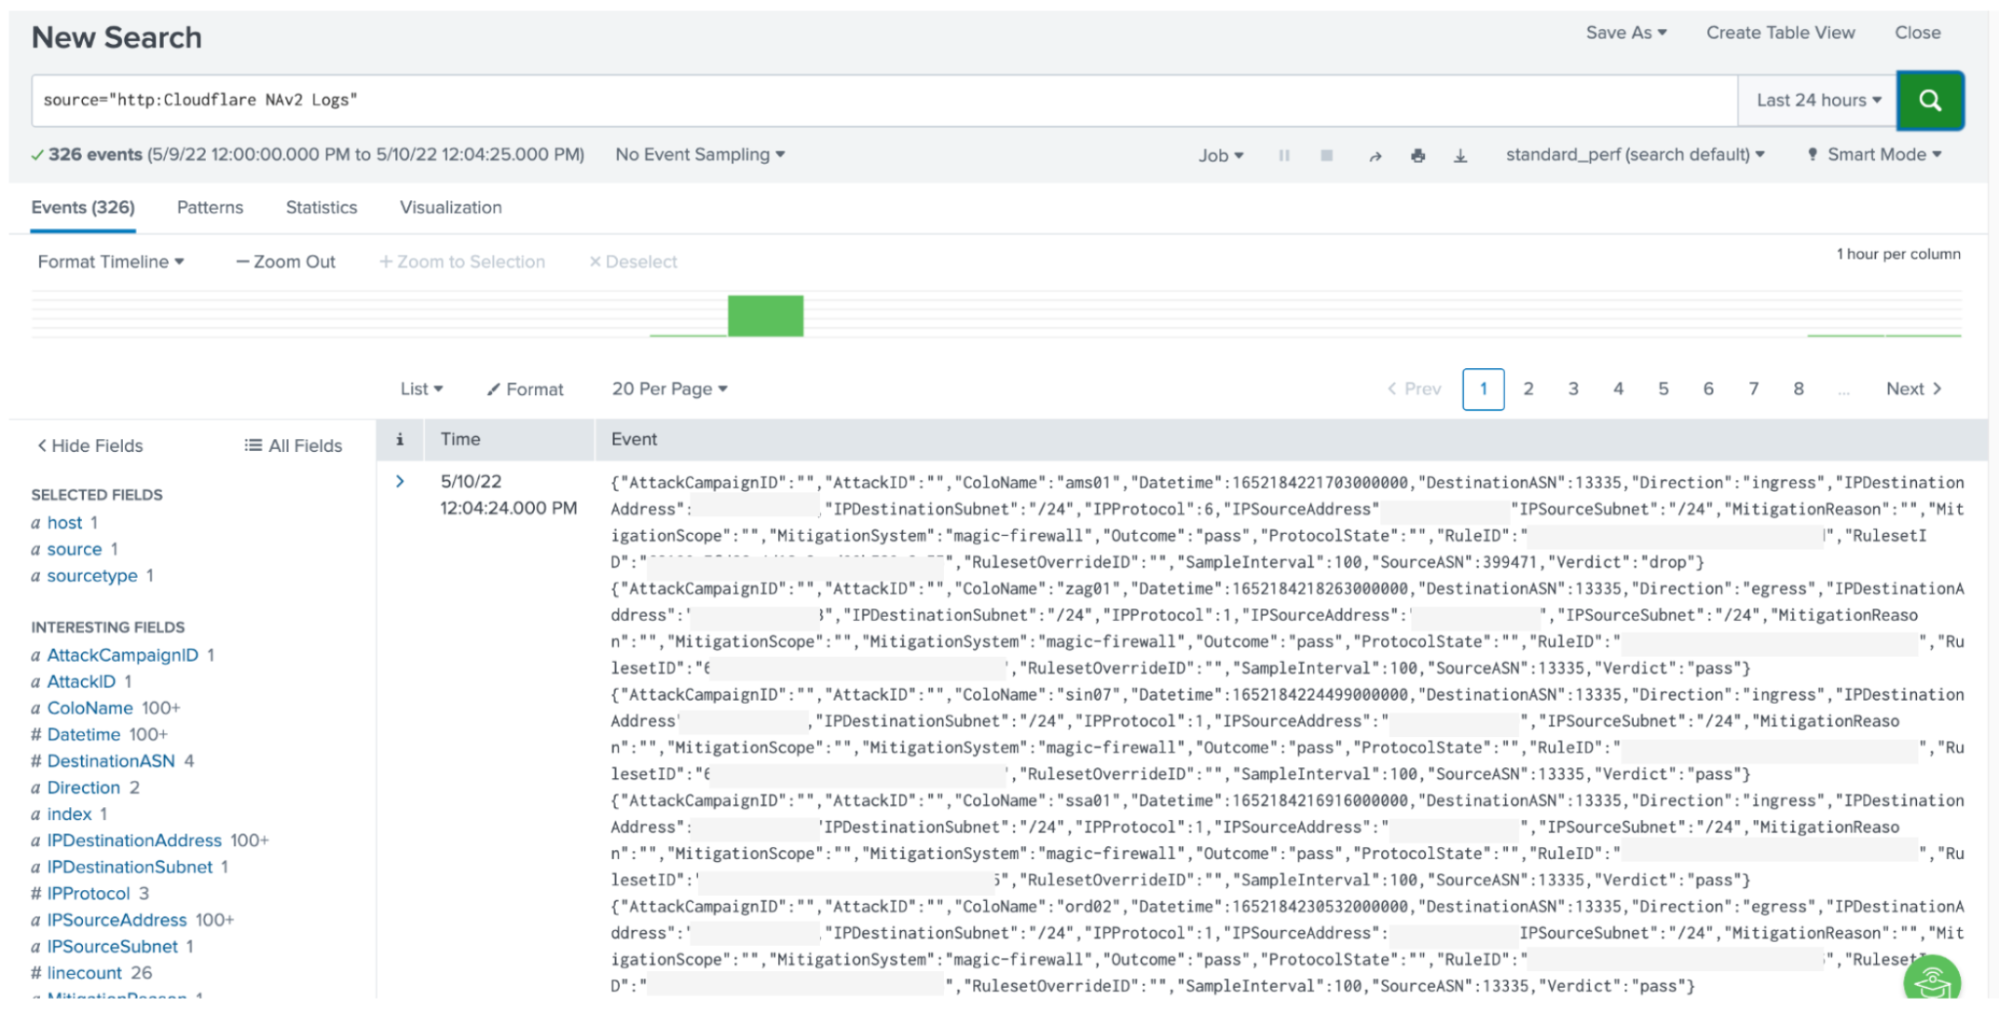
Log Explorer stores your Cloudflare logs for a 30-day retention period so that you can analyze them natively and in a single interface, within the Cloudflare Dashboard. Cloudflare log data is diverse, reflecting the breadth of capabilities available. For example, HTTP requests contain information about the client such as their IP address, request method, autonomous system (ASN), request paths, and TLS versions used. Additionally, Cloudflare’s Application Security WAF Detections enrich these HTTP request logs with additional context, such as the WAF attack score, to identify threats.
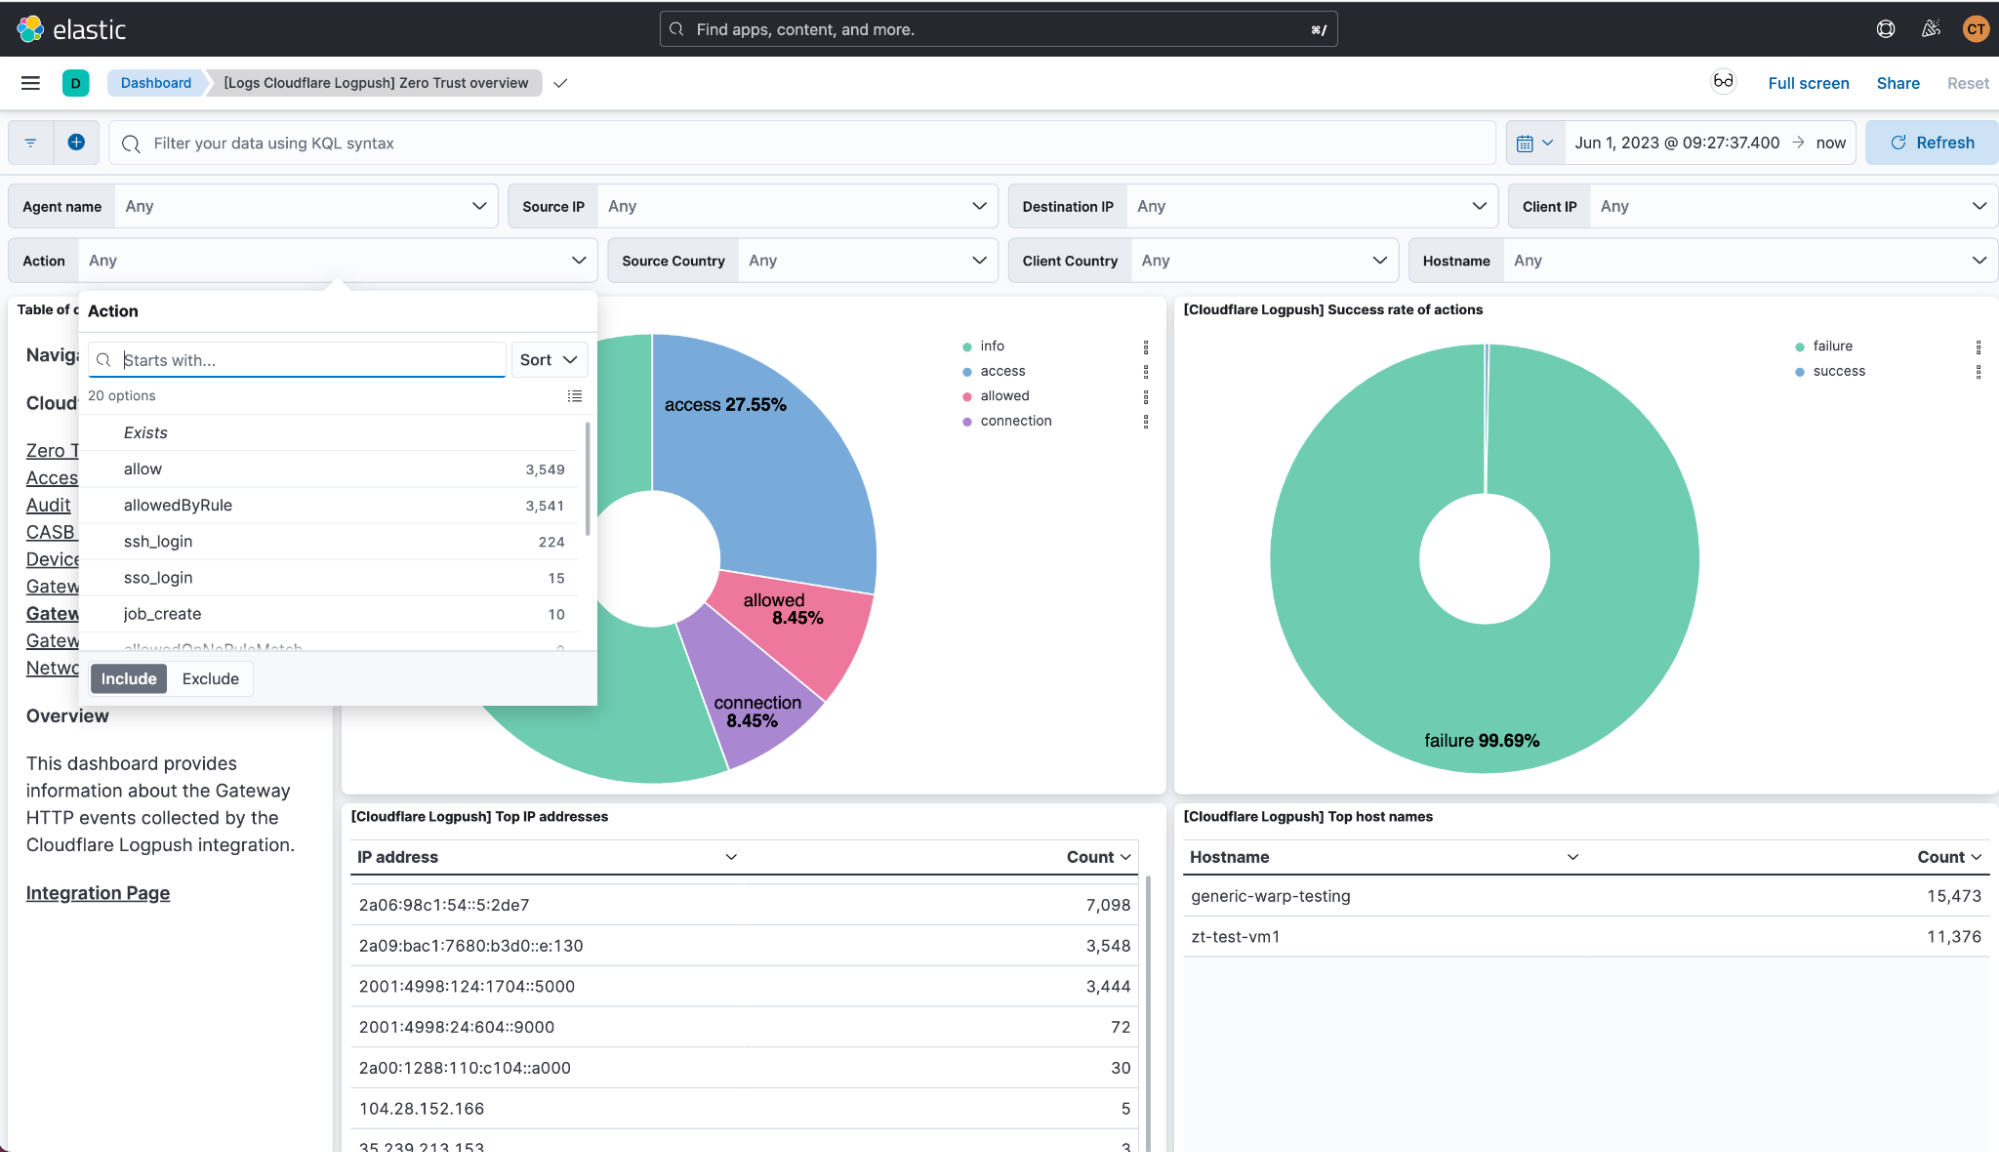
Today we are announcing that seven additional Cloudflare product datasets are now available in Log Explorer. These seven datasets are the logs generated from our Zero Trust product suite, and include logs from Access, Gateway DNS, Gateway HTTP, Gateway Network, CASB, Zero
Trust Network Session, and Device Posture Results. Read on for examples of how to use these logs to identify common threats.
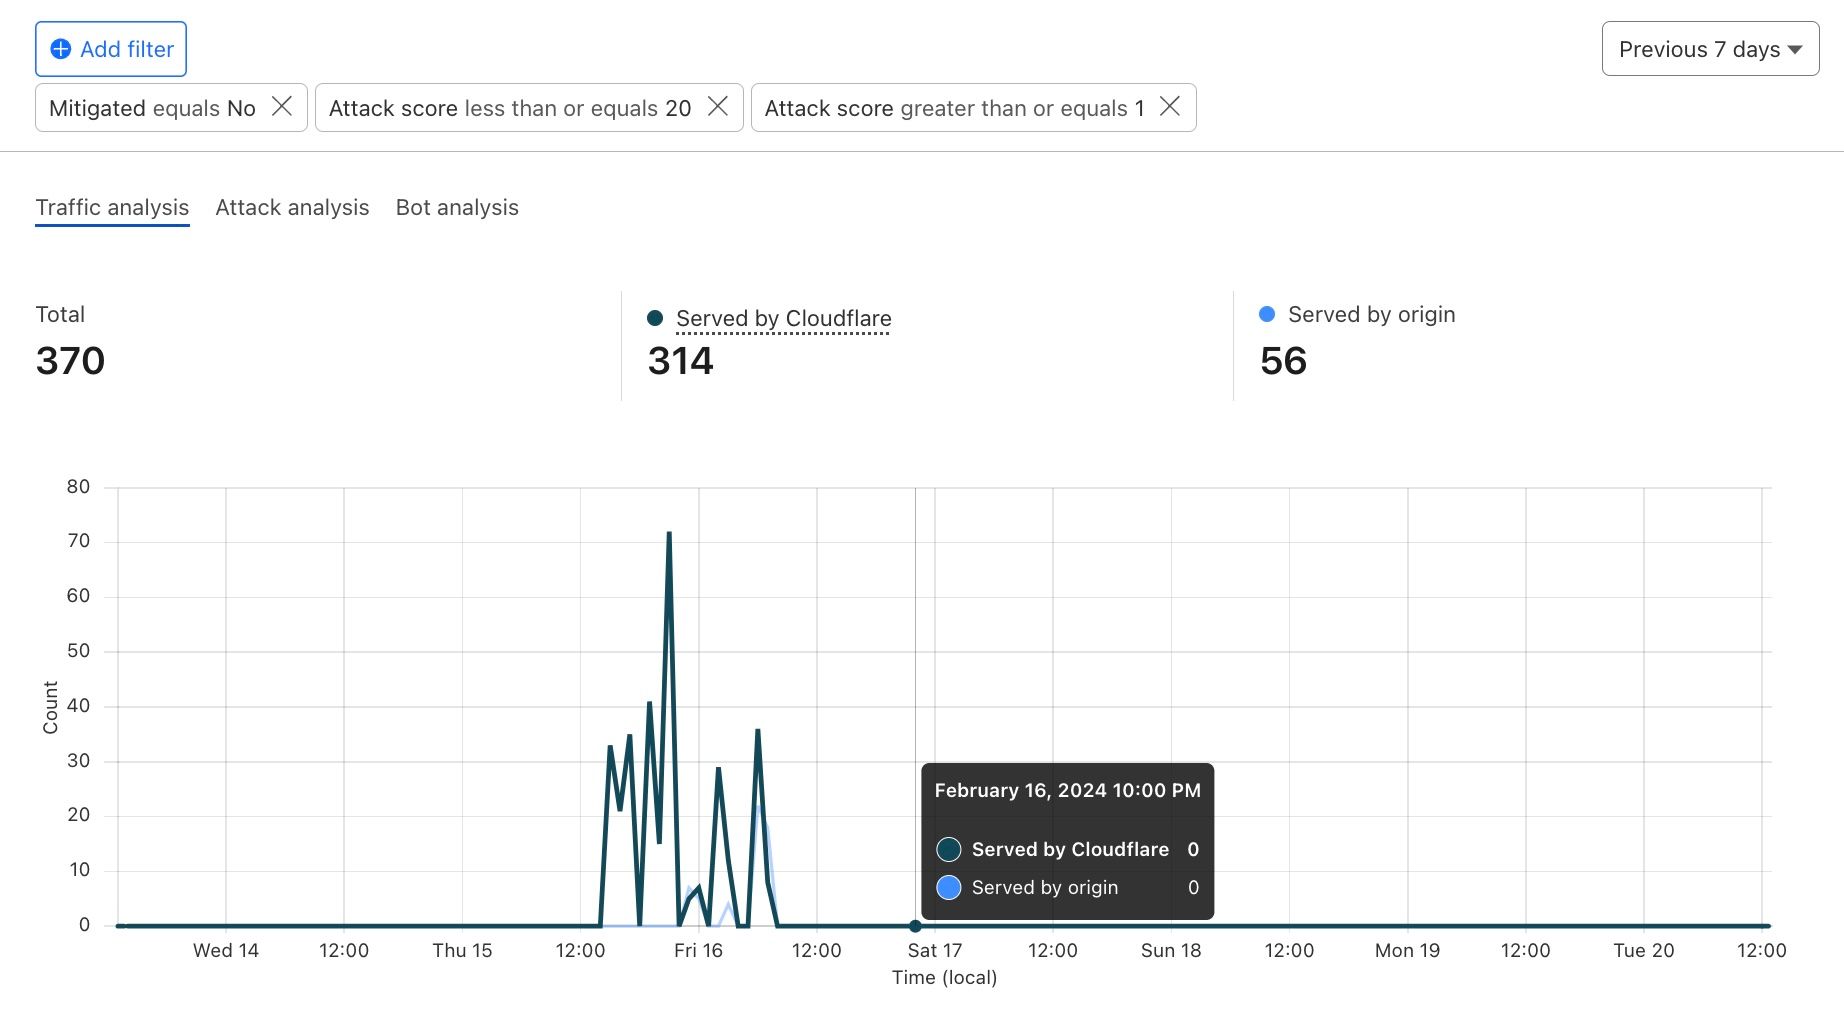
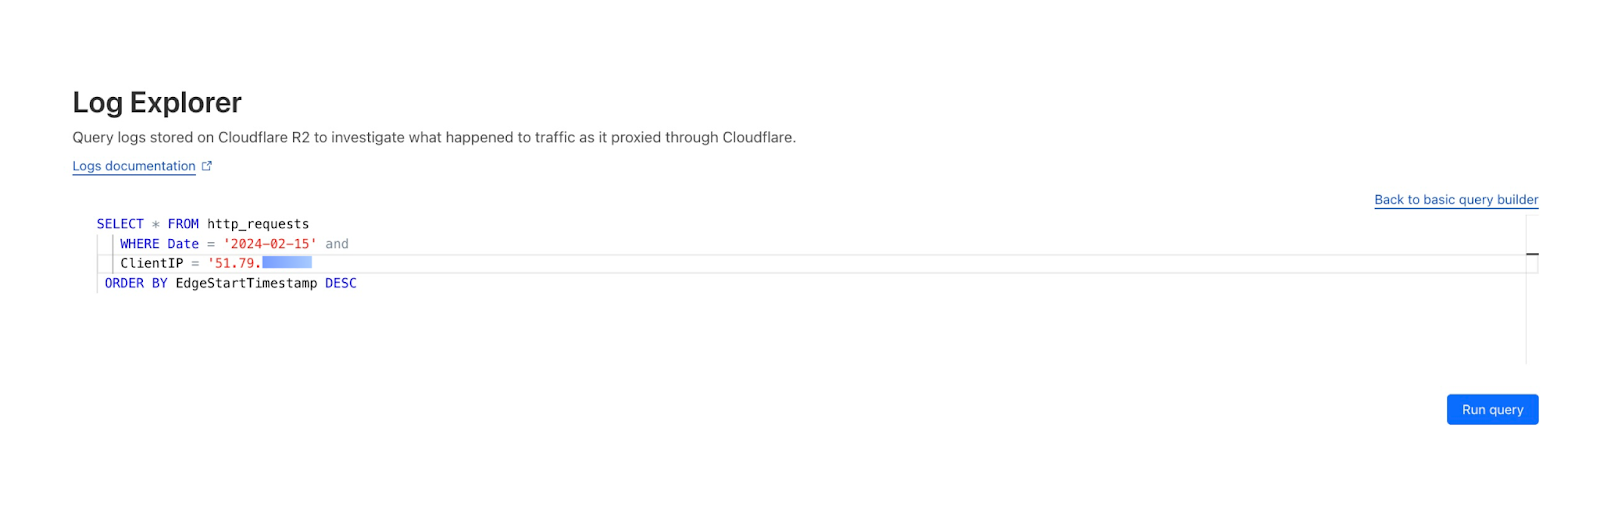
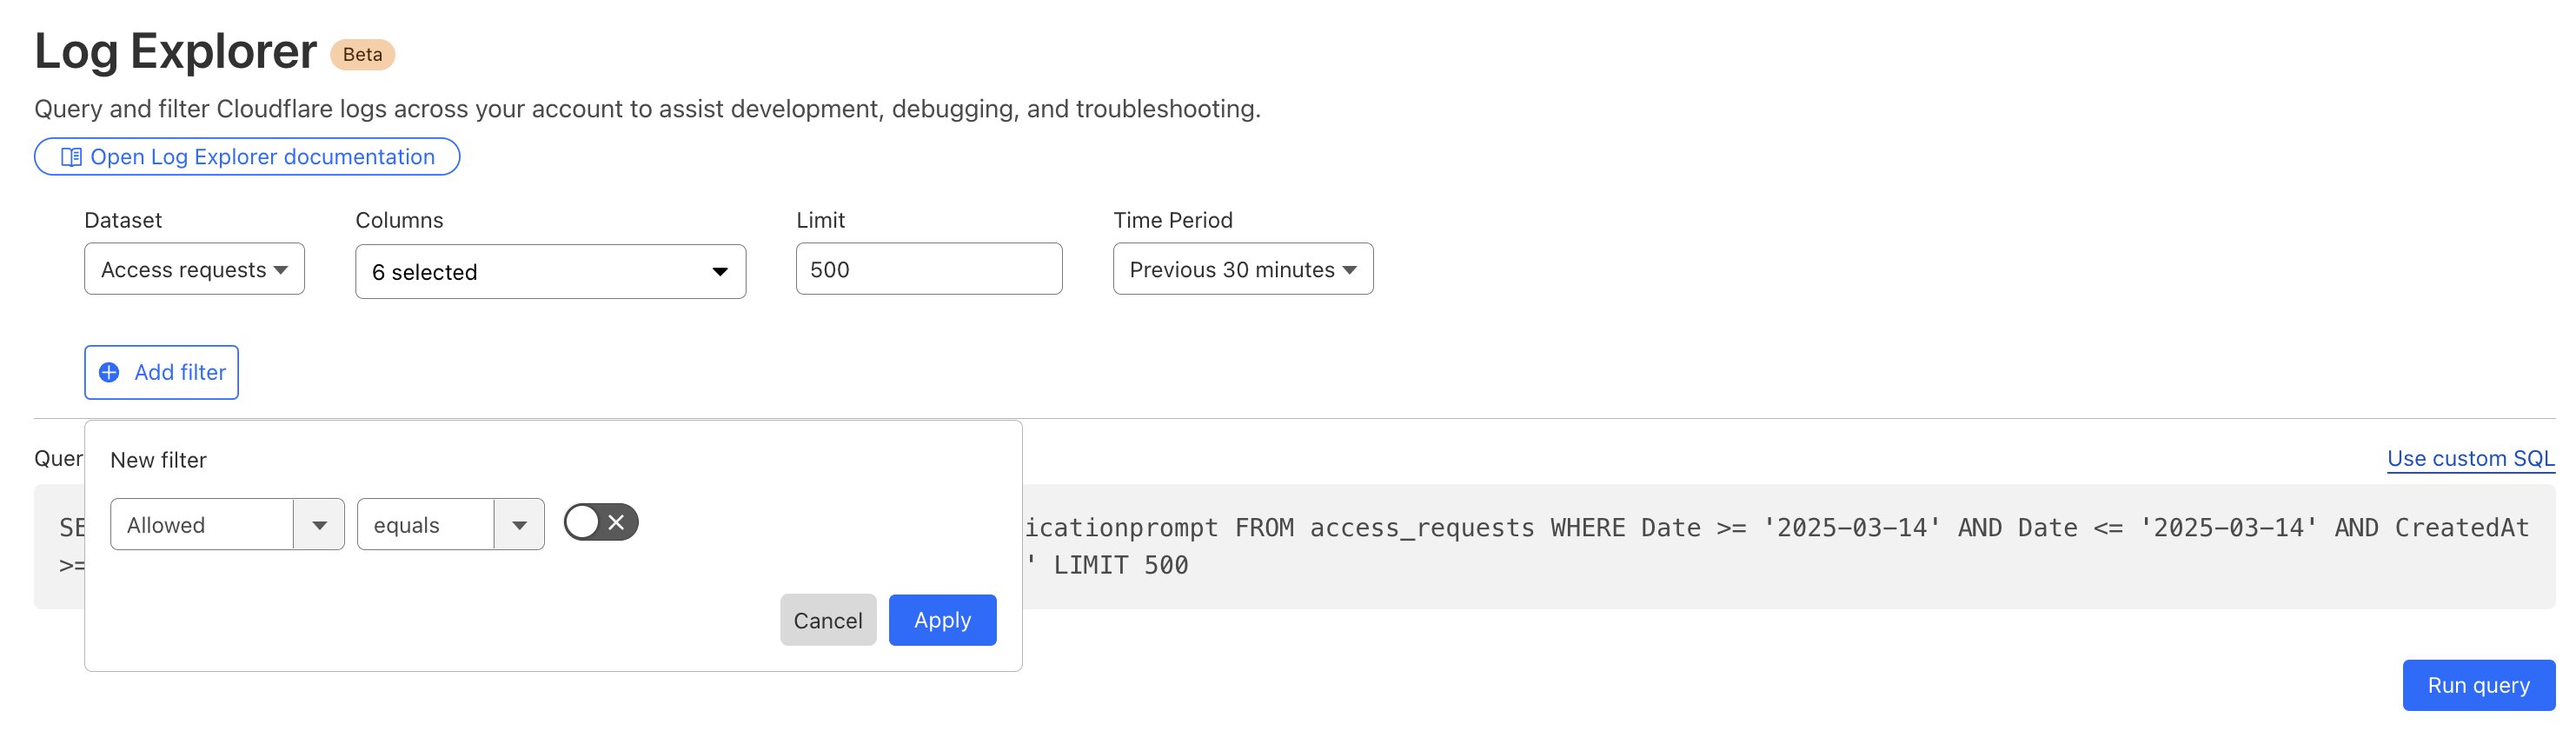
By reviewing Access logs and HTTP request logs, we can reveal attempts to access resources or systems without proper permissions, including brute force password attacks, indicating potential security breaches or malicious activity.
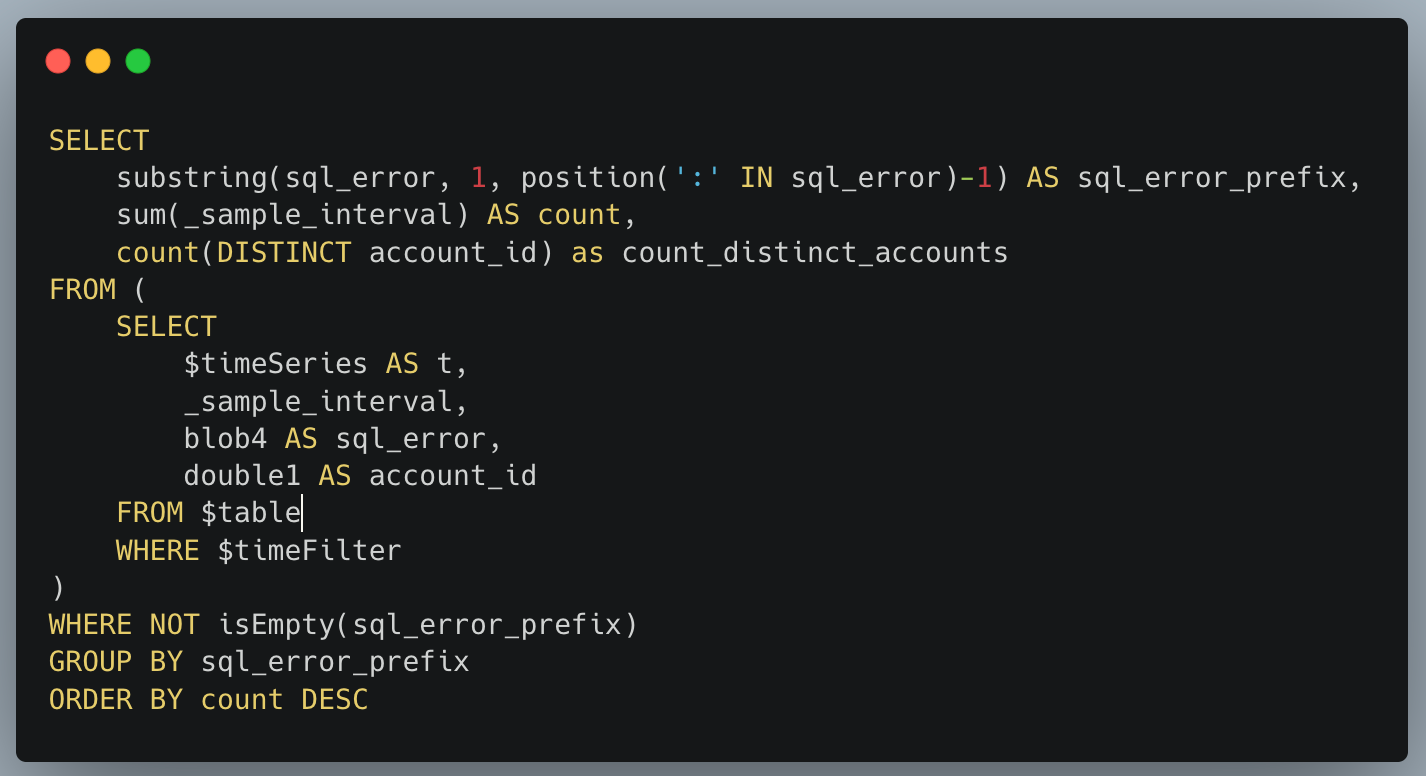
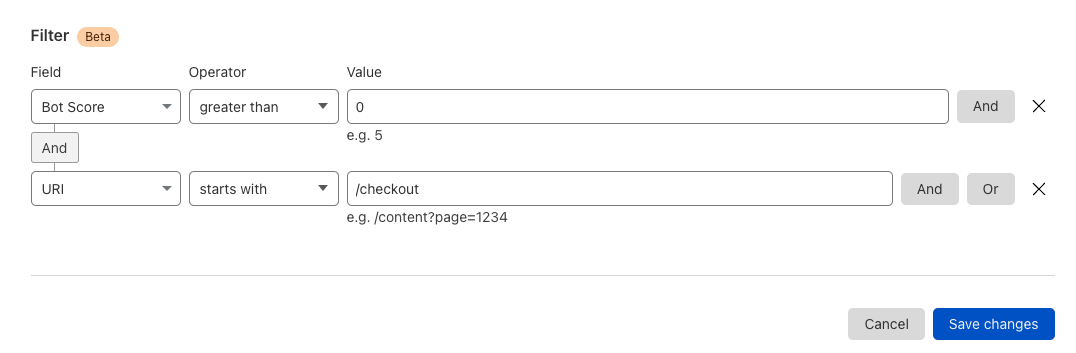
Below, we filter Access Logs on the Allowed field, to see activity related to unauthorized access.
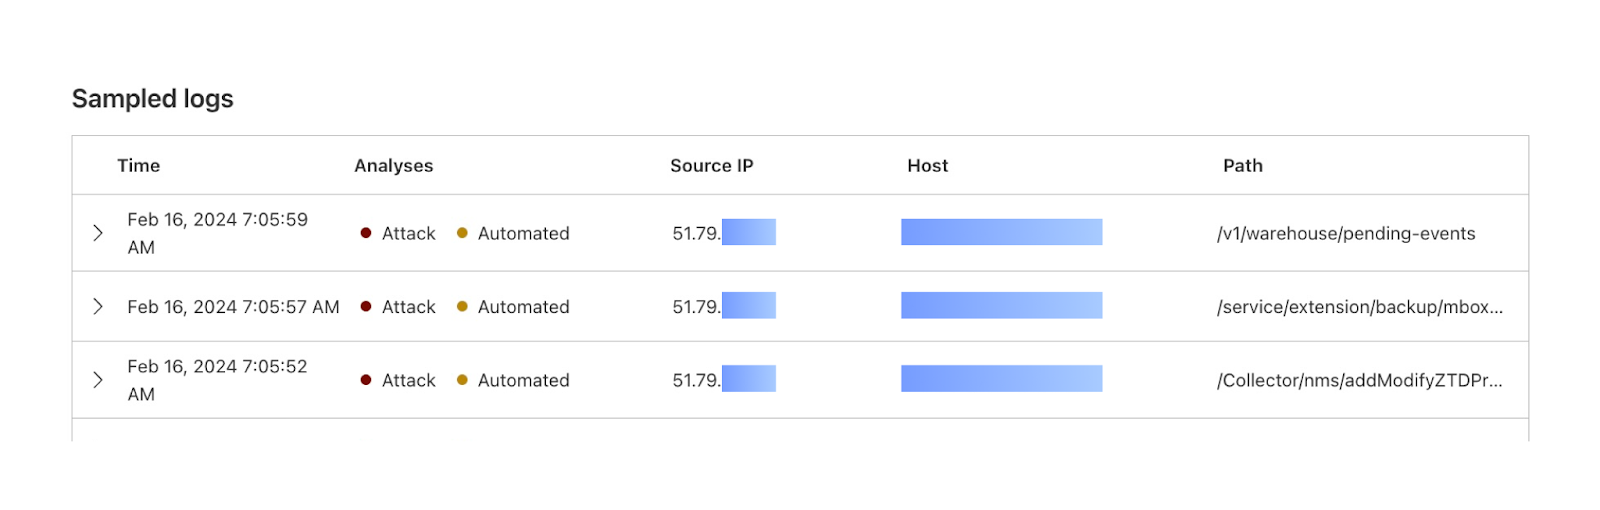
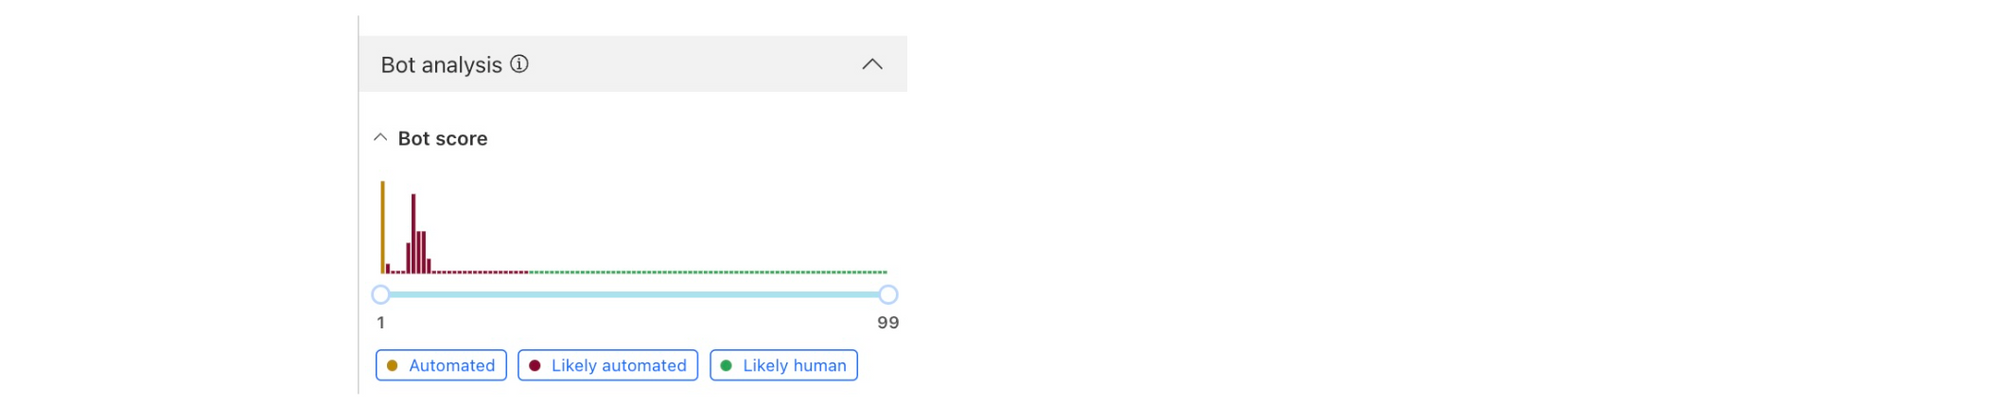
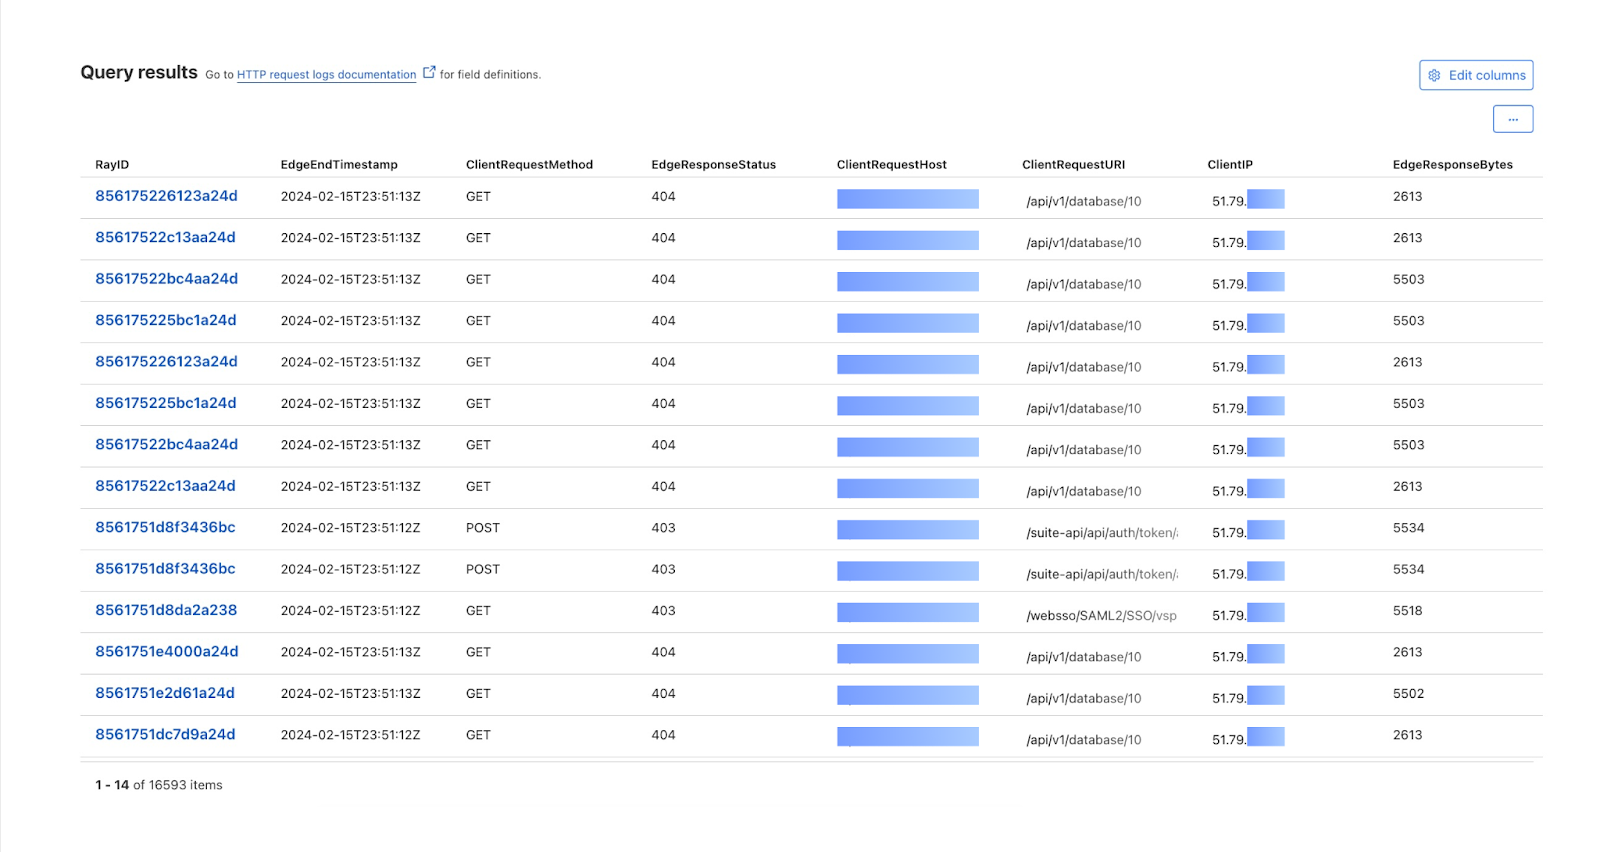
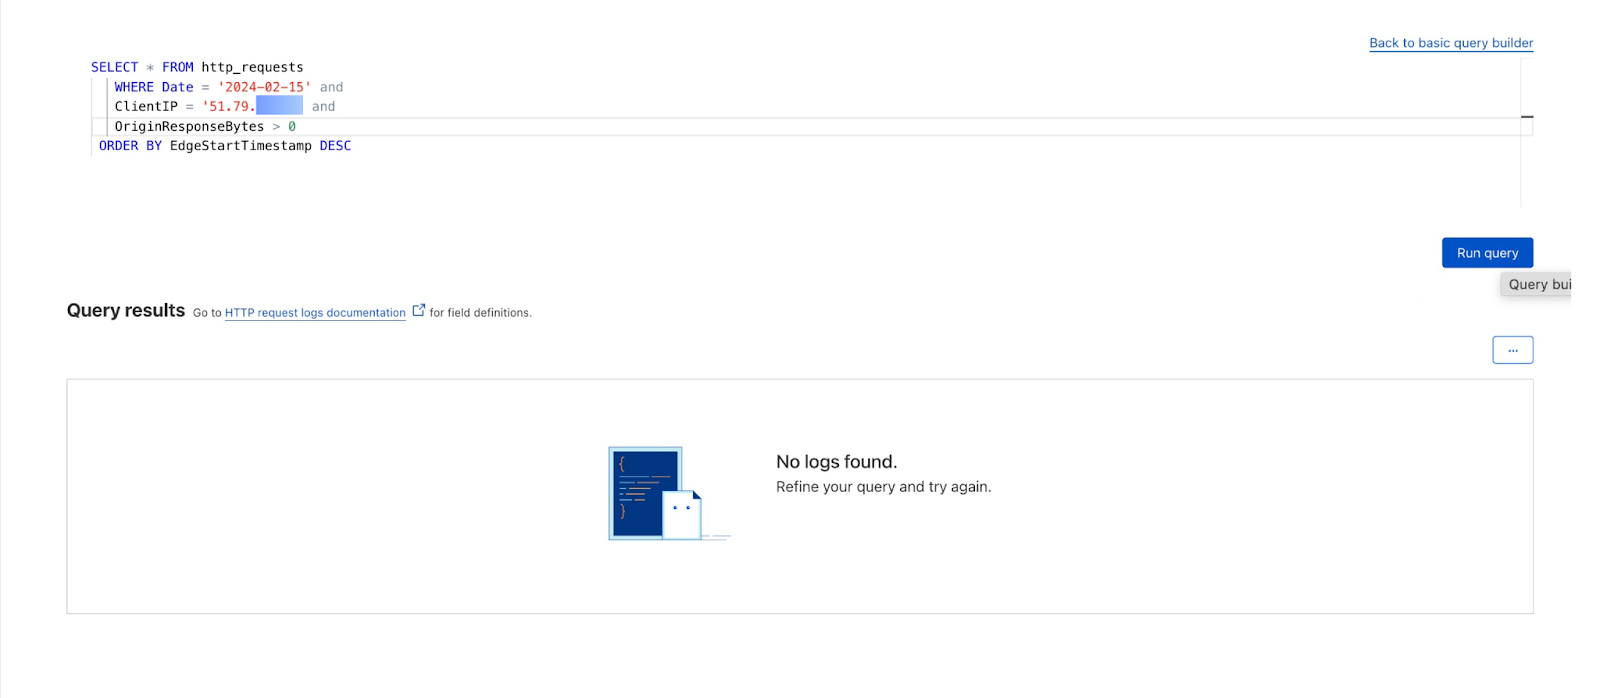
By then reviewing the HTTP logs for the requests identified in the previous query, we can assess if bot networks are the source of unauthorized activity.
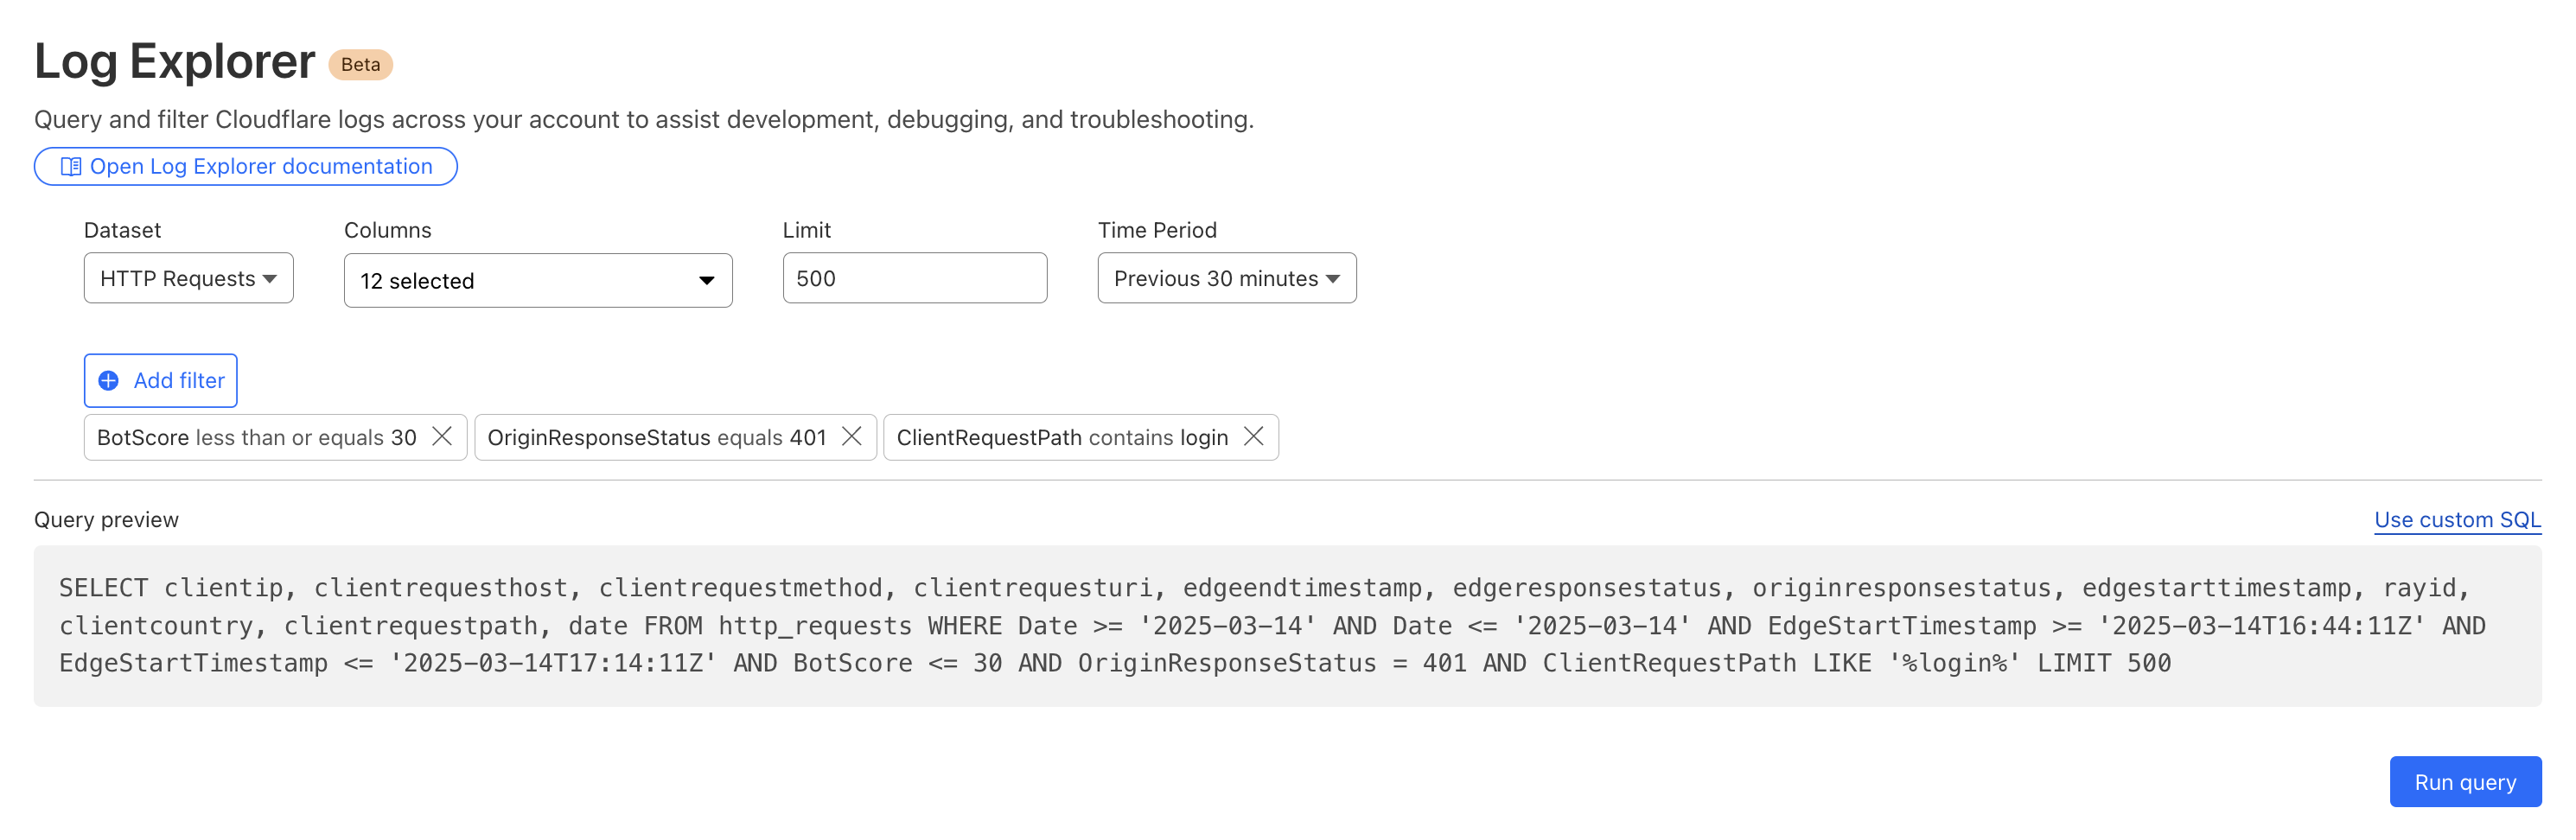
With this information, you can craft targeted Custom Rules to block the offending traffic.
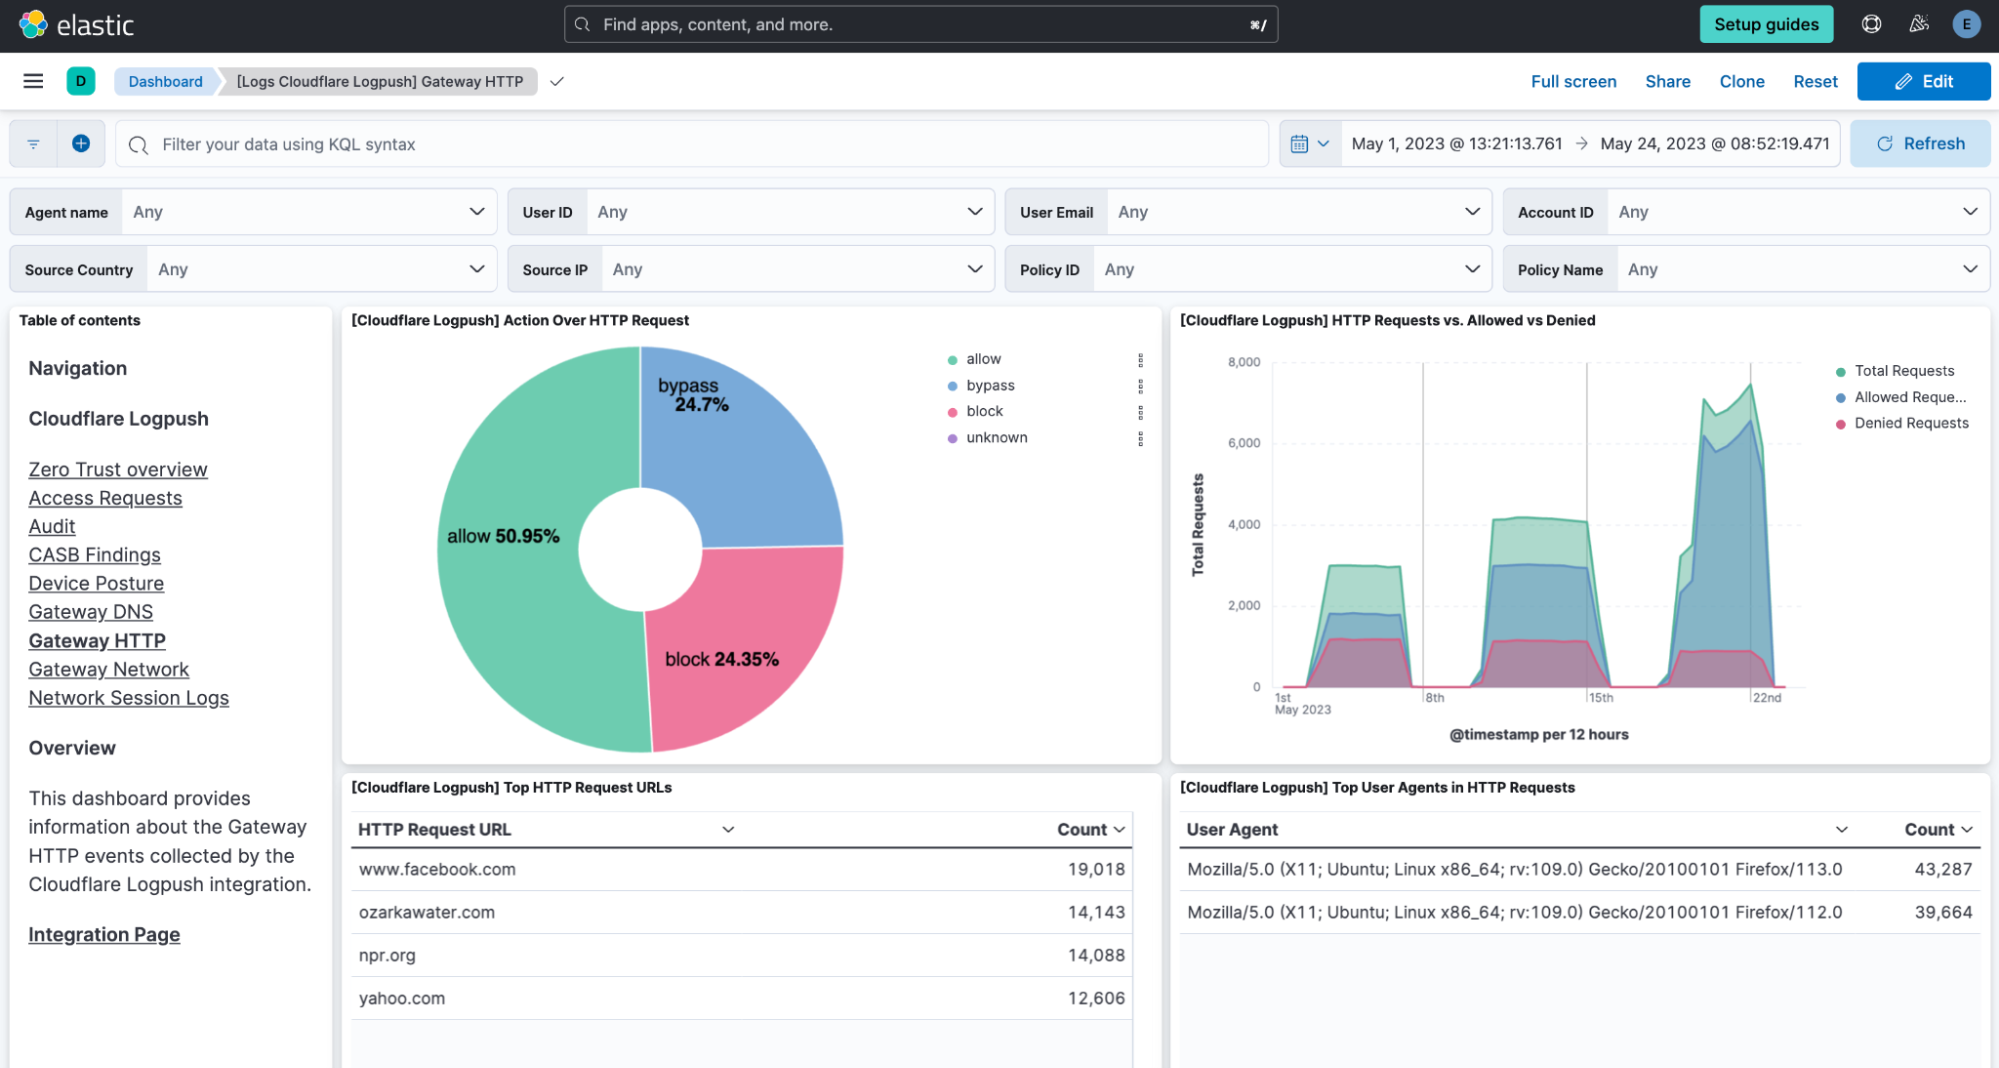
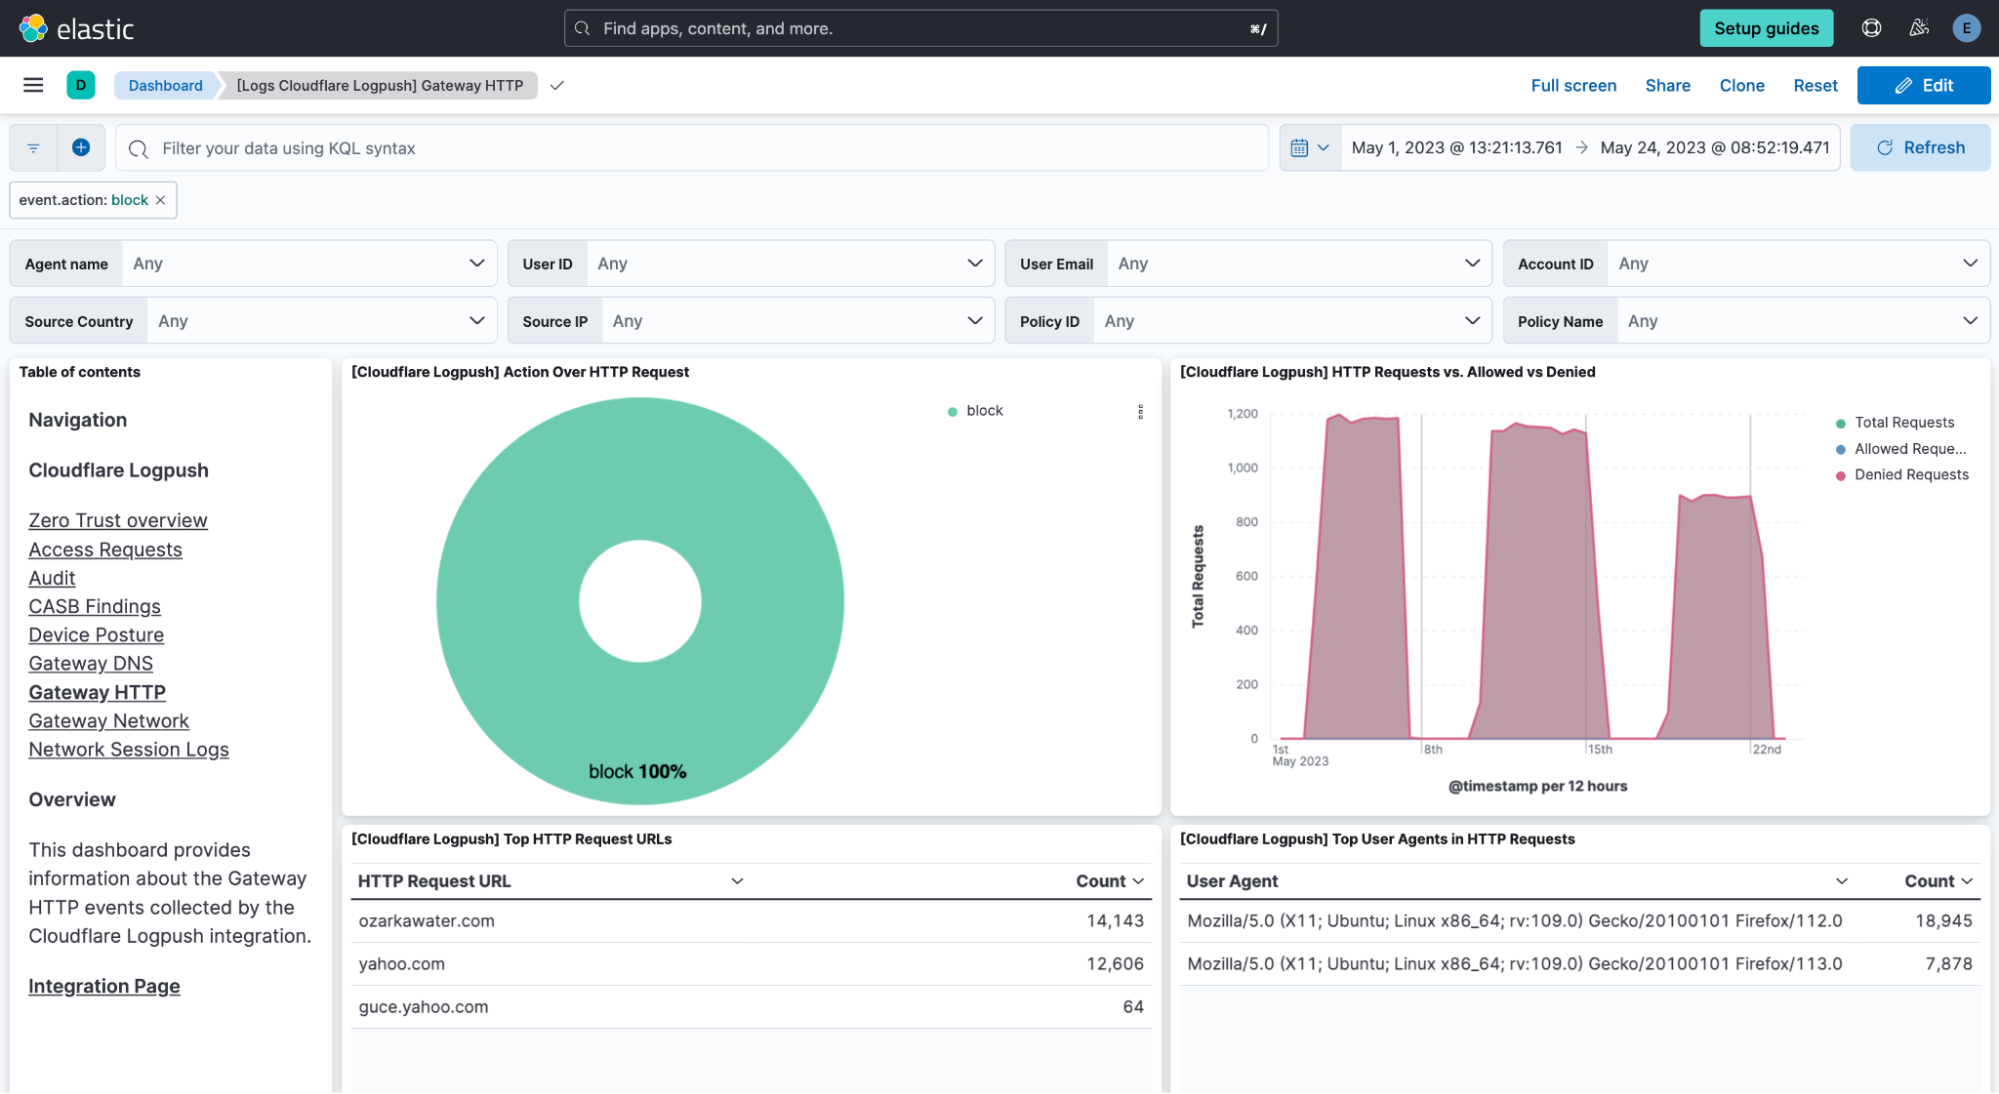
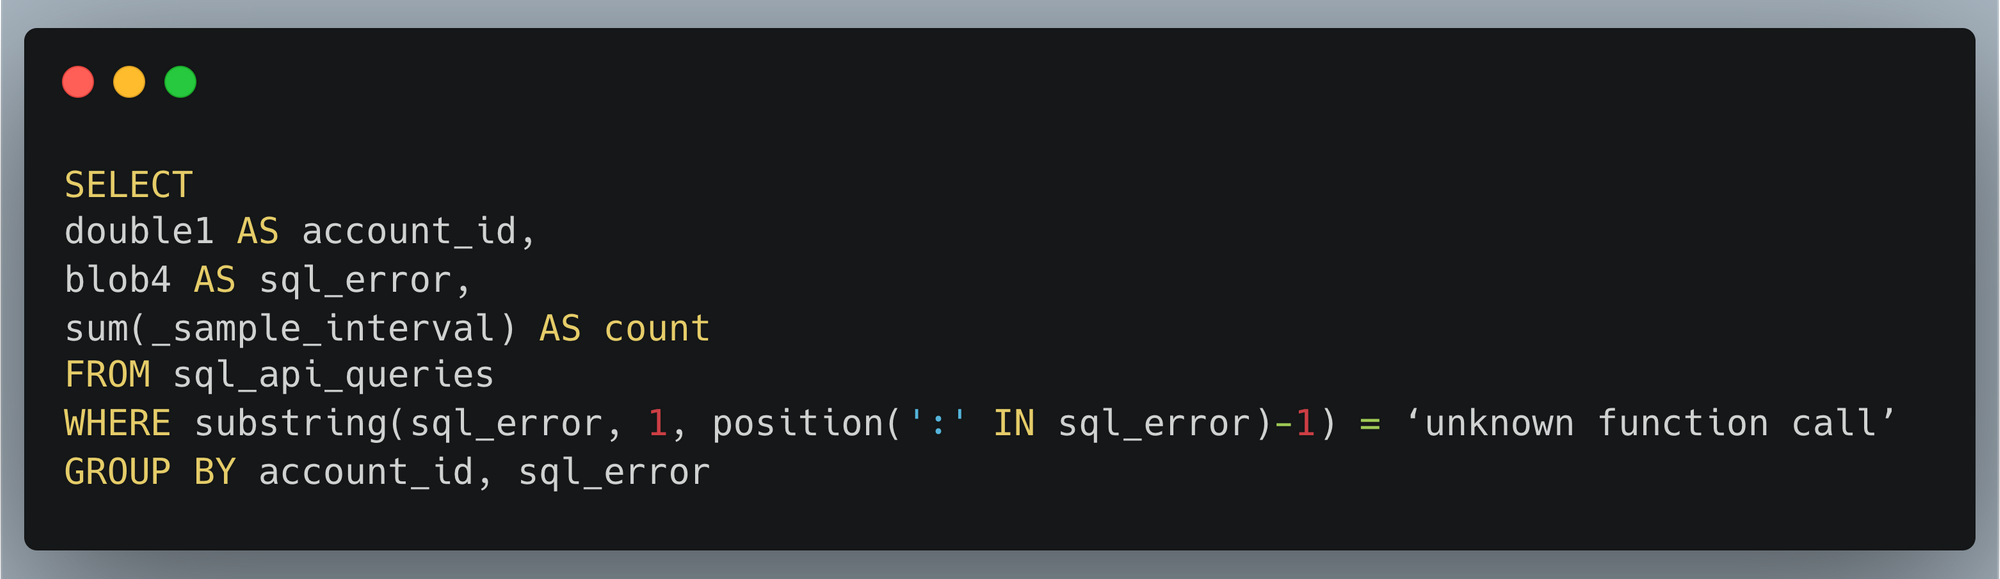
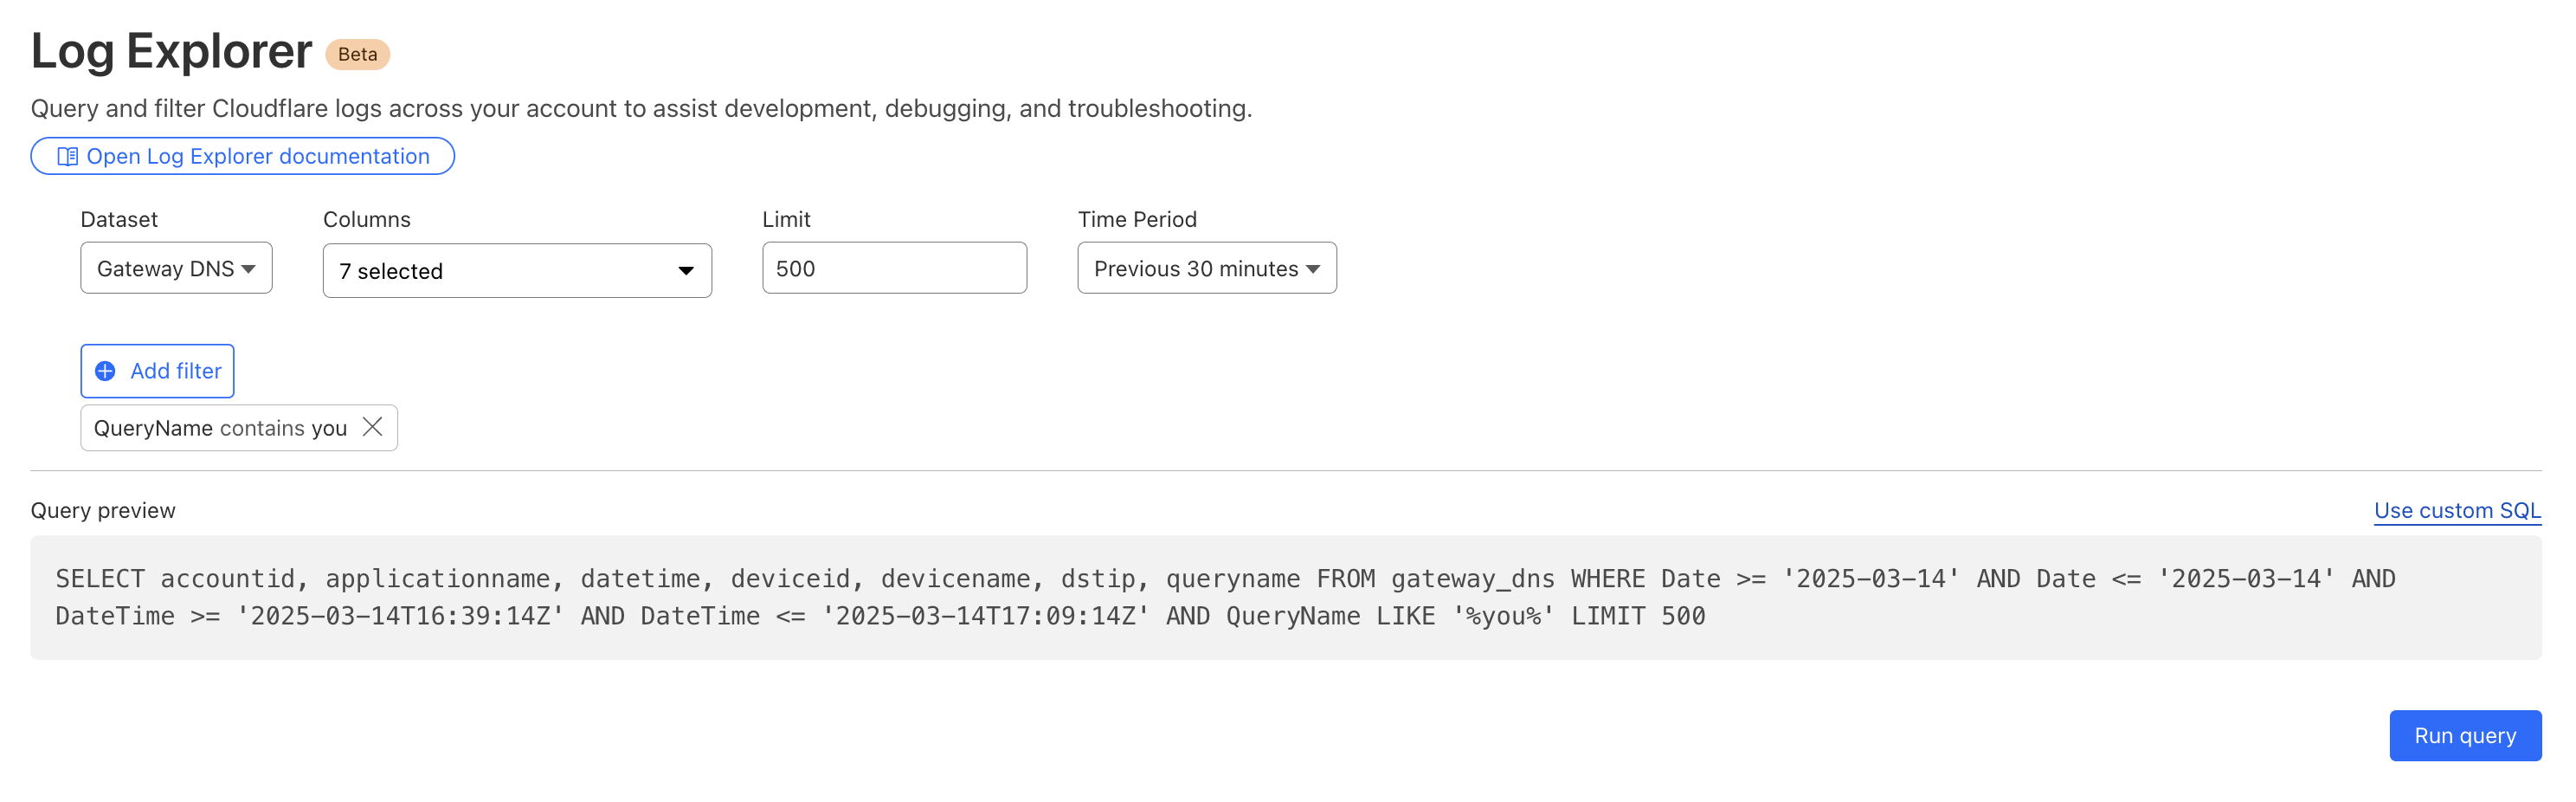
Cloudflare’s Web Gateway can track which websites users are accessing, allowing administrators to identify and block access to malicious or inappropriate sites. These logs can be used to detect if a user’s machine or account is compromised by malware attacks. When reviewing logs, this may become apparent when we look for records that show a rapid succession of attempts to browse known malicious sites, such as hostnames that have long strings of seemingly random characters that hide their true destination. In this example, we can query logs looking for requests to a spoofed YouTube URL.
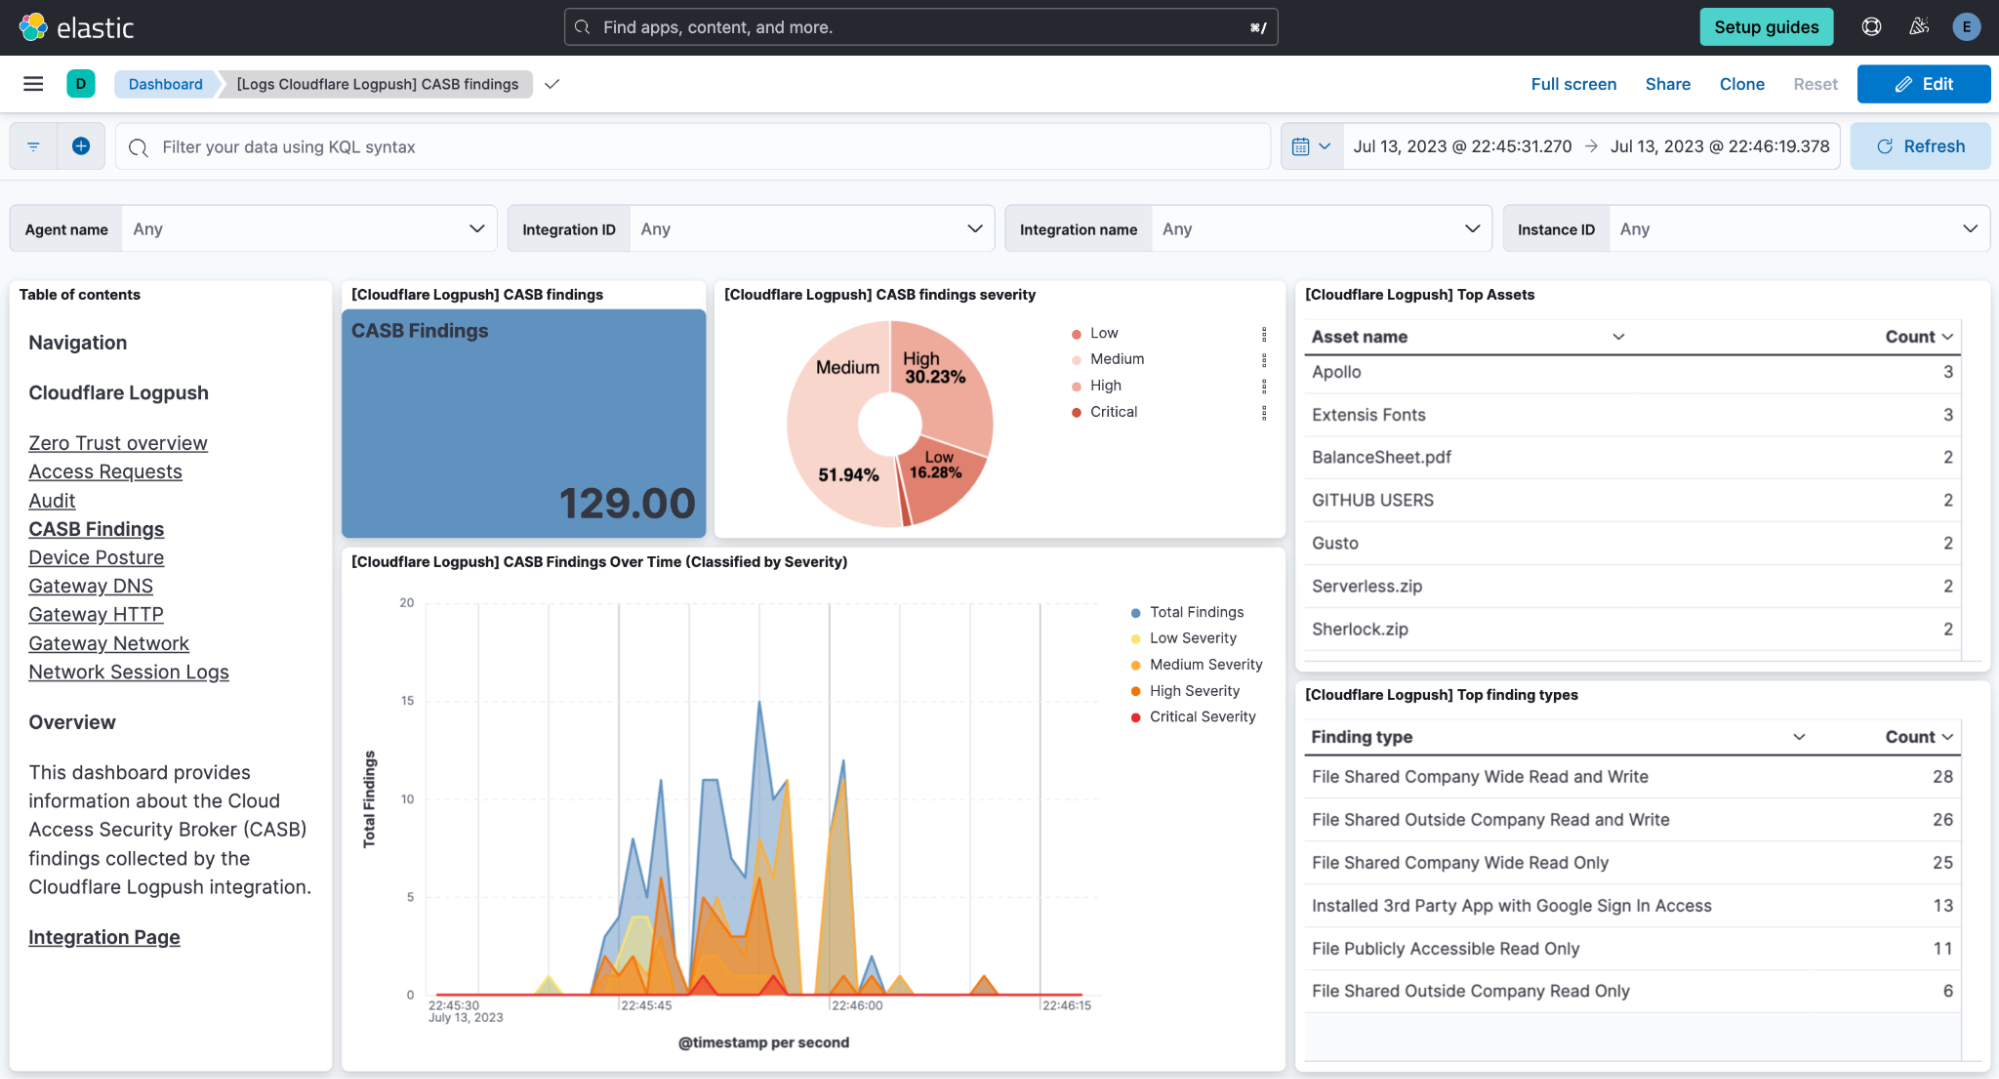
Security monitoring is not one size fits all. For instance, companies in the retail or financial industries worry about fraud, while every company is concerned about data exfiltration, of information like trade secrets. And any form of personally identifiable information (PII) is a target for data breaches or ransomware attacks.
While log exploration helps you react to threats, our new custom dashboards allow you to define the specific metrics you need in order to monitor threats you are concerned about.
Getting started is easy, with the ability to create a chart using natural language. A natural language interface is integrated into the chart create/edit experience, enabling you to describe in your own words the chart you want to create. Similar to the AI Assistant we announced during Security Week 2024, the prompt translates your language to the appropriate chart configuration, which can then be added to a new or existing custom dashboard.
-
Use a prompt: Enter a query like “Compare status code ranges over time”. The AI model decides the most appropriate visualization and constructs your chart configuration.
-
Customize your chart: Select the chart elements manually, including the chart type, title, dataset to query, metrics, and filters. This option gives you full control over your chart’s structure.
Video shows entering a natural language description of desired metric “compare status code ranges over time”, preview chart shown is a time series grouped by error code ranges, selects “add chart” to save to dashboard.
For more help getting started, we have some pre-built templates that you can use for monitoring specific uses. Available templates currently include:
-
Bot monitoring: Identify automated traffic accessing your website
-
API Security: Monitor the data transfer and exceptions of API endpoints within your application
-
API Performance: See timing data for API endpoints in your application, along with error rates
-
Account Takeover: View login attempts, usage of leaked credentials, and identify account takeover attacks
-
Performance Monitoring: Identify slow hosts and paths on your origin server, and view time to first byte (TTFB) metrics over time
Templates provide a good starting point, and once you create your dashboard, you can add or remove individual charts using the same natural language chart creator.
Video shows editing chart from an existing dashboard and moving individual charts via drag and drop.
Custom dashboards can be used to monitor for suspicious activity, or to keep an eye on performance and errors for your domains. Let’s explore some examples of suspicious activity that we can monitor using custom dashboards.
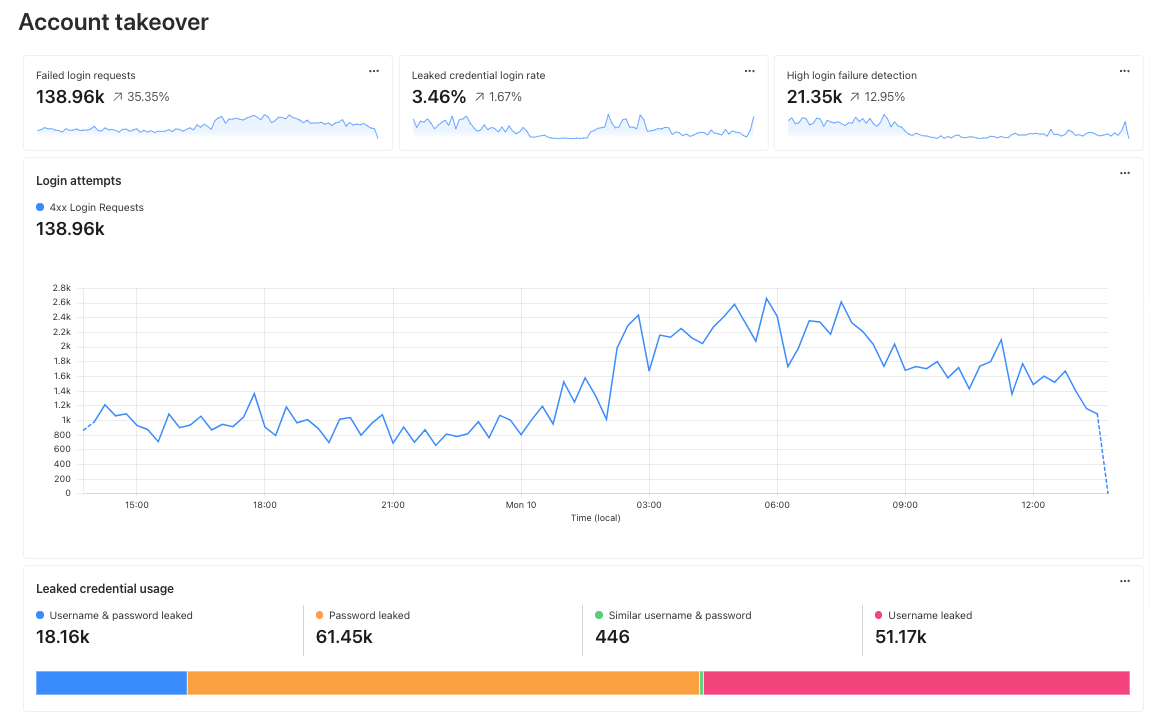
Take, for example, our use case from above: investigating unauthorized access. With custom dashboards, you can create a dashboard using the Account takeover template to monitor for suspicious login activity related to your domain.
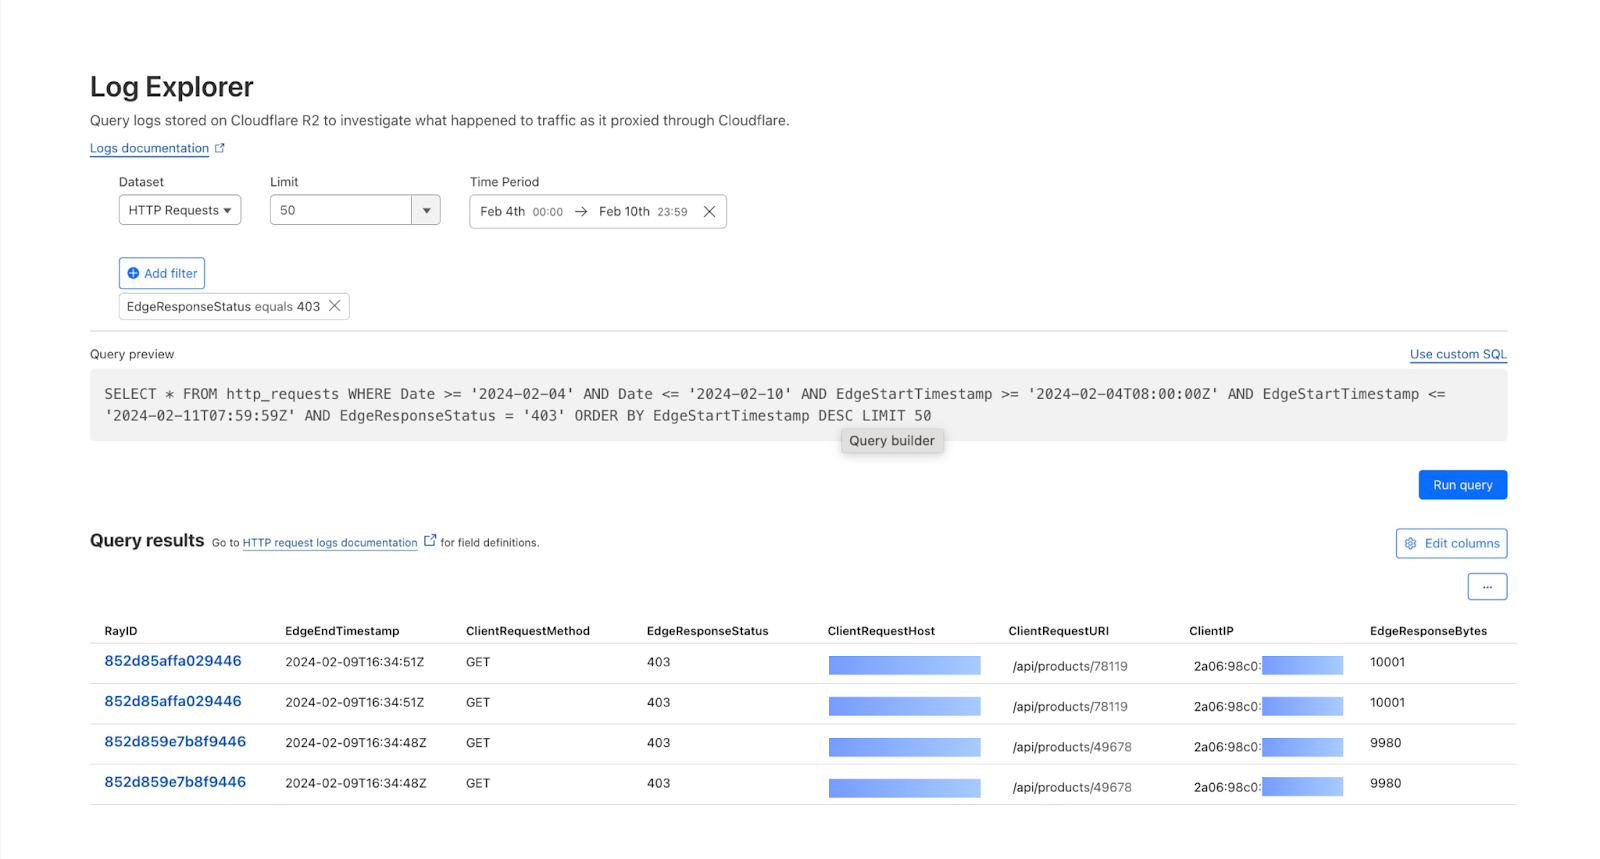
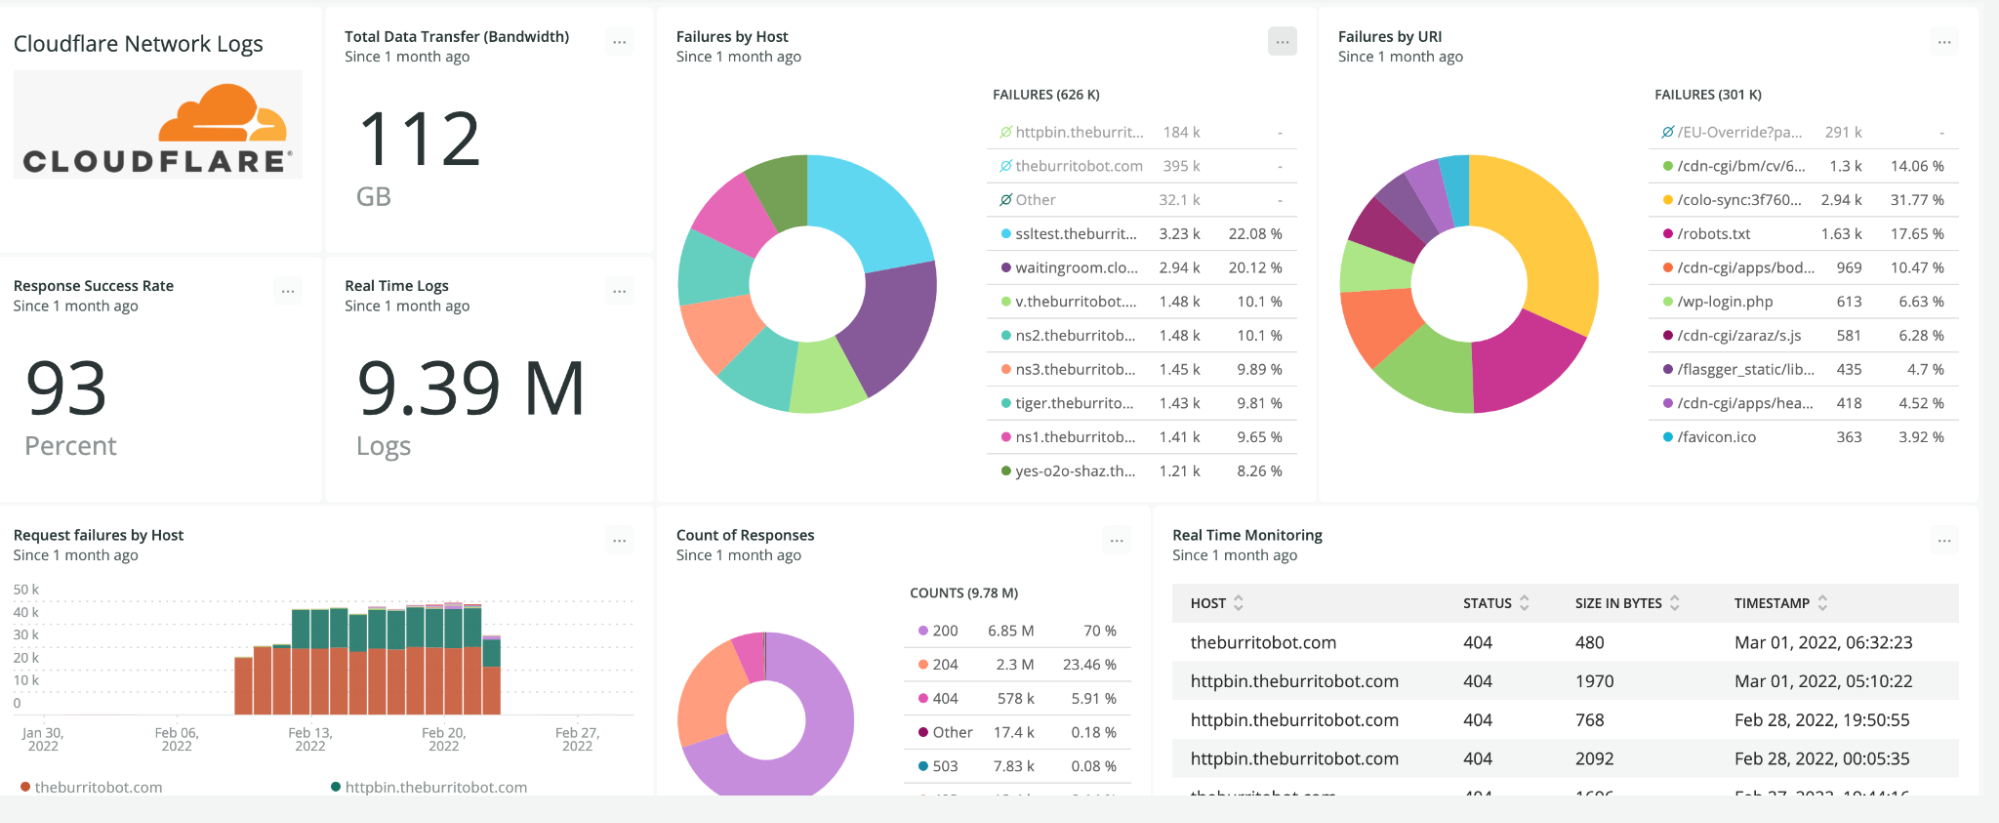
As another example, spikes in requests or errors are common indicators that something is wrong, and they can sometimes be signals of suspicious activity. With the Performance Monitoring template, you can view origin response time and time to first byte metrics as well as monitor for common errors. For example, in this chart, the spikes in 404 errors could be an indication of an unauthorized scan of your endpoints.
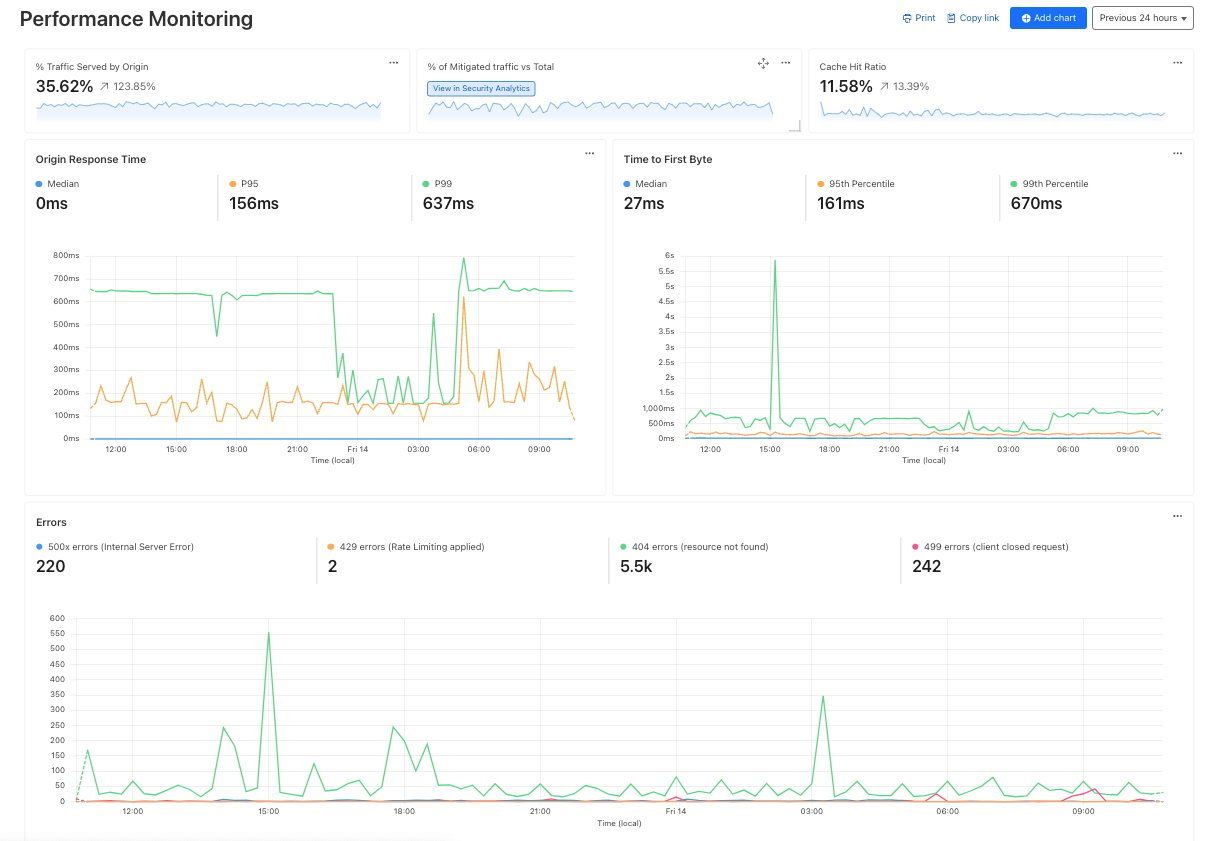
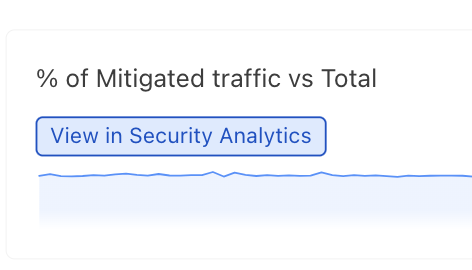
When using custom dashboards, if you observe a traffic pattern or spike in errors that you would like to further investigate, you can click the button to “View in Security Analytics” in order to drill down further into the data and craft custom WAF rules to mitigate the threat.
These tools, seamlessly integrated into the Cloudflare platform, will enable users to discover, investigate, and mitigate threats all in one place, reducing time to resolution and overall cost of ownership by eliminating the need to forward logs to third party security analysis tools. And because it is a native part of Cloudflare, you can immediately use the data from your investigation to craft targeted rules that will block these threats.
Stay tuned as we continue to develop more capabilities in the areas of observability and forensics, with additional features including:
-
Custom alerts: create alerts based on specific metrics or anomalies
-
Scheduled query detections: craft log queries and run them on a schedule to detect malicious activity
-
More integration: further streamlining the journey between detect, investigate, and mitigate across the full Cloudflare platform.
Current Log Explorer beta users get immediate access to the new custom dashboards feature. Pricing will be made available to everyone during Q2 2025. Between now and then, these features continue to be available at no cost.
Let us know if you are interested in joining our Beta program by completing this form, and a member of our team will contact you.