Security teams have long depended on SIEM tools as the backbone of threat detection and response. But the threat landscape, and the technology required to defend against it, has changed dramatically.
Rapid7’s new whitepaper, The End of Legacy SIEM and the Rise of Incident Command, examines why legacy SIEM models can no longer keep up with the scale and complexity of modern attacks, and why next-gen SIEMs (like that offered by Rapid7) combined with exposure management capabilities is the better choice in combatting modern enemies.
A turning point for the SOC
When SIEM first emerged, it was a breakthrough. For the first time, organizations could centralize log data, generate compliance reports, and detect threats from a single pane of glass. But two decades later, that approach is showing its age.
Today, data is distributed across cloud, on-prem, and hybrid environments. Adversaries are using artificial intelligence to automate and accelerate increasingly complex attacks that are escaping detection. Analysts are overwhelmed by alert fatigue and unpredictable costs that hamper visibility.
Legacy SIEM tools were built to collect data. They rely on rigid pricing models, static correlation rules, and constant manual upkeep. These systems slow down investigations and prevent analysts from focusing on the alerts that truly matter. Modern attackers exploit exposures faster than human teams can respond. Without automation, context, and clear prioritization, organizations remain in a reactive state.
What comes after SIEM?
The whitepaper outlines how the security industry is shifting toward a unified approach that combines SIEM, Security Orchestration and Automation (SOAR), Attack Surface Management (ASM), and threat intelligence in one platform, augmented by artificial intelligence.
This new model emphasizes automation, machine learning, and contextual awareness while collecting data from a wider variety of sources than SIEMs were originally designed for. It gives security teams the ability to identify and act on high-impact threats quickly. It also changes how organizations think about risk, focusing less on collecting alerts and more on understanding exposure across assets, identities, and vulnerabilities.
Introducing Rapid7 Incident Command
At the center of this shift is Rapid7 Incident Command, a unified platform that redefines modern detection and response. Trained on trillions of real-world alerts from Rapid7’s 24/7 Managed Detection and Response (MDR) service, Incident Command can accurately classify benign activity 99.93 percent of the time. This precision saves hundreds of analyst hours each week and drastically reduces noise.
Incident Command connects exposure data directly to detection logic, helping analysts see which threats are most likely to impact their organization. Built-in automation enables teams to isolate hosts, revoke credentials, or run response playbooks, while keeping humans in control of every action.
With asset-based pricing and a fast, cloud-based deployment model, organizations can scale visibility and response without the fear of surprise costs or drawn-out implementations.
A new chapter for defenders
Legacy SIEM served its purpose, but it was built for a different era. The modern SOC requires a platform that is unified, intelligent, and focused on outcomes.
The End of Legacy SIEM and the Rise of Incident Command explores how this transformation is reshaping detection and response for security teams everywhere.
Read the full whitepaper to learn why the future of SIEM is already here and how you can take command of what comes next.
We are thrilled to announce the General Availability of Cloudflare Log Explorer, a powerful new product designed to bring observability and forensics capabilities directly into your Cloudflare dashboard. Built on the foundation of Cloudflare’s vast global network, Log Explorer leverages the unique position of our platform to provide a comprehensive and contextualized view of your environment.
Security teams and developers use Cloudflare to detect and mitigate threats in real-time and to optimize application performance. Over the years, users have asked for additional telemetry with full context to investigate security incidents or troubleshoot application performance issues without having to forward data to third party log analytics and Security Information and Event Management (SIEM) tools. Besides avoidable costs, forwarding data externally comes with other drawbacks such as: complex setups, delayed access to crucial data, and a frustrating lack of context that complicates quick mitigation.
Log Explorer has been previewed by several hundred customers over the last year, and they attest to its benefits:
“Having WAF logs (firewall events) instantly available in Log Explorer with full context — no waiting, no external tools — has completely changed how we manage our firewall rules. I can spot an issue, adjust the rule with a single click, and immediately see the effect. It’s made tuning for false positives faster, cheaper, and far more effective.”
“While we use Logpush to ingest Cloudflare logs into our SIEM, when our development team needs to analyze logs, it can be more effective to utilize Log Explorer. SIEMs make it difficult for development teams to write their own queries and manipulate the console to see the logs they need. Cloudflare’s Log Explorer, on the other hand, makes it much easier for dev teams to look at logs and directly search for the information they need.”
With Log Explorer, customers have access to Cloudflare logs with all the context available within the Cloudflare platform. Compared to external tools, customers benefit from:
Reduced cost and complexity: Drastically reduce the expense and operational overhead associated with forwarding, storing, and analyzing terabytes of log data in external tools.
Faster detection and triage: Access Cloudflare-native logs directly, eliminating cumbersome data pipelines and the ingest lags that delay critical security insights.
Accelerated investigations with full context: Investigate incidents with Cloudflare’s unparalleled contextual data, accelerating your analysis and understanding of “What exactly happened?” and “How did it happen?”
Minimal recovery time: Seamlessly transition from investigation to action with direct mitigation capabilities via the Cloudflare platform.
Log Explorer is available as an add-on product for customers on our self serve or Enterprise plans. Read on to learn how each of the capabilities of Log Explorer can help you detect and diagnose issues more quickly.
Monitor security and performance issues with custom dashboards
Custom dashboards allow you to define the specific metrics you need in order to monitor unusual or unexpected activity in your environment.
Getting started is easy, with the ability to create a chart using natural language. A natural language interface is integrated into the chart create/edit experience, enabling you to describe in your own words the chart you want to create. Similar to the AI Assistant we announced during Security Week 2024, the prompt translates your language to the appropriate chart configuration, which can then be added to a new or existing custom dashboard.
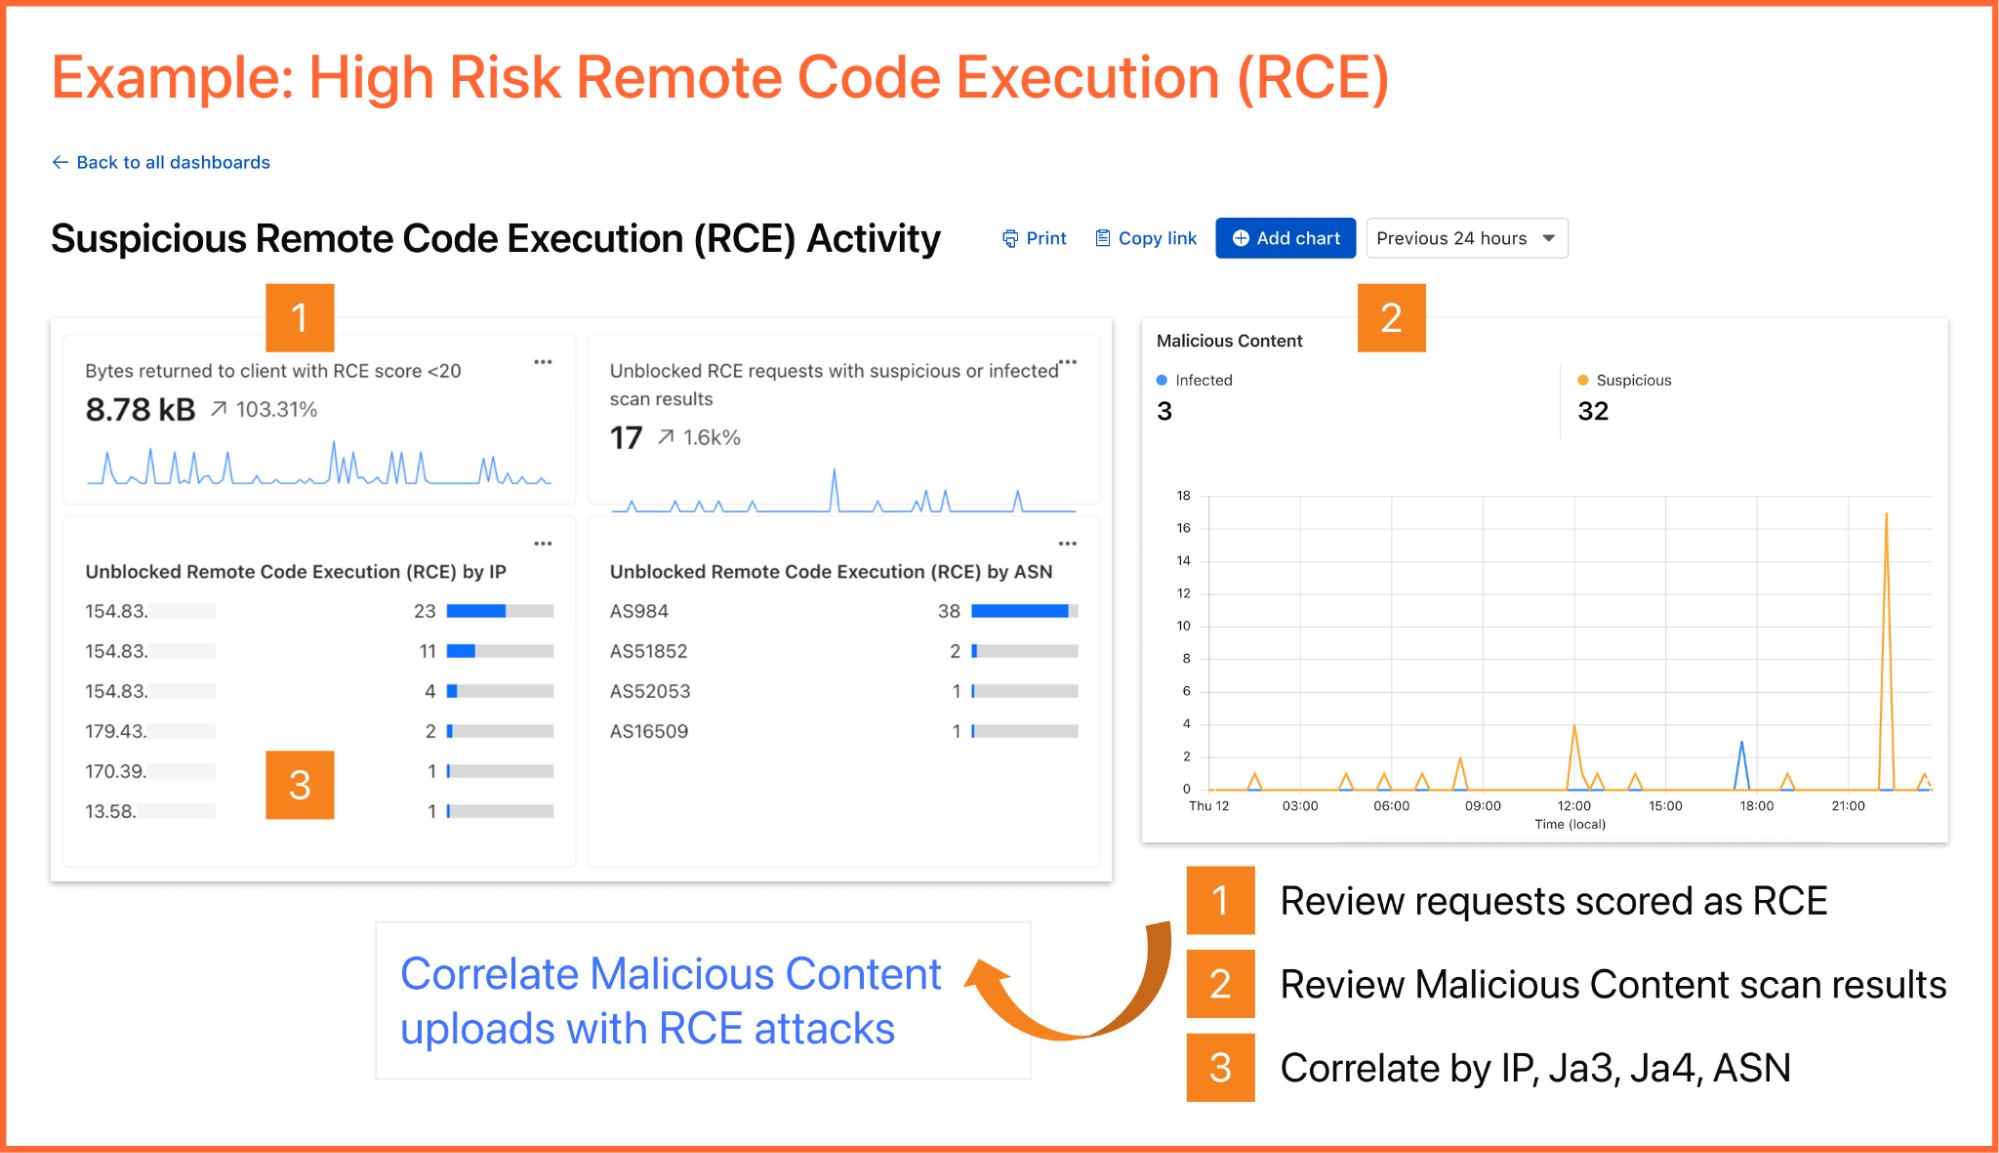
As an example, you can create a dashboard for monitoring for the presence of Remote Code Execution (RCE) attacks happening in your environment. An RCE attack is where an attacker is able to compromise a machine in your environment and execute commands. The good news is that RCE is a detection available in Cloudflare WAF. In the dashboard example below, you can not only watch for RCE attacks, but also correlate them with other security events such as malicious content uploads, source IP addresses, and JA3/JA4 fingerprints. Such a scenario could mean one or more machines in your environment are compromised and being used to spread malware — surely, a very high risk incident!
A reliability engineer might want to create a dashboard for monitoring errors. They could use the natural language prompt to enter a query like “Compare HTTP status code ranges over time.” The AI model then decides the most appropriate visualization and constructs their chart configuration.
While you can create custom dashboards from scratch, you could also use an expert-curated dashboard template to jumpstart your security and performance monitoring.
Available templates include:
Bot monitoring: Identify automated traffic accessing your website
API Security: Monitor the data transfer and exceptions of API endpoints within your application
API Performance: See timing data for API endpoints in your application, along with error rates
Account Takeover: View login attempts, usage of leaked credentials, and identify account takeover attacks
Performance Monitoring: Identify slow hosts and paths on your origin server, and view time to first byte (TTFB) metrics over time
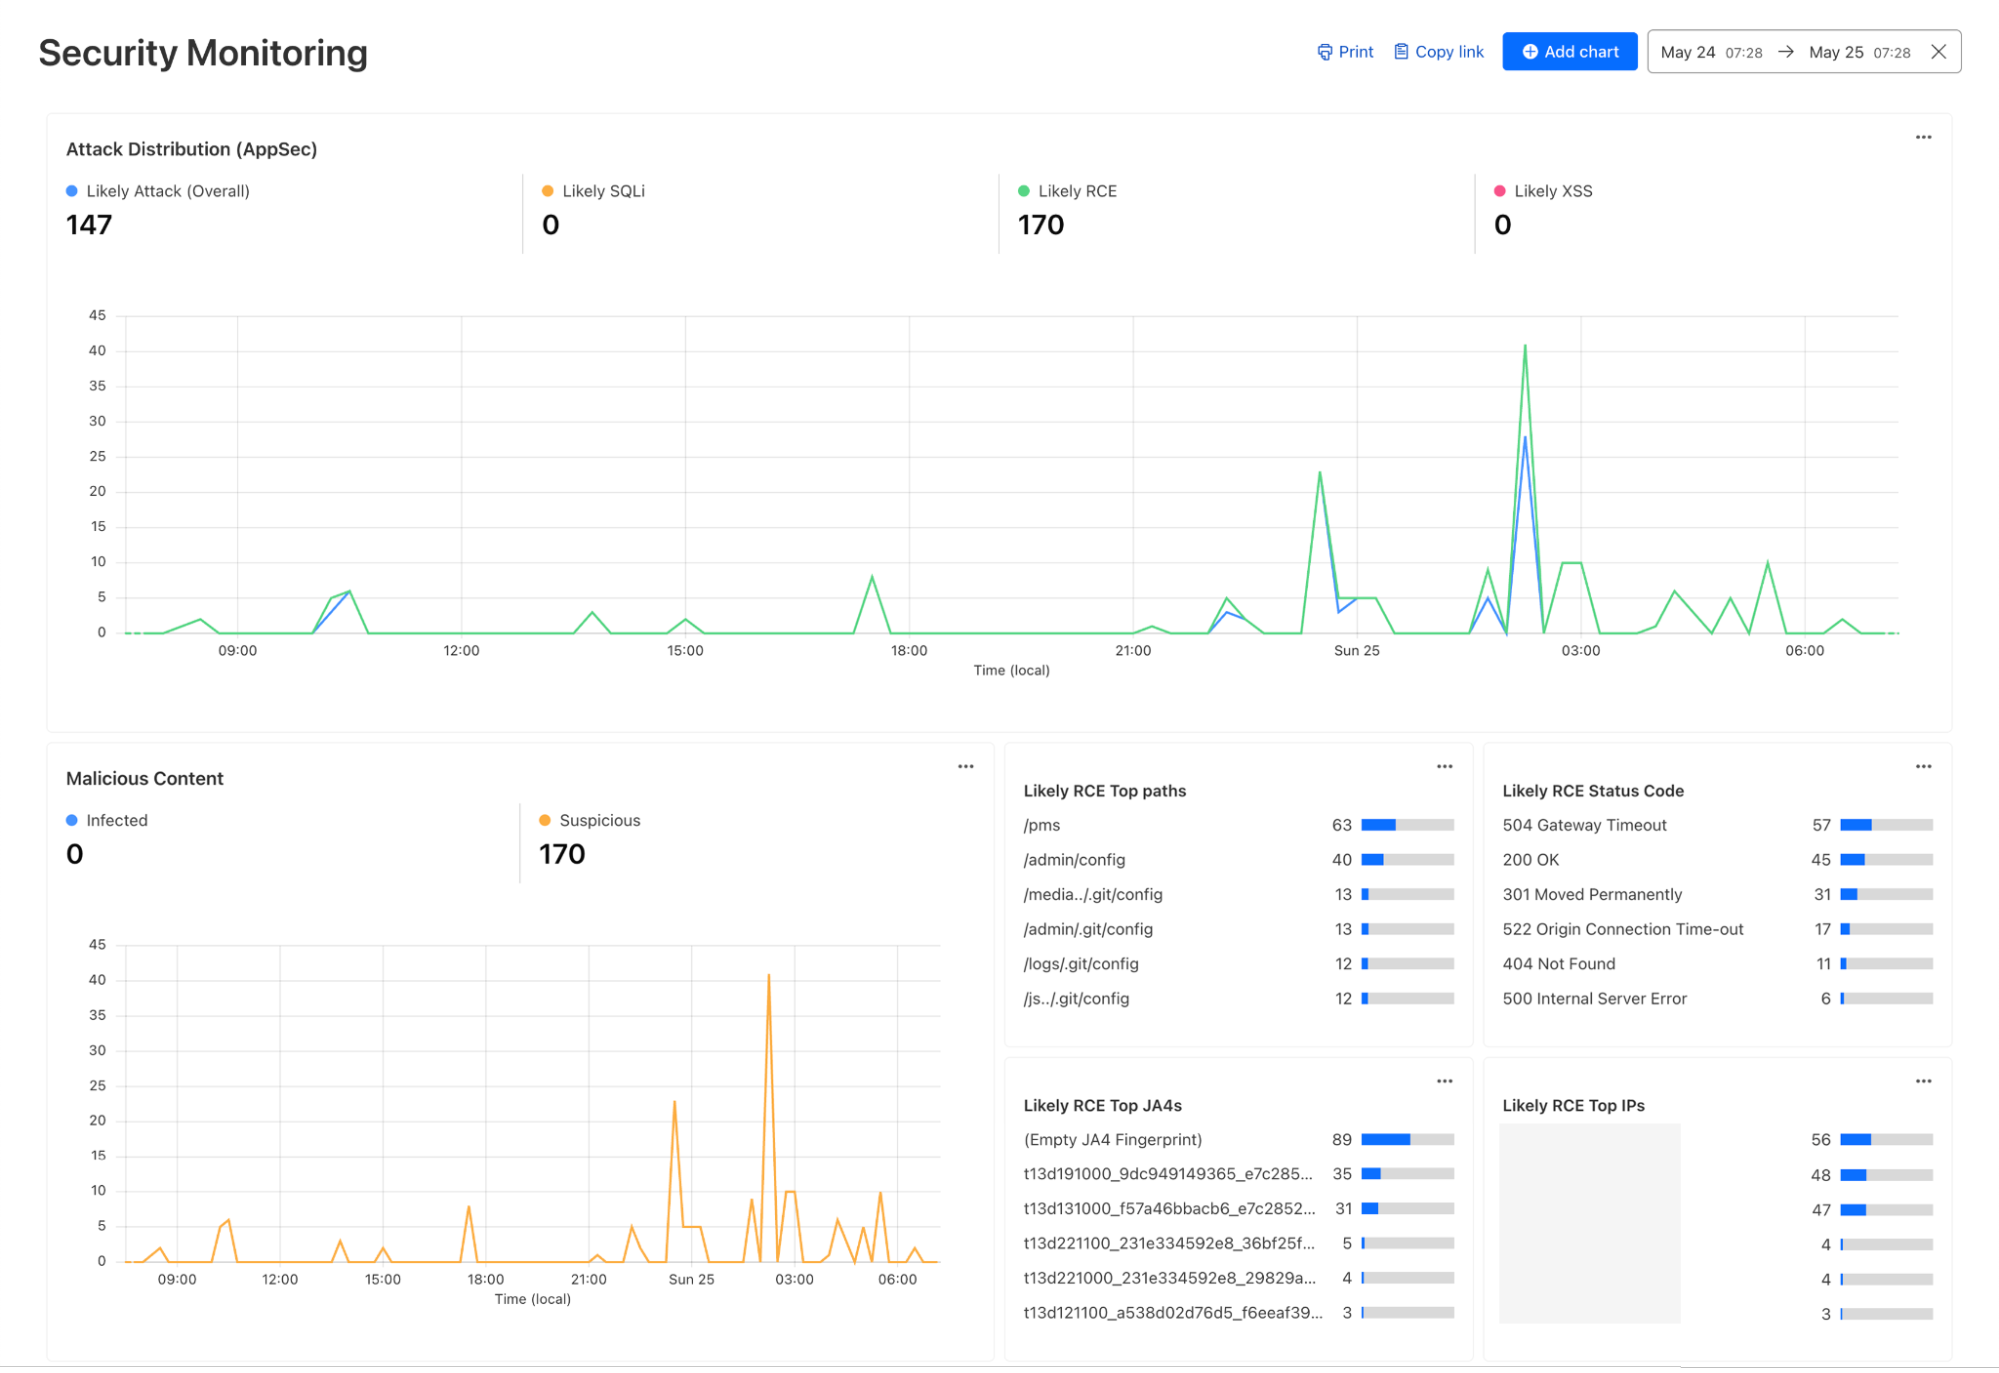
Security Monitoring: monitor attack distribution across top hosts and paths, correlate DDoS traffic with origin Response time to understand the impact of DDoS attacks.
Investigate and troubleshoot issues with Log Search
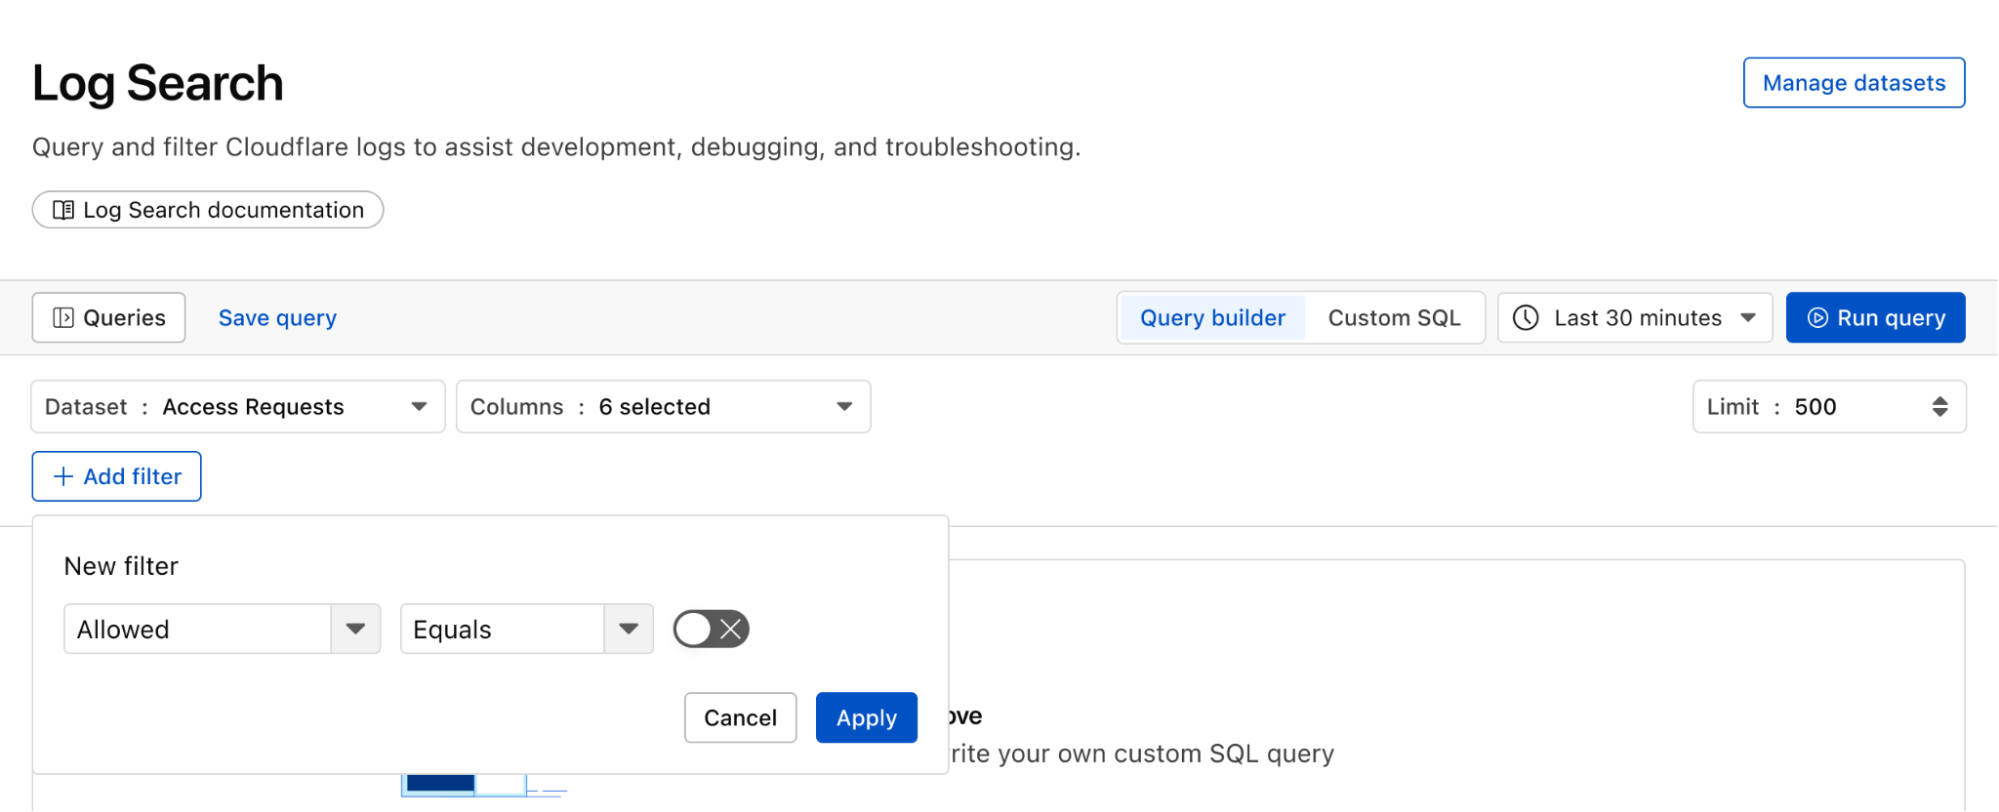
Continuing with the example from the prior section, after successfully diagnosing that some machines were compromised through the RCE issue, analysts can pivot over to Log Search in order to investigate whether the attacker was able to access and compromise other internal systems. To do that, the analyst could search logs from Zero Trust services, using context, such as compromised IP addresses from the custom dashboard, shown in the screenshot below:
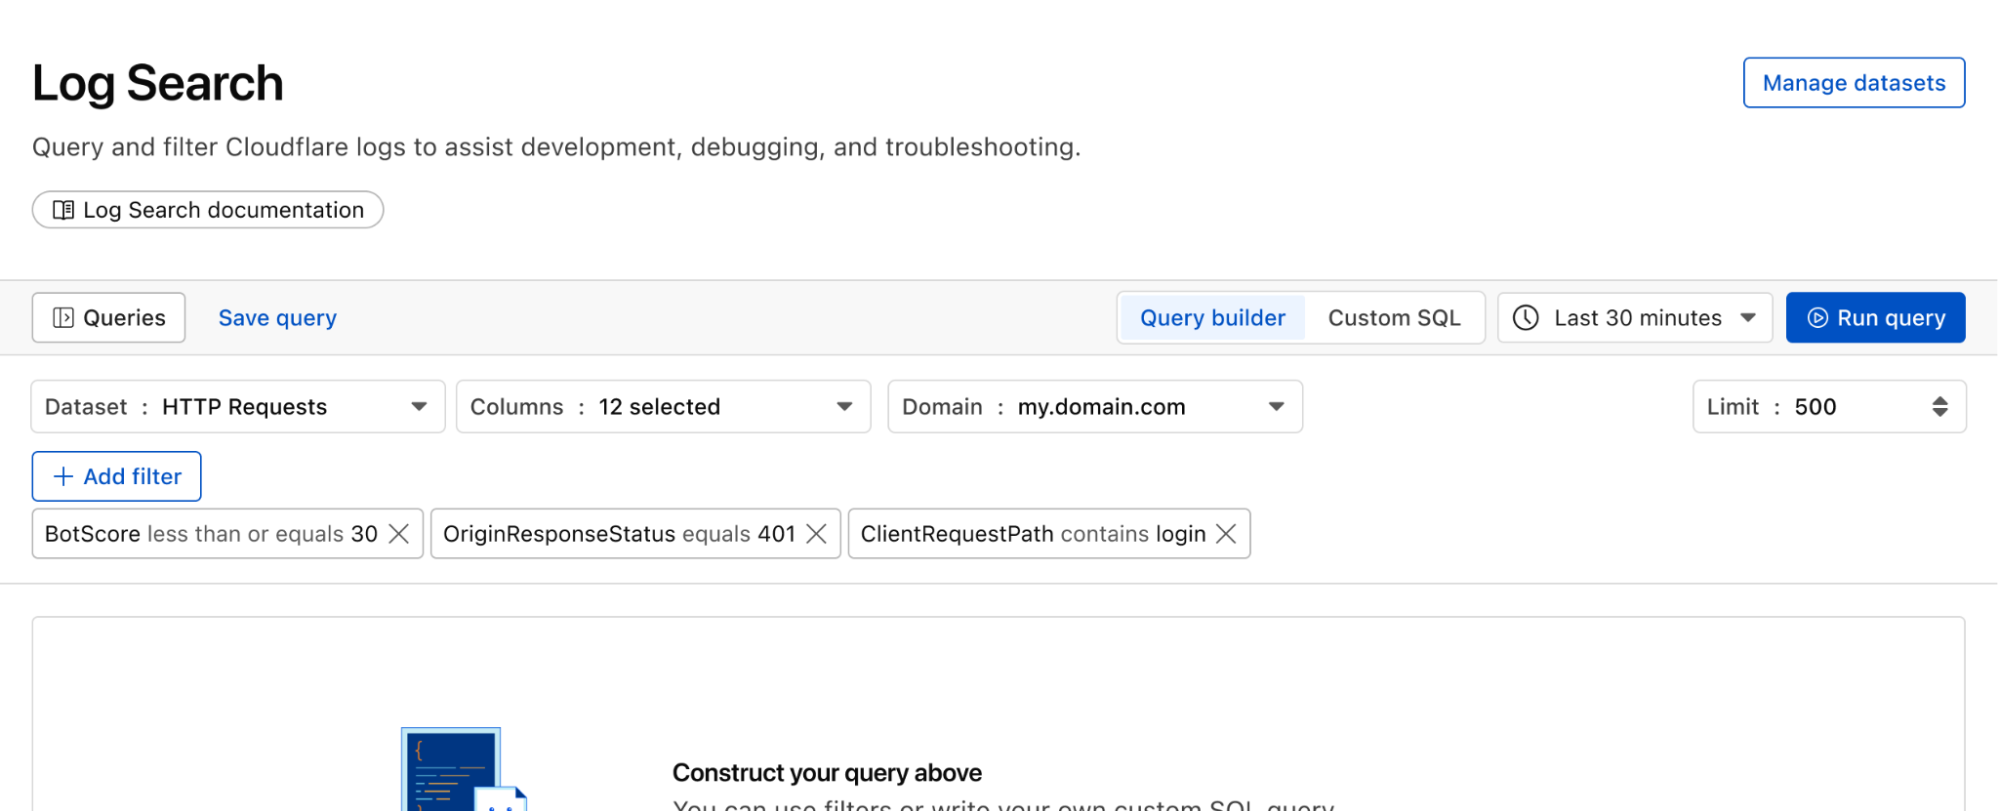
Log Search is a streamlined experience including data type-aware search filters, or the ability to switch to a custom SQL interface for more powerful queries. Log searches are also available via a public API.
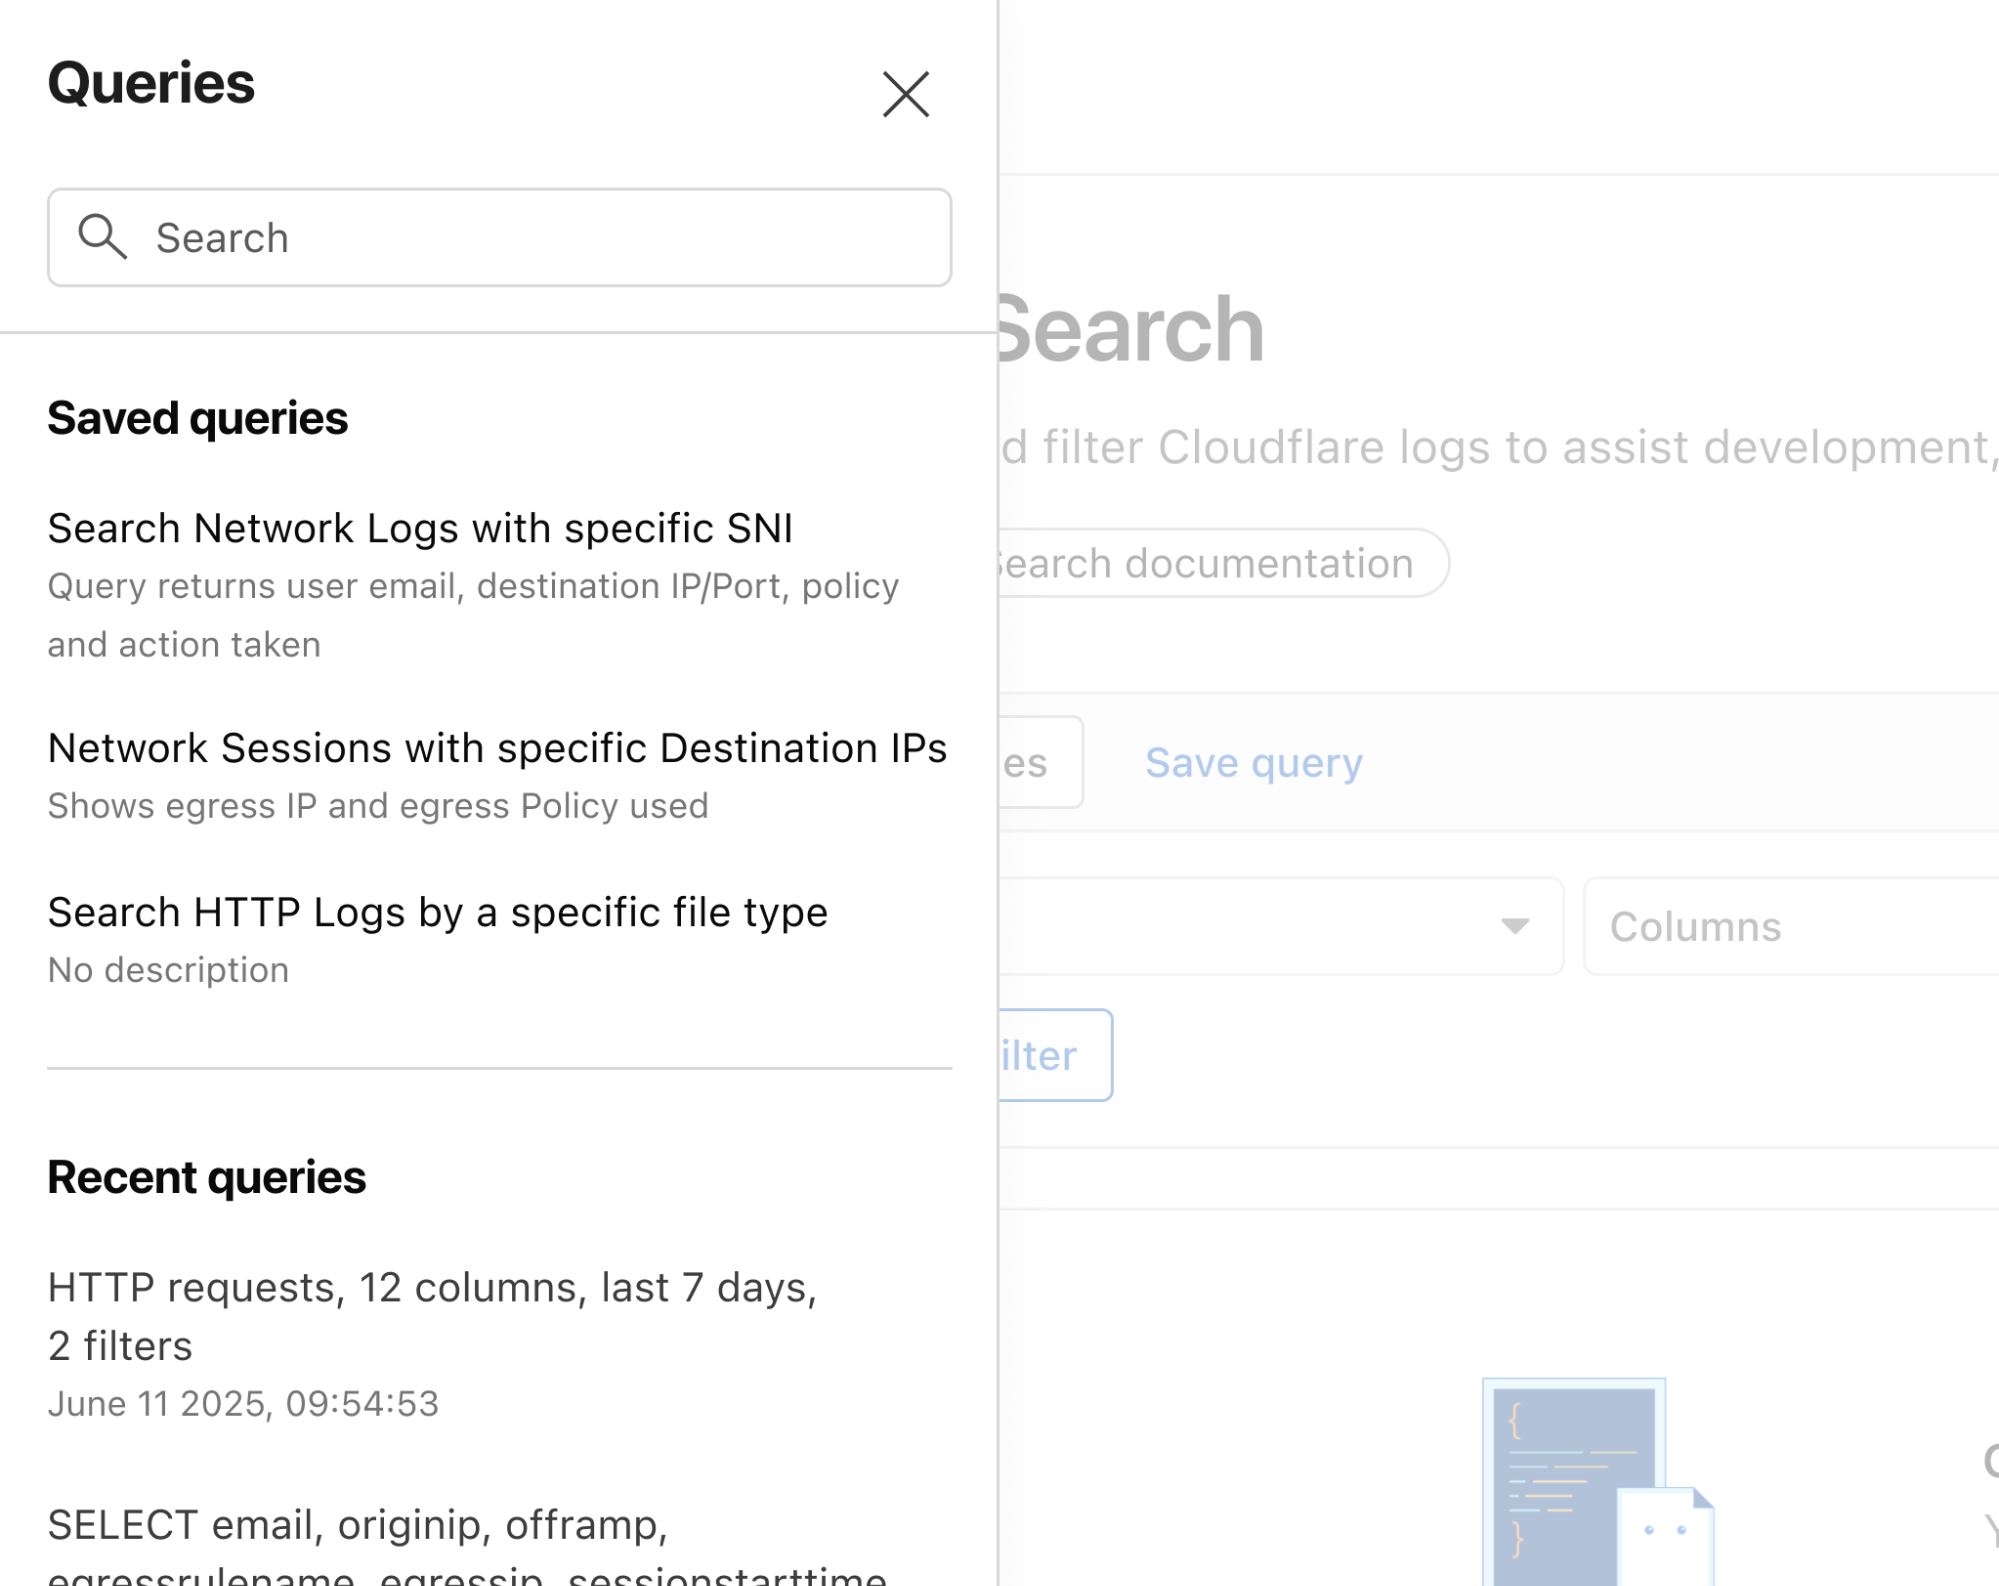
Save time and collaborate with saved queries
Queries built in Log Search can now be saved for repeated use and are accessible to other Log Explorer users in your account. This makes it easier than ever to investigate issues together.
Monitor proactively with Custom Alerting (coming soon)
With custom alerting, you can configure custom alert policies in order to proactively monitor the indicators that are important to your business.
Starting from Log Search, define and test your query. From here you can opt to save and configure a schedule interval and alerting policy. The query will run automatically on the schedule you define.
Tracking error rate for a custom hostname
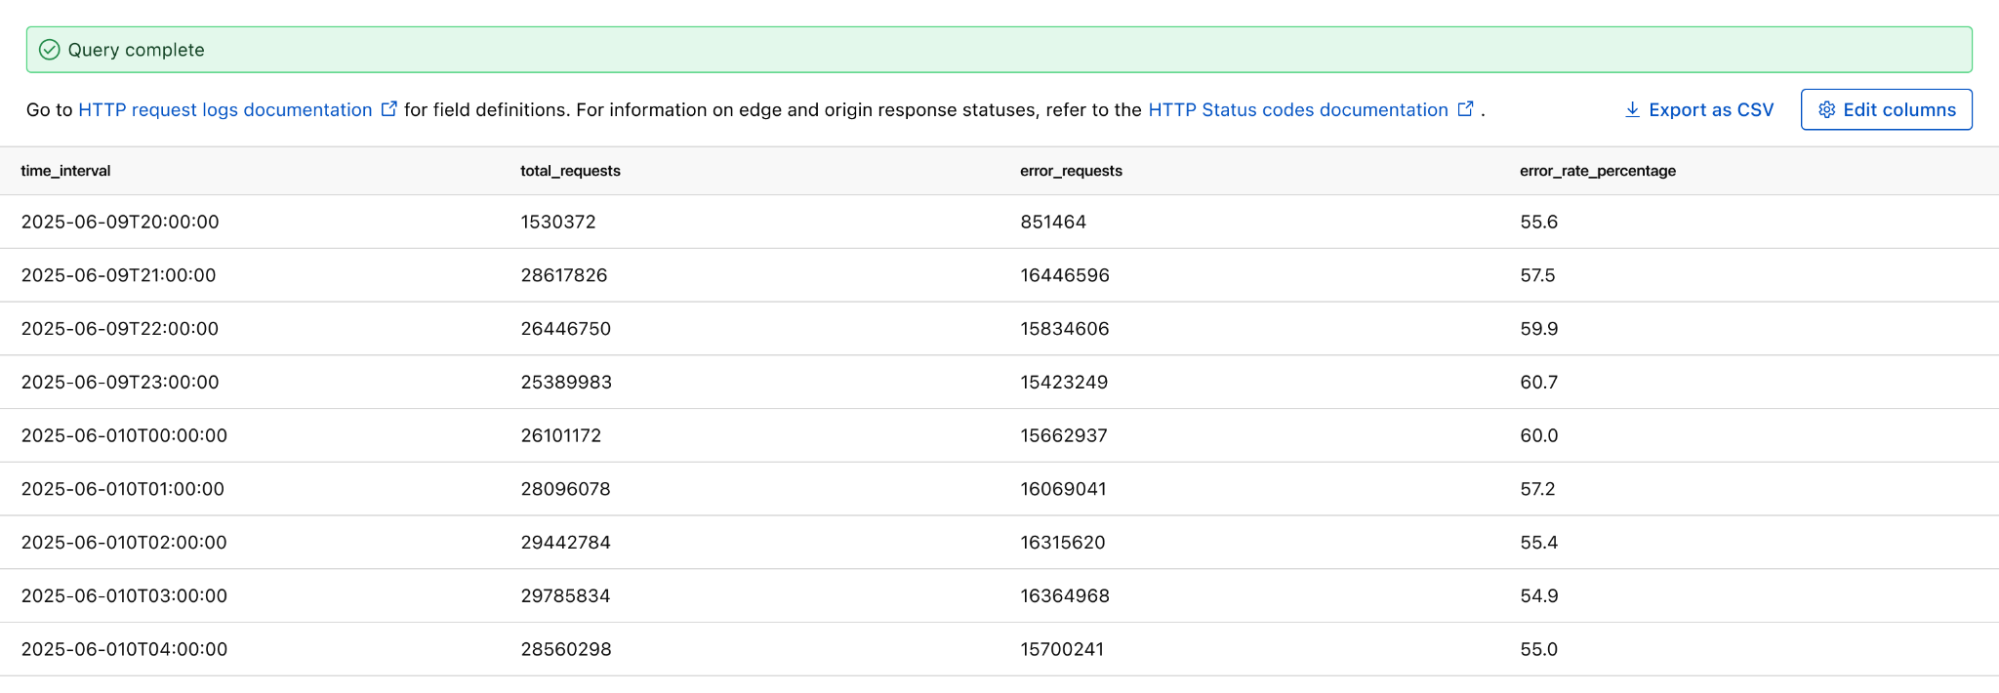
If you want to monitor the error rate for a particular host, you can use this Log Search query to calculate the error rate per time interval:
SELECT SUBSTRING(EdgeStartTimeStamp, 1, 14) || '00:00' AS time_interval,
       COUNT() AS total_requests,
       COUNT(CASE WHEN EdgeResponseStatus >= 500 THEN 1 ELSE NULL END) AS error_requests,
       COUNT(CASE WHEN EdgeResponseStatus >= 500 THEN 1 ELSE NULL END) * 100.0 / COUNT() AS error_rate_percentage
 FROM http_requests
WHERE EdgeStartTimestamp >= '2025-06-09T20:56:58Z'
  AND EdgeStartTimestamp <= '2025-06-10T21:26:58Z'
  AND ClientRequestHost = 'customhostname.com'
GROUP BY time_interval
ORDER BY time_interval ASC;
Running the above query returns the following results. You can see the overall error rate percentage in the far right column of the query results.
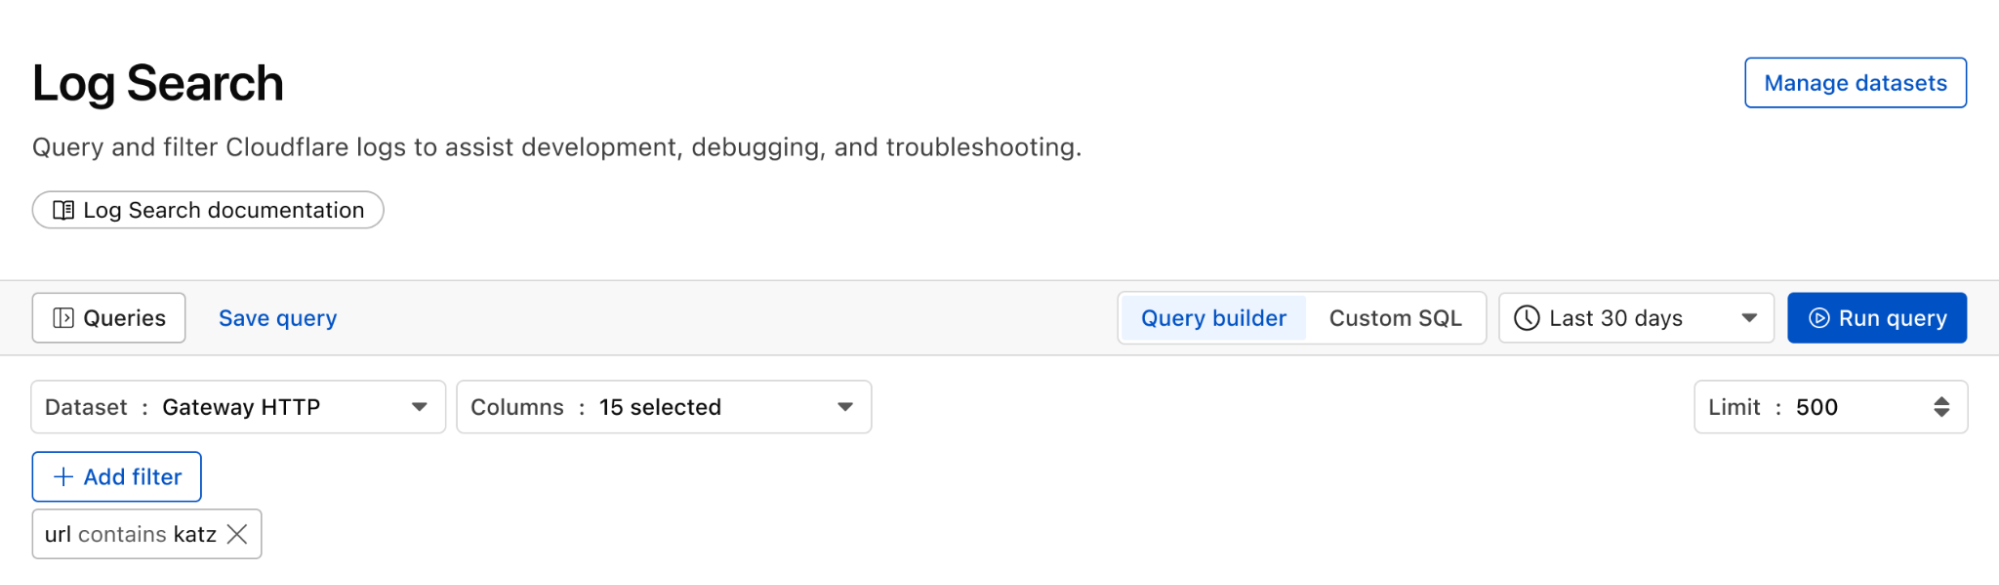
Proactively detect malware
We can identify malware in the environment by monitoring logs from Cloudflare Secure Web Gateway. As an example, Katz Stealer is malware-as-a-service designed for stealing credentials. We can monitor DNS queries and HTTP requests from users within the company in order to identify any machines that may be infected with Katz Stealer malware.
And with custom alerts, you can configure an alert policy so that you can be notified via webhook or PagerDuty.
Maintain audit & compliance with flexible retention (coming soon)
With flexible retention, you can set the precise length of time you want to store your logs, allowing you to meet specific compliance and audit requirements with ease. Other providers require archiving or hot and cold storage, making it difficult to query older logs. Log Explorer is built on top of our R2 storage tier, so historical logs can be queried as easily as current logs.
How we built Log Explorer to run at Cloudflare scale
With Log Explorer, we have built a scalable log storage platform on top of Cloudflare R2 that lets you efficiently search your Cloudflare logs using familiar SQL queries. In this section, we’ll look into how we did this and how we solved some technical challenges along the way.
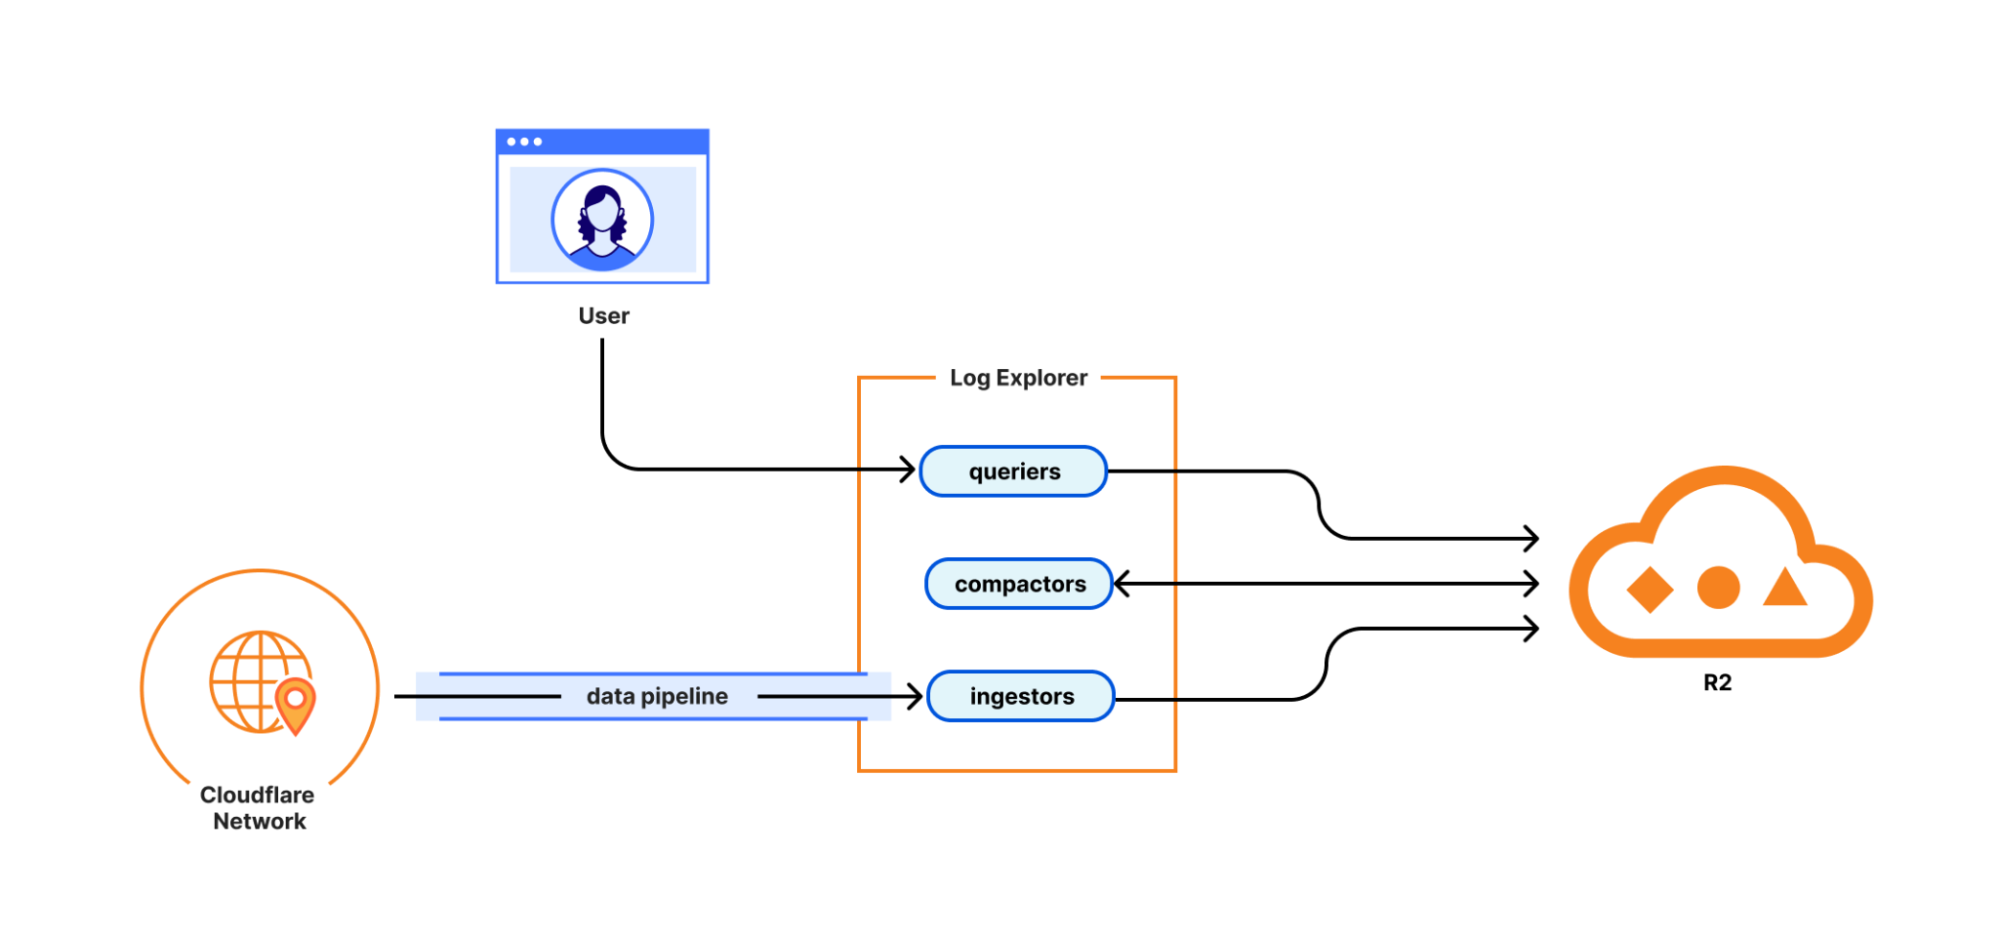
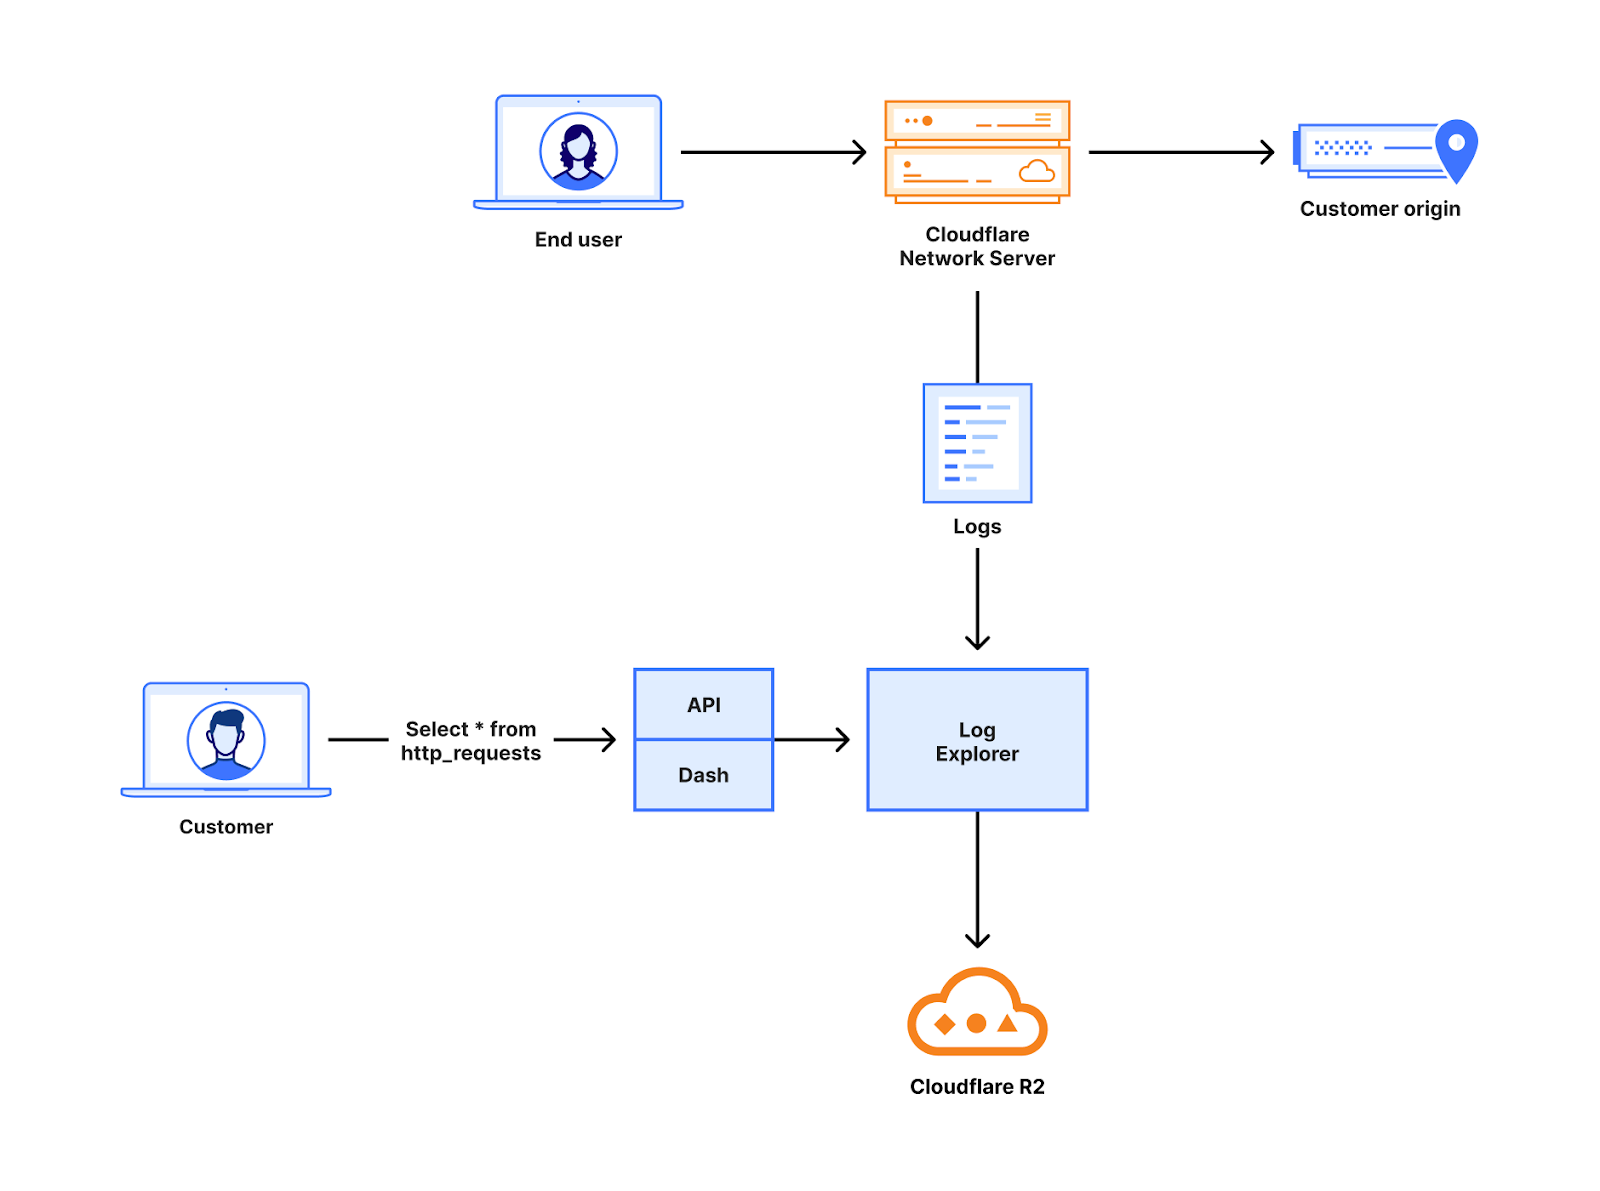
Log Explorer consists of three components: ingestors, compactors, and queriers. Ingestors are responsible for writing logs from Cloudflare’s data pipeline to R2. Compactors optimize storage files, so they can be queried more efficiently. Queriers execute SQL queries from users by fetching, transforming, and aggregating matching logs from R2.
During ingestion, Log Explorer writes each batch of log records to a Parquet file in R2. Apache Parquet is an open-source columnar storage file format, and it was an obvious choice for us: it’s optimized for efficient data storage and retrieval, such as by embedding metadata like the minimum and maximum values of each column across the file which enables the queriers to quickly locate the data needed to serve the query.
Log Explorer stores logs on a per-customer level, just like Cloudflare D1, so that your data isn’t mixed with that of other customers. In Q3 2025, per-customer logs will allow you the flexibility to create your own retention policies and decide in which regions you want to store your data.
But how does Log Explorer find those Parquet files when you query your logs? Log Explorer leverages the Delta Lake open table format to provide a database table abstraction atop R2 object storage. A table in Delta Lake pairs data files in Parquet format with a transaction log. The transaction log registers every addition, removal, or modification of a data file for the table – it’s stored right next to the data files in R2.
Given a SQL query for a particular log dataset such as HTTP Requests or Gateway DNS, Log Explorer first has to load the transaction log of the corresponding Delta table from R2. Transaction logs are checkpointed periodically to avoid having to read the entire table history every time a user queries their logs.
Besides listing Parquet files for a table, the transaction log also includes per-column min/max statistics for each Parquet file. This has the benefit that Log Explorer only needs to fetch files from R2 that can possibly satisfy a user query. Finally, queriers use the min/max statistics embedded in each Parquet file to decide which row groups to fetch from the file.
Log Explorer processes SQL queries using Apache DataFusion, a fast, extensible query engine written in Rust, and delta-rs, a community-driven Rust implementation of the Delta Lake protocol. While standing on the shoulders of giants, our team had to solve some unique problems to provide log search at Cloudflare scale.
Log Explorer ingests logs from across Cloudflare’s vast global network, spanning more than 330 cities in over 125 countries. If Log Explorer were to write logs from our servers straight to R2, its storage would quickly fragment into a myriad of small files, rendering log queries prohibitively expensive.
Log Explorer’s strategy to avoid this fragmentation is threefold. First, it leverages Cloudflare’s data pipeline, which collects and batches logs from the edge, ultimately buffering each stream of logs in an internal system named Buftee. Second, log batches ingested from Buftee aren’t immediately committed to the transaction log; rather, Log Explorer stages commits for multiple batches in an intermediate area and “squashes” these commits before they’re written to the transaction log. Third, once log batches have been committed, a process called compaction merges them into larger files in the background.
While the open-source implementation of Delta Lake provides compaction out of the box, we soon encountered an issue when using it for our workloads. Stock compaction merges data files to a desired target size S by sorting the files in reverse order of their size and greedily filling bins of size S with them. By merging logs irrespective of their timestamps, this process distributed ingested batches randomly across merged files, destroying data locality. Despite compaction, a user querying for a specific time frame would still end up fetching hundreds or thousands of files from R2.
For this reason, we wrote a custom compaction algorithm that merges ingested batches in order of their minimum log timestamp, leveraging the min/max statistics mentioned previously. This algorithm reduced the number of overlaps between merged files by two orders of magnitude. As a result, we saw a significant improvement in query performance, with some large queries that had previously taken over a minute completing in just a few seconds.
Follow along for more updates
We’re just getting started! We’re actively working on even more powerful features to further enhance your experience with Log Explorer. Subscribe to the blog and keep an eye out for more updates in our Change Log to our observability and forensics offering soon.
Get access to Log Explorer
To get access to Log Explorer, reach out for a consultation or contact your account manager. Additionally, you can read more in our Developer Documentation.
In 2024, we announced Log Explorer, giving customers the ability to store and query their HTTP and security event logs natively within the Cloudflare network. Today, we are excited to announce that Log Explorer now supports logs from our Zero Trust product suite. In addition, customers can create custom dashboards to monitor suspicious or unusual activity.
Every day, Cloudflare detects and protects customers against billions of threats, including DDoS attacks, bots, web application exploits, and more. SOC analysts, who are charged with keeping their companies safe from the growing spectre of Internet threats, may want to investigate these threats to gain additional insights on attacker behavior and protect against future attacks. Log Explorer, by collecting logs from various Cloudflare products, provides a single starting point for investigations. As a result, analysts can avoid forwarding logs to other tools, maximizing productivity and minimizing costs. Further, analysts can monitor signals specific to their organizations using custom dashboards.
Zero Trust dataset support in Log Explorer
Log Explorer stores your Cloudflare logs for a 30-day retention period so that you can analyze them natively and in a single interface, within the Cloudflare Dashboard. Cloudflare log data is diverse, reflecting the breadth of capabilities available. For example, HTTP requests contain information about the client such as their IP address, request method, autonomous system (ASN), request paths, and TLS versions used. Additionally, Cloudflare’s Application Security WAF Detections enrich these HTTP request logs with additional context, such as the WAF attack score, to identify threats.
Today we are announcing that seven additional Cloudflare product datasets are now available in Log Explorer. These seven datasets are the logs generated from our Zero Trust product suite, and include logs from Access, Gateway DNS, Gateway HTTP, Gateway Network, CASB, Zero
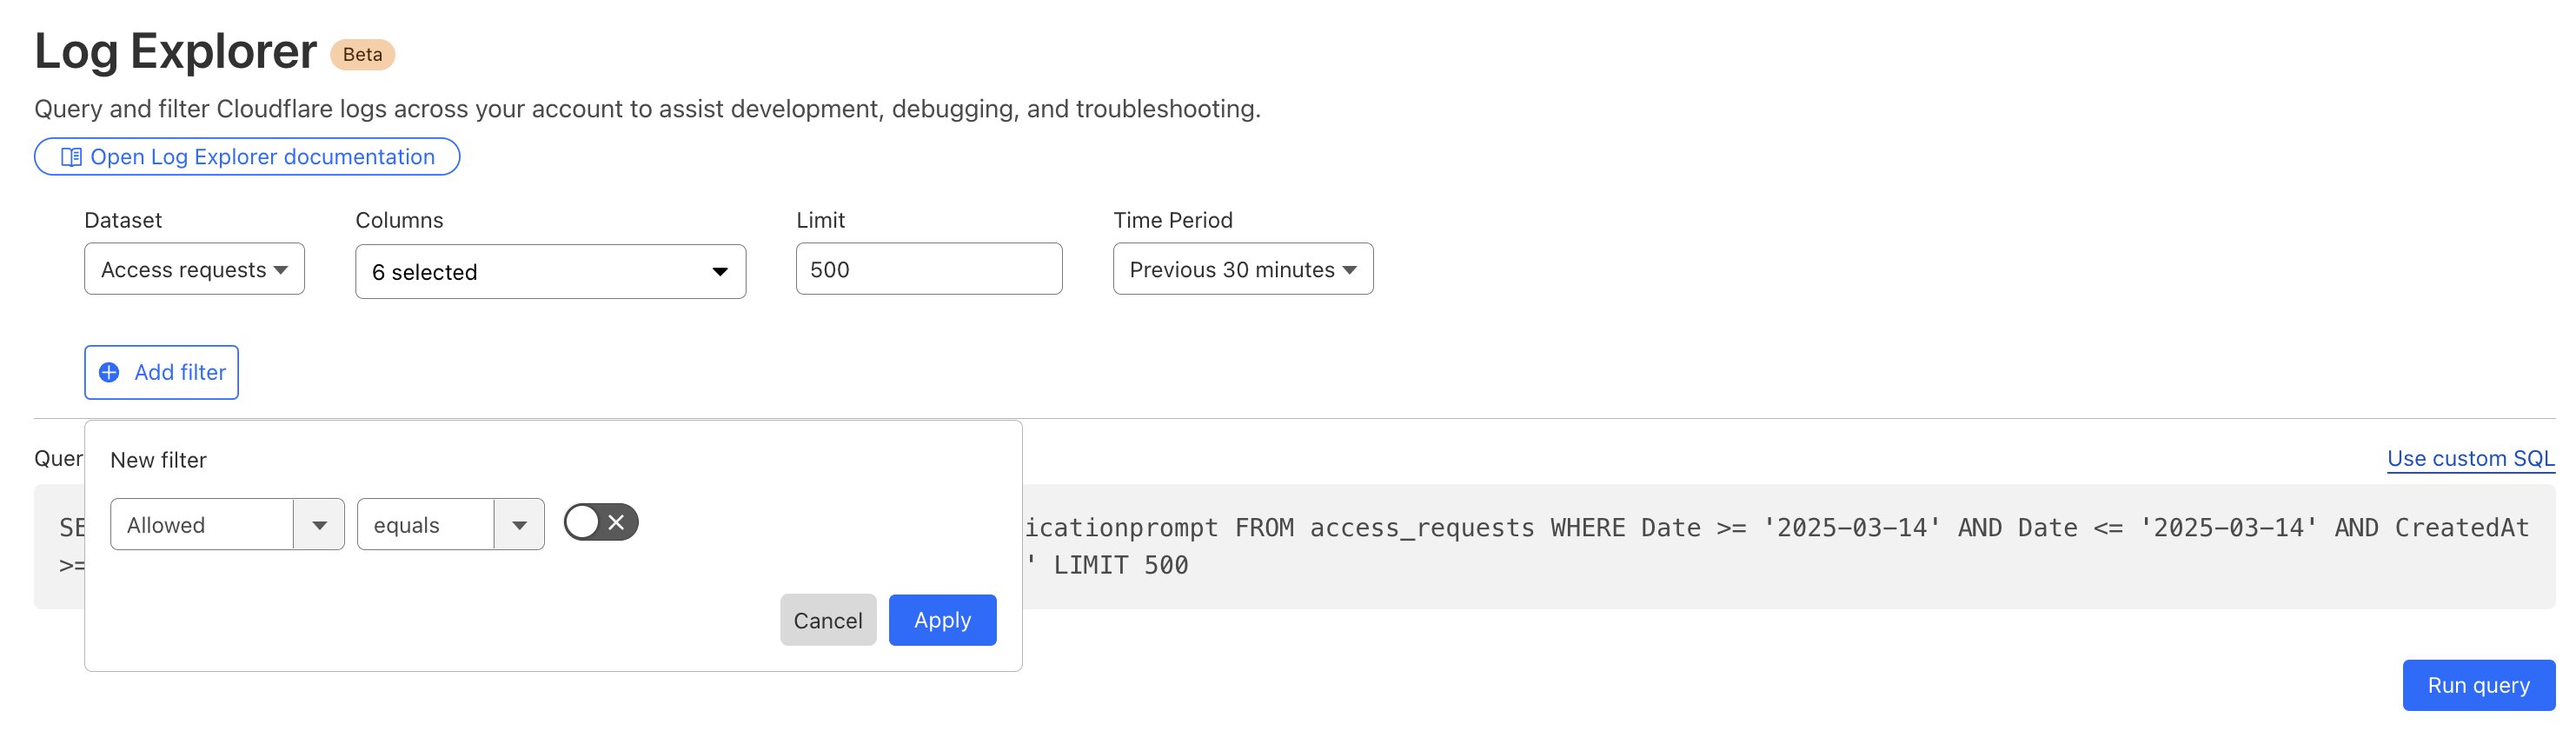
By reviewing Access logs and HTTP request logs, we can reveal attempts to access resources or systems without proper permissions, including brute force password attacks, indicating potential security breaches or malicious activity.
Below, we filter Access Logs on the Allowed field, to see activity related to unauthorized access.
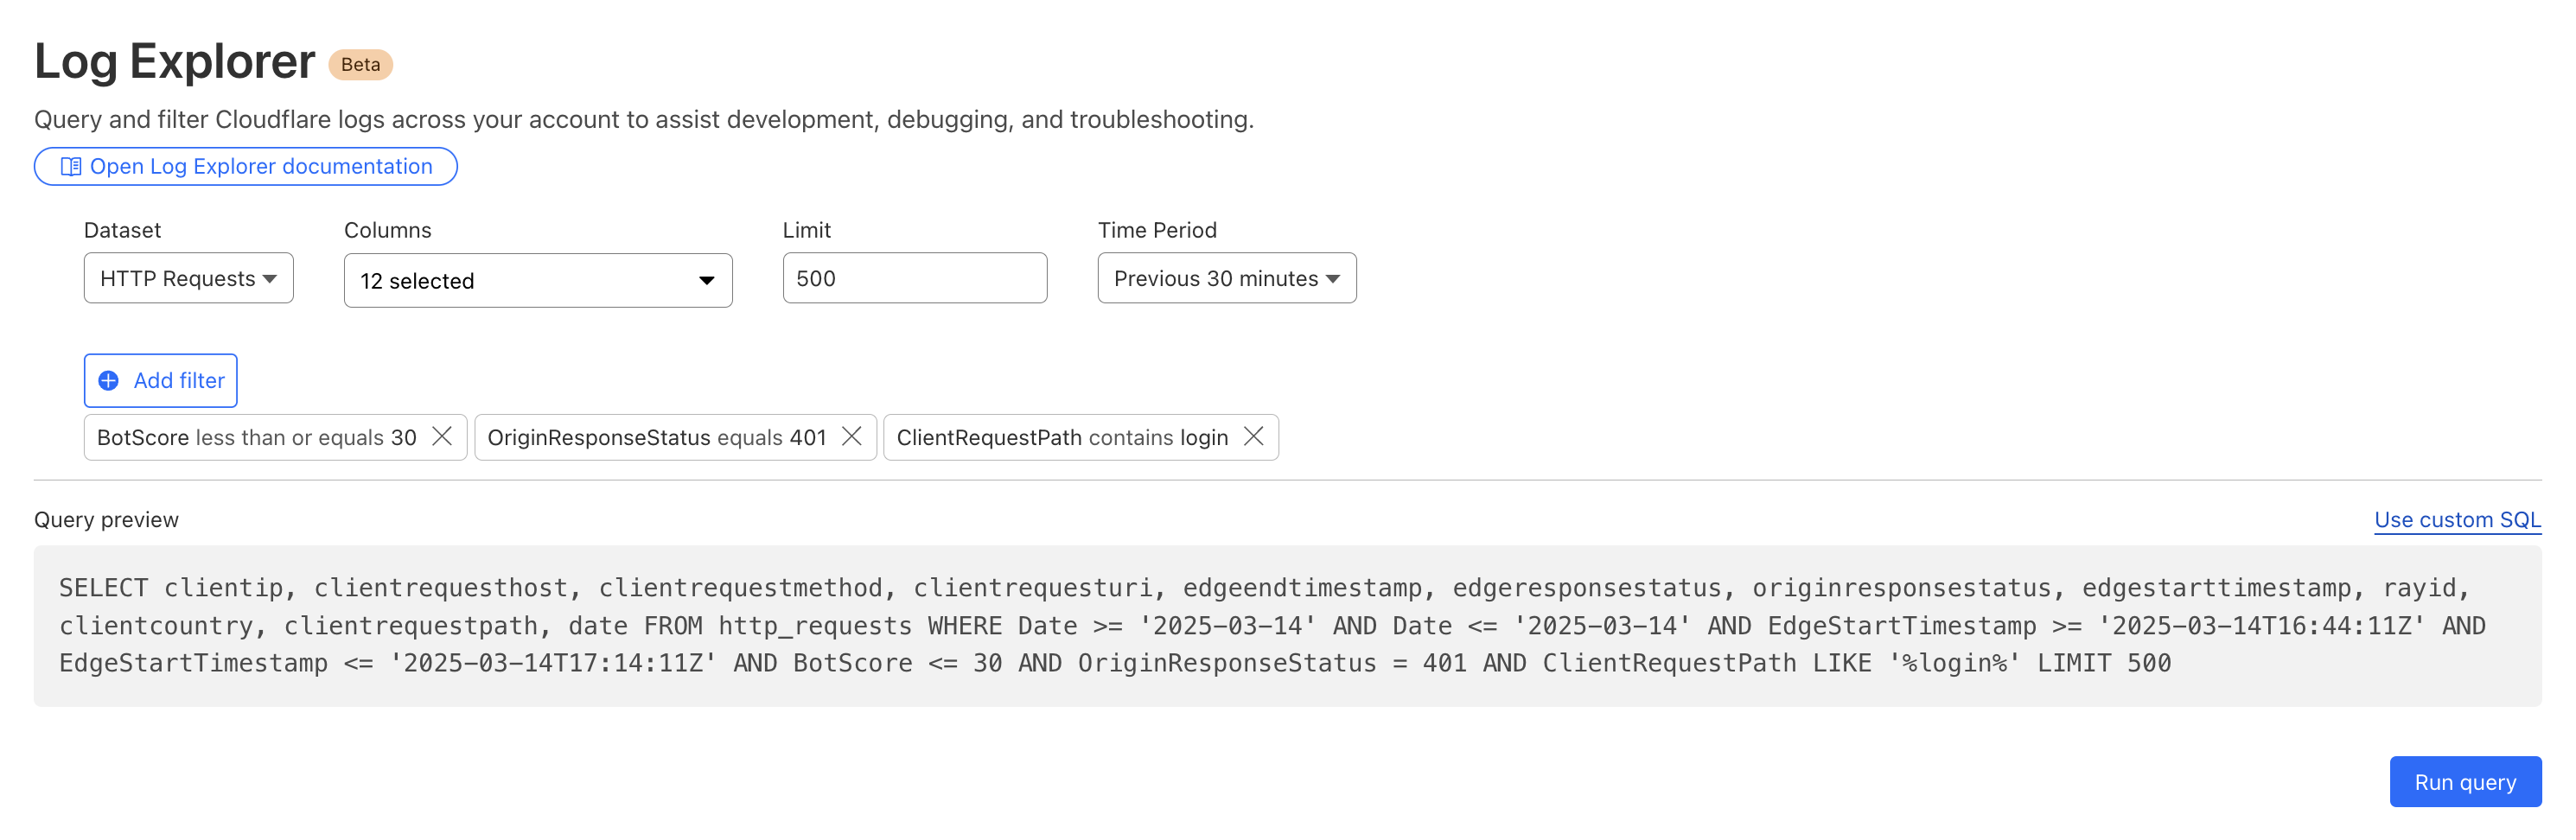
By then reviewing the HTTP logs for the requests identified in the previous query, we can assess if bot networks are the source of unauthorized activity.
With this information, you can craft targeted Custom Rules to block the offending traffic.
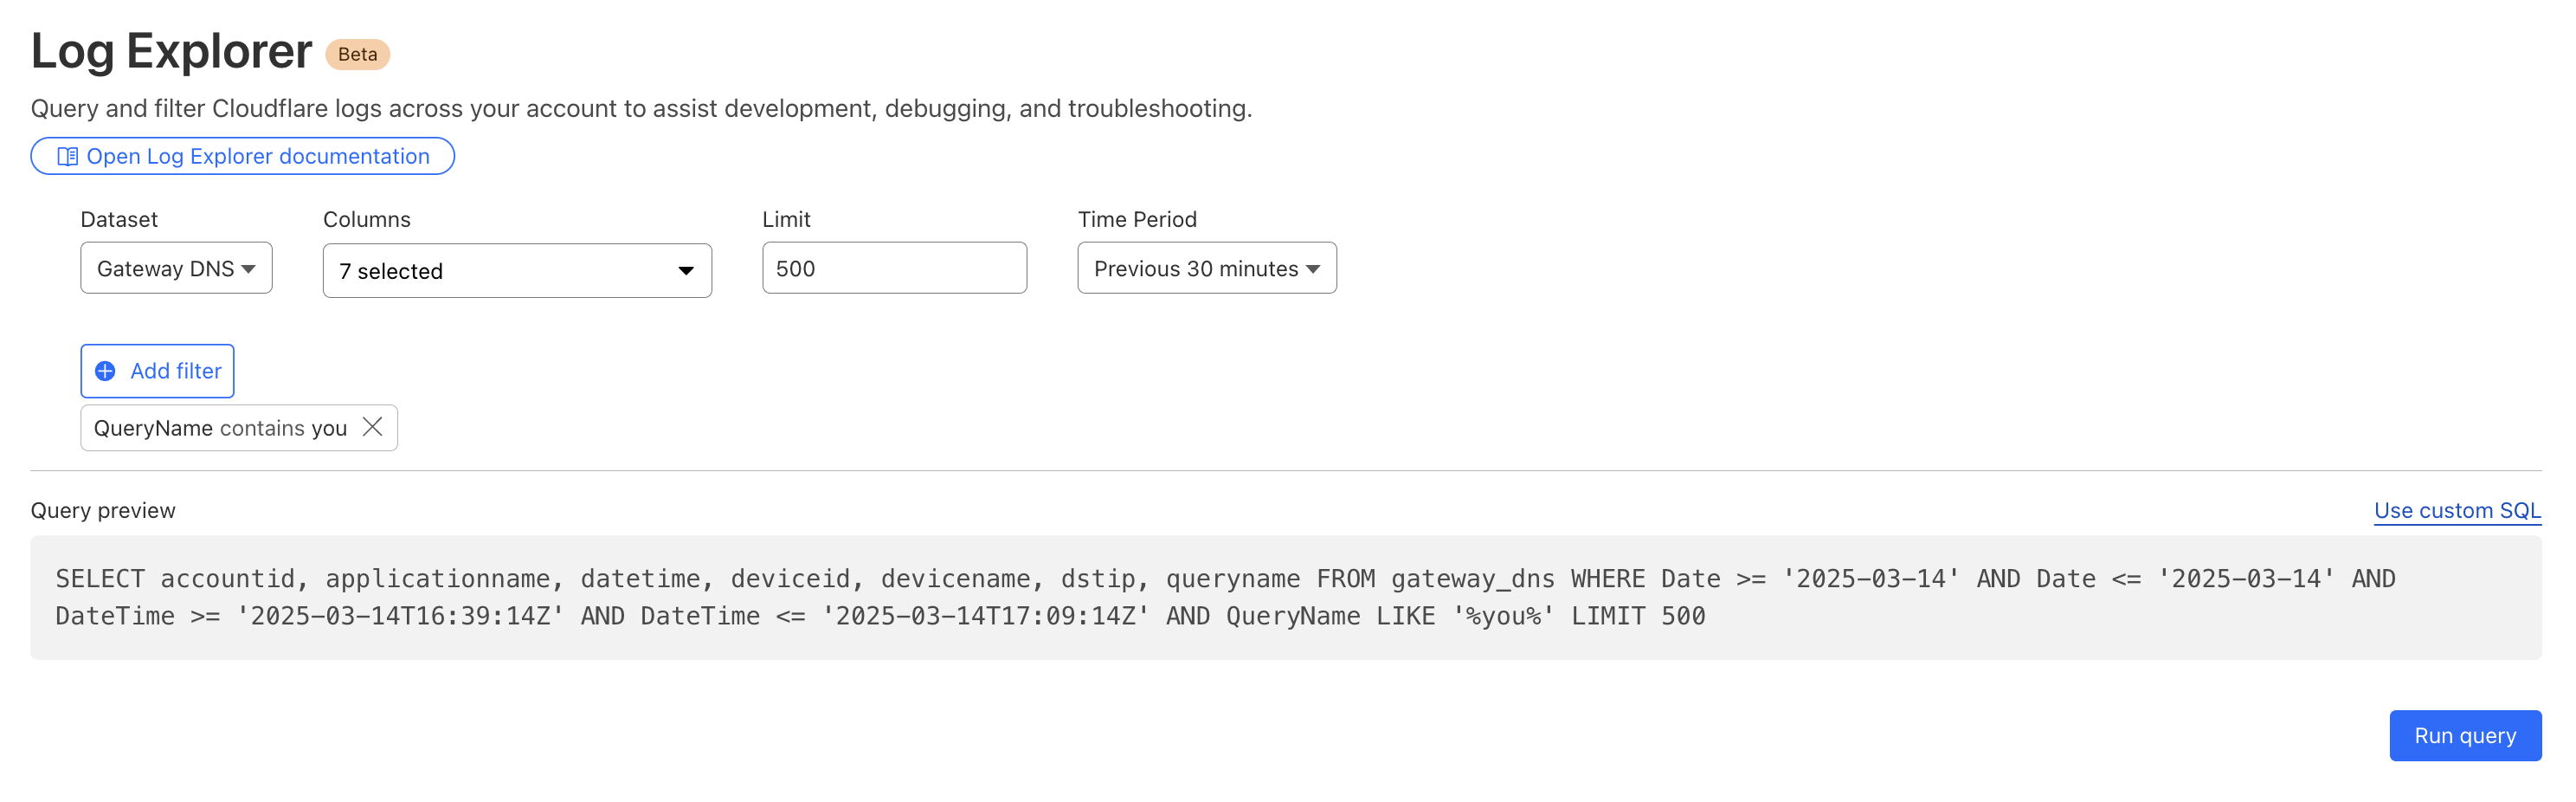
Detecting malware
Cloudflare’s Web Gateway can track which websites users are accessing, allowing administrators to identify and block access to malicious or inappropriate sites. These logs can be used to detect if a user’s machine or account is compromised by malware attacks. When reviewing logs, this may become apparent when we look for records that show a rapid succession of attempts to browse known malicious sites, such as hostnames that have long strings of seemingly random characters that hide their true destination. In this example, we can query logs looking for requests to a spoofed YouTube URL.
Monitoring what matters using custom dashboards
Security monitoring is not one size fits all. For instance, companies in the retail or financial industries worry about fraud, while every company is concerned about data exfiltration, of information like trade secrets. And any form of personally identifiable information (PII) is a target for data breaches or ransomware attacks.
While log exploration helps you react to threats, our new custom dashboards allow you to define the specific metrics you need in order to monitor threats you are concerned about.
Getting started is easy, with the ability to create a chart using natural language. A natural language interface is integrated into the chart create/edit experience, enabling you to describe in your own words the chart you want to create. Similar to the AI Assistant we announced during Security Week 2024, the prompt translates your language to the appropriate chart configuration, which can then be added to a new or existing custom dashboard.
Use a prompt: Enter a query like “Compare status code ranges over time”. The AI model decides the most appropriate visualization and constructs your chart configuration.
Customize your chart: Select the chart elements manually, including the chart type, title, dataset to query, metrics, and filters. This option gives you full control over your chart’s structure.
Video shows entering a natural language description of desired metric “compare status code ranges over time”, preview chart shown is a time series grouped by error code ranges, selects “add chart” to save to dashboard.
For more help getting started, we have some pre-built templates that you can use for monitoring specific uses. Available templates currently include:
Bot monitoring: Identify automated traffic accessing your website
API Security: Monitor the data transfer and exceptions of API endpoints within your application
API Performance: See timing data for API endpoints in your application, along with error rates
Account Takeover: View login attempts, usage of leaked credentials, and identify account takeover attacks
Performance Monitoring: Identify slow hosts and paths on your origin server, and view time to first byte (TTFB) metrics over time
Templates provide a good starting point, and once you create your dashboard, you can add or remove individual charts using the same natural language chart creator.
Video shows editing chart from an existing dashboard and moving individual charts via drag and drop.
Example use cases
Custom dashboards can be used to monitor for suspicious activity, or to keep an eye on performance and errors for your domains. Let’s explore some examples of suspicious activity that we can monitor using custom dashboards.
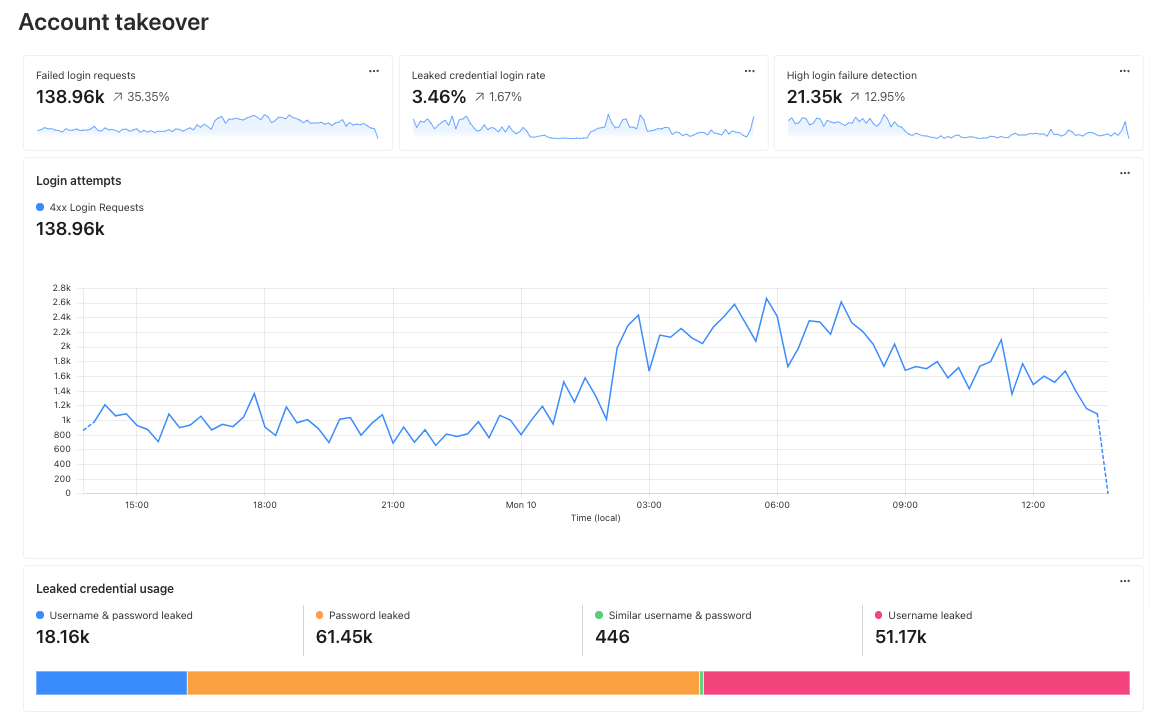
Take, for example, our use case from above: investigating unauthorized access. With custom dashboards, you can create a dashboard using the Account takeover template to monitor for suspicious login activity related to your domain.
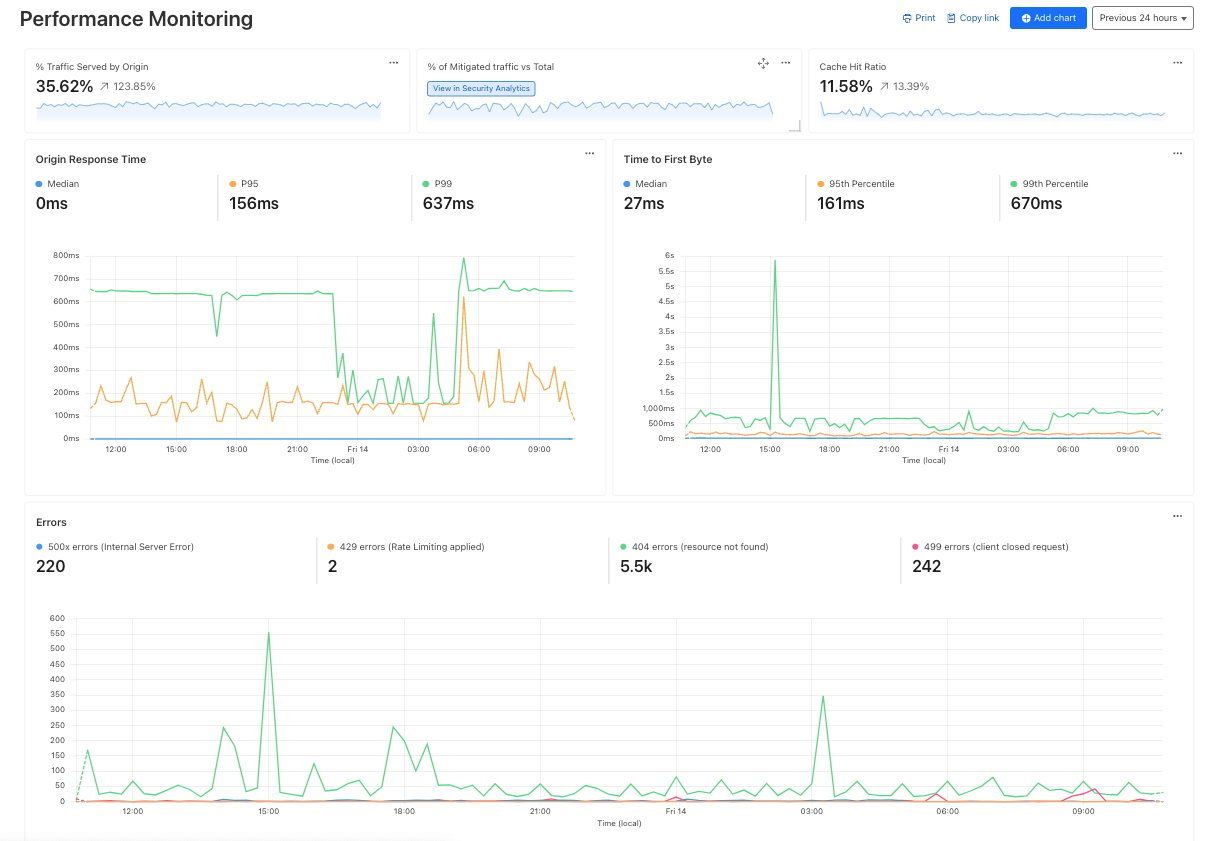
As another example, spikes in requests or errors are common indicators that something is wrong, and they can sometimes be signals of suspicious activity. With the Performance Monitoring template, you can view origin response time and time to first byte metrics as well as monitor for common errors. For example, in this chart, the spikes in 404 errors could be an indication of an unauthorized scan of your endpoints.
Seamlessly integrated into the Cloudflare platform
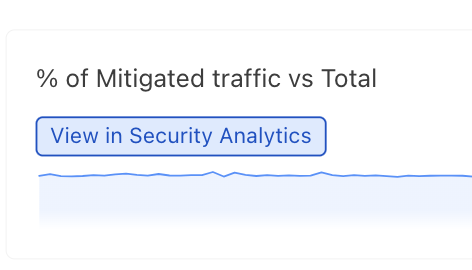
When using custom dashboards, if you observe a traffic pattern or spike in errors that you would like to further investigate, you can click the button to “View in Security Analytics” in order to drill down further into the data and craft custom WAF rules to mitigate the threat.
These tools, seamlessly integrated into the Cloudflare platform, will enable users to discover, investigate, and mitigate threats all in one place, reducing time to resolution and overall cost of ownership by eliminating the need to forward logs to third party security analysis tools. And because it is a native part of Cloudflare, you can immediately use the data from your investigation to craft targeted rules that will block these threats.
What’s next
Stay tuned as we continue to develop more capabilities in the areas of observability and forensics, with additional features including:
Custom alerts: create alerts based on specific metrics or anomalies
Scheduled query detections: craft log queries and run them on a schedule to detect malicious activity
More integration: further streamlining the journey between detect, investigate, and mitigate across the full Cloudflare platform.
How to get it
Current Log Explorer beta users get immediate access to the new custom dashboards feature. Pricing will be made available to everyone during Q2 2025. Between now and then, these features continue to be available at no cost.
Let us know if you are interested in joining our Beta program by completing this form, and a member of our team will contact you.
Many Managed Detection and Response (MDR) providers promise world-class threat detection, but behind the scenes they lock away your security logs, limiting your visibility and control. It’s your data — so why don’t you have full access to it? Isn’t the whole point of security to see everything happening in your environment? Without full access to your own data, you’re left dependent on their tools, their timelines, and their interpretations of security events.
This isn’t just an inconvenience — it’s a risk.
Pairing MDR with a Security Information and Event Management (SIEM) solution ensures complete transparency, enabling real-time investigation, historical threat hunting, compliance readiness, and deeper threat insights. If you don’t have full access to your security logs, you’re not truly in control of your cybersecurity strategy. And in today’s high-stakes environment, that’s simply not an option.
With Rapid7 MDR, you don’t just gain a service — you gain full access and control over your data, unlocking significant advantages for compliance, long-term strategy, and cross-platform analytics.
The Benefits of Owning your Data
When it comes to cybersecurity, data is everything. Logs, events, and alerts are the building blocks of threat detection, incident response, and forensic investigations. Owning your data, particularly with Rapid7’s 13-month data retention, empowers you in ways that vendor-locked solutions cannot match. Here’s how:
Cross-platform analytics Modern security teams operate across cloud, hybrid, and on-prem environments. Owning your data means you can integrate security telemetry across platforms, enabling immediate answers and deeper correlations between systems for accurate threat detection.
Compliance made easier Many industries require businesses to retain data for specific periods to meet regulatory standards such as GDPR, HIPAA, or PCI DSS. Rapid7’s extended data retention ensures you’re always audit-ready and compliant without relying on third-party intermediaries for log retrieval.
Historical threat hunting and forensics Cyber threats evolve over time — sometimes laying dormant for months to manifest into an attack. With 13 months of historical data, the MDR service can trace attack patterns, uncover dormant threats, and conduct deep-dive forensic investigations to prevent repeat breaches. Advanced threats don’t just appear out of nowhere — long-term attack campaigns require long-term visibility. If you don’t know how an attacker got in, how can you ensure they won’t come back?
The hidden risks of limited data access
Many MDR providers operate in a “black box” model, where security data is siloed within their systems, restricting user access and limiting independent investigations. This lack of transparency not only creates dependency on the vendor but can also lead to serious security and operational risks:
Slower incident response Seconds matter when attackers are inside your environment. Security teams can waste critical time waiting for an MDR provider to retrieve logs or investigate issues, delaying decisive action during cyberattacks.
Reduced security visibility Cyber threats don’t operate in isolation. Without full data access, security teams miss critical patterns, struggle to correlate events, and lose the ability to conduct independent investigations. The result? A weakened security posture and increased attack exposure.
Hindered cross-team collaboration Security isn’t just a SOC function — it requires collaboration with IT, compliance, risk, and leadership teams. When data is locked behind an MDR provider’s system, security teams cannot share insights or validate threats with other departments effectively. This slows down decision-making, creates blind spots across IT infrastructure, and reduces the organization’s ability to work as a unified team in responding to threats.
Compliance gaps If an organization cannot independently access its logs, it may struggle to provide auditors with the necessary evidence for compliance frameworks like GDPR, HIPAA, DORA, NIS2, or PCI DSS.
Rapid7 MDR: Transparency and control
Rapid7’s MDR service offers transparent and unrestricted access to your data through InsightIDR, our cloud-native, next-gen SIEM built for both detection and response. Unlike traditional SIEMs that focus solely on log aggregation, InsightIDR actively identifies and prioritizes real threats by analyzing user and attacker behavior, leveraging deception technology, and utilizing built-in threat intelligence. This ensures not only full visibility but also rapid detection and response to advanced threats, helping security teams act faster. With Rapid7, you get:
Real-time insights: Monitor and analyze security data in real-time for faster response to threats — no waiting for vendor-controlled access.
Custom dashboards: Rapid7’s dashboards support operational and executive reporting, making it easier for security teams to collaborate with IT, compliance, and leadership on security progress, priorities, and effectiveness.
Custom detections: Security teams can create tailored detections across any data sent to InsightIDR based on their specific infrastructure, threat models, and business needs. This ensures that critical anomalies and suspicious behaviors don’t get lost in generic detection rules.
Complete transparency: Audit every action taken by Rapid7 analysts and your SOC team plus see investigations and comments for transparency and collaboration.
Command the SIEM advantage: Context and correlation matter
A key differentiator of Rapid7 MDR is that InsightIDR is more than just a SIEM — it’s a next-gen detection and response platform. Many MDR solutions provide basic alerting but lack the advanced behavioral analytics and automated response capabilities of InsightIDR. By combining SIEM, user behavior analytics, deception technology, and automated response orchestration, InsightIDR proactively detects threats, correlates events across your environment, and enables faster, more precise response actions.
Without a SIEM, organizations struggle with:
Limited visibility into user behavior, making it harder to detect insider threats or compromised accounts.
No long-term correlation of security events, reducing the ability to uncover sophisticated, multi-stage attacks.
Gaps in historical threat hunting, restricting security teams from investigating past incidents, identifying trends, and improving future defenses.
With InsightIDR, Rapid7 MDR goes beyond detection — it provides comprehensive context, automation, and deep forensic capabilities that elevate an organization’s security maturity.
Take back command of your security data
In a world where vendor lock-in is common, maintaining ownership and access to your security data is not just a convenience, it’s a necessity. Without it, organizations risk compliance failures, slower response times, and reduced visibility into their own security posture.
With Rapid7 MDR, you’re not just subscribing to a service — you’re gaining a proactive security partner. You get unrestricted access, 13-month data retention, and real-time threat detection and response — ensuring compliance, faster incident containment, and smarter security decisions powered by InsightIDR’s built-in detection capabilities.
Don’t settle for an MDR solution that keeps you in the dark. Choose an approach that empowers your security team with full access and control over your data.
In today’s cybersecurity landscape, organizations need robust detection and response solutions to stay ahead of evolving threats. Rapid7’s InsightIDR, the foundation of our Managed Detection and Response (MDR) service, empowers security teams with advanced analytics, automation, and expert-led investigations. Whether used as a standalone SIEM and XDR platform or in combination with MDR, InsightIDR’s latest Log Search enhancements bring even more value across the board. These updates accelerate response times, simplify complex queries, and improve the investigation process for both our MDR clients and product-only customers.
These updates, including Simplified Query Building, Pre-Computed Queries, and Bloom Filters, enhance the speed, accuracy, and accessibility of log search for security teams, ensuring faster, more targeted threat investigations for organizations.
Let’s explore how these updates elevate the detection and response lifecycle.
Simplified Query Building: Empowering Analysts to Act Faster
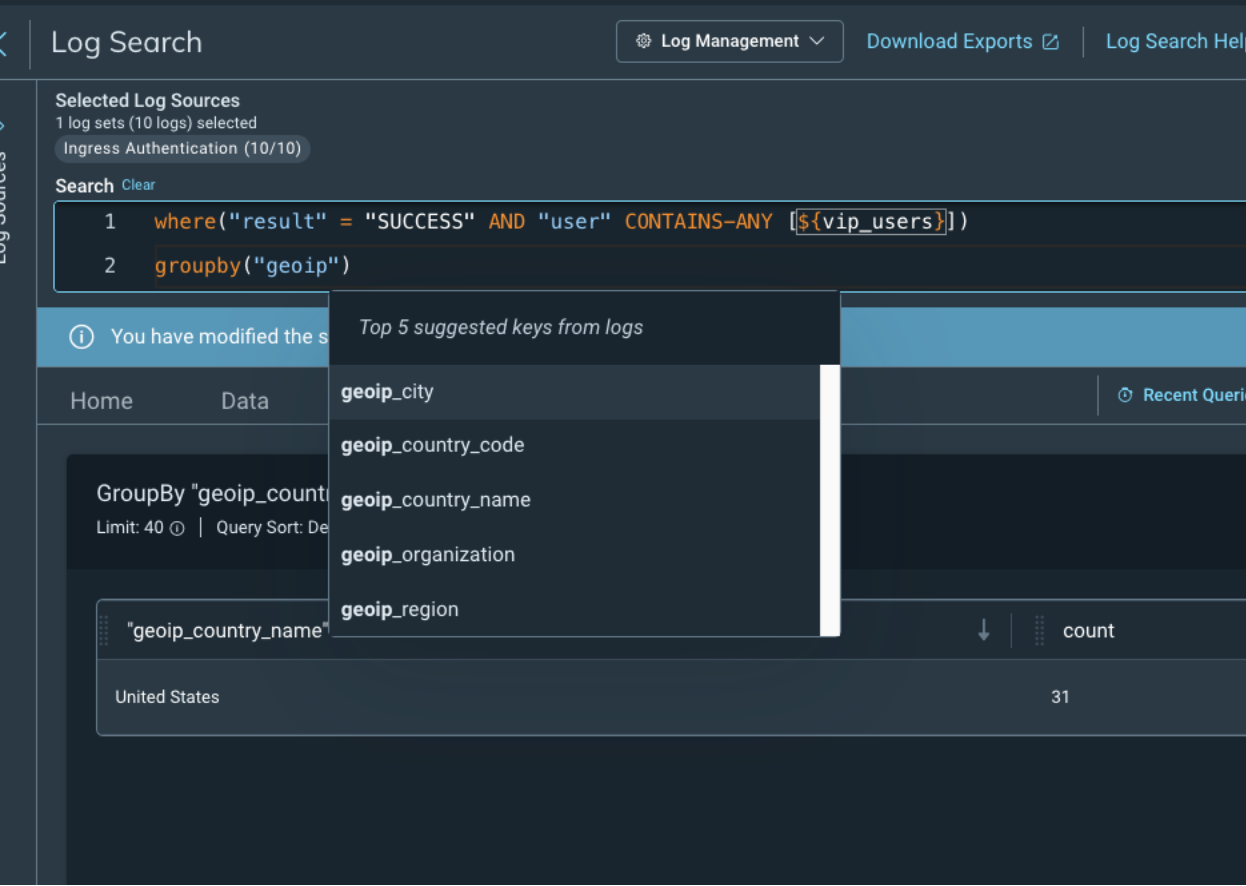
A key element of any detection and response solution is the ability to quickly turn data into actionable insights. Simplified Query Building enables analysts to construct and refine log searches faster, without complex syntax or technical details. This user-friendly interface enables any InsightIDR user, regardless of technical expertise, to create advanced queries through point-and-click prompts, accessing critical data quickly to streamline investigations.
By lowering the barrier to creating queries, Simplified Query Building provides organizations with timely, data-backed insights into incidents, reducing investigation time for both Rapid7’s MDR team and InsightIDR customers. This update ensures that every security team member, regardless of tenure, can access and leverage the power of InsightIDR’s log data without becoming bogged down by technical complexities.
InsightIDR – Simplified Query Building
Pre-Computed Queries: Reducing Time-to-Response for All Investigations
Time is critical when it comes to threat response.With Pre-Computed Queries (PCQs), both MDR and product-only customers benefit from reduced log search times. PCQs enable predictably fast, near-instant access to insights by pre-calculating query results in real-time as data arrives, enhancing responsiveness for all InsightIDR users.
Customer Feedback
“As an MSSP, InsightIDR’s ability to handle large amounts of data is key for identifying threats in our client environments. Pre-Computed Queries have reduced return times for complex searches by over 70%, allowing us to create more impactful insights for our clients.”
— Mat Cornish, Technical Director, Longwall Security
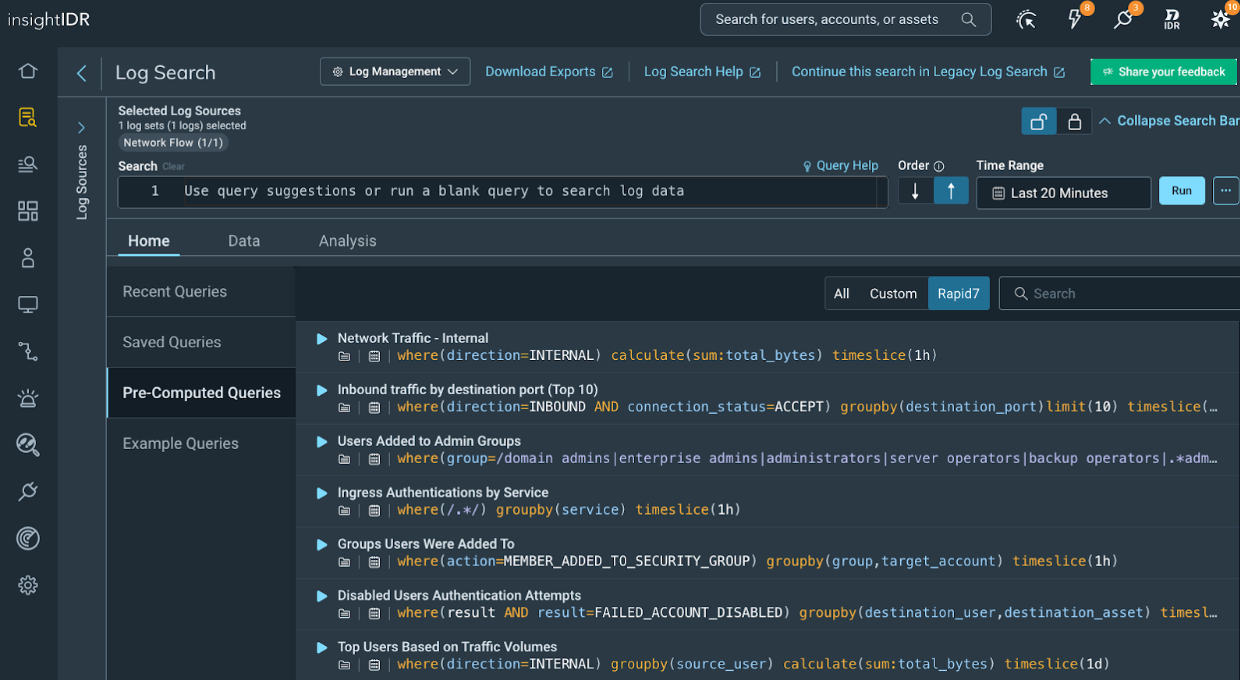
While InsightIDR already supports saving queries for reuse, PCQs take it further by pre-computing results, helping analysts to instantly identify patterns or gather evidence. Additionally, the Log Search home tab organizes queries by “Recent,” “Saved,” and “Pre-computed,” enabling users to quickly find what they need for streamlined incident handling. Whether you’re a customer conducting an in-house investigation or part of Rapid7’s MDR team, PCQs ensure faster insights and more efficient incident response.
InsightIDR – Pre-Computed Queries
Bloom Filters: Accelerating Key Value Pair Searches for Precise Threat Hunts
Not all queries can be pre-calculated in advance. Security teams are frequently asked questions about potential exposure to specific indicators of compromise (IoCs), such as flagged IP addresses or hash values. With Bloom Filters, both MDR and product-only customers gain a performance boost in search time for precise threat hunts by reducing unnecessary data processing.
For exact match searches, like identifying a compromised IP address or hunting for a suspicious hash value where(hash.sha=”…”), Bloom Filters optimize search time by ruling out irrelevant data – enabling the algorithm to skip logs that would not have matches. This enhancement is implemented on the backend and occurs automatically for any search that contains an exact match key-value pair. Reducing the search space means accelerating analysts’ ability to hone in on the exact information they need, cutting down investigation time dramatically.
A recent research effort into InsightIDR’s new indexing approach, which leverages Bloom Filters, showed impressive results with:
Improved Efficiency: Approximately 40-60% of all searches have experienced noticeable speed improvements since deployment.
Increased Precision: The new index has enabled applicable queries to skip irrelevant data three to four times more effectively, leading to shorter search durations for even more efficient investigations.
Bringing It All Together: Faster, More Effective Detection and Response
Whether you’re a Rapid7 MDR customer or an InsightIDR product-only user, these Log Search updates significantly enhance detection and response capabilities. By reducing search times, simplifying complex queries, and pinpointing threats with greater accuracy, we provide every InsightIDR user with faster, more effective security outcomes.
This means:
Faster Detection: Pre-Computed Queries and Bloom Filters accelerate search processes, enabling quicker response to incidents across both MDR and product-only use cases.
Improved Visibility: Simplified Query Building ensures analysts can quickly refine searches and access the data needed for comprehensive investigations.
Targeted Threat Hunts: Optimized key-value pair searches focus on the most relevant data, delivering quicker results for security teams.
Want to see these improvements in action? Contact us today to learn how Rapid7’s MDR service can protect your organization. You can also try InsightIDR for free with a 30-day trial.
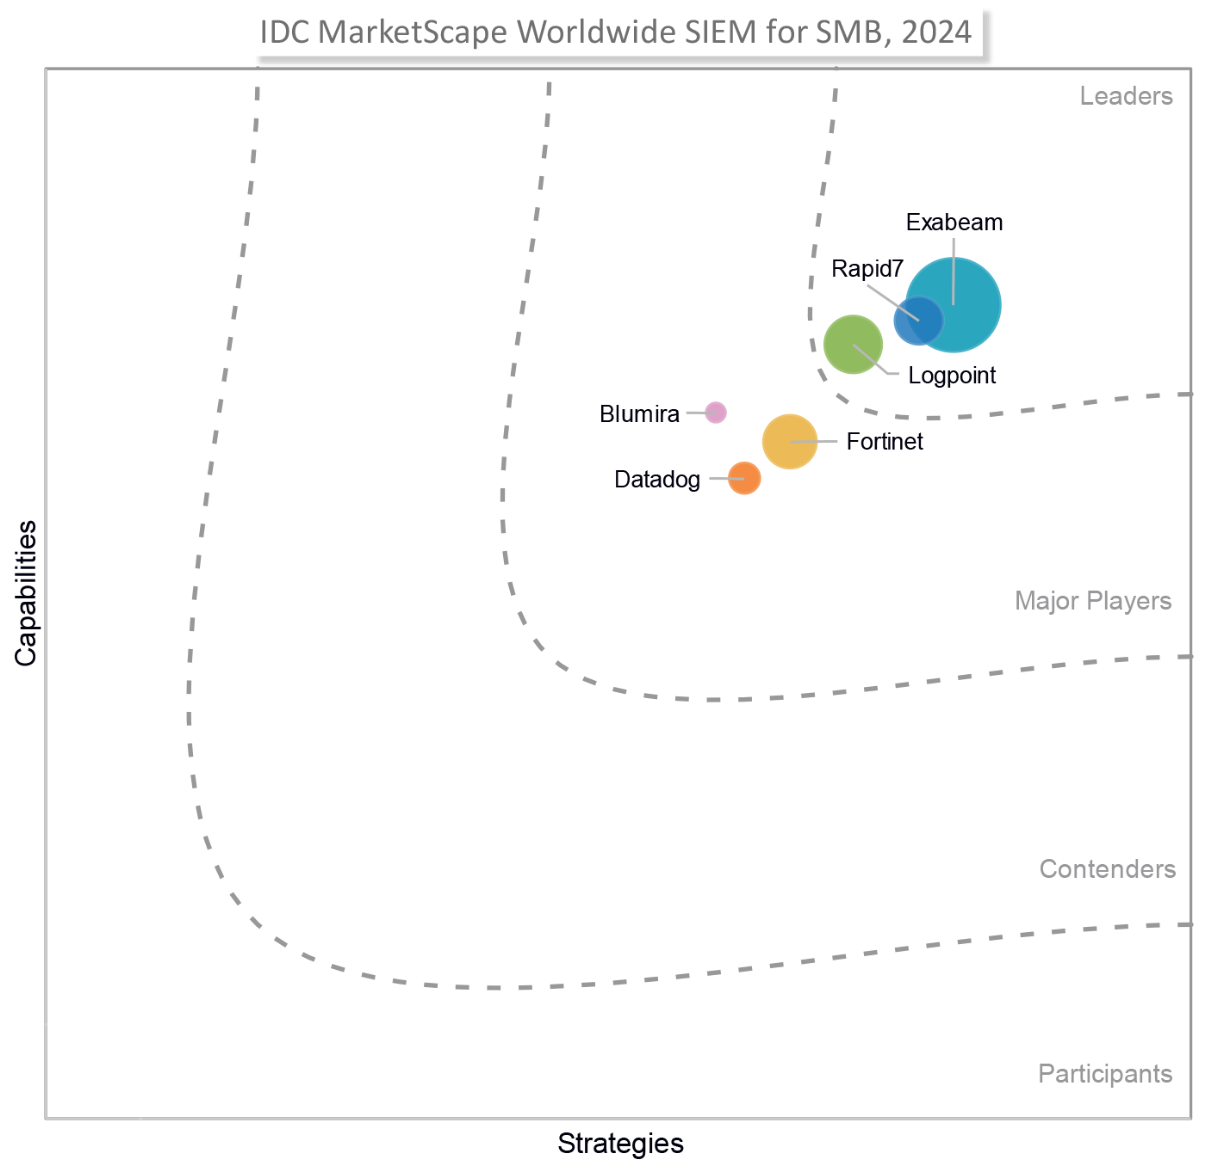
Rapid7 is excited to share we have been recognized as a Leader in the IDC MarketScape: Worldwide SIEM for SMB 2024 Vendor Assessment (doc #US52038824, September 2024). We want to thank our customers for their partnership, feedback, and trust, all of which continue to guide how we build and innovate toward our mission to deliver command of the attack surface and keep security teams ready for whatever comes next.
What sets InsightIDR apart from other SIEMs
When we entered this space almost nine years ago, we were driven by customers who were bogged down by the complexity and ineffectiveness of traditional SIEMs. Unfortunately, challenging deployments, constant tuning, unmanageable alerts, and inflated total cost of ownership continue to plague many SIEM users today – making it impossible to maximize utility of these products and challenging team effectiveness.
InsightIDR is different.
1. Intuitive deployment and UI to maximize efficiency
A strong SIEM product can be the nucleus of the SOC – helping to harmonize otherwise disparate data into a clear picture of the attack surface and relevant insights. Unfortunately, many SIEMs are off track from the start due to:
Complex deployments
High operational overhead
Tedious configuration work that consumes team resources
InsightIDR’s cloud-native, SaaS delivery makes it fast and easy to get started without the burdens of heavy infrastructure management, while ensuring you have the scale to grow with your business when you need it. Easily identify the priority data to ingest and quickly start collecting the right information with:
Intuitive onboarding wizards
Flexibility to leverage our native data collection (endpoint agent, network sensor, collectors)
Ability to connect your extended security ecosystem with vast integrations
Auto-enrichment of logs with user and asset details via our attribution engine
Custom log parsers
In-product guidance
With 13 months of readily searchable data and flexible search modes that can accommodate your most experienced to your most junior analysts, InsightIDR puts your data to work for you – not the other way around.
2. Optimized for modern threat detection
While collecting the right telemetry is a critical piece of unifying the attack surface, too many SIEMs are overly indexed on log aggregation. Lost in logs and making sense of data, teams can lose sight of the thing that matters most: staying ahead of an attack.
InsightIDR has taken a detections-first approach to SIEM and is proud to deliver a robust library of out-of-the-box detections that customers can trust and use as a starting line to augment their own threat intelligence and detections engineering programs. With coverage across all phases of the MITRE ATT&CK framework, this is the same detections library used in the field by our own Rapid7 MDR SOC experts – ensuring strong signal-to-noise detections and constant curation to keep teams ahead of emergent threats.
This library marries both AI-charged user and attacker behavioral detections alongside known IOC coverage to ensure you are ready for both evasive, headline-making unknown threats as well as recognized adversary TTPs. Detections are comprehensive across the modern attack surface – from endpoint-to-cloud – and can easily be customized or added onto so customers can feel confident they are covered no matter where threats begin.
3. Ready to respond across the attack surface
With a rapidly expanding attack surface, all teams are challenged to ensure they know how to investigate and respond effectively to alerts. It’s harder than ever to understand lateral movement and the full blast radius, so it’s critical to ensure analysts have enough context to take action – and the right playbooks and tools in place to execute when they’re ready to do so.
InsightIDR is built around making sure analyst teams are ready to respond effectively to threats every time. Highly correlated investigation timelines unify related alerts and events across the security ecosystem to give a cohesive view of an attack and all relevant evidence in one place.
Integrated access to the Velociraptor DFIR framework enables teams to quickly query fleets of endpoints to assess and understand the blast radius of an attack. And when it’s time to take action, alerts are paired with descriptive guidance and recommendations vetted by our own SOC experts. Fully embedded SOAR capabilities and pre-built playbooks accelerate readiness and time-to-respond. We understand the friction and toll that noisy alerts and complex investigations can take on SOC teams; InsightIDR reduces this burnout and the likelihood of analyst churn by decreasing cycles and friction across investigation workflows – creating happier and more effective teams.
4. Tangible return on investment
Probably one of the things that many SIEMs are most notorious for is high and unpredictable costs and resource consumption – with few results to show for it. Traditional ingestion-based models have always been a challenge for security teams – and it’s getting even more difficult as the attack surface becomes increasingly dynamic.
InsightIDR is available in a number of flexible packages designed around real customer needs and security journeys. Our Threat Complete product marries InsightIDR with our leading vulnerability management to deliver proactive, threat-informed risk management to further reduce noise and strengthen security posture.
Predictable, asset-based pricing across our packages means no surprise charges to explain to your C-Suite or Board. And executive dashboards help you share insights and show progress to your wider organization to be able to show how you are advancing your threat detection and incident response program.
We are proud to be a Leader
Thank you to the IDC MarketScape for this recognition. We are proud to be named a Leader, but we are always most proud of the thousands of customers and partners across the globe who trust Rapid7 at the center of their security program. To learn more, access a complimentary excerpt of the IDC MarketScape or start exploring InsightIDR.
Command Your Attack Surface with a next-gen SIEM built for the Cloud First Era
Rapid7 is excited to share that we are named a Challenger for InsightIDR in the 2024 Gartner Magic Quadrant for SIEM. In a crowded and constantly changing space, this is our sixth time to be recognized in the report. While the Magic Quadrant offers a great snapshot of the current marketplace, we are always looking ahead to what teams will need to be successful in the next era of cybersecurity.
We believe that the future of SIEM will be defined by the ability to:
Connect and synthesize expansive security telemetry as efficiently as possible
Pinpoint the most critical and actionable insights with the scale and speed of AI
Deliver the contextualized data, expert guidance, and automation to confidently take action against threats – wherever they start
We are proud to bring these elevated security outcomes to the thousands of customers across the globe who trust Rapid7 at the center of their SOC.
Actionable Visibility You Can Trust – From Endpoint to Cloud
As organizations’ attack surfaces continue to expand and security systems become more fragmented, teams are challenged to get reliable visibility and context to effectively monitor their environment, end-to-end. As your organization embraces digital transformation, adopts SaaS solutions, and/or fosters agile business development, you need security solutions that can grow with your business without the burden of infrastructure management or lagging scale.
InsightIDR is a cloud-native SIEM – purpose-built to support an organization’s scale with the speed of the cloud-first era. With flexible data ingestion – including our own lightweight, native endpoint agent, sensor, and collector as well as the ability to collect and parse diverse data from your wider ecosystem – customers are able to quickly synthesize their most critical telemetry, without the heavy management burdens of traditional SIEM technologies.
Many traditional SIEM approaches leave it all on the customer to figure out how to action their data once in their platform. This leaves resource-constrained teams on their heels and sorting through mounds of data without being able to pinpoint the insights that matter. InsightIDR’s flexible search modes boost both power-users’ and beginners’ ability to quickly turn data into actionable insights and leverage pre-built queries and dashboards as a jumping-off point for action. And with 13-months of readily searchable data logs by default, your data is always ready for you, whenever you need it.
AI-Driven Behavioral Detections to Pinpoint Today’s Advanced Threats
The current threat climate requires a high degree of vigilance and detections content curation to be able to keep pace with adversaries’ ever-growing arsenal of tactics, techniques, and procedures (TTPs). This is one of the most challenging domains for security teams to master and carve out time for – and unfortunately most SIEMs have led with a logging-centric approach, putting the work of threat-intelligence gathering and detections engineering on the customer to parse.
From the beginning, InsightIDR pioneered the detections-centric SIEM, focused on pinpointing and eliminating real threats as quickly as possible. Our library contains over 8,000 detections, giving customers complete coverage across all stages of the MITRE ATT&CK. Our detections engineering experts are constantly curating threat intelligence – including unique raw intelligence from our renowned Rapid7 Open Source Community (including Metasploit, the #1 pentesting tool in the world, Velociraptor digital forensics and incident response framework, and AttackKB vulnerability database) – to ensure customers have coverage against emergent threats (and because our platform is SaaS-delivered, customers immediately receive new detections content ).
Rapid7 holds 56 patents across proprietary analytics frameworks and AI, which contribute to our layered detections strategy. AI-powered attacker and user behavioral analytics detect stealthy attacker behavior and unknown threats that can often go undetected, and complement known indicators of compromise (IOCs) for total coverage. This is the same detections library that our Rapid7 MDR team leverages, so our SIEM customers have high efficacy, low-noise detections they can trust out of the gate.
Response Built for Cloud and Distributed Environments
In the critical moments of an attack, the last thing a security analyst wants to be doing is hopping tabs between different solutions to get the full picture. But security solution sprawl has forced too many SOCs to be tied up being systems integrators vs. being able to focus on actual security work.
InsightIDR’s investigation views eliminate tab-hopping and disparate alert trails. When an alert is fired, customers see a consolidated timeline view of an attack, lateral movement, impacted users and assets, and related CVEs in a single view. Detailed evidence and intelligence, ATT&CK mapping, and vetted recommendations provide all relevant detail at the customer’s fingertips – so even your most junior analyst can respond like an expert, every time. Customers can also pivot from these investigation views into the Velociraptor DFIR framework to more broadly query distributed endpoint fleets to understand the full scope of an attack and avoid repeat occurrences.
One of the biggest challenges of today’s landscape is navigating response to complex cloud environments. Our simplified cloud threat alert view ensures SOC teams can confidently triage cloud provider alerts – like those from GuardDuty – with a purpose-built alert framework that parses out critical alert summaries, impacted resources, queries, and recommends responses to prioritize and act as quickly as possible on threats across cloud workloads. Regardless of where threats begin, with InsightIDR your team is covered and always knows what to do next.
Let Rapid7 Help You Take Command of Your Attack Surface
The complexities of today’s modern attack surface can be daunting, and are too often compounded by disparate solutions or legacy approaches that can make things worse. Rapid7’s integrated platform approach synthesizes your security data ecosystem to deliver unified exposure management and detection and response that maximizes efficiency and security outcomes. Thank you to our customers and partners who trust Rapid7 as their security consolidation partner of choice, and have contributed to recognitions like this Gartner Magic Quadrant for SIEM.
Please register for our cybersecurity event on May 21st to learn how Rapid7 can help you build cyber resilience and take command of your attack surface.
Gartner does not endorse any vendor, product or service depicted in its research publications and does not advise technology users to select only those vendors with the highest ratings or other designation. Gartner research publications consist of the opinions of Gartner’s research organization and should not be construed as statements of fact. Gartner disclaims all warranties, expressed or implied, with respect to this research, including any warranties of merchantability or fitness for a particular purpose.
GARTNER is a registered trademark and service mark of Gartner and Magic Quadrant and Peer Insights are a registered trademark, of Gartner, Inc. and/or its affiliates in the U.S. and internationally and are used herein with permission. All rights reserved.
Gartner Peer Insights content consists of the opinions of individual end users based on their own experiences with the vendors listed on the platform, should not be construed as statements of fact, nor do they represent the views of Gartner or its affiliates. Gartner does not endorse any vendor, product or service depicted in this content nor makes any warranties, expressed or implied, with respect to this content, about its accuracy or completeness, including any warranties of merchantability or fitness for a particular purpose.
Gartner Peer Insights reviews constitute the subjective opinions of individual end users based on their own experiences and do not represent the views of Gartner or its affiliates.
Continually reviewing your organization’s incident response capabilities can be challenging without a mechanism to create security findings with actual Amazon Web Services (AWS) resources within your AWS estate. As prescribed within the AWS Security Incident Response whitepaper, it’s important to periodically review your incident response capabilities to make sure your security team is continually maturing internal processes and assessing capabilities within AWS. Generating sample security findings is useful to understand the finding format so you can enrich the finding with additional metadata or create and prioritize detections within your security information event management (SIEM) solution. However, if you want to conduct an end-to-end incident response simulation, including the creation of real detections, sample findings might not create actionable detections that will start your incident response process because of alerting suppressions you might have configured, or imaginary metadata (such as synthetic Amazon Elastic Compute Cloud (Amazon EC2) instance IDs), which might confuse your remediation tooling.
In this post, we walk through how to deploy a solution that provisions resources to generate simulated security findings for actual provisioned resources within your AWS account. Generating simulated security findings in your AWS account gives your security team an opportunity to validate their cyber capabilities, investigation workflow and playbooks, escalation paths across teams, and exercise any response automation currently in place.
Important: It’s strongly recommended that the solution be deployed in an isolated AWS account with no additional workloads or sensitive data. No resources deployed within the solution should be used for any purpose outside of generating the security findings for incident response simulations. Although the security findings are non-destructive to existing resources, they should still be done in isolation. For any AWS solution deployed within your AWS environment, your security team should review the resources and configurations within the code.
Conducting incident response simulations
Before deploying the solution, it’s important that you know what your goal is and what type of simulation to conduct. If you’re primarily curious about the format that active Amazon GuardDuty findings will create, you should generate sample findings with GuardDuty. At the time of this writing, Amazon Inspector doesn’t currently generate sample findings.
If you want to validate your incident response playbooks, make sure you have playbooks for the security findings the solution generates. If those playbooks don’t exist, it might be a good idea to start with a high-level tabletop exercise to identify which playbooks you need to create.
Because you’re running this sample in an AWS account with no workloads, it’s recommended to run the sample solution as a purple team exercise. Purple team exercises should be periodically run to support training for new analysts, validate existing playbooks, and identify areas of improvement to reduce the mean time to respond or identify areas where processes can be optimized with automation.
Now that you have a good understanding of the different simulation types, you can create security findings in an isolated AWS account.
Prerequisites
[Recommended] A separate AWS account containing no customer data or running workloads
[Optional] AWS Security Hub can be enabled to show a consolidated view of security findings generated by GuardDuty and Inspector
Solution architecture
The architecture of the solution can be found in Figure 1.
Figure 1: Sample solution architecture diagram
A user specifies the type of security findings to generate by passing an AWS CloudFormation parameter.
An Amazon Simple Notification Service (Amazon SNS) topic is created to subscribe to findings for notifications. Subscribed users are notified of the finding through the deployed SNS topic.
Upon user selection of the CloudFormation parameter, EC2 instances are provisioned to run commands to generate security findings.
Note: If the parameter inspector is provided during deployment, then only one EC2 instance is deployed. If the parameter guardduty is provided during deployment, then two EC2 instances are deployed.
The Lambda function, ecr_cleanup_function, cleans up the vulnerable images in the deployed Amazon ECR repository based on applied tags and sends a notification to the Amazon SNS topic.
Note: The ecr_cleanup_function Lambda function is also invoked as a custom resource to clean up vulnerable images during deployment. If there are issues with cleanup, the EventBridge rule continually attempts to clean up vulnerable images.
For GuardDuty, the following actions are taken and resources are deployed:
An AWS Systems Manager parameter stores the IAM access key for guardduty-demo-user.
An AWS Secrets Manager secret stores the inactive IAM secret access key for guardduty-demo-user.
An Amazon DynamoDB table is created, and the table name is stored in a Systems Manager parameter to be referenced within the EC2 user data.
An Amazon Simple Storage Service (Amazon S3) bucket is created, and the bucket name is stored in a Systems Manager parameter to be referenced within the EC2 user data.
A Lambda function adds a threat list to GuardDuty that includes the IP addresses of the EC2 instances deployed as part of the sample.
EC2 user data generates GuardDuty findings for the following:
Updates EKS cluster configuration to make a dashboard public.
DynamoDB
Adds an item to the DynamoDB table for Joshua Tree.
EC2
Creates an AWS CloudTrail trail named guardduty-demo-trail-<GUID> and subsequently deletes the same CloudTrail trail. The <GUID> is randomly generated by using the $RANDOM function
Runs portscan on 172.31.37.171 (an RFC 1918 private IP address) and private IP of the EKS Deployment EC2 instance provisioned as part of the sample. Port scans are primarily used by bad actors to search for potential vulnerabilities. The target of the port scans are internal IP addresses and do not leave the sample VPC deployed.
Curls DNS domains that are labeled for bitcoin, command and control, and other domains associated with known threats.
Amazon S3
Disables Block Public Access and server access logging for the S3 bucket provisioned as part of the solution.
IAM
Deletes the existing account password policy and creates a new password policy with a minimum length of six characters.
guardduty_remediation_eks_rule – When a GuardDuty finding for EKS is created, a Lambda function attempts to delete the EKS resources. Subscribed users are notified of the finding through the deployed SNS topic.
guardduty_remediation_credexfil_rule – When a GuardDuty finding for InstanceCredentialExfiltration is created, a Lambda function is used to revoke the IAM role’s temporary security credentials and AWS permissions. Subscribed users are notified of the finding through the deployed SNS topic.
guardduty_respond_IAMUser_rule – When a GuardDuty finding for IAM is created, subscribed users are notified through the deployed SNS topic. There is no remediation activity triggered by this rule.
Guardduty_notify_S3_rule – When a GuardDuty finding for Amazon S3 is created, subscribed users are notified through the deployed Amazon SNS topic. This rule doesn’t invoke any remediation activity.
The following Lambda functions are created:
guardduty_iam_remediation_function – This function revokes active sessions and sends a notification to the SNS topic.
eks_cleanup_function – This function deletes the EKS resources in the EKS CloudFormation template.
Note: Upon attempts to delete the overall sample CloudFormation stack, this runs to delete the EKS CloudFormation template.
An S3 bucket stores EC2 user data scripts run from the EC2 instances
Option 1: Deploy the solution with AWS CloudFormation using the console
Use the console to sign in to your chosen AWS account and then choose the Launch Stack button to open the AWS CloudFormation console pre-loaded with the template for this solution. It takes approximately 10 minutes for the CloudFormation stack to complete.
Option 2: Deploy the solution by using the AWS CDK
To build the app when navigating to the project’s root folder, use the following commands:
npm install -g aws-cdk-lib
npm install
Run the following command in your terminal while authenticated in your separate deployment AWS account to bootstrap your environment. Be sure to replace <INSERT_AWS_ACCOUNT> with your account number and replace <INSERT_REGION> with the AWS Region that you want the solution deployed to.
After the solution successfully deploys, security findings should start appearing in your AWS account’s GuardDuty console within a couple of minutes.
Amazon GuardDuty findings
In order to create a diverse set of GuardDuty findings, the solution uses Amazon EC2 user data to run scripts. Those scripts can be found in the sample repository. You can also review and change scripts as needed to fit your use case or to remove specific actions if you don’t want specific resources to be altered or security findings to be generated.
A comprehensive list of active GuardDuty finding types and details for each finding can be found in the Amazon GuardDuty user guide. In this solution, activities which cause the following GuardDuty findings to be generated, are performed:
To generate the EKS security findings, the EKS Deployment EC2 instance is running eksctl commands that deploy CloudFormation templates. If the EKS cluster doesn’t deploy, it might be because of capacity restraints in a specific Availability Zone. If this occurs, manually delete the failed EKS CloudFormation templates.
If you want to create the EKS cluster and security findings manually, you can do the following:
Connect to the EKS Deployment EC2 instance using an IAM role that has access to start a session through Systems Manager. After connecting to the ssm-user, issue the following commands in the Session Manager session:
The findings for Amazon Inspector are generated by using the open source Vulhub collection. The open source collection has pre-built vulnerable Docker environments that pull images into Amazon ECR.
The Amazon Inspector findings that are created vary depending on what exists within the open source library at deployment time. The following are examples of findings you will see in the console:
If you deployed the security finding generator solution by using the Launch Stack button in the console or the CloudFormation template security_finding_generator_cfn, do the following to clean up:
In the CloudFormation console for the account and Region where you deployed the solution, choose the SecurityFindingGeneratorStack stack.
Choose the option to Delete the stack.
If you deployed the solution by using the AWS CDK, run the command cdk destroy.
Important: The solution uses eksctl to provision EKS resources, which deploys additional CloudFormation templates. There are custom resources within the solution that will attempt to delete the provisioned CloudFormation templates for EKS. If there are any issues, you should verify and manually delete the following CloudFormation templates:
In this blog post, I showed you how to deploy a solution to provision resources in an AWS account to generate security findings. This solution provides a technical framework to conduct periodic simulations within your AWS environment. By having real, rather than simulated, security findings, you can enable your security teams to interact with actual resources and validate existing incident response processes. Having a repeatable mechanism to create security findings also provides your security team the opportunity to develop and test automated incident response capabilities in your AWS environment.
If you have feedback about this post, submit comments in the Comments section below. If you have questions about this post, start a new thread on the Incident Response re:Post or contact AWS Support.
Today, we are excited to announce beta availability of Log Explorer, which allows you to investigate your HTTP and Security Event logs directly from the Cloudflare Dashboard. Log Explorer is an extension of Security Analytics, giving you the ability to review related raw logs. You can analyze, investigate, and monitor for security attacks natively within the Cloudflare Dashboard, reducing time to resolution and overall cost of ownership by eliminating the need to forward logs to third party security analysis tools.
Background
Security Analytics enables you to analyze all of your HTTP traffic in one place, giving you the security lens you need to identify and act upon what matters most: potentially malicious traffic that has not been mitigated. Security Analytics includes built-in views such as top statistics and in-context quick filters on an intuitive page layout that enables rapid exploration and validation.
In order to power our rich analytics dashboards with fast query performance, we implemented data sampling using Adaptive Bit Rate (ABR) analytics. This is a great fit for providing high level aggregate views of the data. However, we received feedback from many Security Analytics power users that sometimes they need access to a more granular view of the data — they need logs.
Logs provide critical visibility into the operations of today’s computer systems. Engineers and SOC analysts rely on logs every day to troubleshoot issues, identify and investigate security incidents, and tune the performance, reliability, and security of their applications and infrastructure. Traditional metrics or monitoring solutions provide aggregated or statistical data that can be used to identify trends. Metrics are wonderful at identifying THAT an issue happened, but lack the detailed events to help engineers uncover WHY it happened. Engineers and SOC Analysts rely on raw log data to answer questions such as:
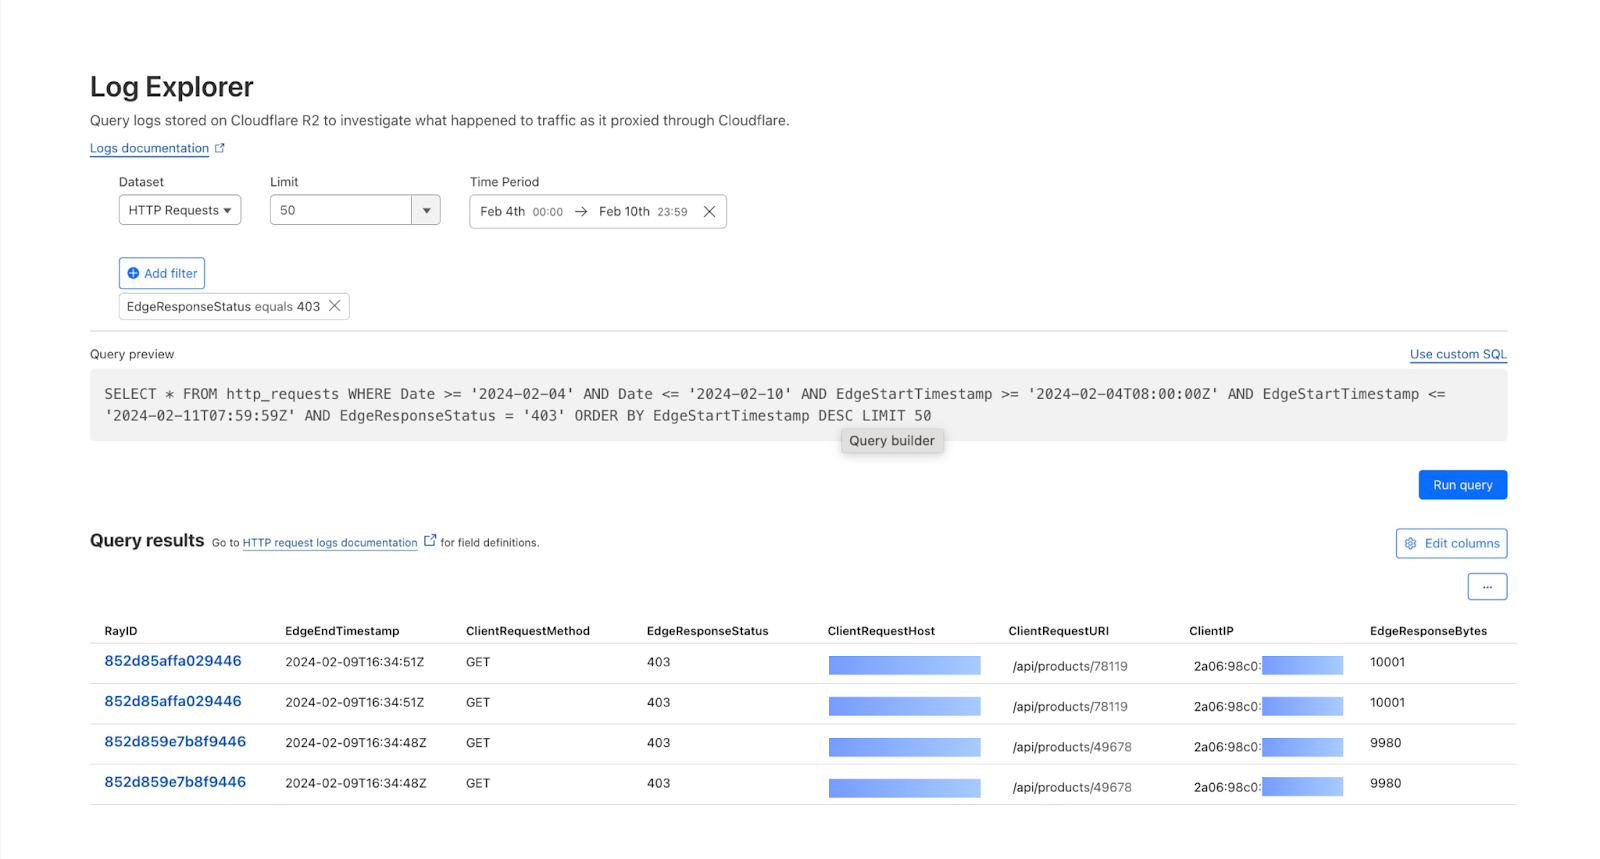
What is causing this increase in 403 errors?
What data was accessed by this IP address?
What was the user experience of this particular user’s session?
Traditionally, these engineers and analysts would stand up a collection of various monitoring tools in order to capture logs and get this visibility. With more organizations using multiple clouds, or a hybrid environment with both cloud and on-premise tools and architecture, it is crucial to have a unified platform to regain visibility into this increasingly complex environment. As more and more companies are moving towards a cloud native architecture, we see Cloudflare’s connectivity cloud as an integral part of their performance and security strategy.
Log Explorer provides a lower cost option for storing and exploring log data within Cloudflare. Until today, we have offered the ability to export logs to expensive third party tools, and now with Log Explorer, you can quickly and easily explore your log data without leaving the Cloudflare Dashboard.
Log Explorer Features
Whether you’re a SOC Engineer investigating potential incidents, or a Compliance Officer with specific log retention requirements, Log Explorer has you covered. It stores your Cloudflare logs for an uncapped and customizable period of time, making them accessible natively within the Cloudflare Dashboard. The supported features include:
Searching through your HTTP Request or Security Event logs
Filtering based on any field and a number of standard operators
Switching between basic filter mode or SQL query interface
Selecting fields to display
Viewing log events in tabular format
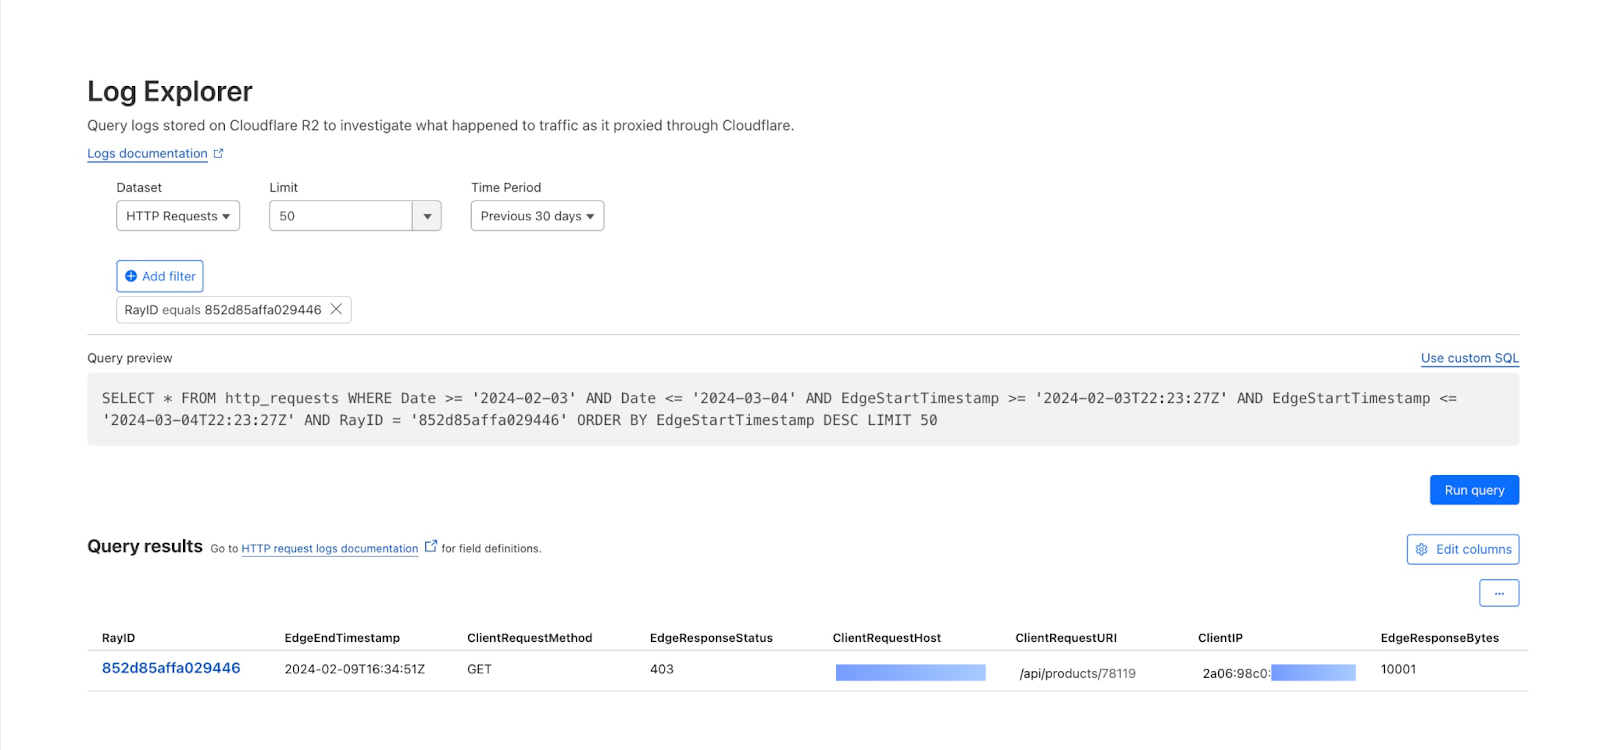
Finding the HTTP request records associated with a Ray ID
Narrow in on unmitigated traffic
As a SOC analyst, your job is to monitor and respond to threats and incidents within your organization’s network. Using Security Analytics, and now with Log Explorer, you can identify anomalies and conduct a forensic investigation all in one place.
Let’s walk through an example to see this in action:
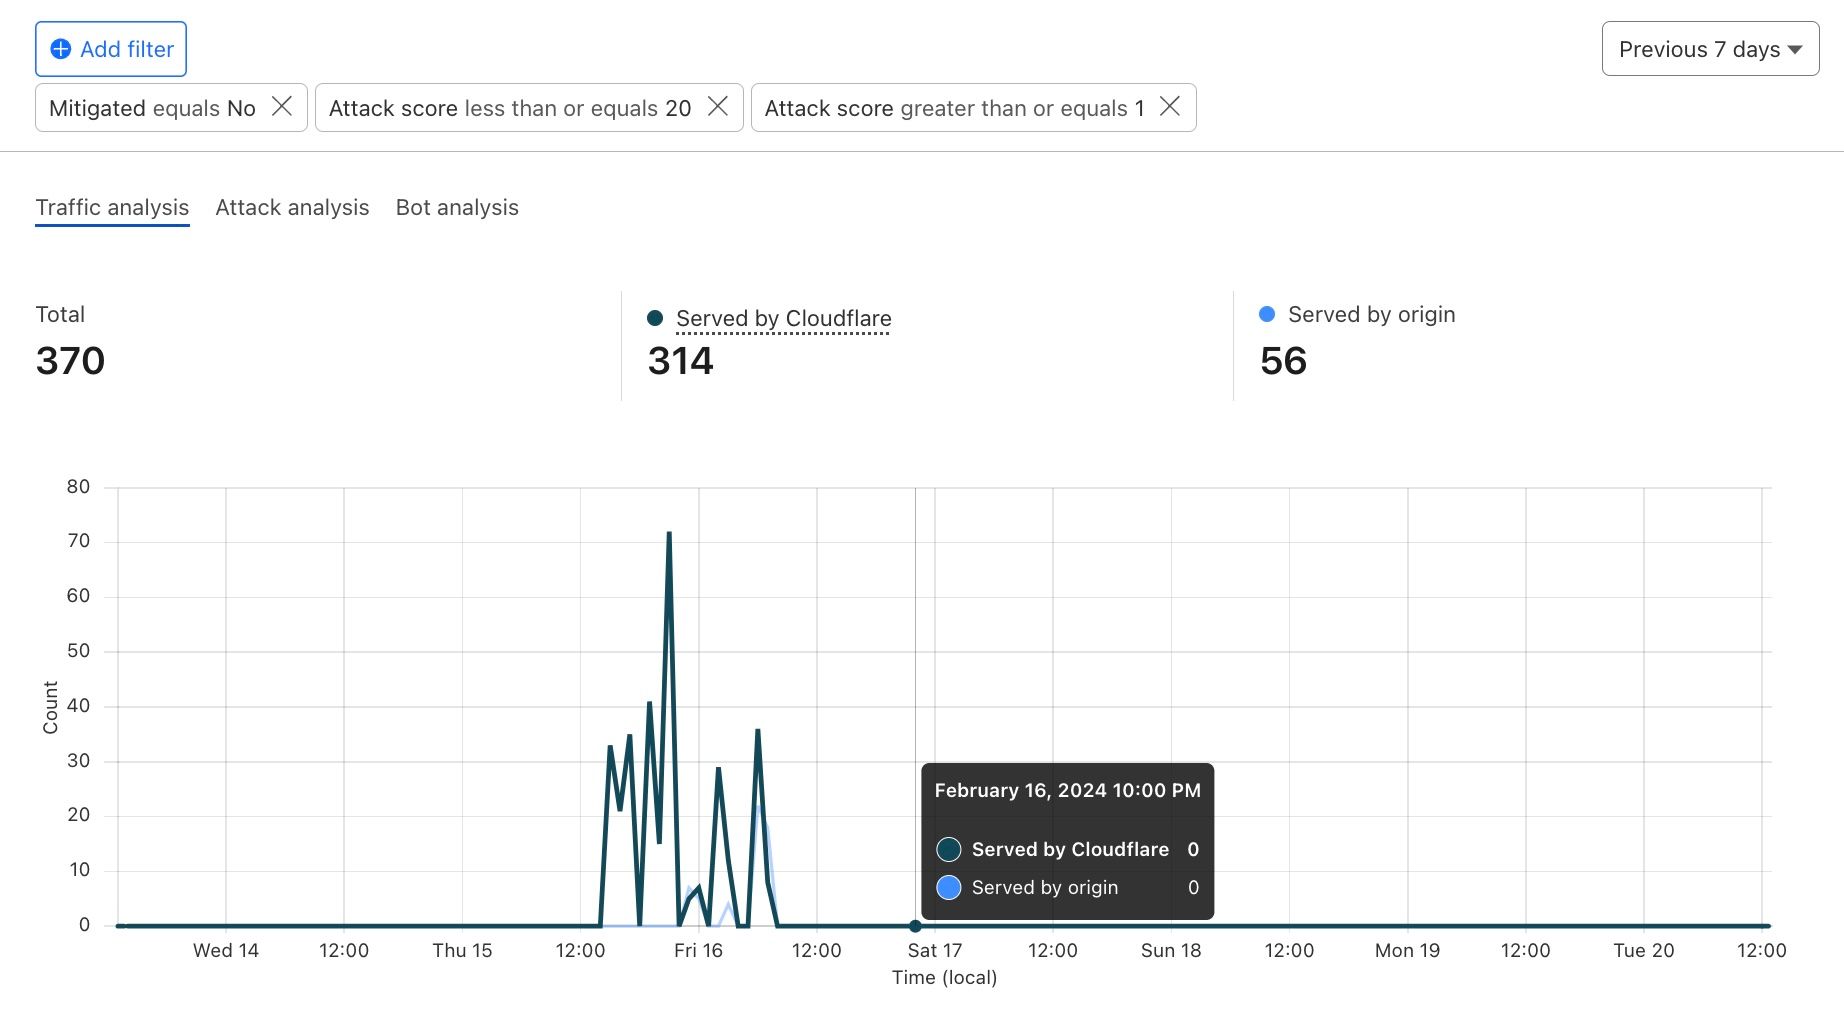
On the Security Analytics dashboard, you can see in the Insights panel that there is some traffic that has been tagged as a likely attack, but not mitigated.
Clicking the filter button narrows in on these requests for further investigation.
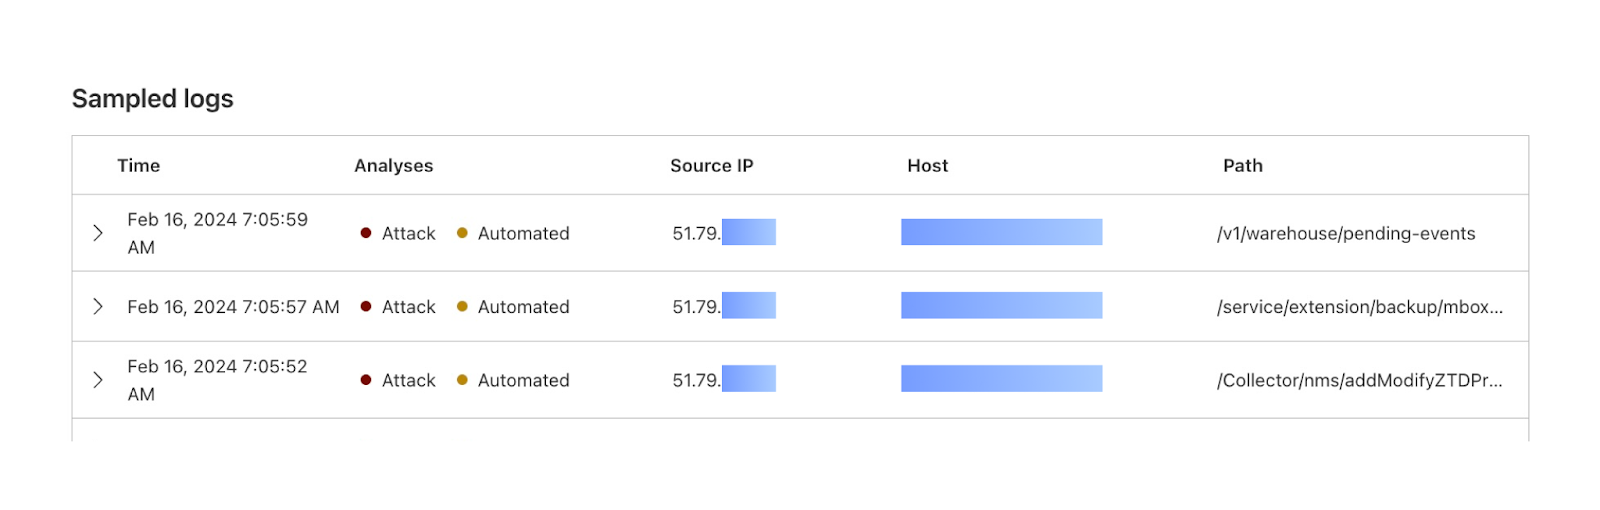
In the sampled logs view, you can see that most of these requests are coming from a common client IP address.
You can also see that Cloudflare has flagged all of these requests as bot traffic. With this information, you can craft a WAF rule to either block all traffic from this IP address, or block all traffic with a bot score lower than 10.
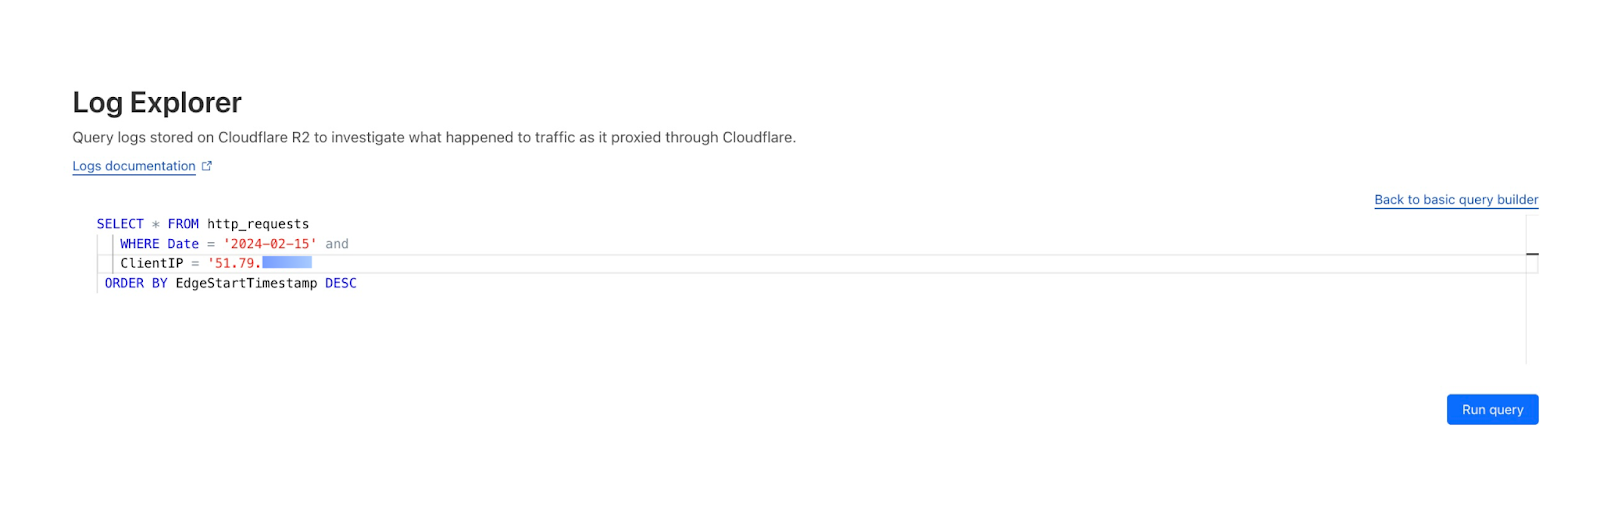
Let’s say that the Compliance Team would like to gather documentation on the scope and impact of this attack. We can dig further into the logs during this time period to see everything that this attacker attempted to access.
First, we can use Log Explorer to query HTTP requests from the suspect IP address during the time range of the spike seen in Security Analytics.
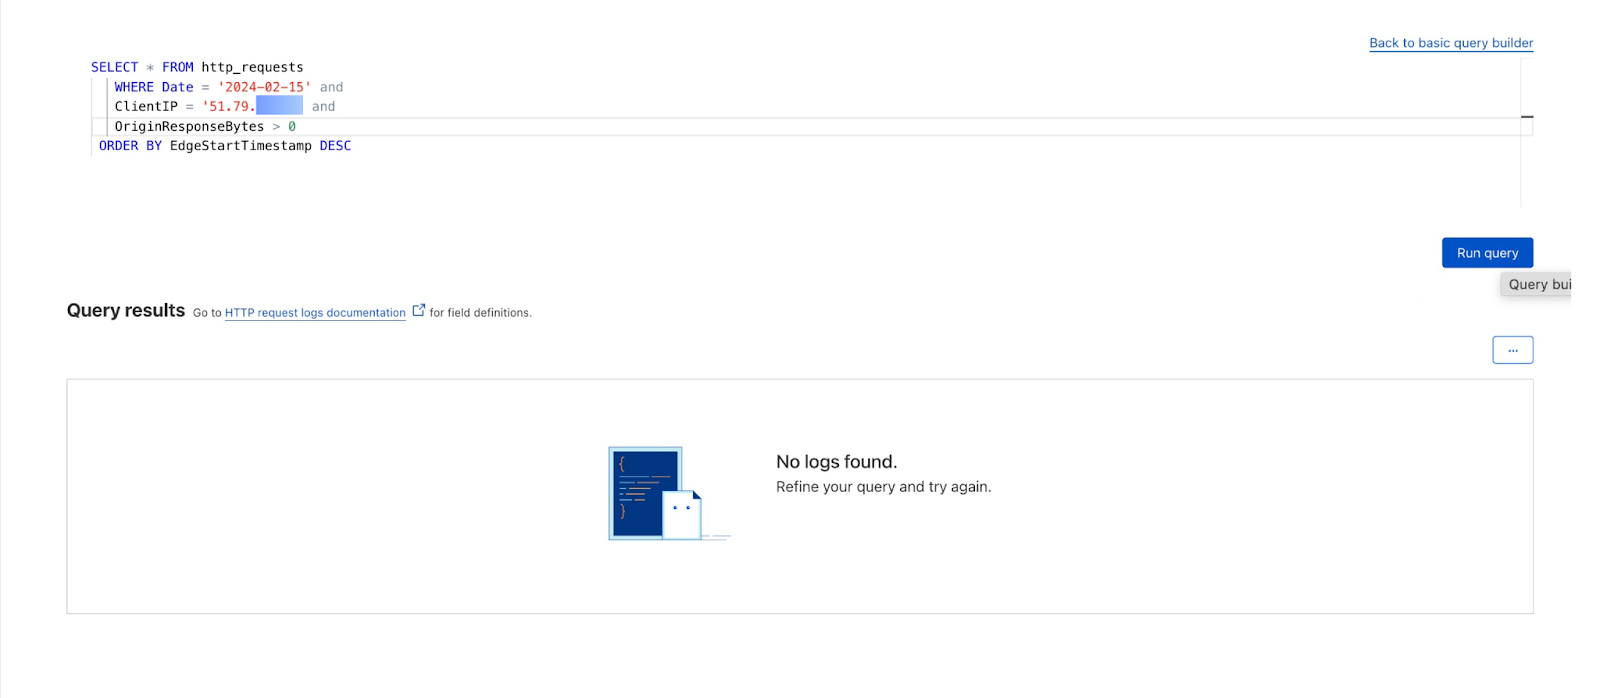
We can also review whether the attacker was able to exfiltrate data by adding the OriginResponseBytes field and updating the query to show requests with OriginResponseBytes > 0. The results show that no data was exfiltrated.
Find and investigate false positives
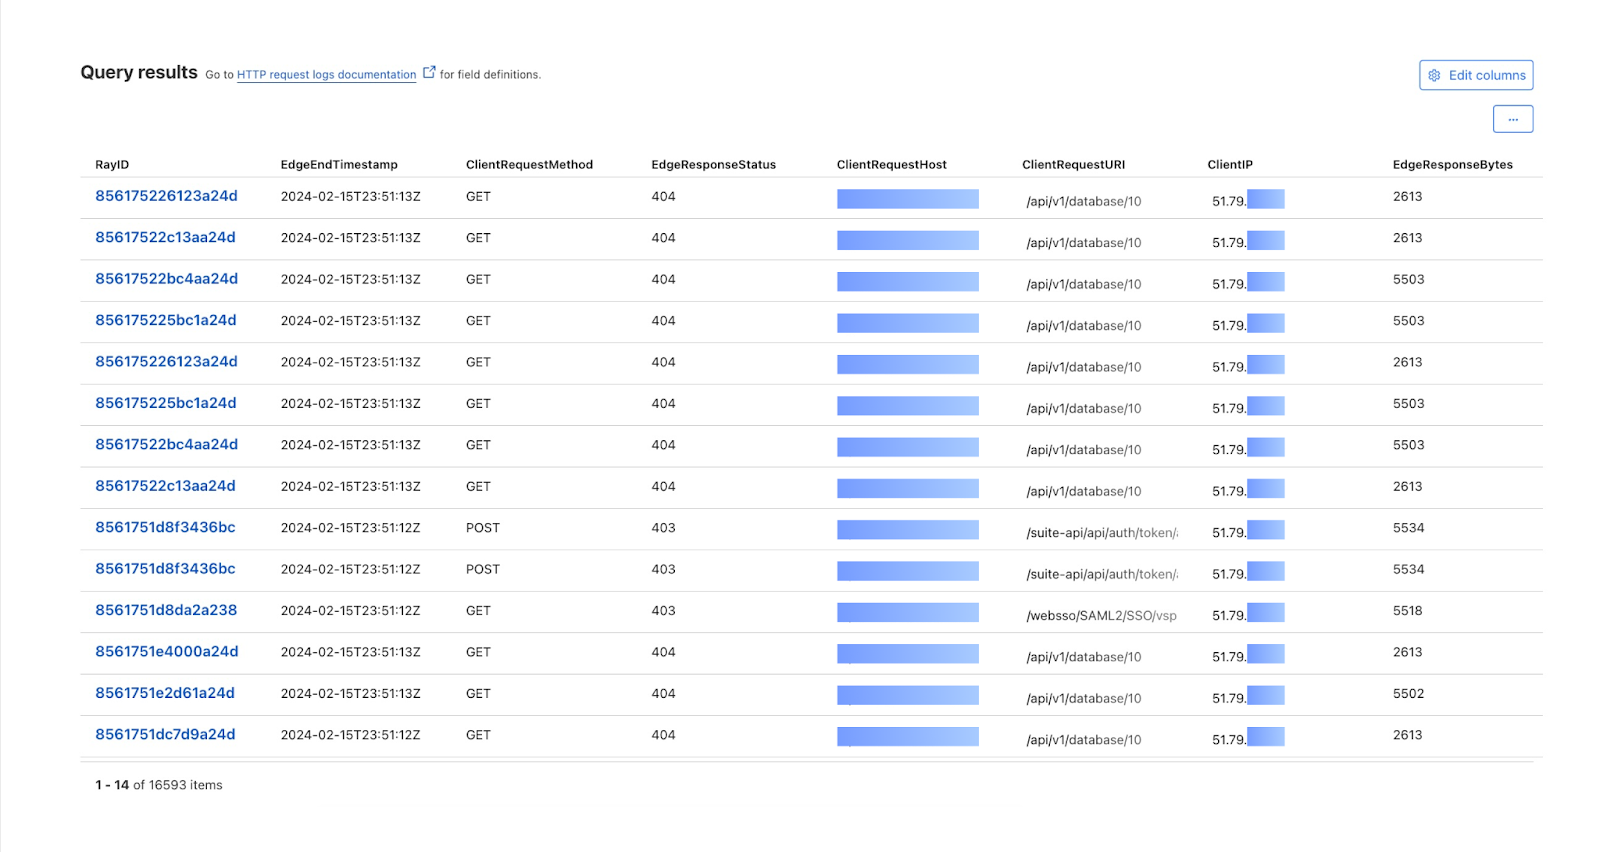
With access to the full logs via Log Explorer, you can now perform a search to find specific requests.
A 403 error occurs when a user’s request to a particular site is blocked. Cloudflare’s security products use things like IP reputation and WAF attack scores based on ML technologies in order to assess whether a given HTTP request is malicious. This is extremely effective, but sometimes requests are mistakenly flagged as malicious and blocked.
In these situations, we can now use Log Explorer to identify these requests and why they were blocked, and then adjust the relevant WAF rules accordingly.
Or, if you are interested in tracking down a specific request by Ray ID, an identifier given to every request that goes through Cloudflare, you can do that via Log Explorer with one query.
Note that the LIMIT clause is included in the query by default, but has no impact on RayID queries as RayID is unique and only one record would be returned when using the RayID filter field.
How we built Log Explorer
With Log Explorer, we have built a long-term, append-only log storage platform on top of Cloudflare R2. Log Explorer leverages the Delta Lake protocol, an open-source storage framework for building highly performant, ACID-compliant databases atop a cloud object store. In other words, Log Explorer combines a large and cost-effective storage system – Cloudflare R2 – with the benefits of strong consistency and high performance. Additionally, Log Explorer gives you a SQL interface to your Cloudflare logs.
Each Log Explorer dataset is stored on a per-customer level, just like Cloudflare D1, so that your data isn’t placed with that of other customers. In the future, this single-tenant storage model will give you the flexibility to create your own retention policies and decide in which regions you want to store your data.
Under the hood, the datasets for each customer are stored as Delta tables in R2 buckets. A Delta table is a storage format that organizes Apache Parquet objects into directories using Hive’s partitioning naming convention. Crucially, Delta tables pair these storage objects with an append-only, checkpointed transaction log. This design allows Log Explorer to support multiple writers with optimistic concurrency.
Many of the products Cloudflare builds are a direct result of the challenges our own team is looking to address. Log Explorer is a perfect example of this culture of dogfooding. Optimistic concurrent writes require atomic updates in the underlying object store, and as a result of our needs, R2 added a PutIfAbsent operation with strong consistency. Thanks, R2! The atomic operation sets Log Explorer apart from Delta Lake solutions based on Amazon Web Services’ S3, which incur the operational burden of using an external store for synchronizing writes.
Log Explorer is written in the Rust programming language using open-source libraries, such as delta-rs, a native Rust implementation of the Delta Lake protocol, and Apache Arrow DataFusion, a very fast, extensible query engine. At Cloudflare, Rust has emerged as a popular choice for new product development due to its safety and performance benefits.
What’s next
We know that application security logs are only part of the puzzle in understanding what’s going on in your environment. Stay tuned for future developments including tighter, more seamless integration between Analytics and Log Explorer, the addition of more datasets including Zero Trust logs, the ability to define custom retention periods, and integrated custom alerting.
Please use the feedback link to let us know how Log Explorer is working for you and what else would help make your job easier.
How to get it
We’d love to hear from you! Let us know if you are interested in joining our Beta program by completing this form and a member of our team will contact you.
Pricing will be finalized prior to a General Availability (GA) launch.
Tune in for more news, announcements and thought-provoking discussions! Don’t miss the full Security Week hub page.
Today, we are thrilled to announce new Cloudflare Zero Trust dashboards on Elastic. Shared customers using Elastic can now use these pre-built dashboards to store, search, and analyze their Zero Trust logs.
When organizations look to adopt a Zero Trust architecture, there are many components to get right. If products are configured incorrectly, used maliciously, or security is somehow breached during the process, it can open your organization to underlying security risks without the ability to get insight from your data quickly and efficiently.
As a Cloudflare technology partner, Elastic helps Cloudflare customers find what they need faster, while keeping applications running smoothly and protecting against cyber threats. “I’m pleased to share our collaboration with Cloudflare, making it even easier to deploy log and analytics dashboards. This partnership combines Elastic’s open approach with Cloudflare’s practical solutions, offering straightforward tools for enterprise search, observability, and security deployment,” explained Mark Dodds, Chief Revenue Officer at Elastic.
Value of Zero Trust logs in Elastic
With this joint solution, we’ve made it easy for customers to seamlessly forward their Zero Trust logs to Elastic via Logpush jobs. This can be achieved directly via a Restful API or through an intermediary storage solution like AWS S3 or Google Cloud. Additionally, Cloudflare’s integration with Elastic has undergone improvements to encompass all categories of Zero Trust logs generated by Cloudflare.
Here are detailed some highlights of what the integration offers:
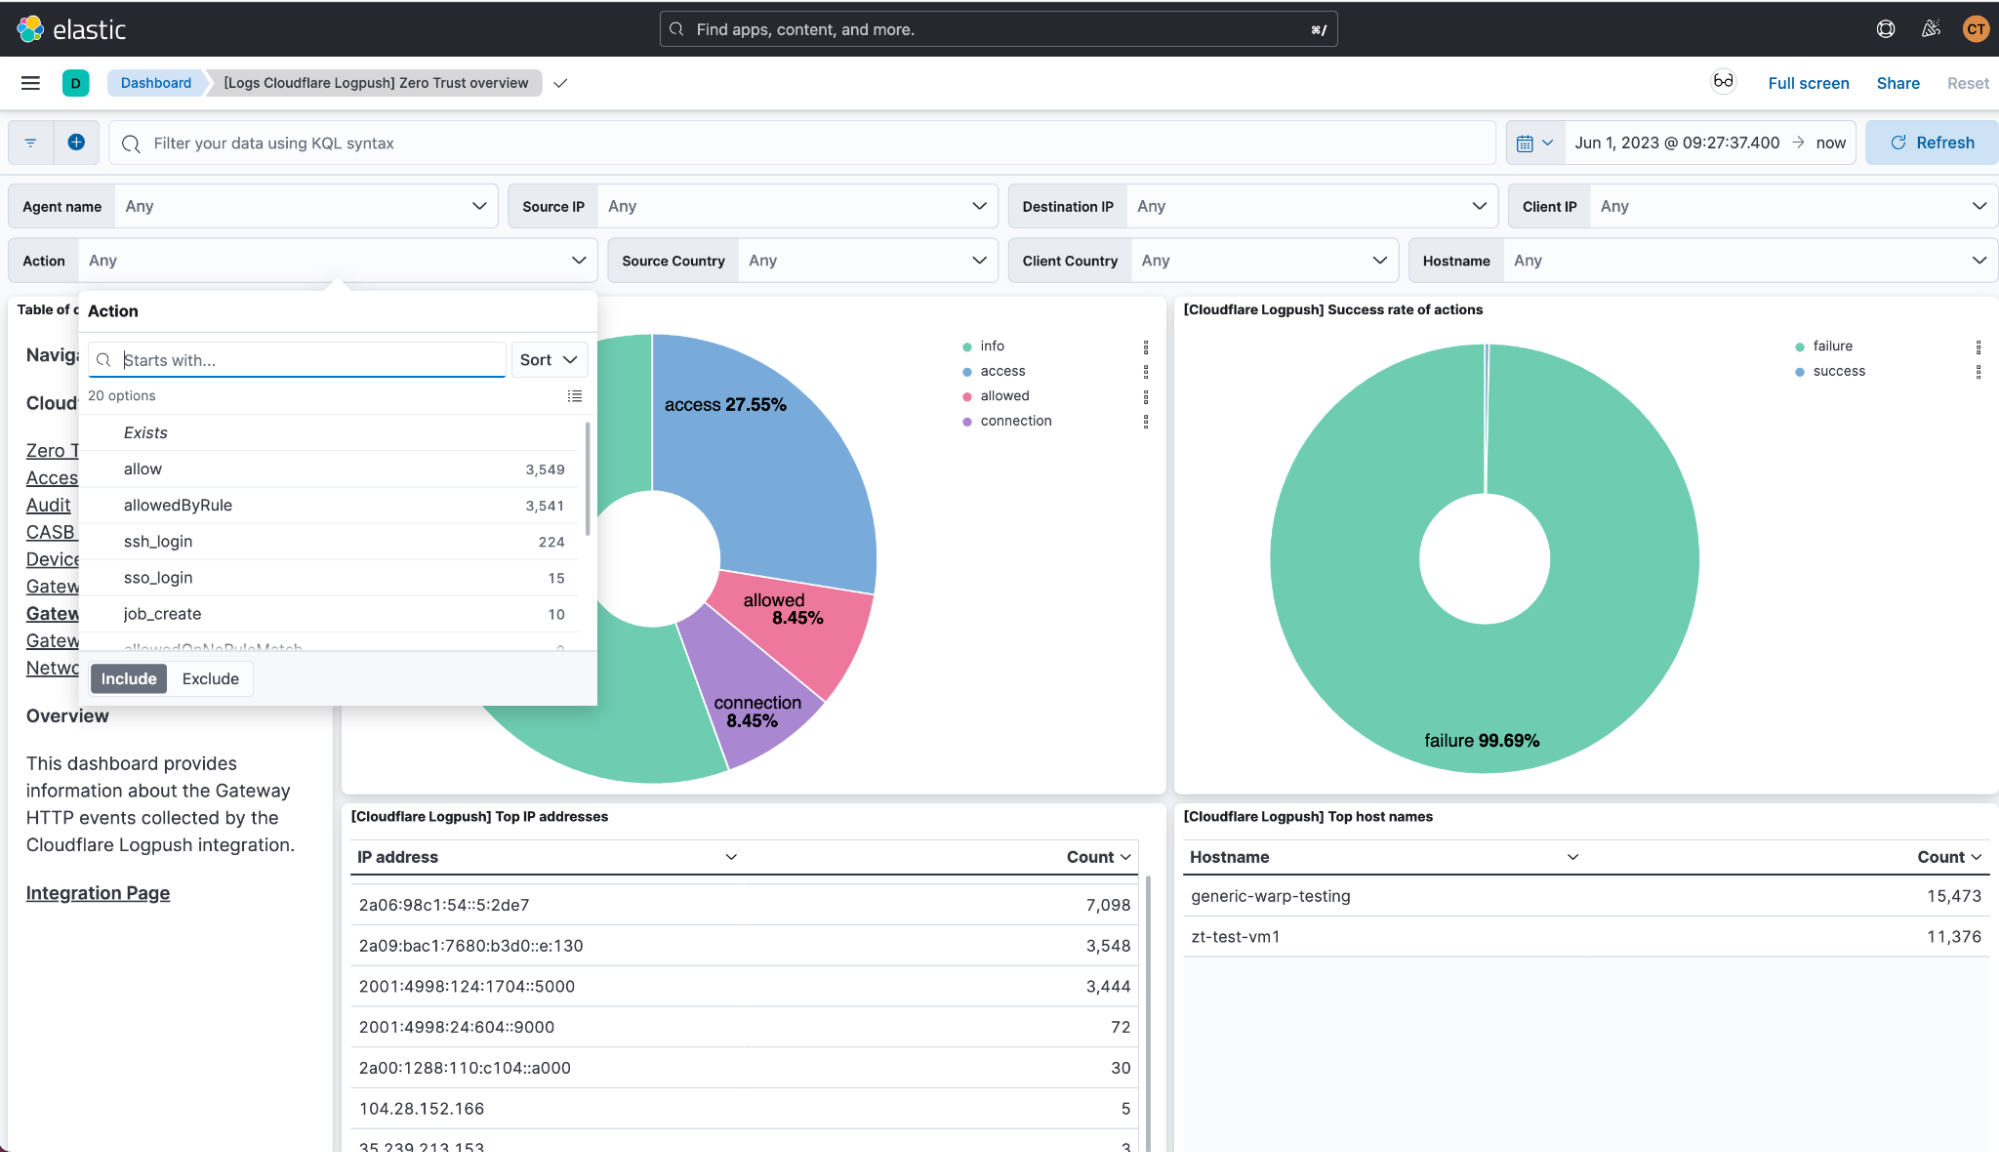
Comprehensive Visibility: Integrating Cloudflare Logpush into Elastic provides organizations with a real-time, comprehensive view of events related to Zero Trust. This enables a detailed understanding of who is accessing resources and applications, from where, and at what times. Enhanced visibility helps detect anomalous behavior and potential security threats more effectively, allowing for early response and mitigation.
Field Normalization: By unifying data from Zero Trust logs in Elastic, it’s possible to apply consistent field normalization not only for Zero Trust logs but also for other sources. This simplifies the process of search and analysis, as data is presented in a uniform format. Normalization also facilitates the creation of alerts and the identification of patterns of malicious or unusual activity.
Efficient Search and Analysis: Elastic provides powerful data search and analysis capabilities. Having Zero Trust logs in Elastic enables quick and precise searching for specific information. This is crucial for investigating security incidents, understanding workflows, and making informed decisions.
Correlation and Threat Detection: By combining Zero Trust data with other security events and data, Elastic enables deeper and more effective correlation. This is essential for detecting threats that might go unnoticed when analyzing each data source separately. Correlation aids in pattern identification and the detection of sophisticated attacks.
Prebuilt Dashboards: The integration provides out-of-the-box dashboards offering a quick start to visualizing key metrics and patterns. These dashboards help security teams visualize the security landscape in a clear and concise manner. The integration not only provides the advantage of prebuilt dashboards designed for Zero Trust datasets but also empowers users to curate their own visualizations.
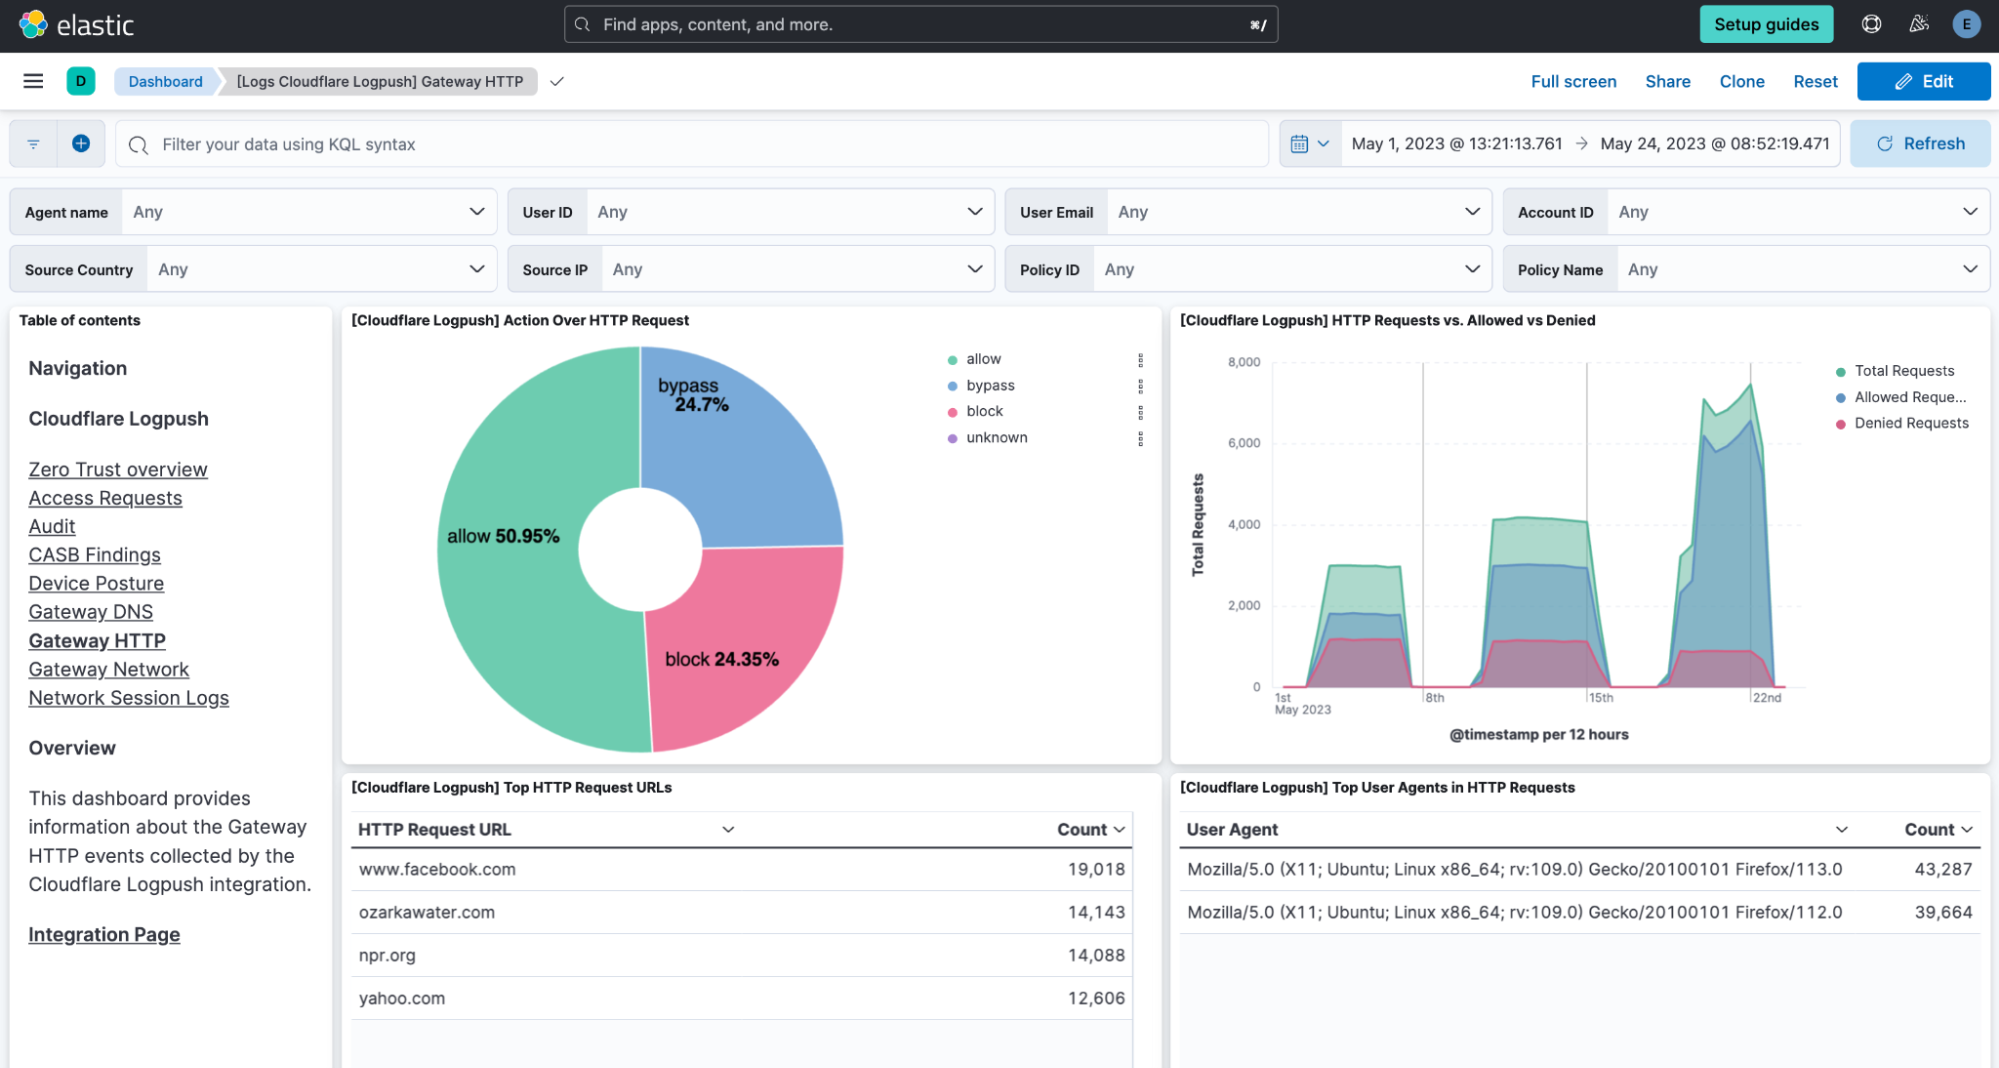
What’s new on the dashboards
One of the main assets of the integration is the out-of-the-box dashboards tailored specifically for each type of Zero Trust log. Let’s explore some of these dashboards in more detail to find out how they can help us in terms of visibility.
Gateway HTTP
This dashboard focuses on HTTP traffic and allows for monitoring and analyzing HTTP requests passing through Cloudflare’s Secure Web Gateway.
Here, patterns of traffic can be identified, potential threats detected, and a better understanding gained of how resources are being used within the network.
Every visualization in the stage is interactive. Therefore, the whole dashboard adapts to enabled filters, and they can be pinned across dashboards for pivoting. For instance, if clicking on one of the sections of the donut showing the different actions, a filter is automatically applied on that value and the whole dashboard is oriented around it.
CASB
Following with a different perspective, the CASB (Cloud Access Security Broker) dashboard provides visibility over cloud applications used by users. Its visualizations are targeted to detect threats effectively, helping in the risk management and regulatory compliance.
These examples illustrate how dashboards in the integration between Cloudflare and Elastic offer practical and effective data visualization for Zero Trust. They enable us to make data-driven decisions, identify behavioral patterns, and proactively respond to threats. By providing relevant information in a visual and accessible manner, these dashboards strengthen security posture and allow for more efficient risk management in the Zero Trust environment.
How to get started
Setup and deployment is simple. Use the Cloudflare dashboard or API to create Logpush jobs with all fields enabled for each dataset you’d like to ingest on Elastic. There are eight account-scoped datasets available to use today (Access Requests, Audit logs, CASB findings, Gateway logs including DNS, Network, HTTP; Zero Trust Session Logs) that can be ingested into Elastic.
Setup Logpush jobs to your Elastic destination via one of the following methods:
HTTP Endpoint mode – Cloudflare pushes logs directly to an HTTP endpoint hosted by your Elastic Agent.
AWS S3 polling mode – Cloudflare writes data to S3 and Elastic Agent polls the S3 bucket by listing its contents and reading new files.
AWS S3 SQS mode – Cloudflare writes data to S3, S3 pushes a new object notification to SQS, Elastic Agent receives the notification from SQS, and then reads the S3 object. Multiple Agents can be used in this mode.
Enabling the integration in Elastic
In Kibana, go to Management > Integrations
In the integrations search bar type Cloudflare Logpush.
Click the Cloudflare Logpush integration from the search results.
Click the Add Cloudflare Logpush button to add Cloudflare Logpush integration.
Enable the Integration with the HTTP Endpoint, AWS S3 input or GCS input.
Under the AWS S3 input, there are two types of inputs: using AWS S3 Bucket or using SQS.
Configure Cloudflare to send logs to the Elastic Agent.
What’s next
As organizations increasingly adopt a Zero Trust architecture, understanding your organization’s security posture is paramount. The dashboards help with necessary tools to build a robust security strategy, centered around visibility, early detection, and effective threat response. By unifying data, normalizing fields, facilitating search, and enabling the creation of custom dashboards, this integration becomes a valuable asset for any cybersecurity team aiming to strengthen their security posture.
We’re looking forward to continuing to connect Cloudflare customers with our community of technology partners, to help in the adoption of a Zero Trust architecture.
By George Schneider, Information Security Manager at Listrak
I’ve worked in cybersecurity for over two decades, so I’ve seen plenty of platforms come and go—some even crash and burn. But Rapid7, specifically InsightIDR, has consistently performed above expectations. In fact, InsightIDR has become an essential resource for maintaining my company’s cybersecurity posture.
Alerting Rules!
Back in the early days, a SIEM didn’t come with a bunch of standardized alerting rules. We had to write all of our own rules to actually find what we were looking for. Today, instead of spending six hours a day hunting for threats, InsightIDR does a lot of the work for the practitioner. Now, we spend a maximum of one hour a day responding to alerts.
In addition to saving time, the out-of-the-box rules are very effective; they find things that our other security products can’t detect. This is a key reason I’ve been 100% happy with Rapid7. As a user, I just know it’s functional. It’s clear that InsightIDR is designed by and for users—there’s no fluff, and the kinks are already ironed out. Not only am I saving time and company resources, the solution is a joy to use.
Source Coverage
When scouting SIEM options, we wanted a platform that could ingest a lot of different log sources. Rapid7 covered all of the elements we use in the big platforms and various security appliances we have—and some in the cloud too. InsightIDR can ingest logs from all sources and correlate them (a key to any high-functioning SIEM) on day one.
Trust the Process
I can honestly say this is the first time I’ve ever used a product that adds new features and functionality every single quarter. It’s not just a new pretty interface either, Rapid7 consistently adds capabilities that move the product forward.
What’s also wonderful is that Rapid7 listens to customers, especially their feedback. Not to toot my own horn, but they’ve even released a handful of feature requests that I submitted over the years. So I can say with absolute sincerity that these improvements actually benefit SOC teams. They make us better at detecting the stuff that we’re most concerned about.
Visibility and Coverage, Thanks, Insight Agent!
If you’re not familiar with Insight Agent, it’s time to get acquainted. Insight Agent is critical for running forensics on a machine. If I have a machine that gets flagged for something through an automated alert, I can quickly jump in without delay because of the Insight Agent. I get lots of worthwhile information that helps me consistently finish investigations in a timely manner. I know in pretty short order whether an alert is nefarious or just a false positive.
And this is all built into the Rapid7 platform—it doesn’t require customization or installations to get up and running. You truly have a single pane of glass to do all of this, and it’s somehow super intuitive as well. Using the endpoint agent, I don’t have to switch over to something else to do additional work. It’s all right there.
“Customer support at Rapid7 is outstanding. It’s the gold standard that I now use to evaluate all other customer support.”
Thinking Outside the Pane
I also have to give a shout out to the Rapid7 community. The community at discuss.rapid7.com/ and the support I get from our Rapid7 account team cannot be overlooked. When I have a question about how to use something, my first step is to visit Discuss to see if somebody else has already posted some information about it—often saving me valuable time. If that doesn’t answer my question, the customer support at Rapid7 is outstanding. It’s the gold standard that I now use to evaluate all other customer support.
The Bottom Line
My bottom line? I love this product (and the people). To say it’s useful is an understatement. I would never recommend a product that I didn’t think was outstanding. I firmly believe in the Rapid7InsightIDR and experience how useful it is every day. So does my team.
To learn more about InsightIDR, our industry-leading cloud-native SIEM solution, watch this on-demand demo.
As we continue to empower security teams with the freedom to focus on what matters most, Q4 focused on investments and releases that contributed to that vision. With InsightIDR, Rapid7’s cloud-native SIEM and XDR solution, teams have the scale, comprehensive contextual coverage, and expertly vetted detections they need to thwart threats early in the attack chain.
This 2022 Q4 recap post offers a closer look at the recent investments and releases we’ve made over the past quarter. Here are some of the highlights:
Easy to create and manage log search, dashboards, and reports
You spoke, we listened! Per our customers, you can now create tables with multiple columns, allowing teams to see all data in one view. For example, simply add a query with a “where” clause and select a table display followed by the columns you want displayed.
Additionally, teams can reduce groupby search results with the having() clause. Customers can filter out what data is returned from groupby results with the option to layer in existing analytics function support (e.g. count, unique, max).
Accelerated time to value
The InsightIDR Onboarding Progress Tracker, available for customers during their 90 day onboarding period, is a self-serve, centralized check-list of onboarding tasks with step-by-step guidance, completion statuses, and context on the “what” and “why” of each task.
No longer onboarding? No problem! We made the progress tracker available beyond the 90-day onboarding period so customers can evaluate setup progress and ensure InsightIDR is operating at full capacity to effectively detect, investigate, and respond to threats.
Visibility across your modern environment
For those that leverage Palo Alto Cortex, you can now configure Palo Alto Cortex Data Lake to send activity to InsightIDR including syslog-encrypted Web Proxy, Firewall, Ingress Authentication, etc. Similarly, for customers leveraging Zscaler, you can now configure Zscaler Log Streaming Service (LSS) to receive and parse user activity and audit logs from Zscaler Private Access through the LSS.
For teams who do not have the bandwidth to set up and manage multiple event sources pertaining to Cisco Meraki, we have added support to ingest Cisco Meraki events through the Cisco Meraki API. This will enable you to deploy and add new event sources with less management.
Customers can now bring data from their Government Community Cloud (GCC) and GCC High environments when setting up the Office365 event source to ensure security standards are met when processing US Government data.
Stay tuned!
We’re always working on new product enhancements and functionality to ensure your team can stay ahead of potential threats and malicious activity. Keep an eye on the Rapid7 blog and the InsightIDR release notes to keep up to date with the latest detection and response releases at Rapid7.
As Amazon Web Services (AWS) Security Solutions Architects, we get to talk to customers of all sizes and industries about how they want to improve their security posture and get visibility into their AWS resources. This blog post identifies the top three most commonly used Security Hub usage patterns and describes how you can use these to improve your strategy for identifying and managing findings.
Customers have told us they want to provide security and compliance visibility to the application owners in an AWS account or to the teams that use the account; others want a single-pane-of-glass view for their security teams; and other customers want to centralize everything into a security information and event management (SIEM) system, most often due to being in a hybrid scenario.
Security Hub findings are normalized into the AWS Security Findings Format (ASFF) so that users can review them in a standardized format. This reduces the need for time-consuming data conversion efforts and allows for flexible and consistent filtering of findings based on the attributes provided in the finding, as well as the use of customizable responsive actions. Partners who have integrations with Security Hub also send their findings to AWS using the ASFF to allow for consistent attribute definition and enforced criticality ratings, meaning that findings in Security Hub have a measurable rating. This helps to simplify the complexity of managing multiple findings from different providers.
Overview of the usage patterns
In this section, we outline the objectives for each usage pattern, list the typical stakeholders we have seen these patterns support, and discuss the value of deploying each one.
Usage pattern 1: Dashboard for application owners
Use Security Hub to provide visibility to application workload owners regarding the security and compliance posture of their AWS resources.
The application owner is often responsible for the security and compliance posture of the resources they have deployed in AWS. In our experience however, it is common for large enterprises to have a separate team responsible for defining security-related privileges and to not grant application owners the ability to modify configuration settings on the AWS account that is designated as the centralized Security Hub administration account. We’ll walk through how you can enable read-only access for application owners to use Security Hub to see the overall security posture of their AWS resources.
Stakeholders: Developers and cloud teams that are responsible for the security posture of their AWS resources. These individuals are often required to resolve security events and non-compliance findings that are captured with Security Hub.
Value adds for customers: Some organizations we have worked with put the onus on workload owners to own their security findings, because they have a better understanding of the nuances of the engineering, the business needs, and the overall risk that the security findings represent. This usage pattern gives the applications owners clear visibility into the security and compliance status of their workloads in the AWS accounts so that they can define appropriate mitigation actions with consideration to their business needs and risk.
Usage pattern 2: A single pane of glass for security professionals
Use Security Hub as a single pane of glass to view, triage, and take action on AWS security and compliance findings across accounts and AWS Regions.
Security Hub generates findings by running continuous, automated security checks based on supported industry standards. Additionally, Security Hub integrates with other AWS services to collect and correlate findings and uses over 60 partner integrations to simplify and prioritize findings. With these features, security professionals can use Security Hub to manage findings across their AWS landscape.
Stakeholders: Security operations, incident responders, and threat hunters who are responsible for monitoring compliance, as well as security events.
Value adds for customers: This pattern benefits customers who don’t have a SIEM but who are looking for a centralized model of security operations. By using Security Hub and aggregating findings across Regions into a single Security Hub dashboard, they get oversight of their AWS resources without the cost and complexity of managing a SIEM.
Usage pattern 3: Centralized routing to a SIEM solution
Use AWS Security Hub as a single aggregation point for security and compliance findings across AWS accounts and Regions, and route those findings in a normalized format to a centralized SIEM or log management tool.
Customers who have an existing SIEM capability and complex environments typically deploy this usage pattern. By using Security Hub, these customers gather security and compliance-related findings across the workloads in all their accounts, ingest those into their SIEM, and investigate findings or take response and remediation actions directly within their SIEM console. This mechanism also enables customers to define use cases for threat detection and analysis in a single environment, providing a holistic view of their risk.
Stakeholders: Security operations teams, incident responders, and threat hunters. This pattern supports a centralized model of security operations, where the responsibilities for monitoring and identifying both non-compliance with defined practice, as well as security events, fall within single teams within the organization.
Value adds for customers: When Security Hub aggregates the findings from workloads across accounts and Regions in a single place, those finding are normalized by using the ASFF. This means that findings are already normalized under a single format when they are sent to the SIEM. This enables faster analytics, use case definition, and dashboarding because analysts don’t have to create multi-tiered use cases for different finding structures across vendors and services.
The ASFF also enables streamlined response through security orchestration, automation, response (SOAR) tools or AWS native orchestration tools such as AWS EventBridge. With the ASFF, you can effortlessly parse and filter events based on an attribute and customize automation.
Overall, this usage pattern helps to improve the typical key performance indicators (KPIs) the SecOps function is measured against, such as Mean Time to Detect (MTTD) or Mean Time to Respond (MTTR) in the AWS environment.
Setting up each usage pattern
In this section, we’ll go over the steps for setting up each usage pattern
Usage pattern 1: Dashboard for application owners
Use the following steps to set up a Security Hub dashboard for an account owner, where the owner can view and take action on security findings.
Assign the AWS managed permission policy AWSSecurityHubReadOnlyAccess to the principal who will be assuming the role. Figure 1 shows an image of the permission statement.
Figure 1: Assign permissions
(Optional) Create custom insights in Security Hub. Using custom insights can provide a view of areas of interest for an application owner; however, creating a new insights view is not allowed unless the following additional set of permissions are granted to the application owner role or user.
Pattern 1 walkthrough: View the application owner’s security findings
After the read-only IAM policy has been created and applied, the application owner can access Security Hub to view the dashboard, which provides the application owner with a view of the overall security posture of their AWS resources. In this section, we’ll walk through the steps that the application owner can take to quickly view and assess the compliance and security of their AWS resources.
To view the application owner’s dashboard in Security Hub
Sign into the AWS Management Console and navigate to the AWS Security Hub service page. You will be presented with a summary of the findings. Then, depending on the security standards that are enabled, you will be presented with a view similar to the one shown in Figure 2.
Figure 2: Summary of aggregated Security Hub standard score
Security Hub generates its own findings by running automated and continuous checks against the rules in a set of supported security standards. On the Summary page, the Security standards card displays the security scores for each enabled standard. It also displays a consolidated security score that represents the proportion of passed controls to enabled controls across the enabled standards.
Choose the hyperlink of a security standard to get an additional summarized view, as shown in Figure 3.
Figure 3: Security Hubs standards summarized view
As you choose the hyperlinks for the specific findings, you will get additional details, along with recommended remediation instructions to take.
Figure 4: Example of finding details view
In the left menu of the Security Hub console, choose Findings to see the findings ranked according to severity. Choose the link text of the finding title to drill into the details and view additional information on possible remediation actions.
Figure 5: Findings example
In the left menu of the Security Hub console, choose Insights. You will be presented with a collection of related findings. Security Hub provides several managed insights to get you started with assessing your security posture. As shown in Figure 6, you can quickly see if your Amazon Simple Storage Service (Amazon S3) buckets have public write or read permissions. This is just one example of managed insights that help you quickly identify risks.
Figure 6: Insights view
You can create custom insights to track issues and resources that are specific to your environment. Note that creating custom insights requires IAM permissions, as described earlier in the Prerequisites for Pattern 1 section. Use the following steps to create a custom insight for compliance status.
To create a custom insight, use the Group By filter and select how you want your insights to be grouped together:
In the left menu of the Security Hub console, choose Insights, and then choose Create insight in the upper right corner.
By default, there will be filters included in the filter bar. Put the cursor in the filter bar, choose Group By, choose Compliance Status, and then choose Apply.
Figure 7: Creating a custom insight
For Insight name, enter a relevant name for your insight, and then choose Create insight. Your custom insight will be created.
In this scenario, you learned how application owners can quickly assess the resources in an AWS account and get details about security risks and recommended remediation steps. For a more hands-on walkthrough that covers how to use Security Hub, consider spending 2–3 hours going through this AWS Security Hub workshop.
Usage pattern 2: A single pane of glass for security professionals
To use Security Hub as a centralized source of security insight, we recommend that you choose to accept security data from the available integrated AWS services and third-party products that generate findings. Check the lists of available integrations often, because AWS continues to release new services that integrate with Security Hub. Figure 8 shows the Integrations page in Security Hub, where you can find information on how to accept findings from the many integrations that are available.
Figure 8: Security Hub integrations page
Solution architecture and workflow for pattern 2
As Figure 9 shows, you can visualize Security Hub as the centralized security dashboard. Here, Security Hub can act as both the consumer and issuer of findings. Additionally, if you have security findings you want sent to Security Hub that aren’t provided by a AWS Partner or AWS service, you can create a custom provider to provide the central visibility you need.
Figure 9: Security Hub findings flow
Because Security Hub is integrated with many AWS services and partner solutions, customers get improved security visibility across their AWS landscape. With the integration of Amazon Detective, it’s convenient for security analysts to use Security Hub as the centralized incident triage starting point. Amazon Detective is a security incident response service that can be used to analyze, investigate, and quickly identify the root cause of potential security issues or suspicious activities by collecting log data from AWS resources. To learn how to get started with Amazon Detective, we recommend watching this video.
Programmatically remediate high-volume workflows
Security teams increasingly rely on monitoring and automation to scale and keep up with the demands of their business. Using Security Hub, customers can configure automatic responses to findings based upon preconfigured rules. Security Hub gives you the option to create your own automated response and remediation solution or use the AWS provided solution, Security Hub Automated Response and Remediation (SHARR). SHARR is an extensible solution that provides predefined response and remediation actions (playbooks) based on industry compliance standards and best practices for security threats. For step-by-step instructions for setting up SHARR, refer to this blog post.
Routing to alerting and ticketing systems
For incidents you cannot or do not want to automatically remediate, either because the incident happened in an account with a production workload or some change control process must be followed, routing to an incident management environment may be necessary. The primary goal of incident response is reducing the time to resolution for critical incidents. Customers who use alerting or incident management systems can integrate Security Hub to streamline the time it takes to resolve incidents. ServiceNow ITSM, Slack and PagerDuty are examples of products that integrate with Security Hub. This allows for workflow processing, escalations, and notifications as required.
Additionally, Incident Manager, a capability of AWS Systems Manager, also provides response plans, an escalation path, runbook automation, and active collaboration to recover from incidents. By using runbooks, customers can set up and run automation to recover from incidents. This blog post walks through setting up runbooks.
Usage pattern 3: Centralized routing to a SIEM solution
Here, we will describe how to use Splunk as an AWS Partner SIEM solution. However, note that there are many other SIEM partners available in the marketplace; the instructions to route findings to those partners’ platforms will be available in their documentation.
Solution architecture and workflow for pattern 3
Figure 10: Security Hub findings ingestion to Splunk
Figure 10 shows the use of a Security Hub delegated administrator that aggregates findings across multiple accounts and Regions, as well as other AWS services such as GuardDuty, Amazon Macie, and Inspector. These findings are then sent to Splunk through a combination of Amazon EventBridge, AWS Lambda, and Amazon Kinesis Data Firehose.
Prerequisites for pattern 3
This solution has the following prerequisites:
Enable Security Hub in your accounts, with one account defined as the delegated admin for other accounts within AWS Organizations, and enable cross-Region aggregation.
Generate and deploy a CloudFormation template from Splunk’s automation, provided by Project Trumpet.
Enable cross-Region replication. This action can only be performed from within the delegated administrator account, or from within a standalone account that is not controlled by a delegated administrator. The aggregation Region must be a Region that is enabled by default.
Pattern 3 walkthrough: Set up centralized routing to a SIEM
To get started, first designate a Security Hub delegated administrator and configure cross-Region replication. Then you can configure integration with Splunk.
To designate a delegated administrator and configure cross-Region replication
Perform these steps to configure cross-Region replication:
Sign in to the account to which you delegated Security Hub administration, and in the console, navigate to the Security Hub dashboard in your desired aggregation Region. You must have the correct permissions to access Security Hub and make this change.
Choose Settings, choose Regions, and then choose Configure finding aggregation.
Select the radio button that displays the Region you are currently in, and then choose Save.
You will then be presented with all available Regions in which you can aggregate findings. Select the Regions you want to be part of the aggregation. You also have the option to automatically link future Regions that Security Hub becomes enabled in.
Choose Save.
You have now enabled multi-Region aggregation. Navigate back to the dashboard, where findings will start to be replicated into a single view. The time it takes to replicate the findings from the Regions will vary. We recommend waiting 24 hours for the findings to be replicated into your aggregation Region.
To configure integration with Splunk
Note: These actions require that you have appropriate permissions to deploy a CloudFormation template.
Navigate to https://splunktrumpet.github.io/ and enter your HEC details: the endpoint URL and HEC token. Leave Automatically generate the required HTTP Event Collector tokens on your Splunk environment unselected.
Under AWS data source configuration, select only AWS CloudWatch Events, with the Security Hub findings – Imported filter applied.
Download the CloudFormation template to your local machine.
Sign in to the AWS Management Console in the account and Region where your Security Hub delegated administrator and Region aggregation are configured.
Navigate to the CloudFormation console and choose Create stack.
Choose Template is ready, and then choose Upload a template file. Upload the CloudFormation template you previously downloaded from the Splunk Trumpet page.
In the CloudFormation console, on the Specify Details page, enter a name for the stack. Keep all the default settings, and then choose Next.
Keep all the default settings for the stack options, and then choose Next to review.
On the review page, scroll to the bottom of the page. Select the check box under the Capabilities section, next to the acknowledgment that AWS CloudFormation might create IAM resources with custom names.
The CloudFormation template will take approximately 15–20 minutes to complete.
Test the solution for pattern 3
If you have GuardDuty enabled in your account, you can generate sample findings. Security Hub will ingest these findings and invoke the EventBridge rule to push them into Splunk. Alternatively, you can wait for findings to be generated from the periodic checks that are performed by Security Hub. Figure 11 shows an example of findings displayed in the Security Hub dashboard in Splunk.
Figure 11: Example of the Security Hub dashboard in Splunk
Conclusion
AWS Security Hub provides multiple ways you can use to quickly assess and prioritize your security alerts and security posture. In this post, you learned about three different usage patterns that we have seen our customers implement to take advantage of the benefits and integrations offered by Security Hub. Note that these usage patterns are not mutually exclusive, but can be used together as needed.
To extend these solutions further, you can enrich Security Hub metadata with additional context by using tags, as described in this post. Configure Security Hub to ingest findings from a variety of AWS Partners to provide additional visibility and context to the overall status of your security posture. To start your 30-day free trial of Security Hub, visit AWS Security Hub.
If you have feedback about this blog post, submit comments in the Comments section below. If you have questions about this blog post, please start a new thread on the Security Hub forum or contact AWS Support.
Want more AWS Security news? Follow us on Twitter.
In this episode, we discuss the best use of market research reports, like Magic Quadrants and Waves. If you’re in the market for a new cybersecurity solution, do you just pick a Leader and call it a day?
“Consult the MQ only after you’ve identified two vendors that would be a perfect security solution for you,” say our hosts Jeffrey Gardner, Detection and Response Practice Advisor and Stephen Davis, Lead D&R Sales Technical Advisor. When you have two that meet or exceed the requirements? “I’ll be honest, I might not care about the MQ placement,” says Davis.
Do not under any circumstances leave before the jazz hands bit: they do gather themselves and talk about how outcomes have to run the show, first and always.
Check back with us in November for our next installment of The Lost Bots!
As the attack surface sprawls, under-resourced security teams have inherent disadvantages. Rapid7 InsightIDR enables resource constrained security teams to achieve sophisticated detection and response, with greater efficiency and efficacy. As a Challenger in the 2022 Gartner Magic Quadrant for SIEM, we’re proud to represent the huge number of security teams out there today that don’t have time to do it all, but are asked to do it anyway. Our goal is to keep your organization safe by finding and eliminating threats faster and more reliably.
Rapid7 maximizes your most precious resource: time
We are grateful to have a diverse collective of customers and partners around the world, of varying size and industry focus. These smart, agile, maturing teams want to advance their detection and response programs, but their organizations and the threats they face are moving faster than their capacity is growing. The constant that unites all of these teams: they never have enough time. Yet, we feel that despite a well-documented, industry-crushing skills gap, far too many traditional SIEMs and detection products continue to introduce additional noise and complexity for these teams. The result is long days, weekend work, far too many missed dinners / concerts / games, and (scariest of all) missed threats.
The best way to achieve successful detection and response is through a pragmatic and efficient approach. Threats are still a threat—whether or not you’ve had time to set up your complex traditional SIEM or the myriad of point detection solutions around it. Attackers don’t care if you’re ready. In fact, they’re counting on you not to be. Security teams need time and access to expertise to close this gap.
From inception, the guiding principle of InsightIDR has been to deliver sophisticated detection and response, in a more efficient and effective way, and here’s how:
A cloud-native foundation, SaaS delivery, and software-based collectors means it is faster to deploy, removes hardware burdens that bog teams down, and accelerates the time to actually get insights.
Intuitive interfaces, pre-built dashboards and reports, and a robust detections library means that teams are able to activate even the most junior analysts to deliver advanced analysis and threat detections right away.
And highly correlated investigation timelines, response recommendations (vetted by Rapid7’s MDR team), and pre-built automation workflows help you with one of the hardest parts of your job: responding to threats before significant damage occurs.
In short, we offer a SIEM that maturing teams can get real value from. Over the last seven years, we’ve struck a balance of adding a multitude of capabilities while never compromising our core tenet and commitment to providing you with productivity efficiency and delivering a better detection and response experience.
Leveraging a diverse mix of threat intelligence—including unique intel from Rapid7’s renowned open-source projects—the Rapid7 Threat Intelligence and Detections Engineering (TIDE) team curates emergent threat content from all corners of the threat landscape. Our TIDE team is constantly manicuring a library of both known and unknown threats to capture even the most evasive attacks. With this always-up-to-date library and native UEBA, EDR, NDR, deception technology, and cloud TDIR, InsightIDR customers can be confident that the entirety of their attack surface is covered. And because our global MDR team is leveraging the same threat library, you can be certain that alerts will be low noise, highly reliable, and primed for analysts to take action.
We believe that as the threat and attack landscape change at a rapid pace, the approaches to unifying data, detecting, and responding need to too. Reducing the noise and accelerating response outcomes is critical for security success – regardless of your security maturity. We also believe that for this reason, Gartner has named us a Challenger in the Magic Quadrant for SIEM – and we will continue to challenge the traditional as we focus on building the right outcomes for our customers. Find a complimentary copy of the 2022 Gartner Magic Quadrant for SIEM here.
Just a few of those outcomes we are driving toward in the future:
More frictionless access to expertise to ensure analysts always know how to respond and can execute more quickly
Deepening our breadth of detections and endpoint coverage for modern, dynamic environments, so customers can continue to leverage InsightIDR as their single source of truth for detection and response
Making sure our MSSP partners and their customers are optimized to succeed by providing a more turnkey experience that enables these partners to tap into the scale and efficiency of InsightIDR
We are excited to share more on these initiatives soon. Thank you to our customers and partners for continuing to share your insights, ideas, pains, and future plans. You continue to fuel our innovation and validate that we are on the right track in addressing the needs of maturing security teams.
GARTNER and Magic Quadrant are registered trademarks and service marks, and PEER INSIGHTS is a trademark and service mark, of Gartner, Inc. and/or its affiliates in the U.S. and internationally and are used herein with permission. All rights reserved.
Gartner does not endorse any vendor, product or service depicted in its research publications, and does not advise technology users to select only those vendors with the highest ratings or other designation. Gartner research publications consist of the opinions of Gartner’s research organization and should not be construed as statements of fact. Gartner disclaims all warranties, expressed or implied, with respect to this research, including any warranties of merchantability or fitness for a particular purpose.
Gartner Peer Insights content consists of the opinions of individual end users based on their own experiences, and should not be construed as statements of fact, nor do they represent the views of Gartner or its affiliates. Gartner does not endorse any vendor, product or service depicted in this content nor makes any warranties, expressed or implied, with respect to this content, about its accuracy or completeness, including any warranties of merchantability or fitness for a particular purpose.
I deployed my SIEM in days, not months – here’s how you can too
As an IT administrator at a highly digitized manufacturing company, I spent many sleepless nights with no visibility into the activity and security of our environment before deploying a security information and event management (SIEM) solution. At the company I work for, Schlotterer Sonnenschutz Systeme GmbH, we have a lot of manufacturing machines that rely on internet access and external companies that remotely connect to our company’s environment – and I couldn’t see any of it happening. One of my biggest priorities was to source and implement state-of-the-art security solutions – beginning with a SIEM tool.
I asked colleagues and partners in the IT sector about their experience with deploying and leveraging SIEM technology. The majority of the feedback I received was that deploying a SIEM was a lengthy and difficult process. Then, once stood up, SIEMs were often missing information or difficult to pull actionable data from.
The feedback did not instill much confidence – particularly as this would be the first time I personally had deployed a SIEM. I was prepared for a long deployment road ahead, with the risk of shelfware looming over us. However, to my surprise, after identifying Rapid7’s InsightIDR as our chosen solution, the process was manageable and efficient, and we began receiving value just days after deployment. Rapid7 is clearly an outlier in this space: able to deliver an intuitive and accelerated onboarding experience while still driving actionable insights and sophisticated security results.
3 key steps for successful SIEM deployment
Based on my experience, our team identified three critical steps that must be taken in order to have a successful SIEM deployment:
Identifying core event sources and assets you intend to onboard before deployment
Collecting and correlating relevant and actionable security telemetry to form a holistic and accurate view of your environment while driving reliable early threat detection (not noise)
Putting data to work in your SIEM so you can begin visualizing and analyzing to validate the success of your deployment
1. Identify core event sources and assets to onboard
Before deploying a SIEM, gather as much information as possible about your environment so you can easily begin the deployment process. Rapid7 provided easy-to-understand help documentation all throughout our deployment process in order to set us up for success. The instructions were highly detailed and easy to understand, making the setup quick and painless. Additionally, they provide a wide selection of pre-built event sources out-of-the-box, simplifying my experience. Within hours, I had all the information I needed in front of me.
Based on Rapid7’s recommendations, we set up what is referred to as the six core event sources:
Creating these event sources will get the most information flowing through your SIEM and if your solution has user behavior entity analytics (UEBA) capabilities like InsightIDR. Getting all the data in quickly begins the baselining process so you can identify anomalies and potential user and insider threats down the road.
2. Collecting and correlating relevant and actionable security telemetry
When deployed and configured properly, a good SIEM will unify your security telemetry into a single cohesive picture. When done ineffectively, a SIEM can create an endless maze of noise and alerts. Striking a balance of ingesting the right security telemetry and threat intelligence to drive meaningful, actionable threat detections is critical to effective detection, investigation, and response. A great solution harmonizes otherwise disparate sources to give a cohesive view of the environment and malicious activity.
InsightIDR came with a native endpoint agent, network sensor, and a host of integrations to make this process much easier. To provide some context, at Schlotterer Sonnenschutz Systeme GmbH, we have a large number of mobile devices, laptops, surface devices, and other endpoints that exist outside the company. The combined Insight Network Sensor and Insight Agent monitor our environment beyond the physical borders of our IT for complete visibility across offices, remote employees, virtual devices, and more.
Personally, when it comes to installing any agent, I prefer to take a step-by-step approach to reduce any potential negative effects the agent might have on endpoints. With InsightIDR, I easily deployed the Insight Agent on my own computer; then, I pushed it to an additional group of computers. The Rapid7 Agent’s lightweight software deployment is easy on our infrastructure. It took me no time to deploy it confidently to all our endpoints.
With data effectively ingested, we prepared to turn our attention to threat detection. Traditional SIEMs we had explored left much of the detection content creation to us to configure and manage – significantly swelling the scope of deployment and day-to-day operations. However, Rapid7 comes with an expansive managed library of curated detections out of the box – eliminating the need for upfront customizing and configuring and giving us coverage immediately. The Rapid7 detections are vetted by their in-house MDR SOC, which means they don’t create too much noise, and I had to do little to no tuning so that they aligned with my environment.
3. Putting your data to work in your SIEM
For our resource-constrained team, ensuring that we had relevant dashboarding and reports to track critical systems, activity across our network, and support audits and regulatory requirements was always a big focus. From talking to my peers, we were weary of building dashboards that would require our team to take on complicated query writing to create sophisticated visuals and reports. The prebuilt dashboards included within InsightIDR were again a huge time-saver for our team and helped us mobilize around sophisticated security reporting out of the gate. For example, I am using InsightIDR’s Active Directory Admin Actions dashboard to identify:
What accounts were created in the past 24 hours?
What accounts were deleted in the past 24 hours?
What accounts changed their password?
Who was added as a domain administrator?
Because the dashboards are already built into the system, it takes me just a few minutes to see the information I need to see and export that data to an interactive HTML report I can provide to my stakeholders. When deploying your own SIEM, I recommend really digging into the visualization options, seeing what it will take to build your own cards, and exploring any available prebuilt content to understand how long it may take you to begin seeing actionable data.
I now have knowledge about my environment. I know what happens. I know for sure that if there is anything malicious or suspicious in my environment, Rapid7, the Insight Agent, or any of the sources we have integrated to InsightIDR will catch it, and I can take action right away.
As a unified SIEM and XDR solution, InsightIDR gives organizations the tools they need to drive an elevated and efficient compliance program.
Cybersecurity standards and compliance are mission-critical for every organization, regardless of size. Apart from the direct losses resulting from a data breach, non-compliant companies could face hefty fees, loss of business, and even jail time under growing regulations. However, managing and maintaining compliance, preparing for audits, and building necessary reports can be a full-time job, which might not be in the budget. For already-lean teams, compliance can also distract from more critical security priorities like monitoring threats, early threat detection, and accelerated response – exposing organizations to greater risk.
An efficient compliance strategy reduces risk, ensures that your team is always audit-ready, and – most importantly – drives focus on more critical security work. With InsightIDR, security practitioners can quickly meet their compliance and regulatory requirements while accelerating their overall detection and response program.
Here are three ways InsightIDR has been built to elevate and simplify your compliance processes.
1. Powerful log management capabilities for full environment visibility and compliance readiness
Complete environment visibility and security log collection are critical for compliance purposes, as well as for providing a foundation of effective monitoring and threat detection. Enterprises need to monitor user activity, behavior, and application access across their entire environment — from the cloud to on-premises services. The adoption of cloud services continues to increase, creating even more potential access points for teams to keep up with.
InsightIDR’s strong log management capabilities provide full visibility into these potential threats, as well as enable robust compliance reporting by:
Centralizing and aggregating all security-relevant events, making them available for use in monitoring, alerting, investigation, ad hoc searching
Providing the ability to search for data quickly, create data models and pivots, save searches and pivots as reports, configure alerts, and create dashboards
Retaining all log data for 13 months for all InsightIDR customers, enabling the correlation of data over time and meeting compliance mandates.
Automatically mapping data to compliance controls, allowing analysts to create comprehensive dashboards and reports with just a few clicks
To take it a step further, InsightIDR’s intuitive user interface streamlines searches while eliminating the need for IT administrators to master a search language. The out-of-the-box correlation searches can be invoked in real time or scheduled to run regularly at a specific time should the need arise for compliance audits and reporting, updated dashboards, and more.
2. Predefined compliance reports and dashboards to keep you organized and consistent
Pre-built compliance content in InsightIDR enables teams to create robust reports without investing countless hours manually building and correlating data to provide information on the organization’s compliance posture. With the pre-built reports and dashboards, you can:
Automatically map data to compliance controls
Save filters and searches, then duplicate them across dashboards
Create, share, and customize reports right from the dashboard
Make reports available in multiple formats like PDF or interactive HTML files
InsightIDR’s library of pre-built dashboards makes it easier than ever to visualize your data within the context of common frameworks. Entire dashboards created by our Rapid7 experts can be set up in just a few clicks. Our dashboards cover a variety of key compliance frameworks like PCI, ISO 27001, HIPAA, and more.
3. Unified and correlated data points to provide meaningful insights
With strong log management capabilities providing a foundation for your security posture, the ability to correlate the resulting data and look for unusual behavior, system anomalies, and other indicators of a security incident is key. This information is used not only for real-time event notification but also for compliance audits and reporting, performance dashboards, historical trend analysis, and post-hoc incident forensics.
Privileged users are often the targets of attacks, and when compromised, they typically do the most damage. That’s why it’s critical to extend monitoring to these users. In fact, because of the risk involved, privileged user monitoring is a common requirement for compliance reporting in many regulated industries.
InsightIDR provides a constantly curated library of detections that span user behavior analytics, endpoints, file integrity monitoring, network traffic analysis, and cloud threat detection and response – supported by our own native endpoint agent, network sensor, and collection software. User authentications, locational data, and asset activity are baselined to identify anomalous privilege escalations, lateral movement, and compromised credentials. Customers can also connect their existing Privileged Access Management tools (like CyberArk Vault or Varonis DatAdvantage) to get a more unified view of privileged user monitoring with a single interface.
Meet compliance standards while accelerating your detection and response
We know compliance is not the only thing a security operations center (SOC) has to worry about. InsightIDR can ensure that your most critical compliance requirements are met quickly and confidently. Once you have an efficient compliance process, the team will be able to focus their time and effort on staying ahead of emergent threats and remediating attacks quickly, reducing risk to the business.
Two key ways InsightIDR helps customers tailor reporting, detection, and response — without any headaches
For far too many years, security teams have accepted that with a SIEM comes compromise. You could have highly tailored and custom rule sets, but it meant endless amounts of tuning and configuration to create and manage them. You could have pre-built content, but that meant rigidity and noise. You could have all the dashboard bells and whistles, but that meant finding the unicorn that knew how to navigate them. Too many defenders have carried this slog, accepting this traditional SIEM reality as “it is what it is.” No more!
It’s possible to have it all — an intuitive interface and sophisticated tuning and customization
With InsightIDR, Rapid7’s leading SIEM and XDR, you can have the best of both worlds — an easy-to-use tool that’s also incredibly sophisticated. InsightIDR makes it easy and intuitive to tune your detections (without heavy script-writing or configuration required). When it comes to viewing your environment’s data and sharing key metrics, our Dashboard Library and reports are readily available and highly customizable for your unique needs.
Filter out the noise with fine-tuned alerts
Every time an analyst creates an alert it takes work. At Rapid7, we want to save you time and advance your security posture — which is where our Detections Library comes in. Curated and managed by our MDR SOC team, you can rest assured that you’ll only be alerted to behaviors that are worthy of human review so that you can make the most out of your limited time and focus on the threats that really matter.
While we focus on creating a curated, high-fidelity library of detections, we know each environment has its unique challenges — which is why our attacker behavior analytics (ABA) detections are robustly tuneable. You can also get more granular with your tuning and take the following actions:
Customize UBA directions so you’re in control of which you have turned on to align your alerting with your environment.
Modify ABA detections by changing the rule action, modifying its priority, and adding exceptions to the rule.
Stay on top of potential noise with Relative Activity, a new score for ABA detection rules that analyzes and identifies detection rules that might cause frequent investigations or notable events if switched on, as well as determines which rules may benefit from tuning, either by changing the Rule Action or adding exceptions.
Customize dashboards and reports to best suit your team
With InsightIDR, teams have access to over 45 (and counting) dashboards out of the box — from compliance dashboards for frameworks like HIPAA or ISO to Active Directory Admin Activity — to help your team focus on driving faster decision-making.
Analysts can also leverage this pre-built content as a springboard for customizing their own reports. InsightIDR provides multiple query modes and methods for creating data visualizations — so whether you are more comfortable with loose keyword search, working in our intuitive query language, or simply clicking on charts to narrow down results — every analyst can operate as an expert, regardless of their prior SIEM experience.
Easily edit dashboard card properties
InsightIDR also makes it easy to share findings and important metrics with anyone in your organization — send an interactive HTML or PDF report of any dashboard with the click of a button.
Create HTML reports in InsightIDR
Check out the other ways InsightIDR can help drive successful detection and response for your team here.
Welcome back to The Lost Bots! In the first installment of Season 2, Rapid7 Detection and Response (D&R) Practice Advisor Jeffrey Gardner and his new co-host Stephen Davis, Lead D&R Sales Technical Advisor, give us their five pillars of success for deploying a security information and event management (SIEM) solution. They tell us which pillars are their favorites and how security practitioners — including our hosts themselves — sometimes misstep in these areas.
Watch below for a rundown of how to successfully deploy a SIEM, all in a cool 10 minutes. (Fair warning: Your actual SIEM deployment might take slightly longer than it takes to watch this episode.)
Throughout Season 2, Jeffrey and Stephen will talk through some of the biggest topics and most pressing questions in D&R and cybersecurity, both one-on-one and with guests. We’ll be publishing new episodes on the last Thursday of every month. See you in July!
NEVER MISS A BLOG
Get the latest stories, expertise, and news about security today.
If you’re part of the huge growth in demand for cloud-based SIEM (Security Information and Event Management), claim your copy of the new Gartner® Report: “How to Deploy a SIEM Solution Successfully.”
Depending on what SIEM you choose, and how you approach the process, getting to operational and effective can take days, or months, or a lot longer.
Here are the Gartner report’s key findings:
“Ineffective security information and event management (SIEM) deployments occur when requirements and use cases are not aligned with the organization’s risks and risk tolerance.”
“Clients deploying SIEM solutions continue to take an unstructured approach when deciding which event and data sources to onboard, with the goal of getting every source in from the beginning. This leads to long and complex implementations, cost overruns, and higher probabilities of stalled or failed implementations.”
“SIEM buyers struggle to choose between on-premises, cloud, or hybrid deployments due to the complexities created by the various environments that need to be monitored, e.g., on-premises, SaaS, cloud infrastructure and platform services (CIPS), remote workers.”
SIEM centralizes and visualizes your security data to help you identify anomalies in your environment. But nearly all SIEMs require you to do a ton of customizing and configuration. Nearly all disappoint with their detections. And nearly all will exhaust you with false-positive alerts… every hour of every day… until analysts start ignoring alerts, which will surely doom you someday.
Now, here’s what we think
Rapid7 began building InsightIDR nearly a decade ago. While the threat landscape keeps changing, our mission never has: to empower you to find and extinguish evil earlier, faster, easier.
InsightIDR has never been a traditional SIEM. You should consider it if:
Fast deployment is a priority to you. InsightIDR leads the SIEM market in deployment times. With SaaS delivery and a native cloud foundation, customers can be deployed and operational in days and weeks – not months and years.
Time-to-value and tangible ROI matter to your leadership team. InsightIDR combines the best of next-gen SIEM with native extended detection and response (XDR). Get highly correlated UEBA, EDR, NDR, and Cloud detections alongside your critical security logs and policy monitoring, compliance dashboards, and reporting in a single pane of glass.
Your team is tired of false positives. InsightIDR’s expertly vetted detection library provides holistic threat coverage across your entire attack surface. An emphasis on high-fidelity, low-noise detections ensures that all alerts are relevant and ready for action.
You’re ready to accelerate your security posture. InsightIDR empowers teams to up-level their security and achieve sophisticated outcomes – without the complexity of traditional SIEMs. Embedded security orchestration and automation (SOAR) capabilities give you enviable security operations center (SOC) automation and enable even new analysts to respond like experts.
GARTNER is a registered trademark and service mark of Gartner, Inc. and/or its affiliates in the U.S. and internationally and is used herein with permission. All rights reserved.
Gartner, How to Deploy a SIEM Solution Successfully, Andrew Davies, Mitchell Schneider, Toby Bussa, Kelly Kavanagh, 7 July 2021
To provide the best experiences, we use technologies like cookies to store and/or access device information. Consenting to these technologies will allow us to process data such as browsing behavior or unique IDs on this site. Not consenting or withdrawing consent, may adversely affect certain features and functions.
Functional
Always active
The technical storage or access is strictly necessary for the legitimate purpose of enabling the use of a specific service explicitly requested by the subscriber or user, or for the sole purpose of carrying out the transmission of a communication over an electronic communications network.
Preferences
The technical storage or access is necessary for the legitimate purpose of storing preferences that are not requested by the subscriber or user.
Statistics
The technical storage or access that is used exclusively for statistical purposes.The technical storage or access that is used exclusively for anonymous statistical purposes. Without a subpoena, voluntary compliance on the part of your Internet Service Provider, or additional records from a third party, information stored or retrieved for this purpose alone cannot usually be used to identify you.
Marketing
The technical storage or access is required to create user profiles to send advertising, or to track the user on a website or across several websites for similar marketing purposes.