Post Syndicated from original https://www.backblaze.com/blog/backblaze-drive-stats-for-q3-2021/
As of September 30, 2021, Backblaze had 194,749 drives spread across four data centers on two continents. Of that number, there were 3,537 boot drives and 191,212 data drives. The boot drives consisted of 1,557 hard drives and 1,980 SSDs. This report will review the quarterly and lifetime failure rates for our data drives, as well as compare failure rates for our SSD and HDD boot drives. Along the way, we’ll share our observations and insights of the data presented and, as always, we look forward to your comments below.
Q3 2021 Hard Drive Failure Rates
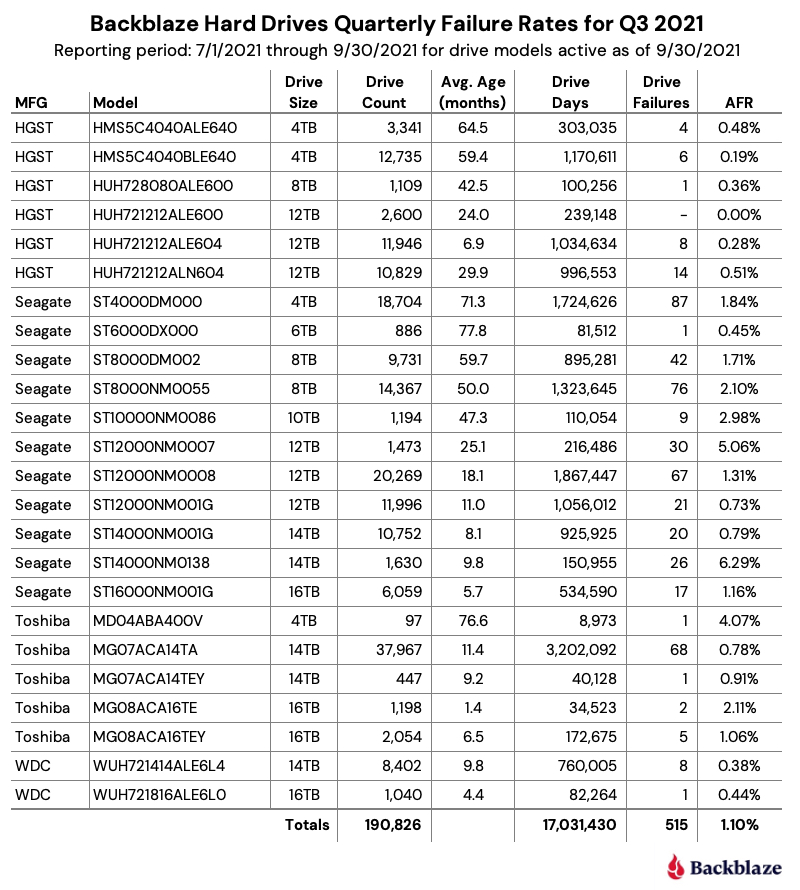
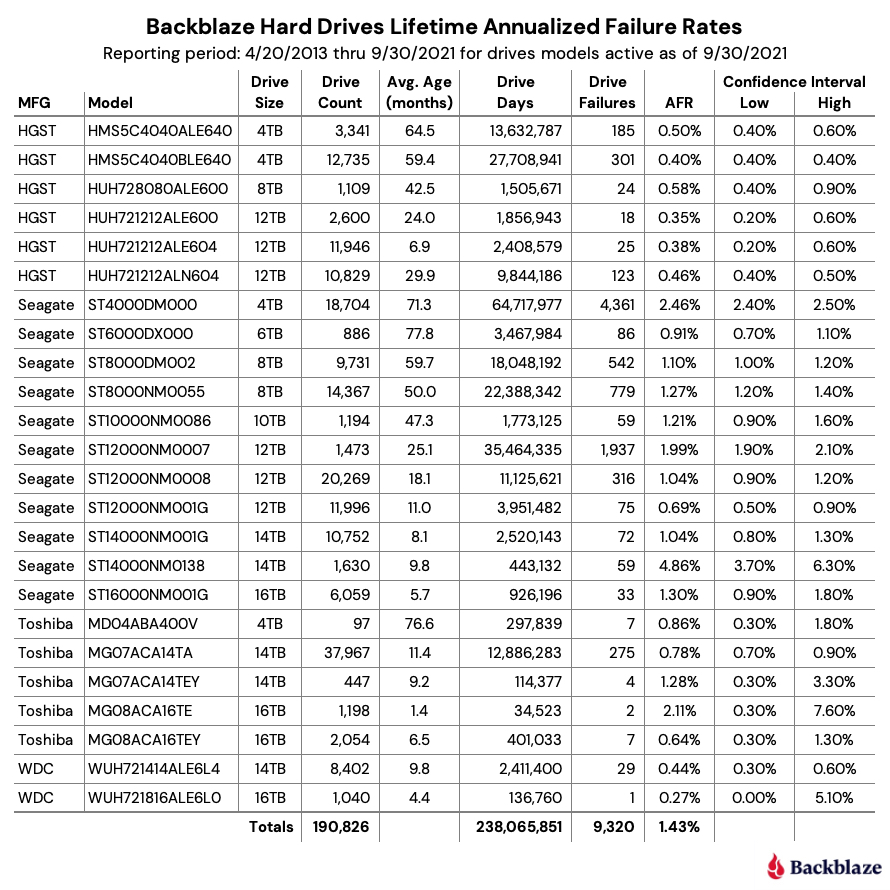
At the end of September 2021, Backblaze was monitoring 191,212 hard drives used to store data. For our evaluation, we removed from consideration 386 drives which were used for either testing purposes or were drive models for which we did not have at least 60 drives. This leaves us with 190,826 hard drives for the Q3 2021 quarterly report, as shown below.
Notes and Observations on the Q3 2021 Stats
The data for all of the drives in our data centers, including the 386 drives not included in the list above, is available for download on the Hard Drive Test Data webpage.
Zero Failures
The only drive model that recorded zero failures during Q2 was the HGST 12TB drive (model: HUH721212ALE600) which is used in our Dell storage servers in our Amsterdam data center.
Honorable Mentions
Five drive models recorded one drive failure during the quarter:
- HGST 12TB drive (model: HUH728080ALE600).
- Seagate 6TB drive (model: ST6000DX000).
- Toshiba 4TB drive (model: MD04ABA400V).
- Toshiba 14TB drive (model: MG07ACA14TEY).
- WDC 16TB drive (model: WUH721816ALE6L0).
While one failure is good, the number of drive days for each of these drives is 100,256 or less for the quarter. This leads to a wide confidence interval for the annualized failure rate (AFR) for these drives. Still, kudos to the Seagate 6TB drives (average age 77.8 months) and Toshiba 4TB drives (average age 75.6 months) as they have been good for a long time.
What’s New
We added a new Toshiba 16TB drive this quarter (model: MG08ACA16TE). There were a couple of early drive failures, but they’ve only been installed a little over a month. This drive is similar to model MG08ACA16TEY, with the difference purportedly being the latter having the Sanitize Instant Erase (SIE) feature, which shouldn’t be in play in our environment. It will be interesting to see how they compare over time.
Outliers
There are two drives in the quarterly results which require additional information beyond the raw numbers presented. Let’s start with the Seagate 12TB drive (model: ST12000NM0007). Back in January of 2020, we noted that these drives were not working optimally in our environment and higher failure rates were predicted. Together with Seagate, we decided to remove these drives from service over the coming months. Covid-19 delayed the project some and the results are the predicted higher failure rates. We expect all of the remaining drives to be removed during Q4.
The second outlier is the Seagate 14TB drive (model: ST14000NM0138). As noted in the Q2 Drive Stats report, these drives, while manufactured by Seagate, were provisioned in Dell storage servers. As noted, both Seagate and Dell were looking into the possible causes for the unexpected failure rate. The limited number of failures, 26 this quarter, have made failure analysis challenging. As we learn more, we will let you know.
HDDs versus SSDs
As a reminder, we use both SSDs and HDDs as boot drives in our storage servers. The workload for a boot drive includes regular reading, writing, and deleting of files (log files typically) along with booting the server when needed. In short, the workload for each type of drive is similar.
In our recent post, “Are SSDs Really More Reliable Than Hard Drives?” we compared the failure rates of our HDD and SSD boot drives using data through Q2 2021. In that post, we found that if we controlled for the average age and drive days for each cohort, we were able to compare failure rates over time.
We’ll continue that comparison, and we have updated the chart below through Q3 2021 to reflect the latest data.
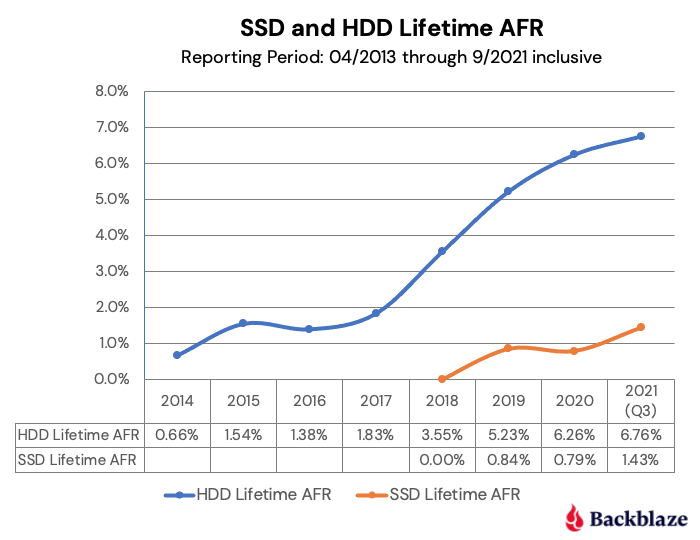
The first four points of each drive type create lines that are very similar, albeit the SSD failures rates are slightly lower. The HDD failure rates began to spike in year five (2018) as the HDD drive fleet started to age. Given what we know about drive failure over time, it is reasonable to assume that the failure rates of the SSDs will rise as they get older. The question to answer is: Will it be higher, lower, or the same? Stay tuned.
Data Storage Changes
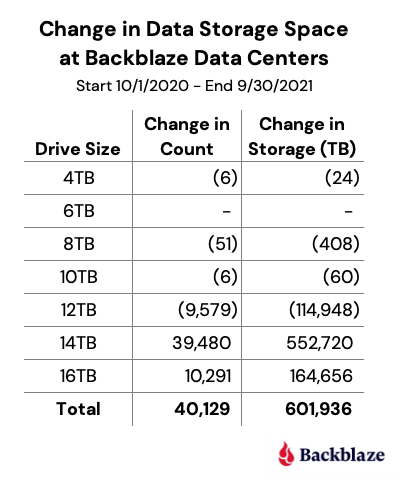
Over the last year, we’ve added 40,129 new hard drives. Actually, we installed 67,990 new drives and removed 27,861 old drives. The removed drives included failed drives (1,674) and migrations (26,187). That works out to installing about 187 drives a day, which over the course of the last year, totaled just over 600PB of new data storage.
The following chart breaks down the efforts of our intrepid data center teams.
Lifetime Hard Drive Stats
The chart below shows the lifetime AFRs of all the hard drive models in production as of September 30, 2021.
Notes and Observations on the Lifetime Stats
The lifetime AFR for all of the drives in our farm continues to decrease. The 1.43% AFR is the lowest recorded value since we started back in 2013. The drive population spans drive models from 4TB to 16TB and varies in average age from one month (Toshiba 16TB) to over six years (Seagate 6TB).
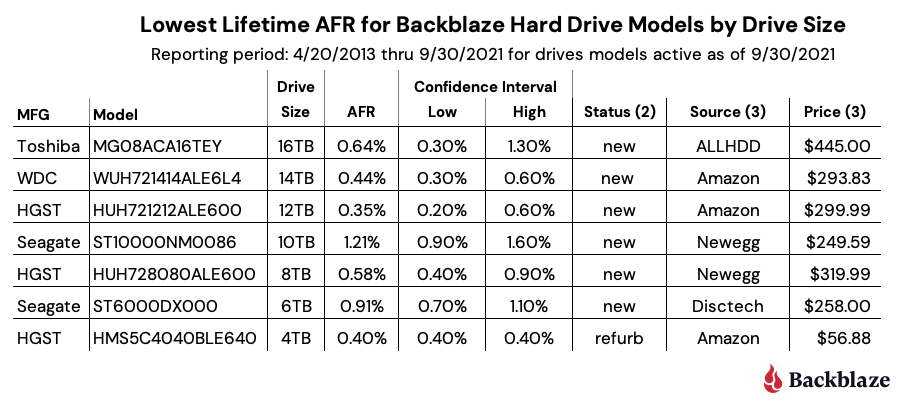
Our best performing drive models in our environment by drive size are listed in the table below.
Notes:
- The WDC 16TB drive (model: WUH721816ALE6L0) does not appear to be available in the U.S. through retail channels. It is available in Europe for 549,00 EUR.
- Status is based on what is stated on the website. Further investigation may be required to ensure you are purchasing a new drive versus a refurbished drive marked as new.
- The source and price columns were as of 10/23/2021.
The Hard Drive Stats Data
The complete data set used to create the information used in this review is available on our Hard Drive Test Data page. You can download and use this data for free for your own purpose. All we ask are three things: 1) you cite Backblaze as the source if you use the data, 2) you accept that you are solely responsible for how you use the data, and 3) you do not sell this data to anyone; it is free.
If you just want the summarized data used to create the tables and charts in this blog post, you can download the ZIP file containing the Excel XLXS files for each chart.
Good luck and let us know if you find anything interesting.
The post Backblaze Drive Stats for Q3 2021 appeared first on Backblaze Blog | Cloud Storage & Cloud Backup.