Post Syndicated from Jeff Barr original https://aws.amazon.com/blogs/aws/cloudwatch-rum/
Way back in 2009 I wrote a blog post titled New Features for Amazon EC2: Elastic Load Balancing, Auto Scaling, and Amazon CloudWatch. In that post I talked about how Amazon CloudWatch helps you to build applications that are highly scalable and highly available, and noted that it gives you cost-effective real-time visibility into your metrics, with no deployment and no maintenance. Since that launch, we have added many new features to CloudWatch, all with that same goal in mind. For example, last year I showed you how you could Use CloudWatch Synthetics to Monitor Sites, API Endpoints, Web Workflows ,and More.
Real-User Monitoring (RUM)
The next big challenge (and the one that we are addressing today) is monitoring web applications with the goal of understanding performance and providing an optimal experience for your users. Because of the number of variables involved—browser type, browser configuration, user location, connectivity, and so forth—synthetic testing can only go so far. What really matters to your users is the experience that they receive, and that’s what we want to help you to deliver!
Amazon CloudWatch RUM will help you to collect the metrics that give you the insights that will help you to identity, understand, and improve this experience. You simply register your application, add a snippet of JavaScript to the header of each page, and deploy. The snippet runs when your users step through each page of your application, and sends the data to RUM for consolidation and analysis. You can use this tool on its own, and in conjunction with both Amazon CloudWatch ServiceLens and AWS X-Ray.
CloudWatch RUM in Action
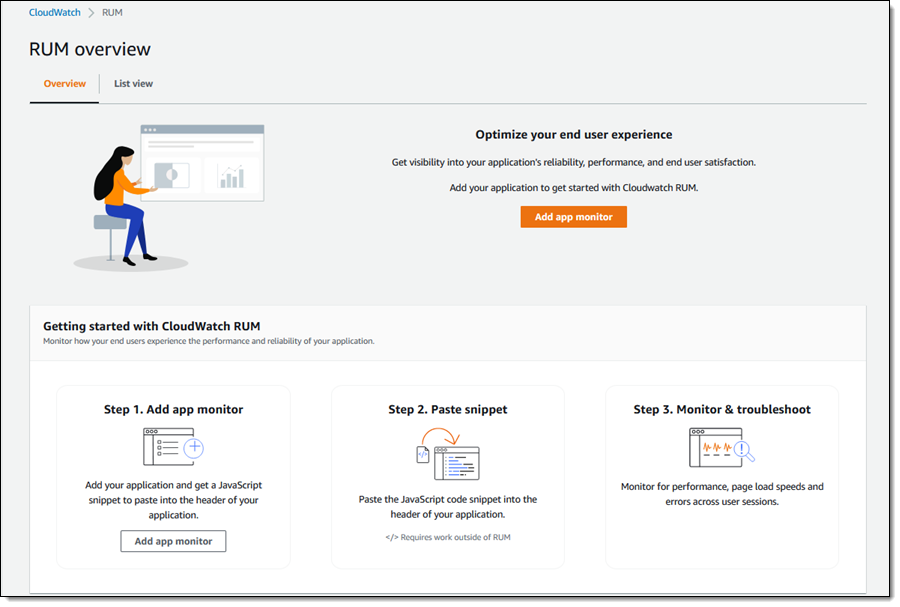
To get started, I open the CloudWatch Console and navigate to RUM. Then I click Add app monitor:
I give my monitor a name and specify the domain that hosts my application:

Then I choose the events that I want to monitor & collect, and specify the percentage of sessions. My personal blog does not get a lot of traffic, so I will collect all of the sessions. I can also choose to store data in Amazon CloudWatch Logs in order to keep it around for more than the 30 days provided by CloudWatch RUM:

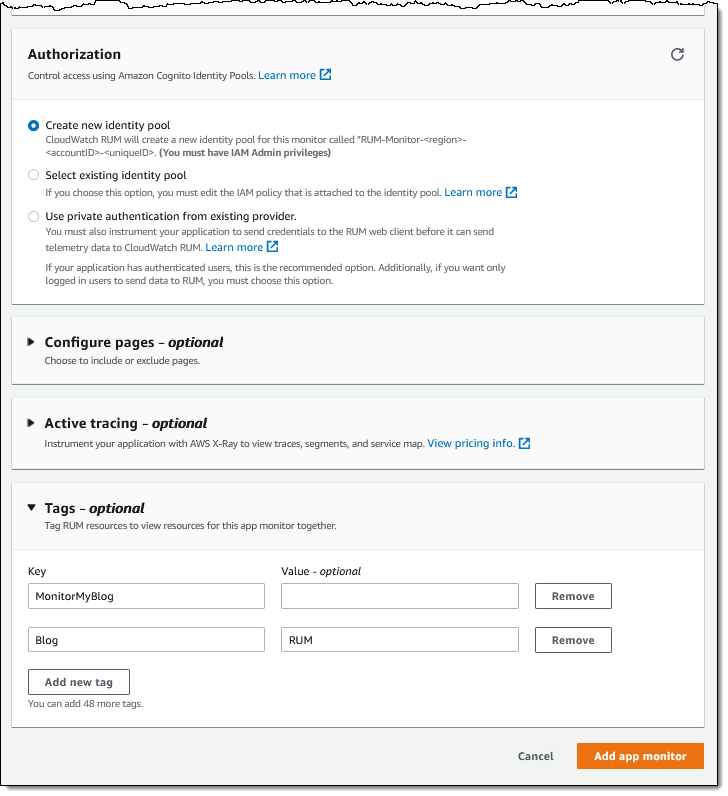
Finally, I opt to create a new Cognito identy pool, and add a tag. If I want to use CloudWatch ServiceLens and X-Ray, I can expand Active tracing and enable XRay. My app does not make any API requests, so I will not do that. I finish by clicking Add app monitor:
The console then shows me the JavaScript code snippet that I need to insert into the <head> element of my application:
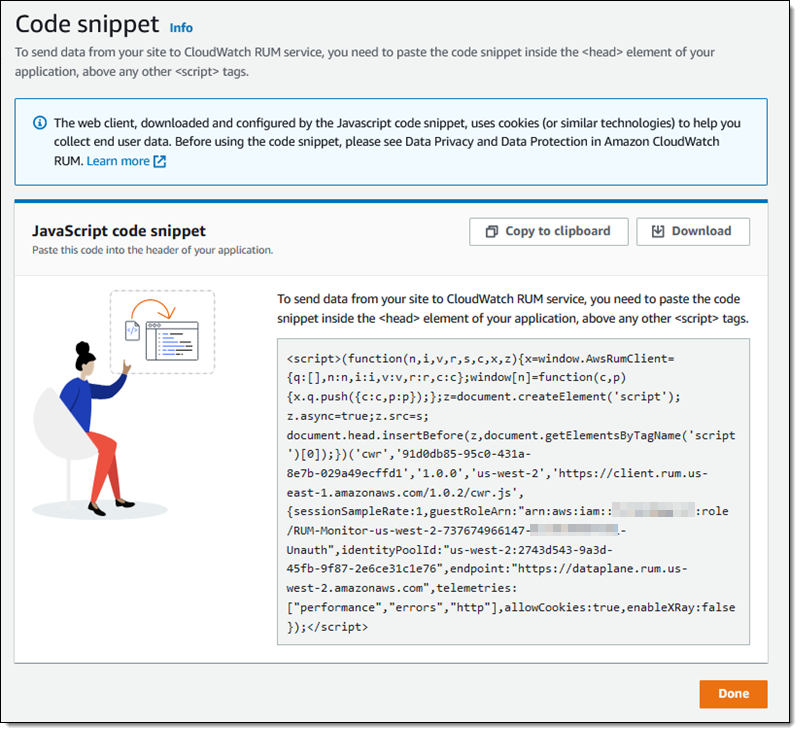
I save the snippet, click Done, and then edit my application (my somewhat neglected personal blog in this case) to add the code snippet. I am using Jekyll, and added the snippet to my blog template:

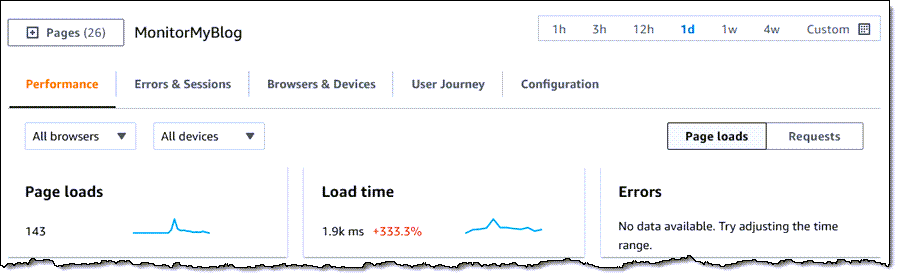
Then I wait for some traffic to arrive. When I return to the RUM Console, I can see all of my app monitors. I click MonitorMyBlog to learn more:

Then I can explore the aggregated timing data and the other information that has been collected. There’s far more than I have space to show today, so feel free to try this out on your own and do a deeper dive. Each of the tabs contains multiple filters and options to help you to zoom in on areas of interest: specific pages, locations, browsers, user journeys, and so forth.
The Performance tab shows the vital signs for my application, followed by additional information:
The vital signs are apportioned into three levels (Positive, Tolerable, and Frustrating):

The screen above contains a metric (largest contentful paint) that was new to me. As Philip Walton explains it, “Largest Contentful Paint (LCP) is an important user-centered metric for measuring perceived load speed because it marks the point in the page load timeline when the page’s main content has likely loaded.”
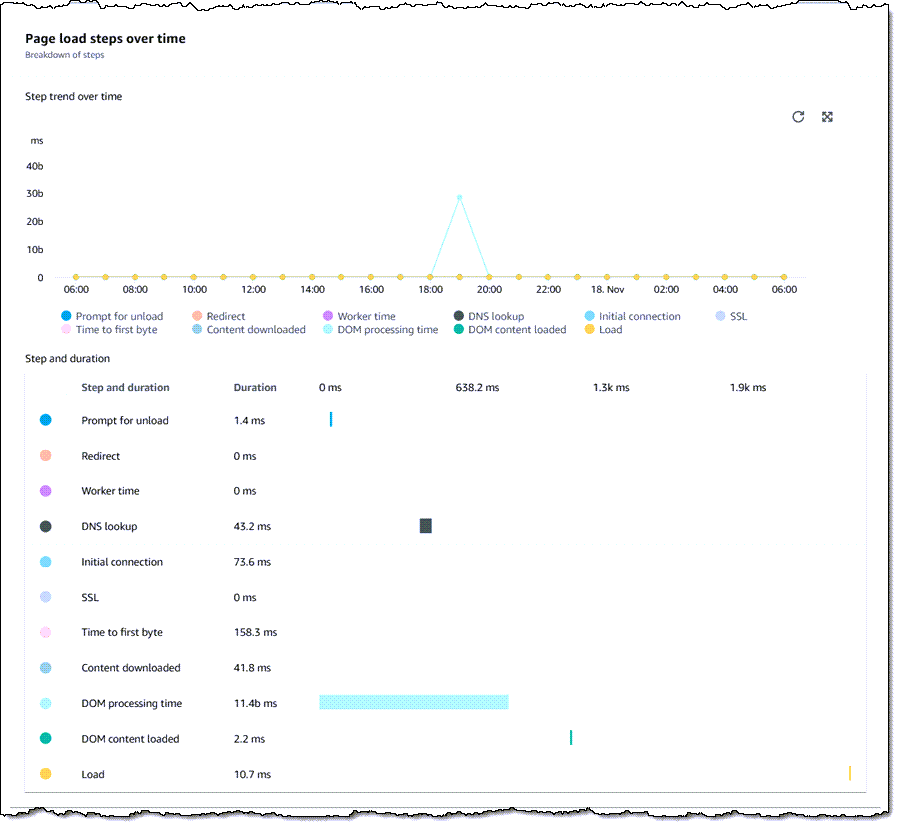
I can also see the time consumed by the steps that the browser takes when loading a page:
And I can see average load time by time of day:

I can also see all of this information on a page-by-page basis:

The Browsers & Devices tab also shows a lot of interesting and helpful data. For example, I can learn more about the browsers that are used to access my blog, again with the page-by-page option:

I can also view the user journeys (page sequences) through my blog. Based on this information, it looks like I need to do a better job of leading users from one page to another:

As I noted earlier, there’s a lot of interesting and helpful information here, and you should check it out on your own.
Available Now
CloudWatch RUM is available now and you can start using it today in ten AWS Regions: US East (N. Virginia), US East (Ohio), US West (Oregon), Europe (Ireland), Europe (London), Europe (Frankfurt), Europe (Stockholm), Asia Pacific (Sydney), Asia Pacific (Tokyo), and Asia Pacific (Singapore). You pay $1 for every 100K events that are collected.
— Jeff;