Post Syndicated from Aigars Kadiķis original https://blog.zabbix.com/new-agent-2-features-in-zabbix-6-0-lts-by-aigars-kadikis-zabbix-summit-online-2021/18929/
Zabbix Agent 2 has been developed to provide additional benefits to our users – From a larger set of supported metrics to metric collection logic improvements and simplified custom monitoring plugin development. Let’s look at what new features Zabbix Agent 2 will receive in Zabbix 6.0 LTS.
The full recording of the speech is available on the official Zabbix Youtube channel.
What is Zabbix agent?
First, let’s talk about the key benefits you gain with Zabbix agent and how it can add an additional layer of flexibility to your monitoring:
- Zabbix Agent is a daemon that collects your metrics
- Available on Windows and Unix-like systems
- Rich capabilities out of the box
- Natively supports the collection of a large set of OS-level metrics such as memory/CPU/storage/file statistics and much more
- Provides native log monitoring capabilities
- Can be extended
- Select the direction of the communication between the Zabbix server and the Zabbix agent
- Push the metrics to the Zabbix server with active checks
- Let the Zabbix server poll the agent with passive checks
- Control over the data collection interval
- Ability to schedule checks and define flexible metric collection intervals
- For example – You can collect metrics at a specific time or only during working hours
Why Zabbix agent 2?
Now that the key benefits of using a Zabbix agent are clear, let’s answer the question – why should I consider using Zabbix agent 2 instead of sticking with the classical agent?
The main goal of Zabbix Agent 2 is the ability to have a simple and flexible to extend the metric collection capabilities of the agent. This is true for both the internal development of new native Zabbix Agent 2 metrics and for custom Zabbix Agent 2 plugin development done by our community. We manage to achieve this goal by developing the Zabbix Agent 2 in GO. Less code, more flexibility, and a much more modular approach – all of this thanks to the GO language.
In addition to the aforementioned metric collection improvements, with Zabbix agent 2, we were also able to solve many ongoing design problems. The Zabbix agent 2 introduces improvements such as:
- Support for check concurrency for active checks (this was not the case with the classical Zabbix Agent – active check metrics were collected one at a time)
- Support for persistent data storage on the Agent side
- Reduced number of TCP connections between the Zabbix agent 2 and Zabbix server
- HTTPS web site checks out of the box on Windows
- Concurrency support provides the ability to read multiple log files in parallel
- Out of the box monitoring for many different applications
Let’s take a look at some of the more popular systems that Zabbix Agent 2 can monitor out of the box
Certificate monitoring
The ability to perform certificate monitoring out of the box has been a long-awaited feature. One of the more common requests was monitoring the certificate expiry date. With Zabbix agent 2, it is possible to perform certificate monitoring with a native Zabbix agent item:
Zabbix agent item key for certificate monitoring:
web.certificate.get[hostname,<port>,<IP>]
This item will return:
- X.509 fields
- Validation result
- Fingerprint field
Example:
web.certificate.get[blog.zabbix.com,443]
This item will collect multiple certificate metrics in bulk. We can then obtain the necessary information by using the Zabbix dependent items. You can take a look and download the latest official template from our git page. The template already contains the necessary master/dependent items – all you have to do is import the template and apply it to your hosts.
IoT monitoring – MQTT
Zabbix Agent 2 is capable of performing IoT monitoring out of the box. Zabbix Agent 2 provides items for both MQTT and Modbus monitoring.
Below you can find an example of how the mqtt.get item can obtain metrics on specific MQTT topics:
mqtt.get["tcp://host:1883","path/to/topic"]
mqtt.get["tcp://host:1883","path/to/#"]
Zabbix Agent 2 is also officially supported on Raspberry Pi devices. This makes things even easier for IoT monitoring since we can simply deploy our Zabbix Agent 2 on a Raspberry Pi device in close proximity to our monitored IoT devices.
Out of the box database monitoring
With the classical agent, we had to resort to using user custom monitoring approaches for database monitoring. This was achieved either by using UserParameters, external scripts, or some other custom approach. With Zabbix agent 2, we provide native database monitoring for a large selection of SQL and NoSQL database engines.
You can find the official Zabbix database monitoring templates on our git page.
Systemd monitoring
Another long-awaited feature is native systemd monitoring. Zabbix Agent 2 provides a flexible set of items and discovery rules with which you can monitor a specific systemd unit property, discover systemd services in an automated fashion and retrieve all of the systemd unit properties in bulk.
Discover a list of systemd units and their details:
systemd.unit.discovery[<type>]
Retrieve all properties of a systemd unit:
systemd.unit.get[unit name,<interface>]
Retrieve information about a specific property of a systemd unit:
systemd.unit.info[unit name,<property>,<interface>]
These items can then be used to define triggers like:
- If service is scheduled at system bootup but not running right now, then generate a problem
- If service is not scheduled at startup but running right now, notify us that we forgot to enable the service
- and much more!
You can find more information about the official systemd template on our git page.
Docker monitoring
As with previous templates, the Zabbix Agent 2 docker monitoring also provides items for individual metrics and discovery rules for automated container discovery:
- Discover all containers or only currently running containers automatically
- Per container monitoring
- CPU
- Memory
- Network
You can find more information about the official Docker template on our git page
Additional applications supported by Zabbix agent 2
And that’s not all! Zabbix Agent 2 provides out of the box monitoring for many other systems, like:
- Ceph – an open-source software storage platform
- Memcached – a general-purpose distributed memory-caching system
- Smart – Self-Monitoring, Analysis, and Reporting Technology
If you’re interested in the full list of the official Zabbix templates, you can find all of them on our git page
Agent 2 plugins
The underlying Zabbix Agent 2 structure is based on GO plugins. This approach is used for both the official Zabbix Agent 2 items and should be used for the development of custom community extensions.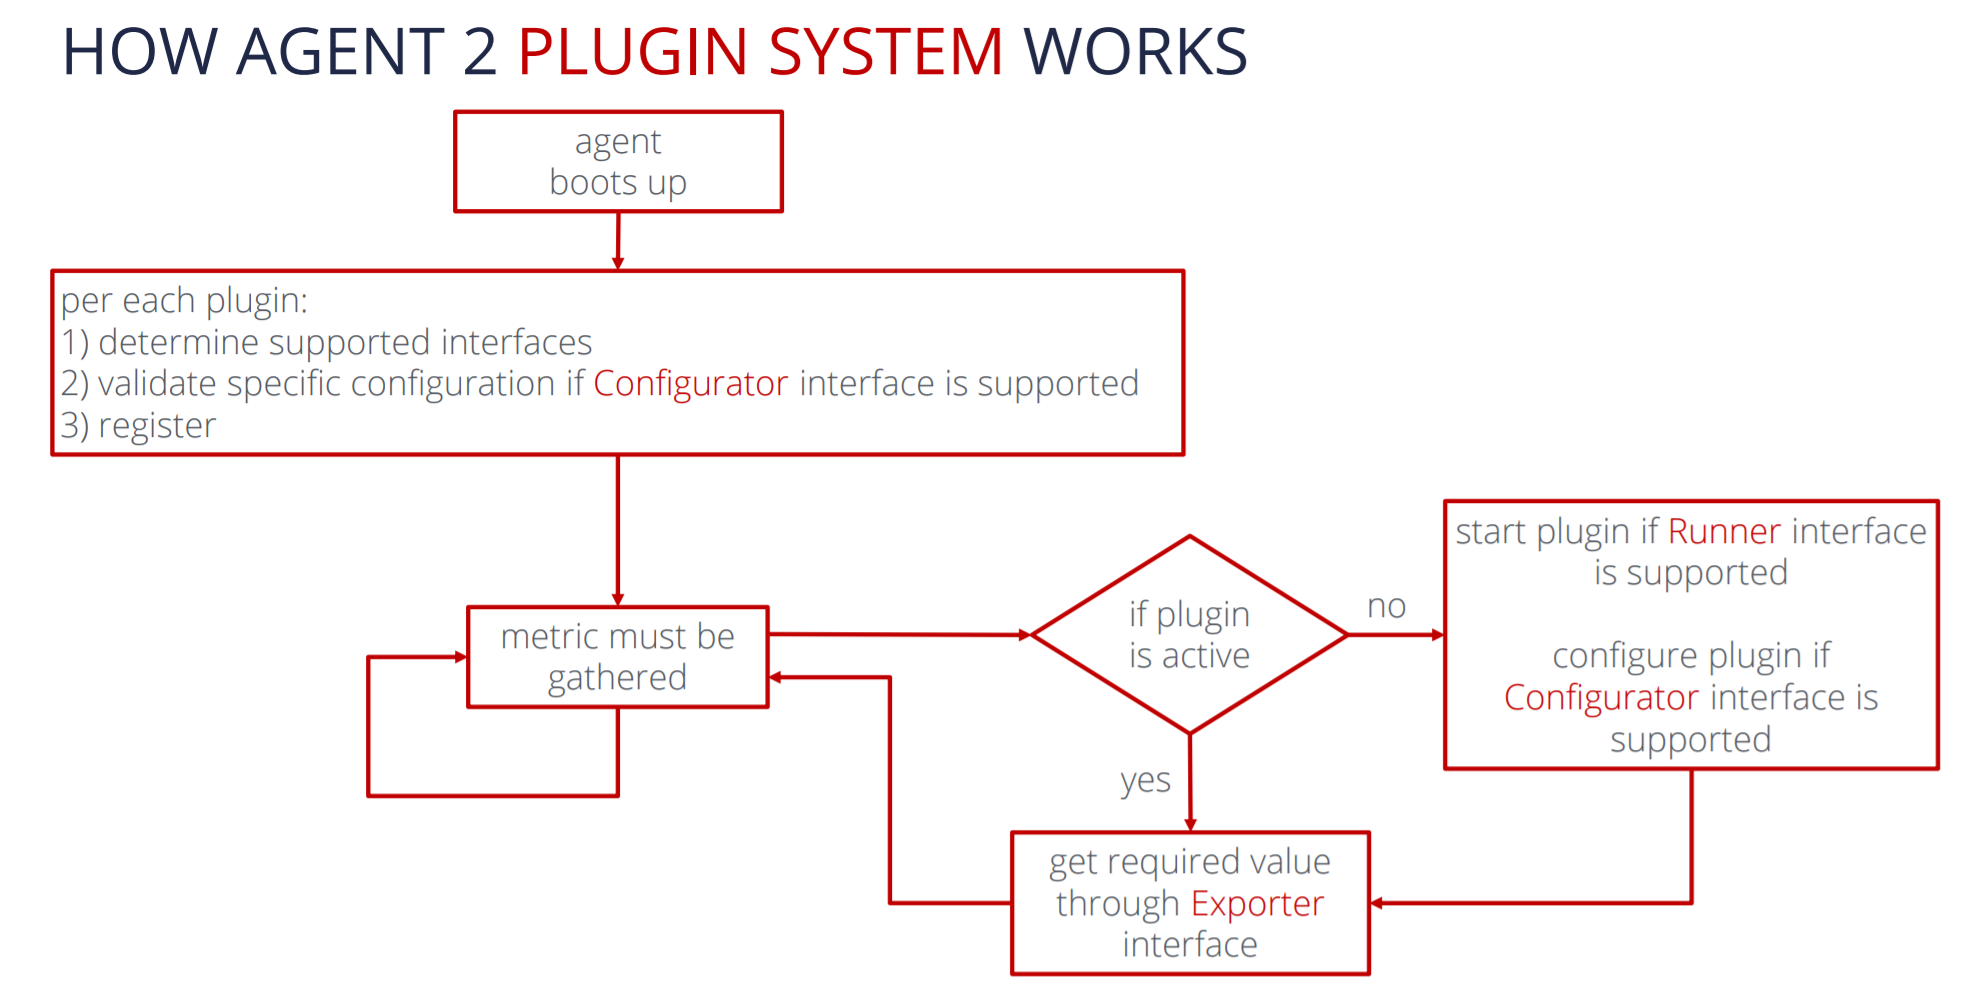
On startup, Zabbix agent 2 scans a specific directory and determines the supported interfaces per each plugin. Next, Zabbix will validate the existing plugin configuration and register each plugin in the aforementioned directory. Now we can begin the monitoring workflow. Once a metric has been requested, Zabbix agent 2 will check if the plugin responsible for collecting the particular metric is currently active. If it’s inactive – Agent 2 will check if the specific plugin supports the Runner interface and attempt to start it. Next, Agent 2 will check if the Configurator interface is available and perform the plugin configuration. Lastly, once the plugin is active, Agent 2 will collect the metric by using the Exporter interface. Next time the metric is requested – the plugin will already be active, and Agent 2 can immediately request the metric from the Exporter interface.
But is there a situation when a plugin can remain inactive – does it get unloaded after some time? The plugin does not stay loaded in memory indefinitely. If a plugin hasn’t received a request for 24 hours, the plugin will be deactivated, and it will get unloaded from the memory.
Loadable plugins
Let’s summarize the Zabbix Agent 2 plugin logic:
- External plugins are loadable on Zabbix agent 2 startup, with no need to recompile Zabbix Agent 2
- Connections bidirectionally to the plugins using Unix sockets on Linux and Named Pipes on Windows
- Backward compatible with older plugins
- The plugin is deactivated if:
- any related passive item key has not been used for 24h
- the active item is not in the active checklist
- Custom plugin architecture remains the same as it was for the internal plugins
- Separate repository for community plugins and integrations
Supported platforms for Agent 2
At this point, you may be wondering – what about compatibility? Can I use Zabbix Agent 2 as a replacement for the classical Zabbix Agent? Can it be used on the same platforms? Let’s take a look at the platforms on which you can deploy Zabbix Agent 2:
- RHEL/CentOS 6,7,8
- SLES 15 SP1+
- Debian 9,10,11, Ubuntu 18.04, 20.04
- Raspberry Pi OS, Ubuntu ARM64
- Windows 7 and later, Windows Server 2008R2 and later
If you wish to deploy Agent 2 on a system that is not officially supported, the main takeaway is – GO environment needs to be supported on the system. This means that for Zabbix Agent 2 to run, you will have to provide a set of dependencies for GO language support. If that’s the case – you should be able to compile Zabbix Agent 2 on your system.
New Agent keys
Finally, let’s cover some new Zabbix agent item keys that are available in Zabbix 6.0 LTS. Since we don’t plan on halting the support for the classical Zabbix Agent, these item keys will be supported by both Zabbix Agent and Zabbix Agent 2.
Agent variant
- agent.hostmetadata – obtains the agent metadata from the Zabbix agent configuration
- agent.variant
- Returns 1 for C agent – Zabbix agent
- Returns 2 for Go agent – Zabbix agent 2
File properties
- vfs.file.permissions – returns 4-digit string containing octal number with Unix permissions
- vfs.file.owner – returns the user ownership of file
- vfs.file.get – returns information about a file. Similar to the stat command result
- vfs.dir.get – get information about directories and files
- vfs.file.cksum – now with md5 and sha256
- vfs.file.size – measure the file size bytes or in lines in the file
vfs.dir.get on Windows
Below is an example of how most .get item keys behave. Here we can see bulk information about the contents of a directory in a JSON array. This can then be used in low-level discovery to automatically monitor the parameters for each entity obtained by the vfs.dir.get item. Below is an example output of the vfs.dir.get key executed on Windows. Note that this is just a partial output – the real JSON file will most likely contain multiple such elements related to each of the files discovered in the directory.
[{
  "basename": "input.json",
  "pathname": "c:\\app1\\temp\\input.json",
  "dirname": "c:\\app1\\temp",
  "type": "file",
  "user": "AKADIKIS-840-G2\\aigars",
  "SID": "S-1-5-21-341453538-698488186-381249278-1001",
  "size": 2506752,
  "time": {
    "access": "2021-11-03T09:19:42.5662347+02:00",
    "modify": "2020-12-21T16:00:46+02:00",
    "change": "2020-12-29T12:20:10.0104822+02:00"
  },
  "timestamp": {
    "access": 1635923982,
    "modify": 1608559246,
    "change": 1609237210
  }
}]
vfs.file.get on Linux
As we can see, the output of vfs.file.get is also very similar to the previous get request. As I’ve mentioned before – the information here is similar to what the stat command provides.
{
  "basename": "passwd",
  "pathname": "/etc/passwd",
  "dirname": "/etc",
  "type": "file",
  "user": "root",
  "group": "root",
  "permissions": "0644",
  "uid": 0,
  "gid": 0,
  "size": 3348,
  "time": {
    "access": "2021-11-03T09:27:21+0200",
    "modify": "2021-10-24T13:18:18+0300",
    "change": "2021-10-24T13:18:18+0300"
},
"timestamp": {
    "access": 1635924441,
    "modify": 1635070698,
    "change": 1635070698
  }
}
More dimensions for discovery keys
The functionality of some of the existing keys has also been improved in Zabbix 6.0 LTS. For example, for vfs.fs.discovery and vfs.fs.get keys Zabbix will now also collect the file system label as the value of the {#FSLABEL} macro.
- vfs.fs.discovery – will now retrieve an additional label value – {#FSLABEL}
- vfs.fs.get – will now retrieve an additional label value – {#FSLABEL}
[{
  "{#FSNAME}": "C:",
  "{#FSTYPE}": "NTFS",
  "{#FSLABEL}": "System",
  "{#FSDRIVETYPE}": "fixed"
}]
Questions
Q: Can we run both of the agents at the same time – Zabbix Agent and Zabbix Agent 2?
A: Yes, both of the agents can be started on the same machine. All we have to do is adjust the listen port for one of the agents since, by default, both of them will try to listen on port 10050. Therefore, we need to switch that port to something else for one of the agents. You can also simply disable the passive checks for one of the agents, so it’s not listening for incoming connections at all – such an approach will also work.
Q: Can I use the Zabbix agent if I don’t have administrative privileges?
A: Yes, most definitely. You can run the agent under any other user both on Windows and Linux. Just make sure that the user has access to the information (logs, files, folders, for example) that the Zabbix agent needs to monitor.
Q: Are there any use cases where the classical C Zabbix agent is better than Zabbix agent 2?
A: First off, the binary size for the classical Zabbix agent is definitely smaller, so that’s one benefit. The Zabbix Agent 2 also has a more complex set of dependencies required to run it, so if for some reason we cannot provide the necessary GO dependencies for Zabbix agent 2, then the classical Zabbix agent is the way to go. In addition, if you’re using some kind of automation or orchestration tools to deploy Zabbix agents – having the same type of agent everywhere will make life easier for you, so that’s something else to take into account when pi
The post New Agent 2 features in Zabbix 6.0 LTS by Aigars Kadiķis / Zabbix Summit Online 2021 appeared first on Zabbix Blog.