Post Syndicated from Michael Kammer original https://blog.zabbix.com/community-coffee-and-code-a-zabbix-summit-2025-recap/31577/

Zabbix Summit 2025 is officially in the history books, so now is the perfect time for a casual, behind‑the‑scenes run‑through of what went down. If you were there, this should ring a few bells (or spark some “oh hey, I forgot about that” moments). If you couldn’t make it, consider this your own personal highlight reel!
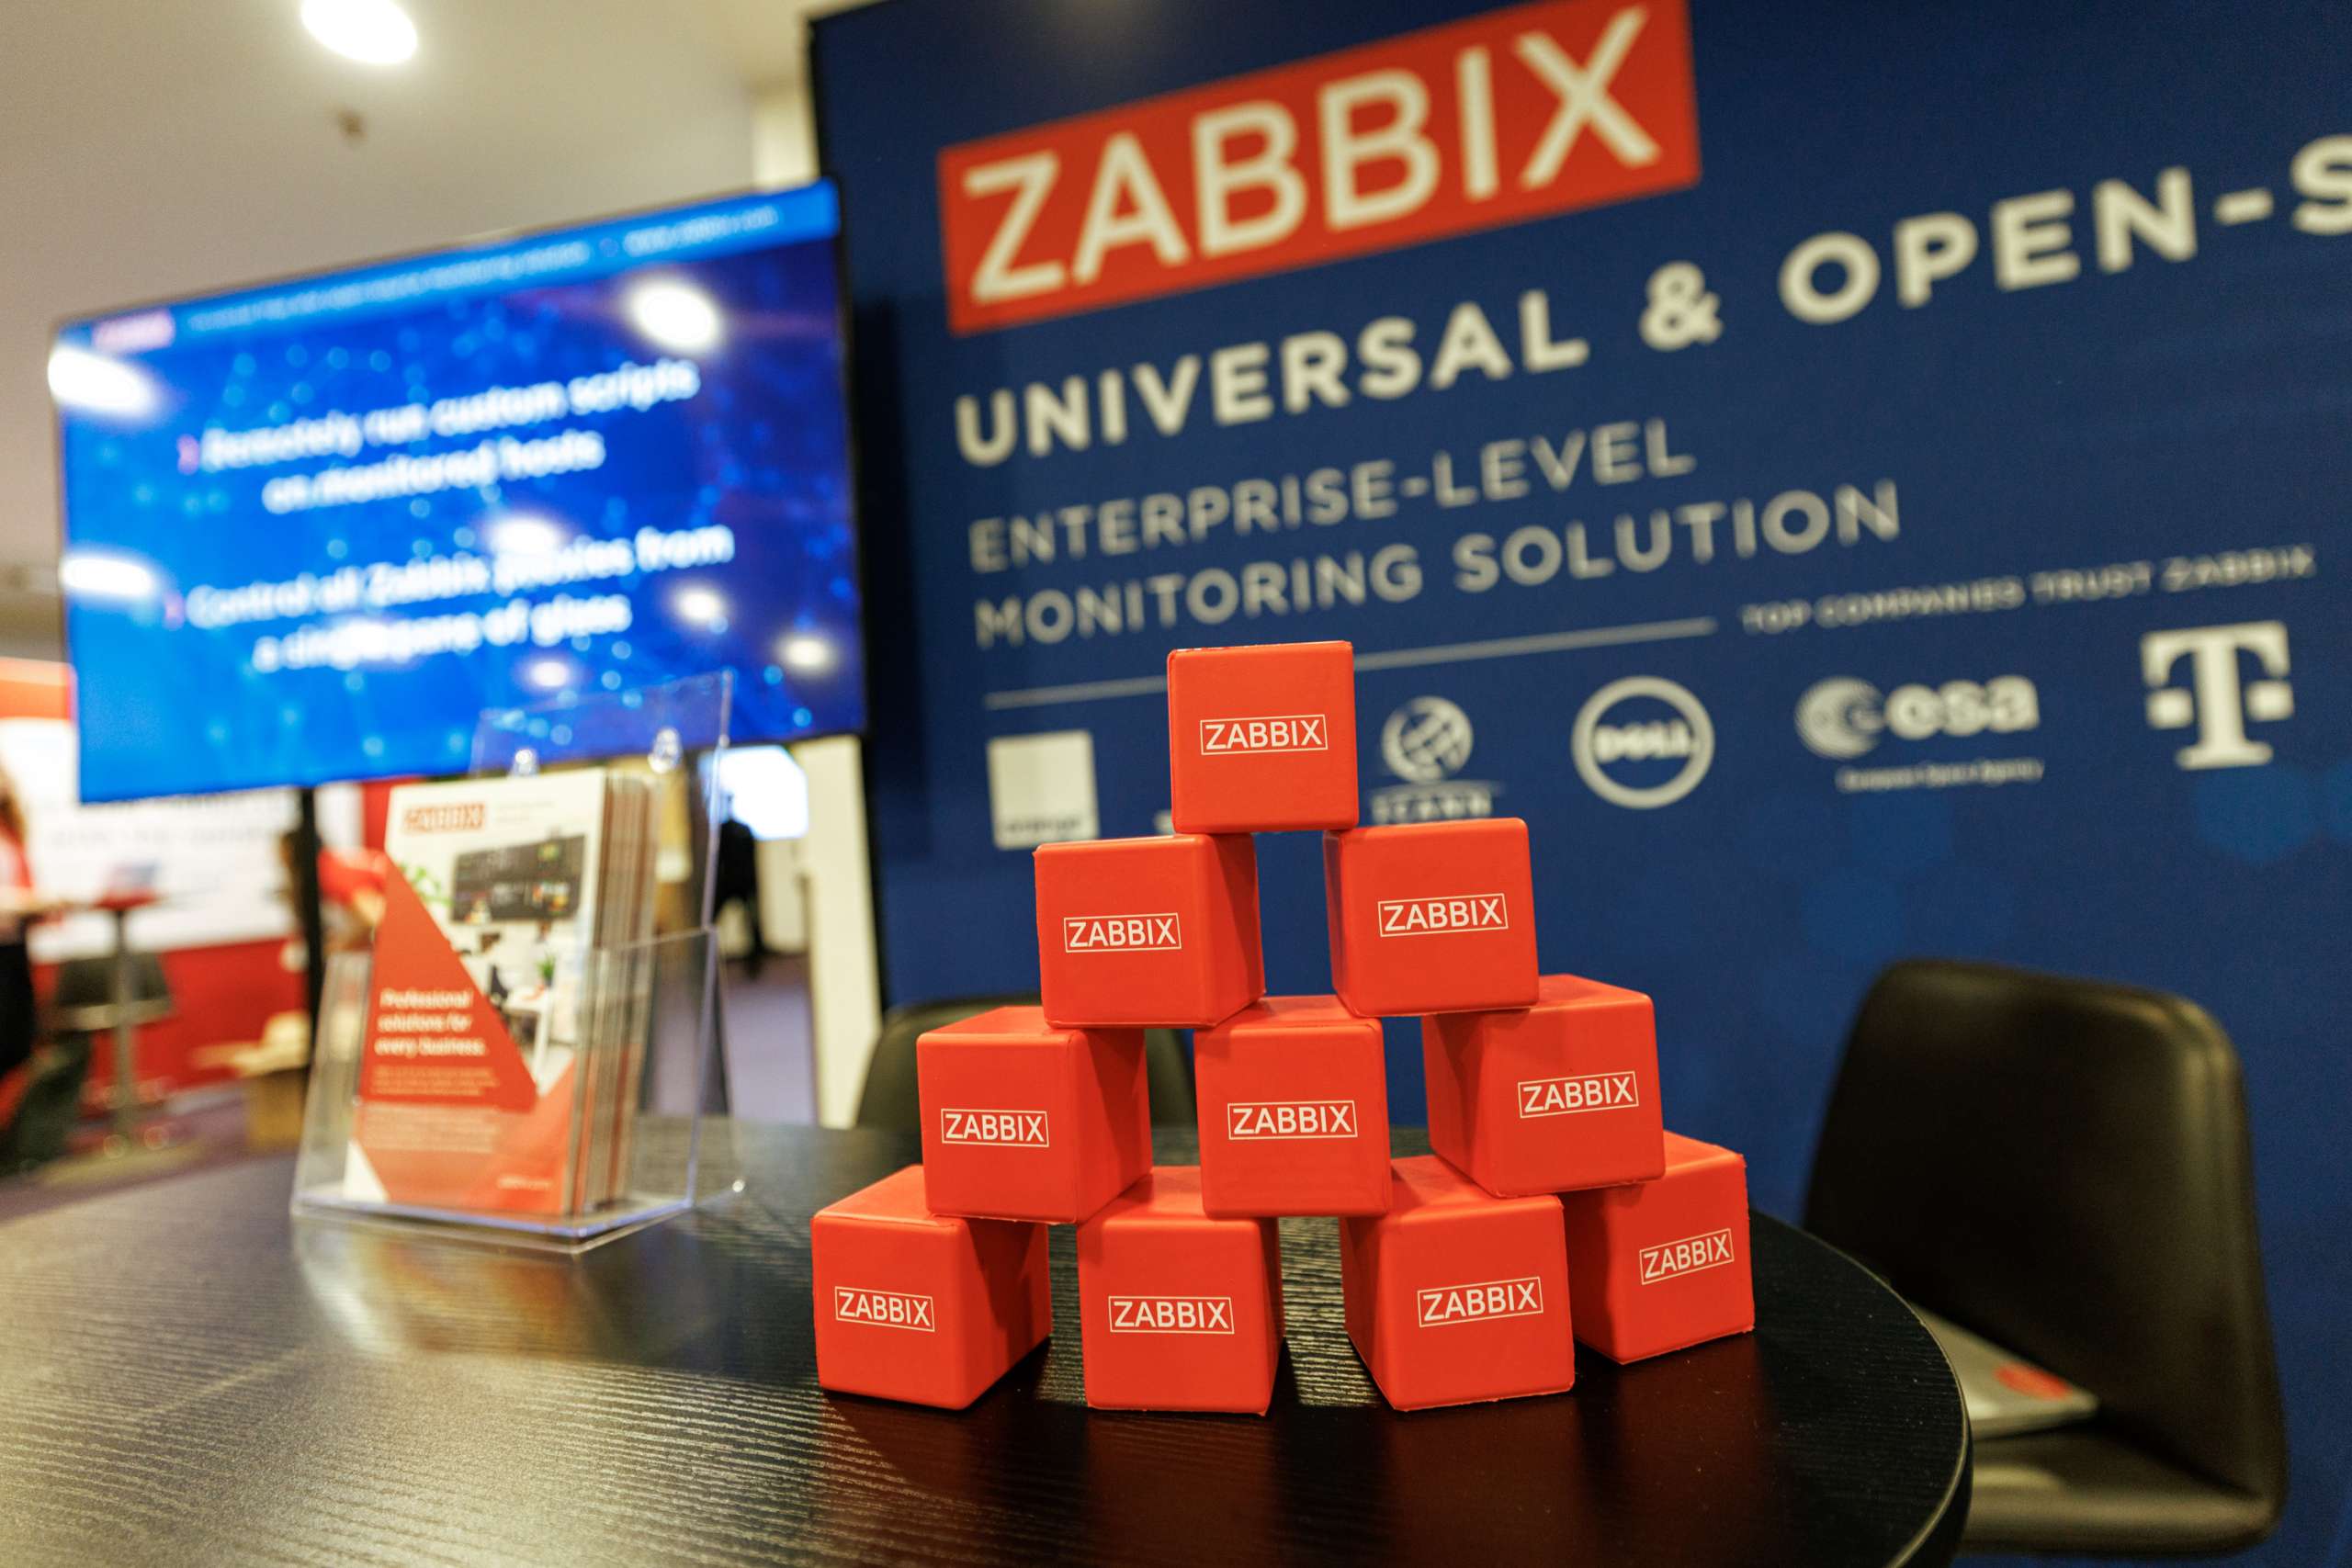
Featuring approximately 550 attendees from 42 countries, the Summit took place from October 8-10 at the Radisson Blu Hotel Latvija in the heart of downtown Riga. The 13th in-person version of our premier yearly event was in many ways our biggest and boldest yet, and it included keynote sessions, two parallel tracks (including a developer track), workshops, hands-on sessions, training and certification exams, and a variety of evening social and networking events.
Open source, open house
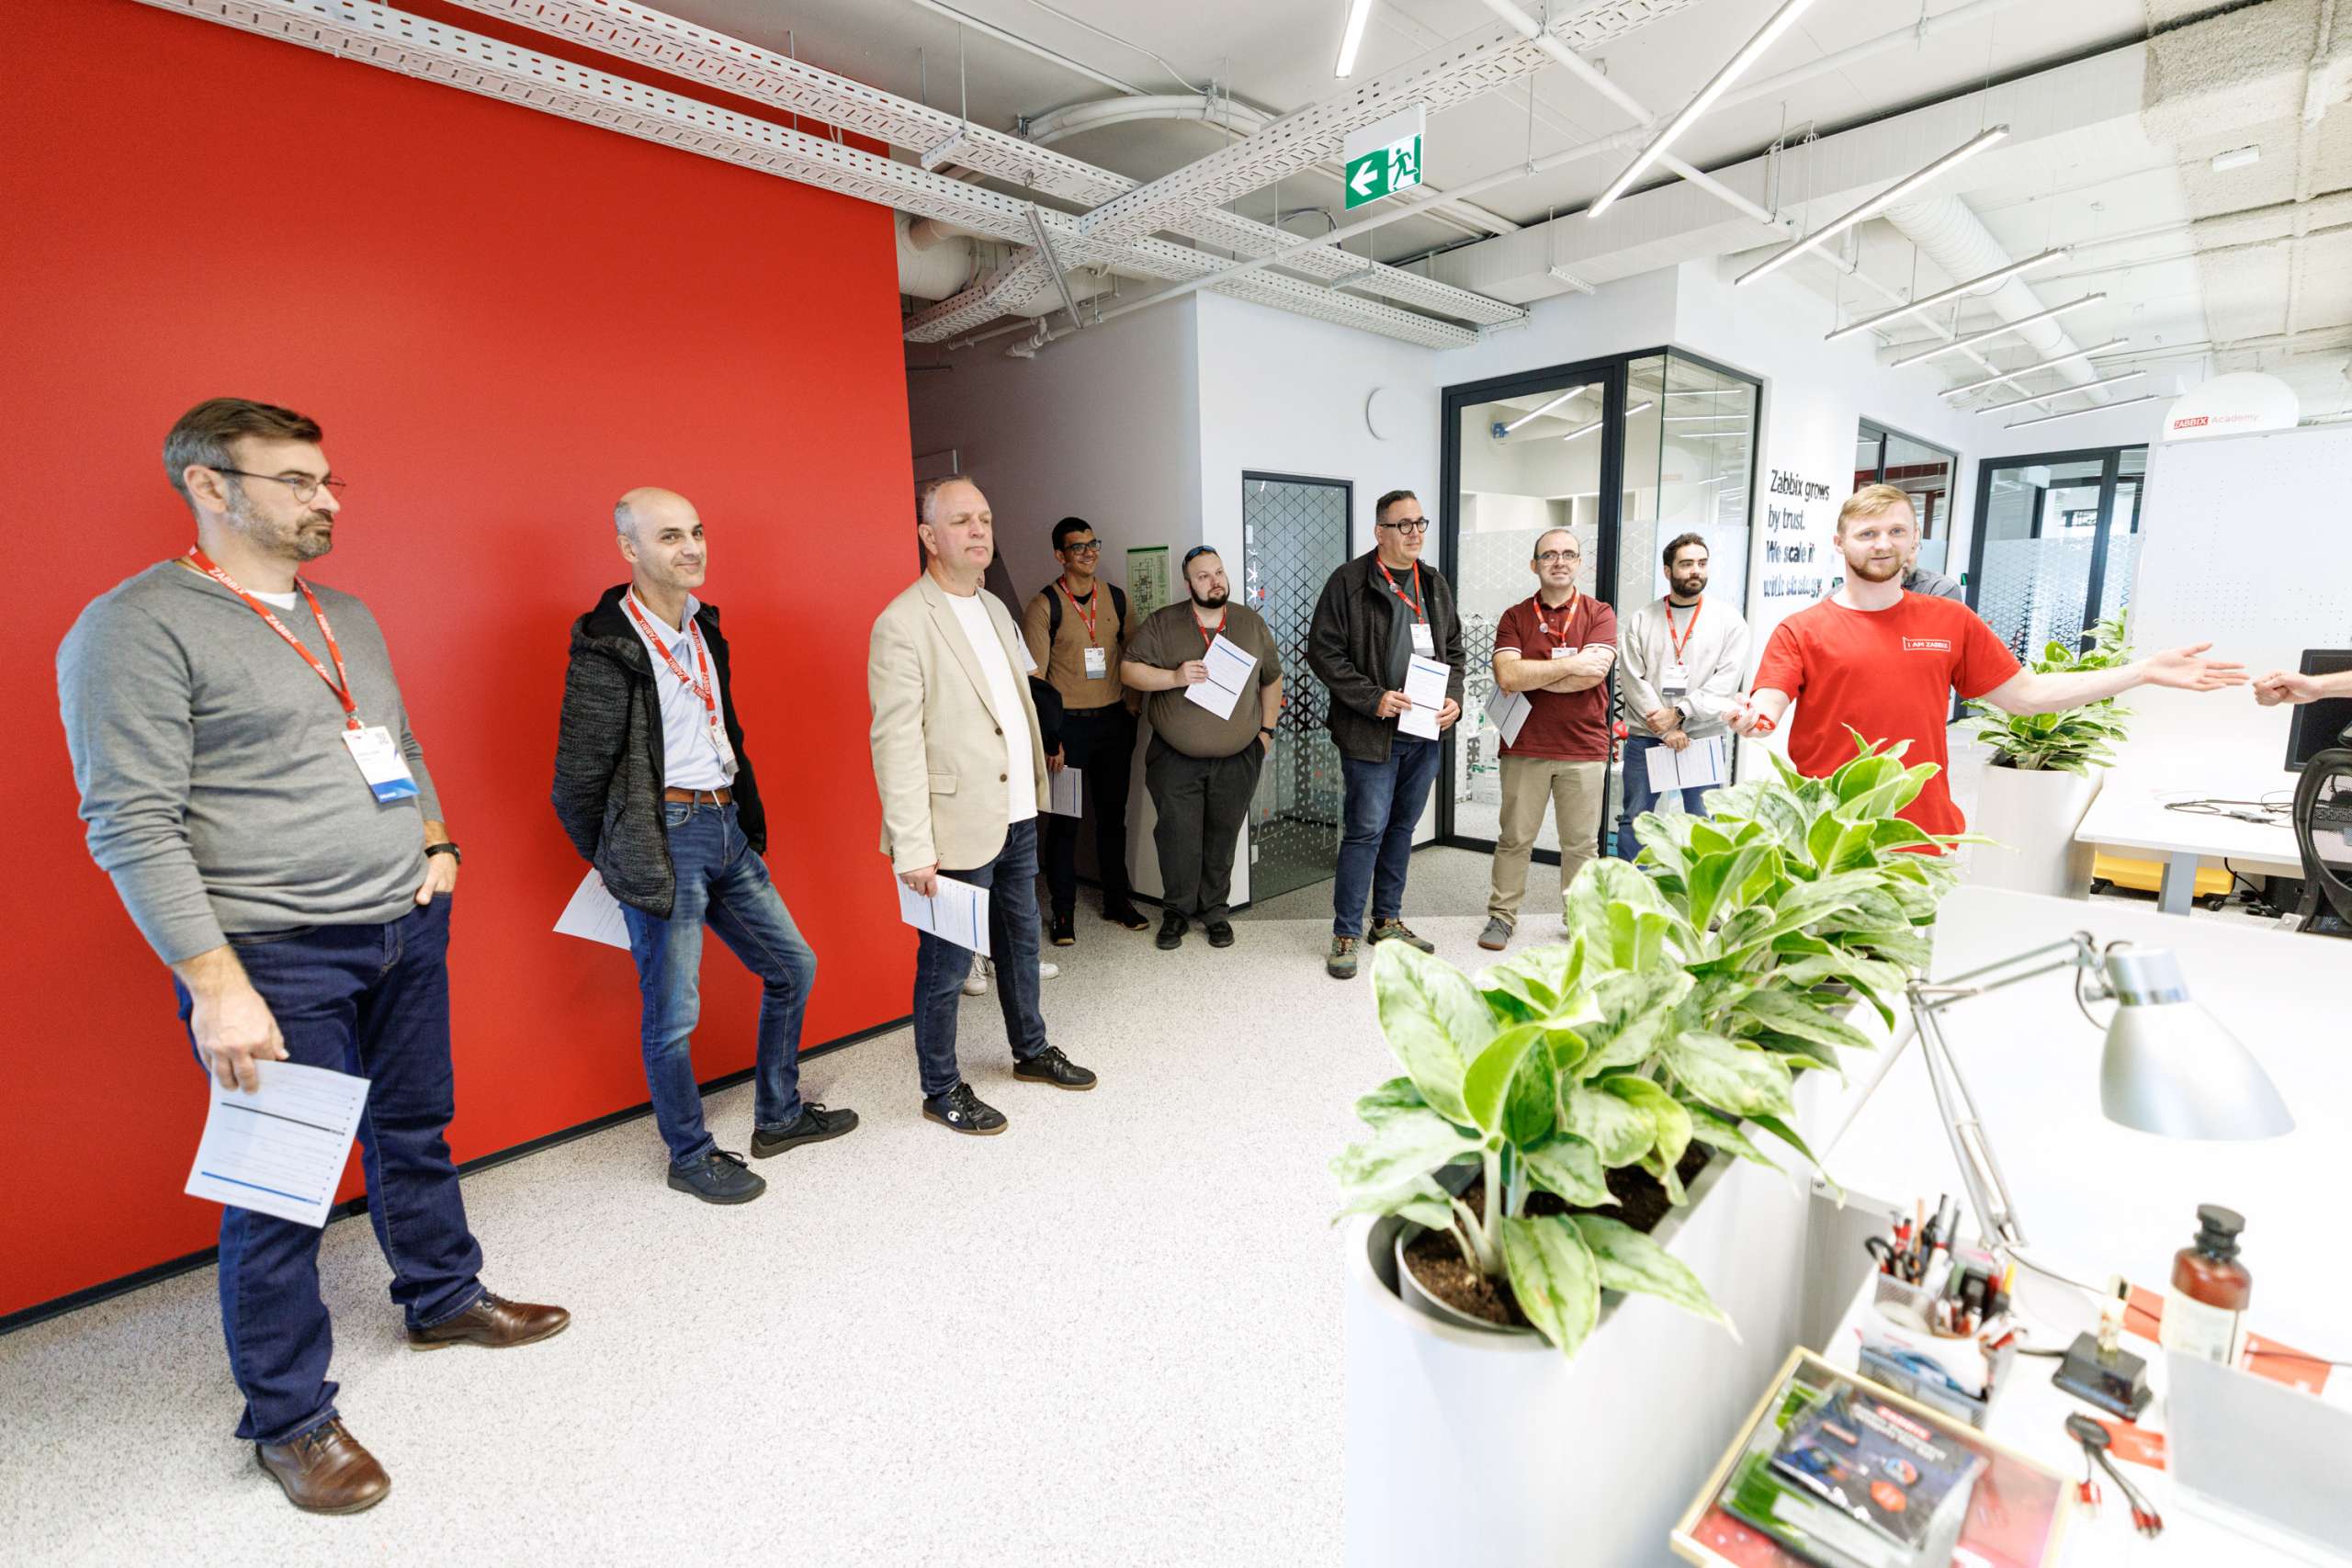
On October 8, we welcomed nearly 100 guests to our brand-new headquarters for Zabbix Summit 2025’s Open House Day. The new facility gave us plenty of space to host everyone, and visitors got to explore our new HQ, take part in a fun quiz with Zabbix facts, and catch up with longtime colleagues while meeting new ones from the community and the Zabbix team.
Day 1: Looking ahead
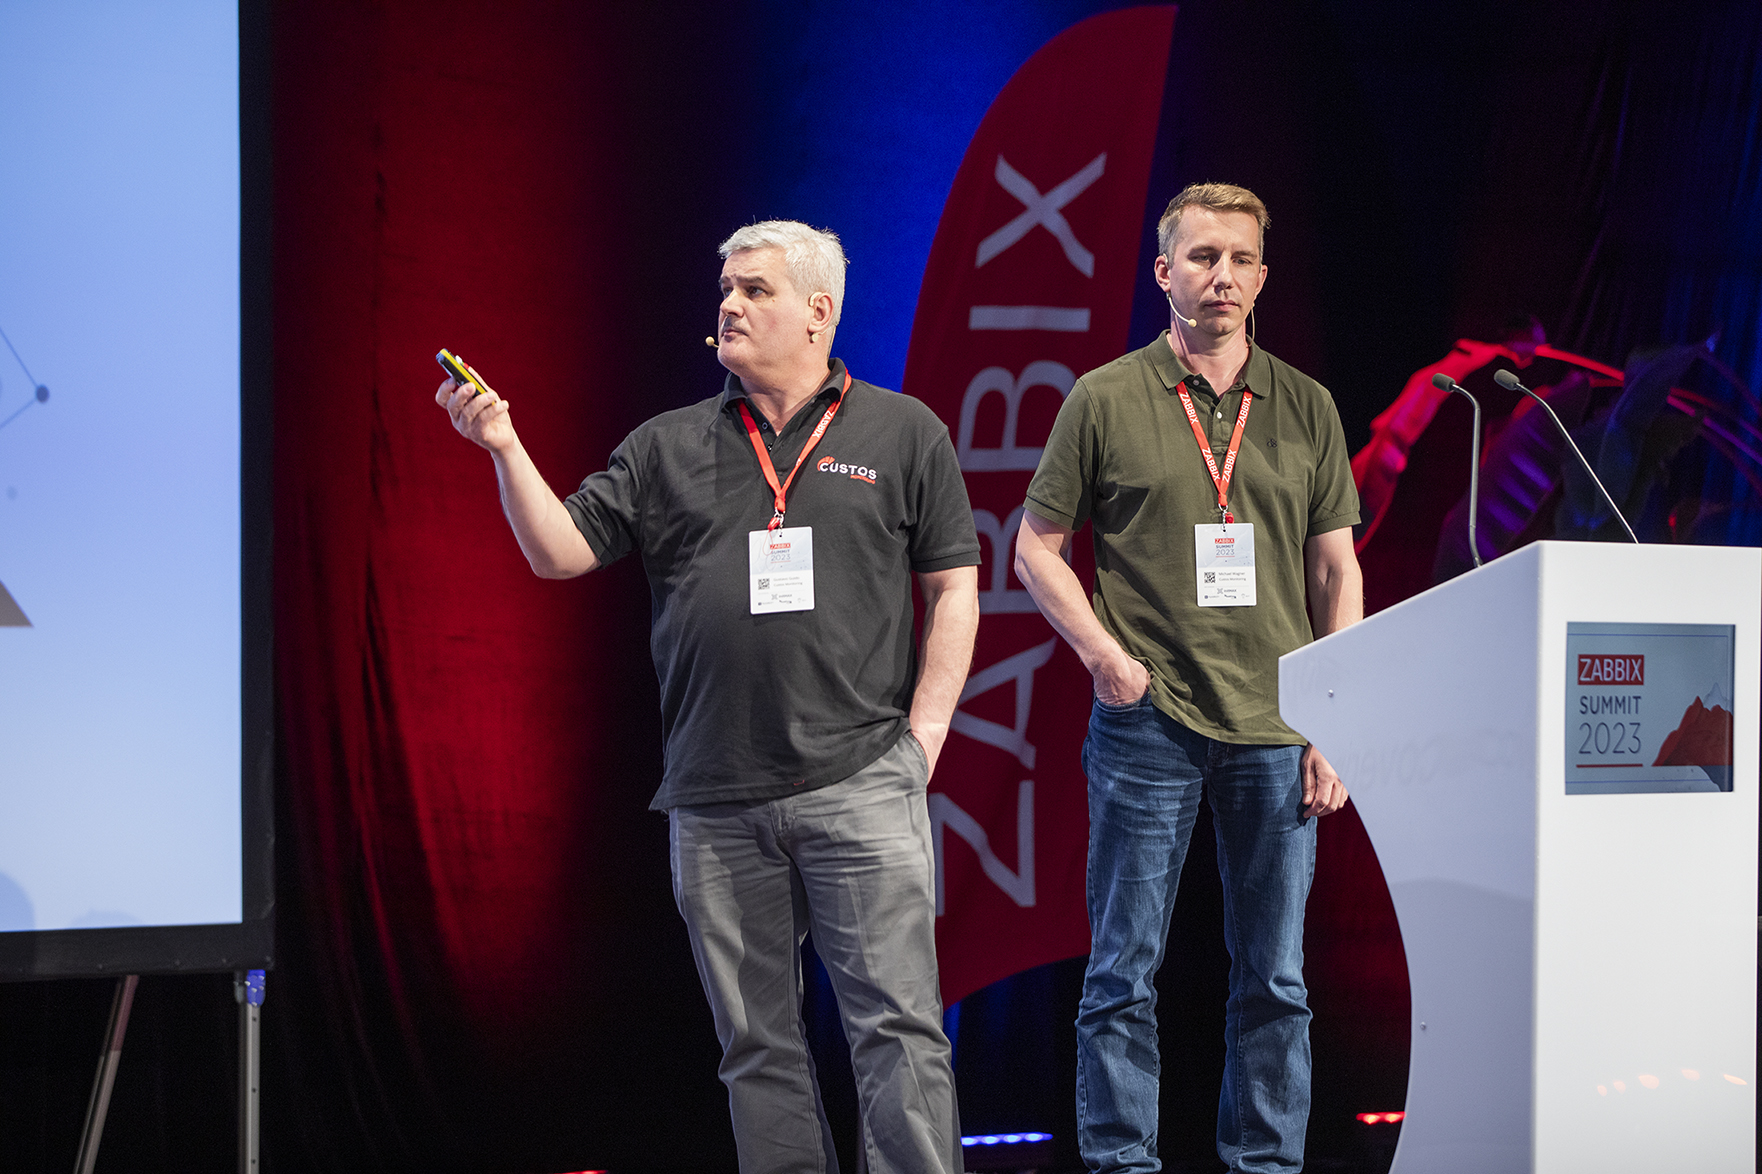
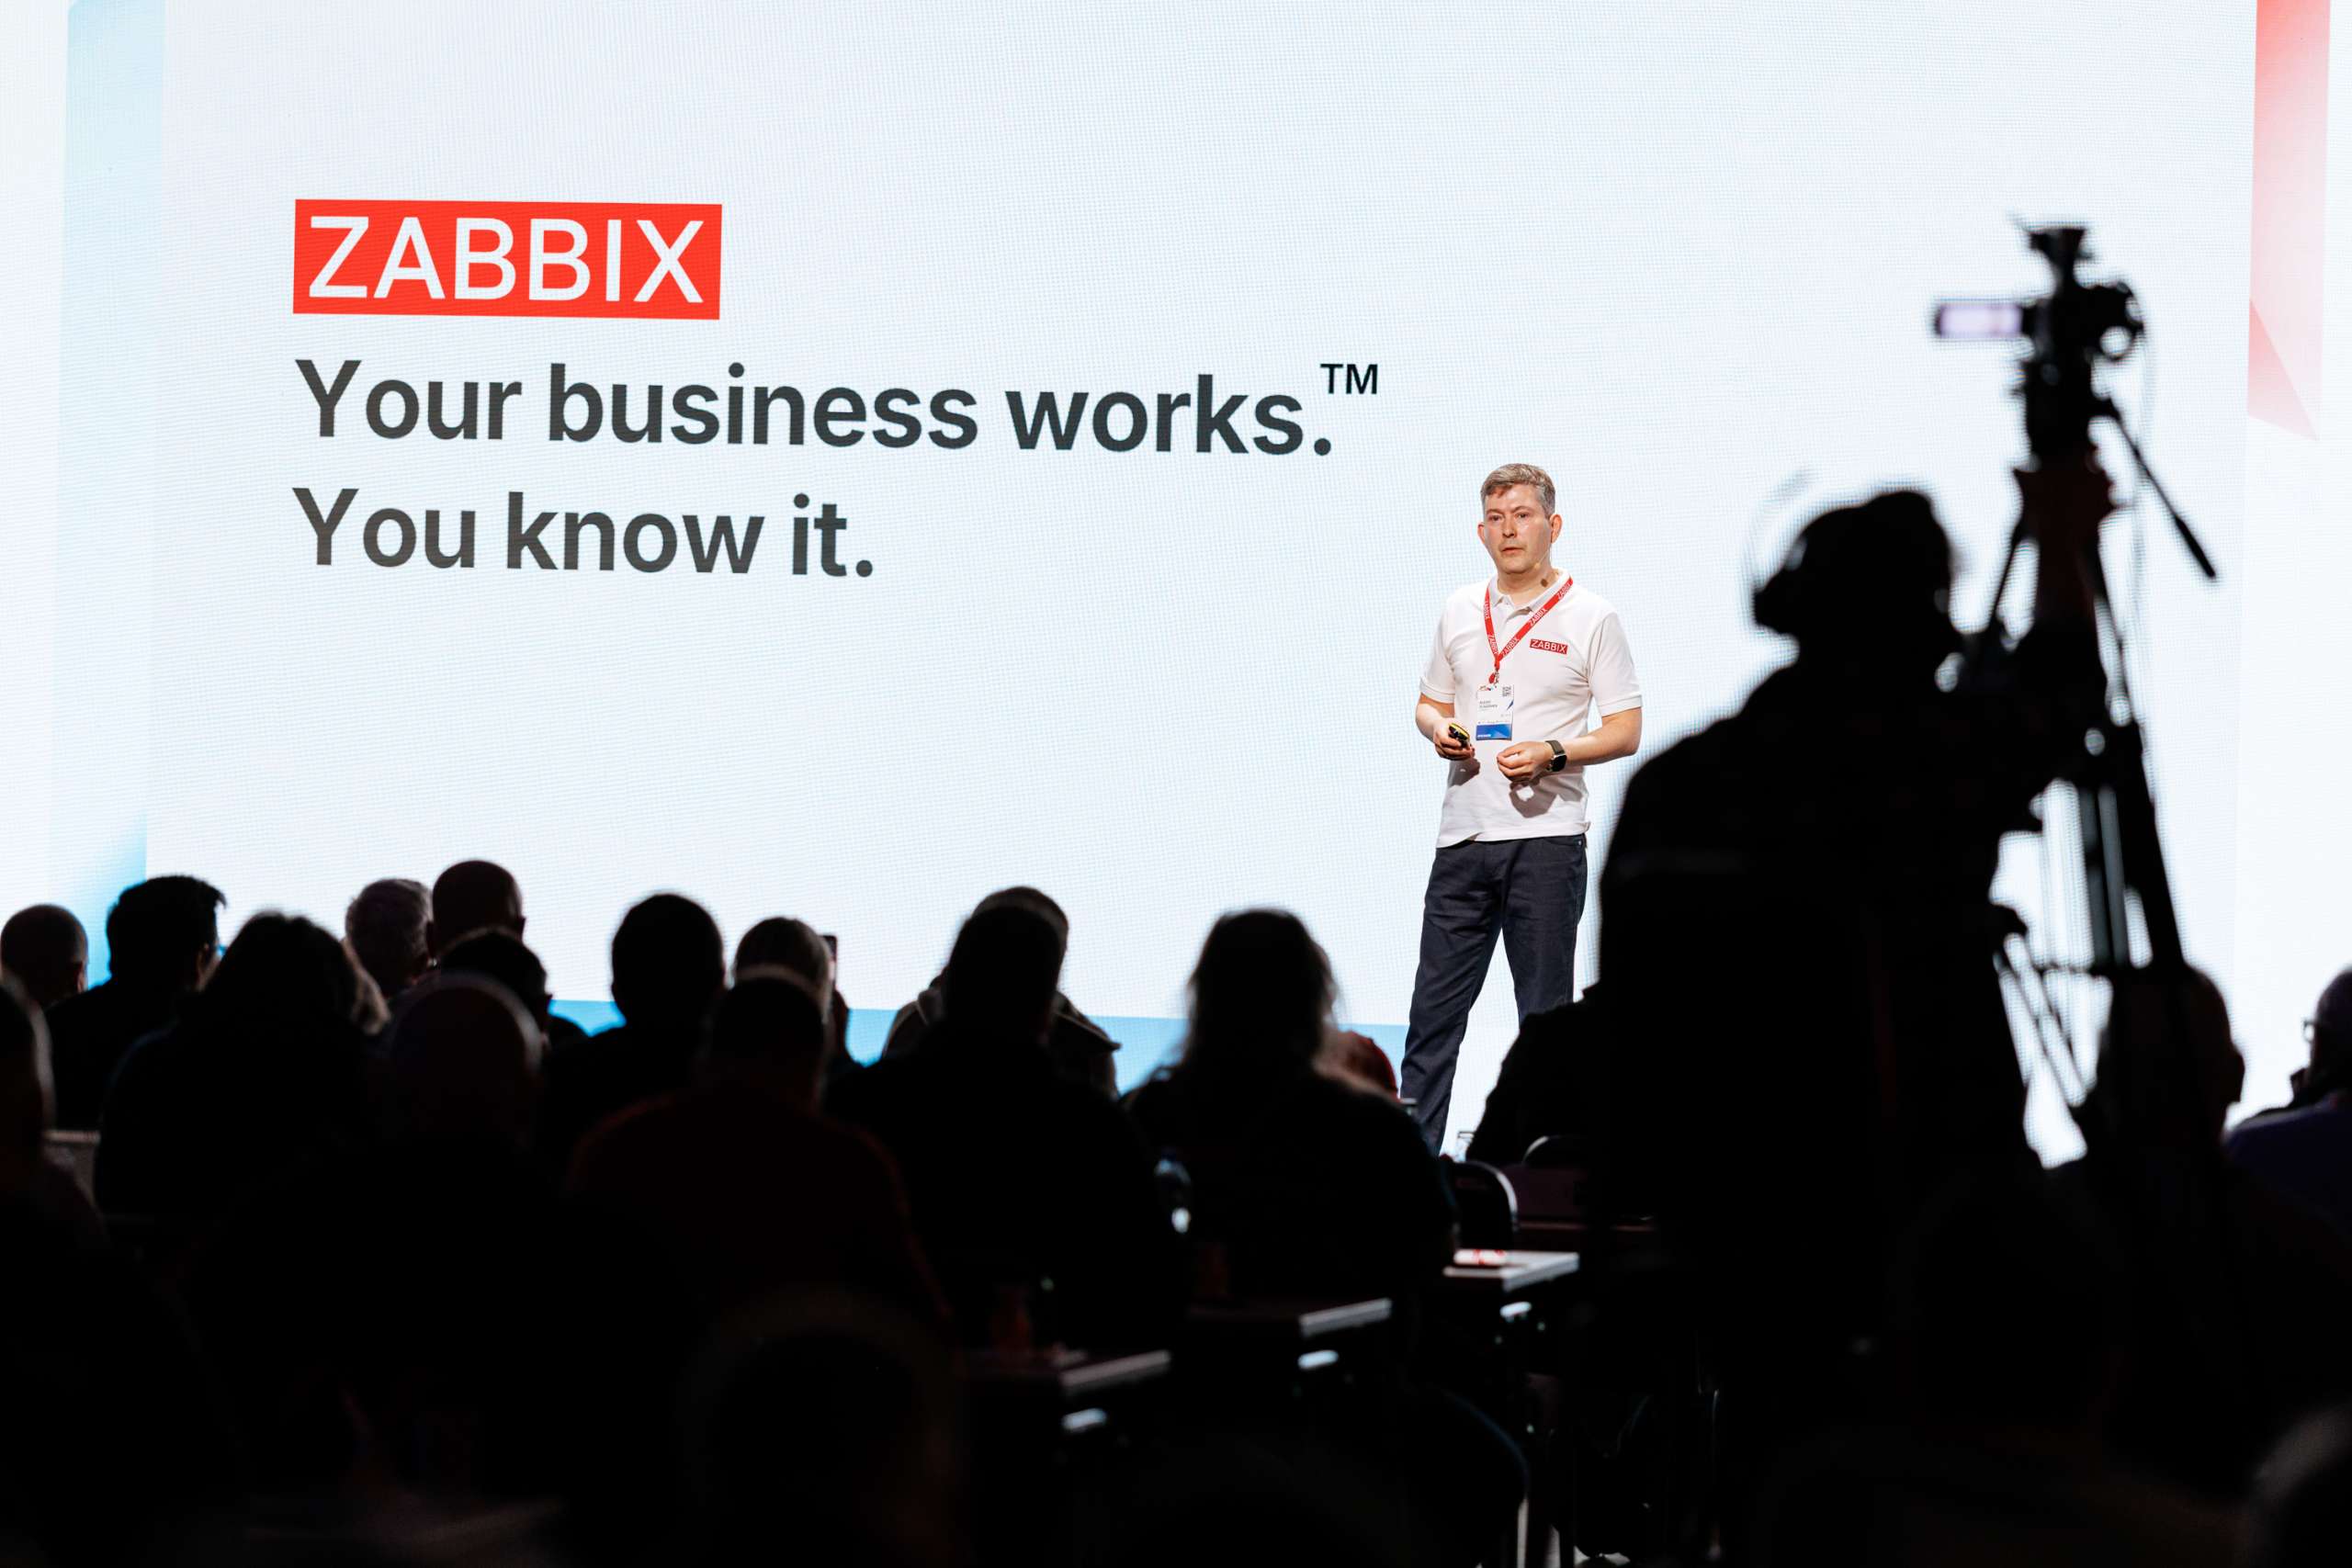
The Summit officially kicked off with Zabbix Founder and CEO Alexei Vladishev’s keynote address, entitled “Zabbix 8.0: A New Chapter in Monitoring.” The address laid out in detail what’s around the corner for Zabbix, including:
- Zabbix Academy – a new learning hub with self-paced, expert-built courses to boost Zabbix skills anytime and from anywhere.
- Zabbix France – Zabbix is acquiring IZI-IT and opening a new office in France to provide localized support and closer collaboration with French clients and partners.
- Zabbix Cloud – a host of new features, including automatic upgrades and backups, plus predictable pricing and simplified user management.
- Zabbix 8.0 LTS (coming in 2026) – a major leap forward with APM and OpenTelemetry for end-to-end visibility, Complex Event Processing (CEP) and AI-based correlation, plus new UI & visualizations for a smoother experience.
- Zabbix Mobile App – coming with 8.0 LTS for iOS & Android, the app will offer instant push notifications, issue management, collaboration, seamless connection with Zabbix Cloud, and multi-server views in your pocket.
- Zabbix Marketplace (2026) – A new global space to connect Zabbix users with vendor and partner solutions, Zabbix Marketplace will extend the power of Zabbix beyond our core product.
Next up was initMAX Founder and CEO Tomáš Heřmánek, who showed how to turn physical sensor data from analog inputs into Zabbix metrics with budget hardware and integrations, complete with templates and triggers.
Another crowd-pleasing session reached the audience thanks to Richard Germanus of CANCOM, who shared the story of how CANCOM consolidated six monitoring systems into one, managing approximately 30,000 hosts, deploying 162 Zabbix proxies, standardizing templates, integrating Power BI for dashboards, automating with APIs, and offering monitoring-as-a-service.
Shortly thereafter, a lightning talk by SEB Bank’s Giedrius Stasiulionis explored “Monitoring Sounds with Zabbix” – in other words, converting audio and sound waves into meaningful metrics, a fresh and inventive notion.
The day’s other lightning talk, “Monitor Your Nearby Areas and Events with Zabbix” by longtime Summit fixture and Zabbix superfan Janne Pikkarainen, showed how anyone can use Zabbix to centralize event data like train timetables, traffic patterns, or cinema showtimes.
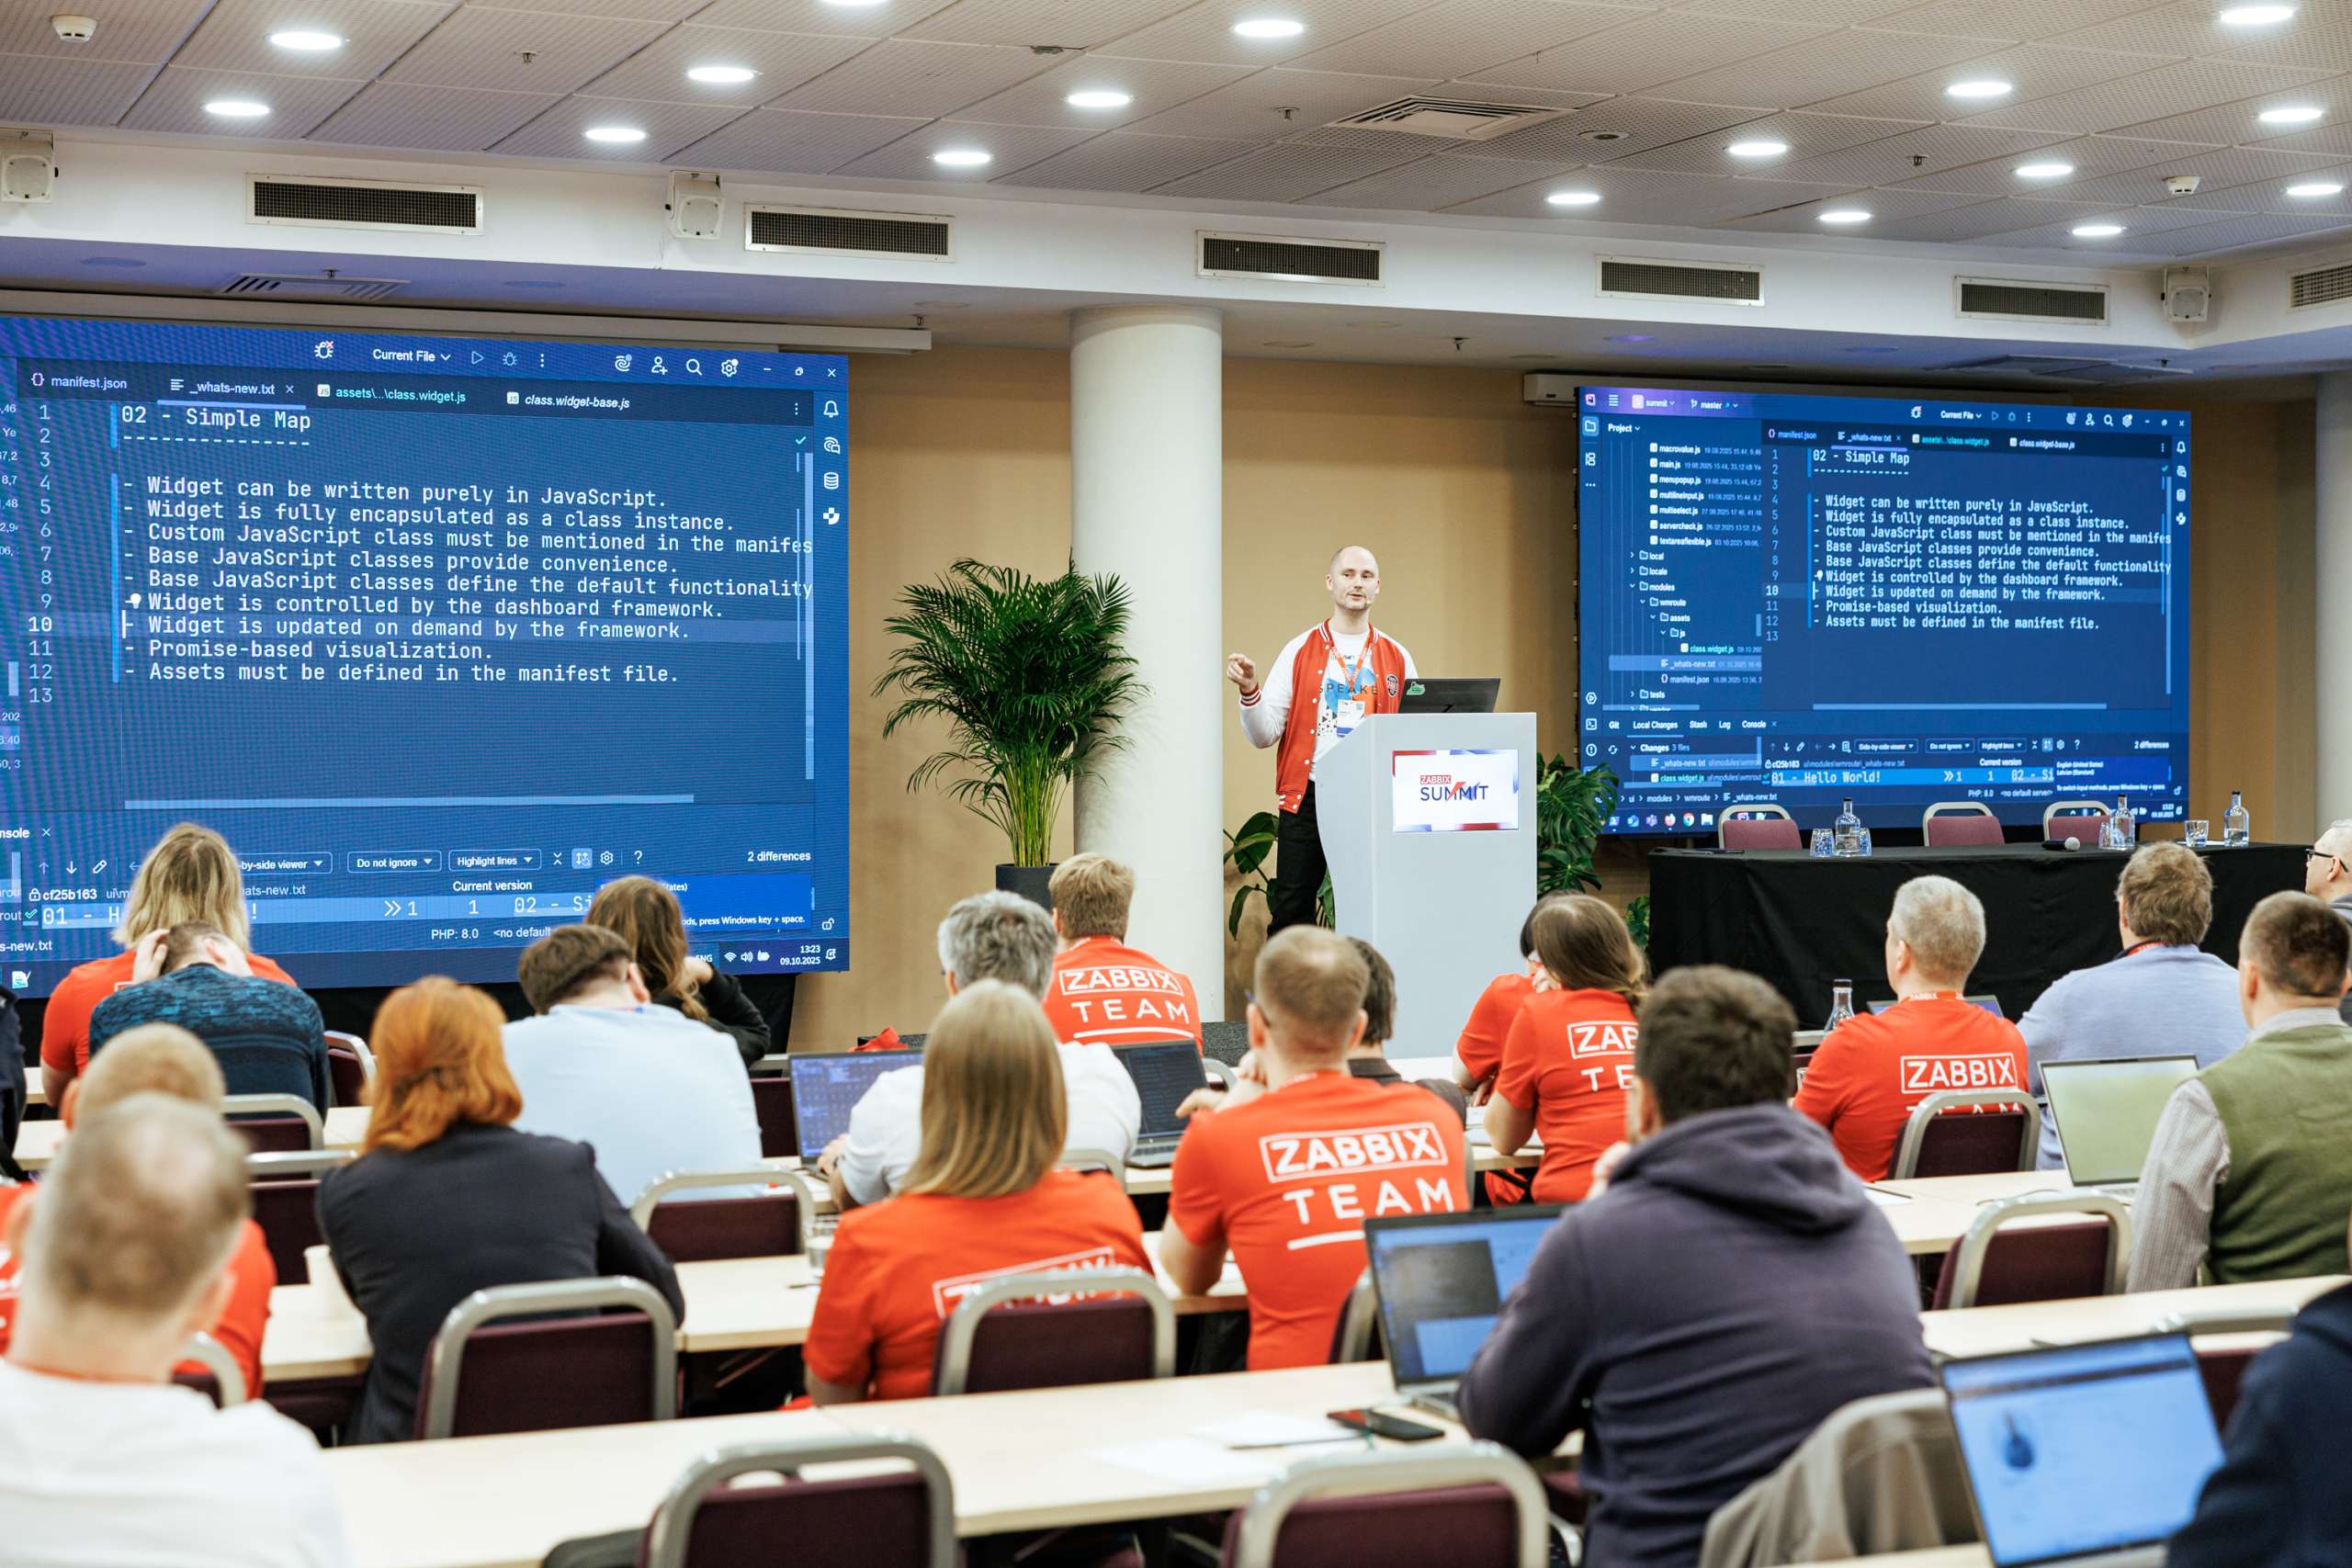
Developer track: Something for everyone
Meanwhile, the Summit Developer track was full of special sessions for builders and extension authors, such as “Extend Zabbix Agent 2 with Your Plugin”, which saw Senior Golang Developer Eriks Sneiders show an appreciative audience how Zabbix agent 2’s plugin architecture works, how to use existing plugins, and how to build brand-new custom ones.
Other topics in the Developer track included template design, advanced scripting, API tips, and internal tooling, giving Zabbix techies some food for thought and hopefully sparking a batch of fresh ideas!
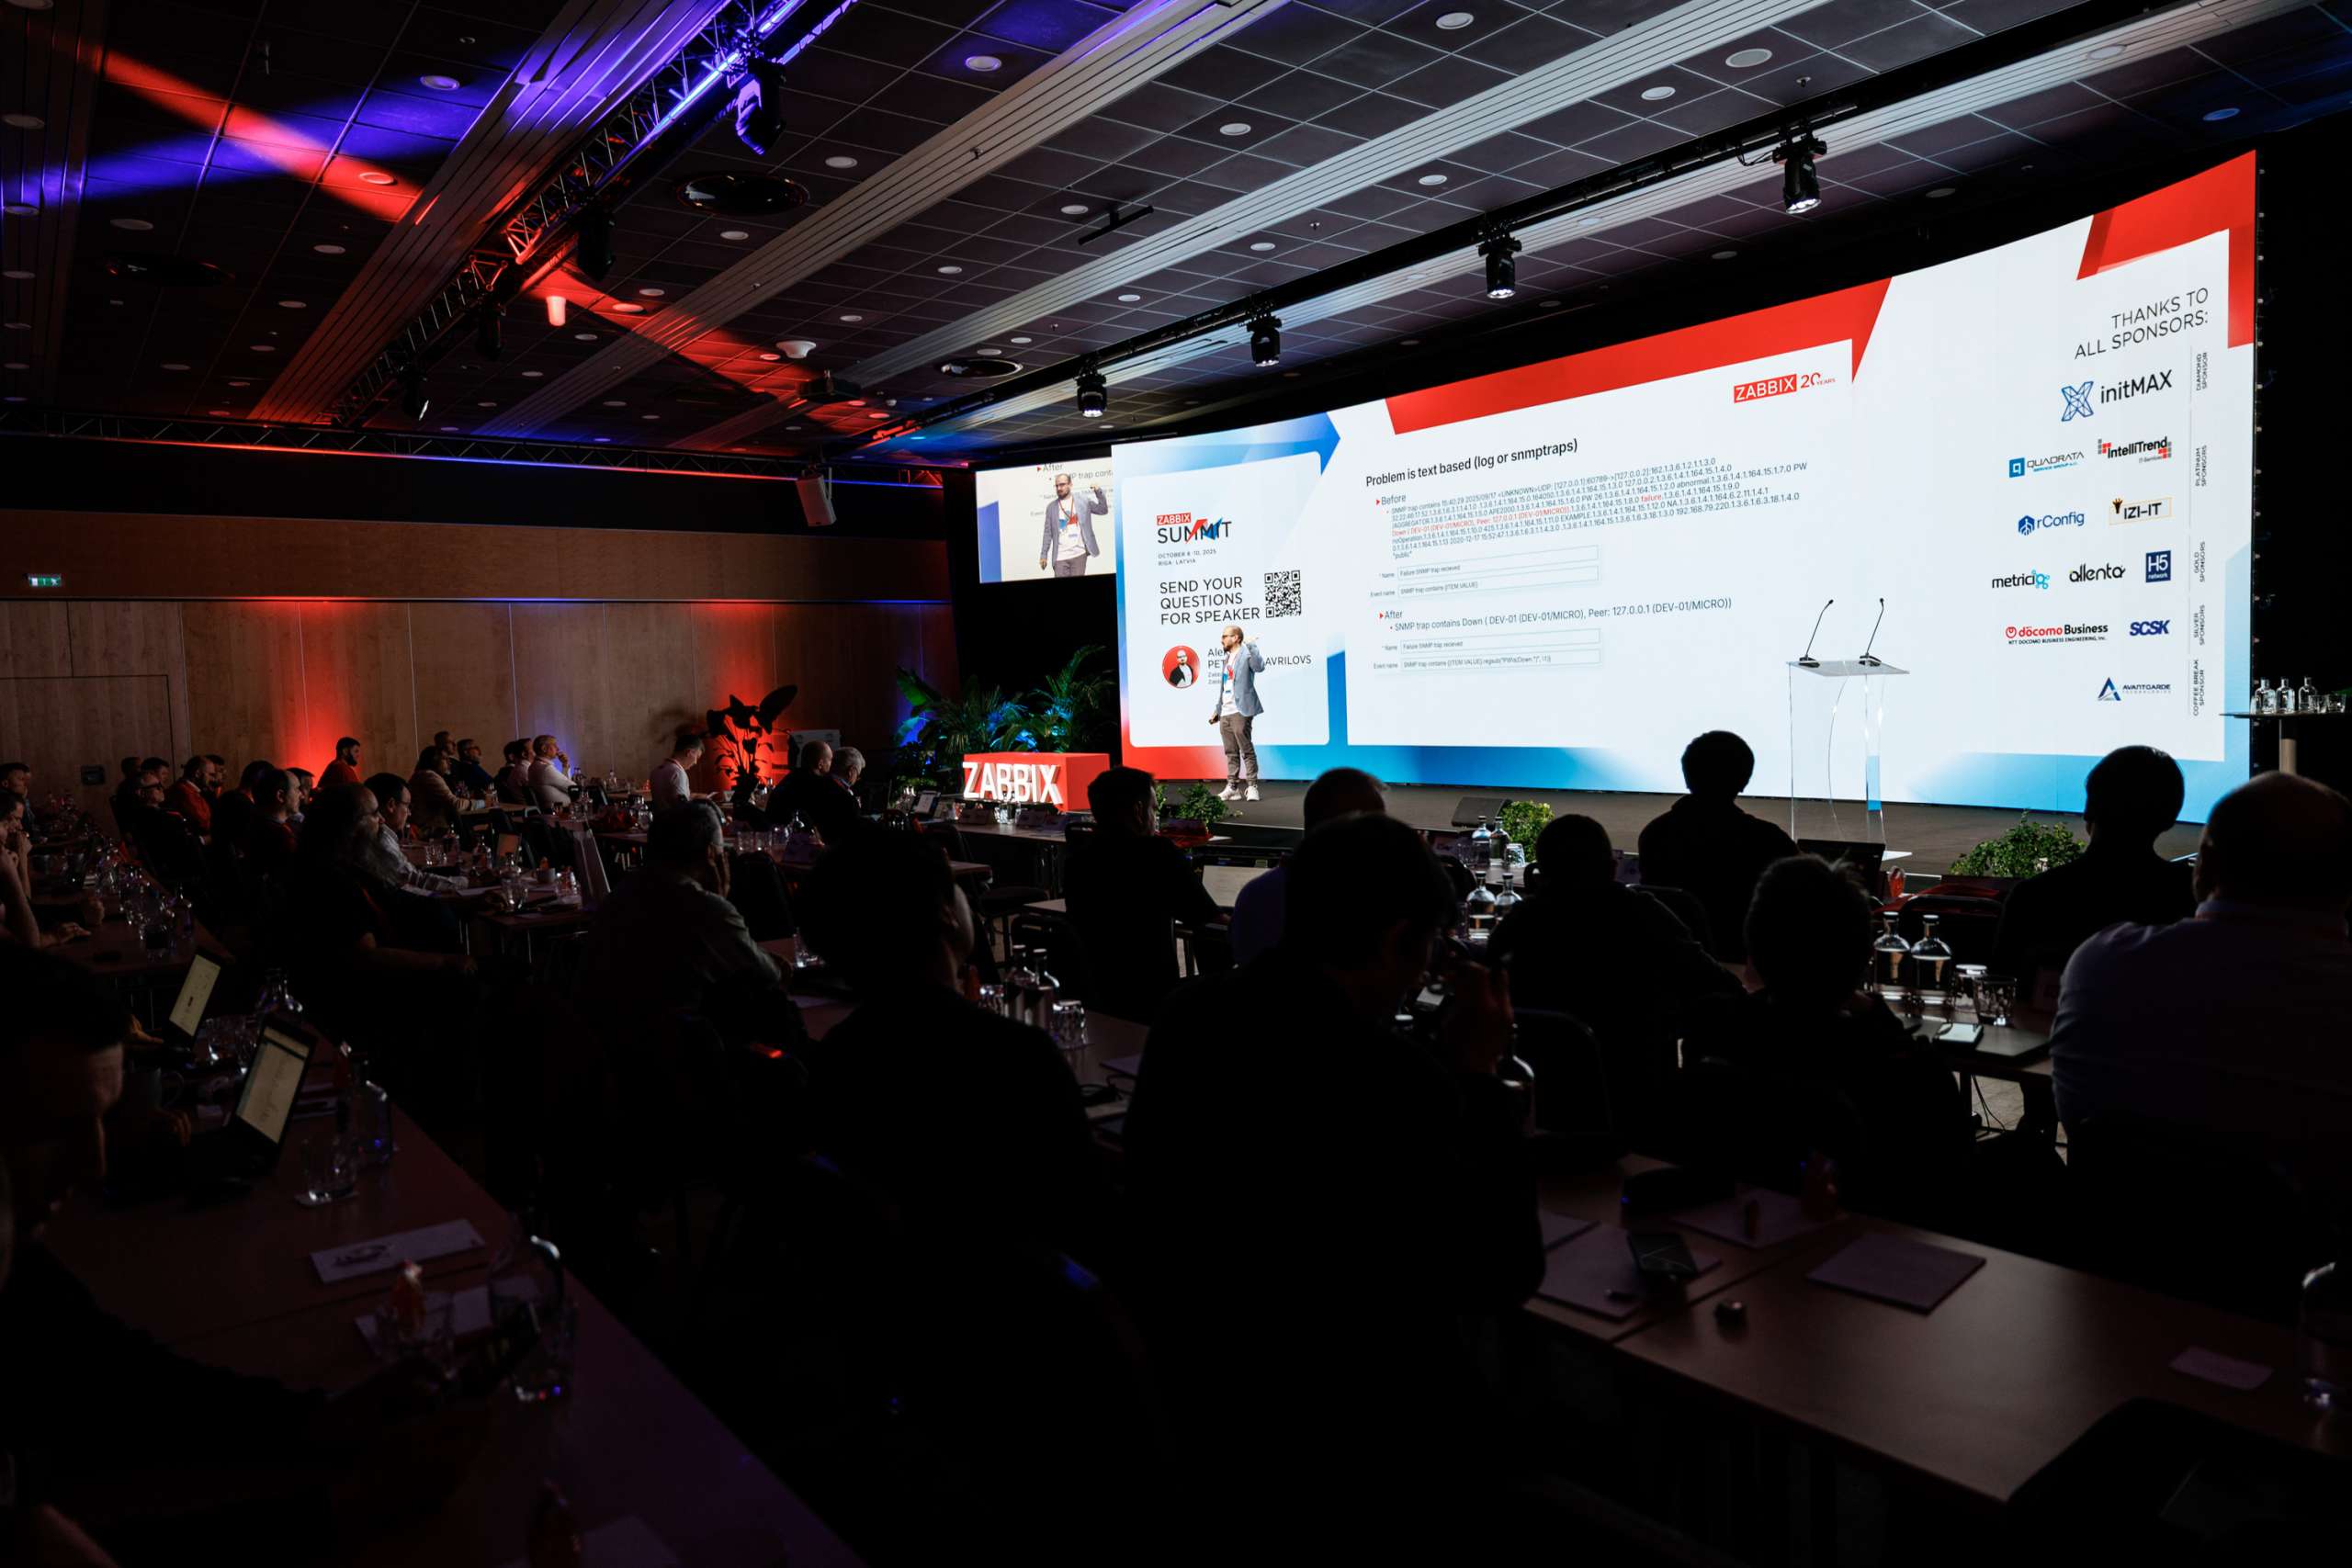
Day 2: Showing the big picture
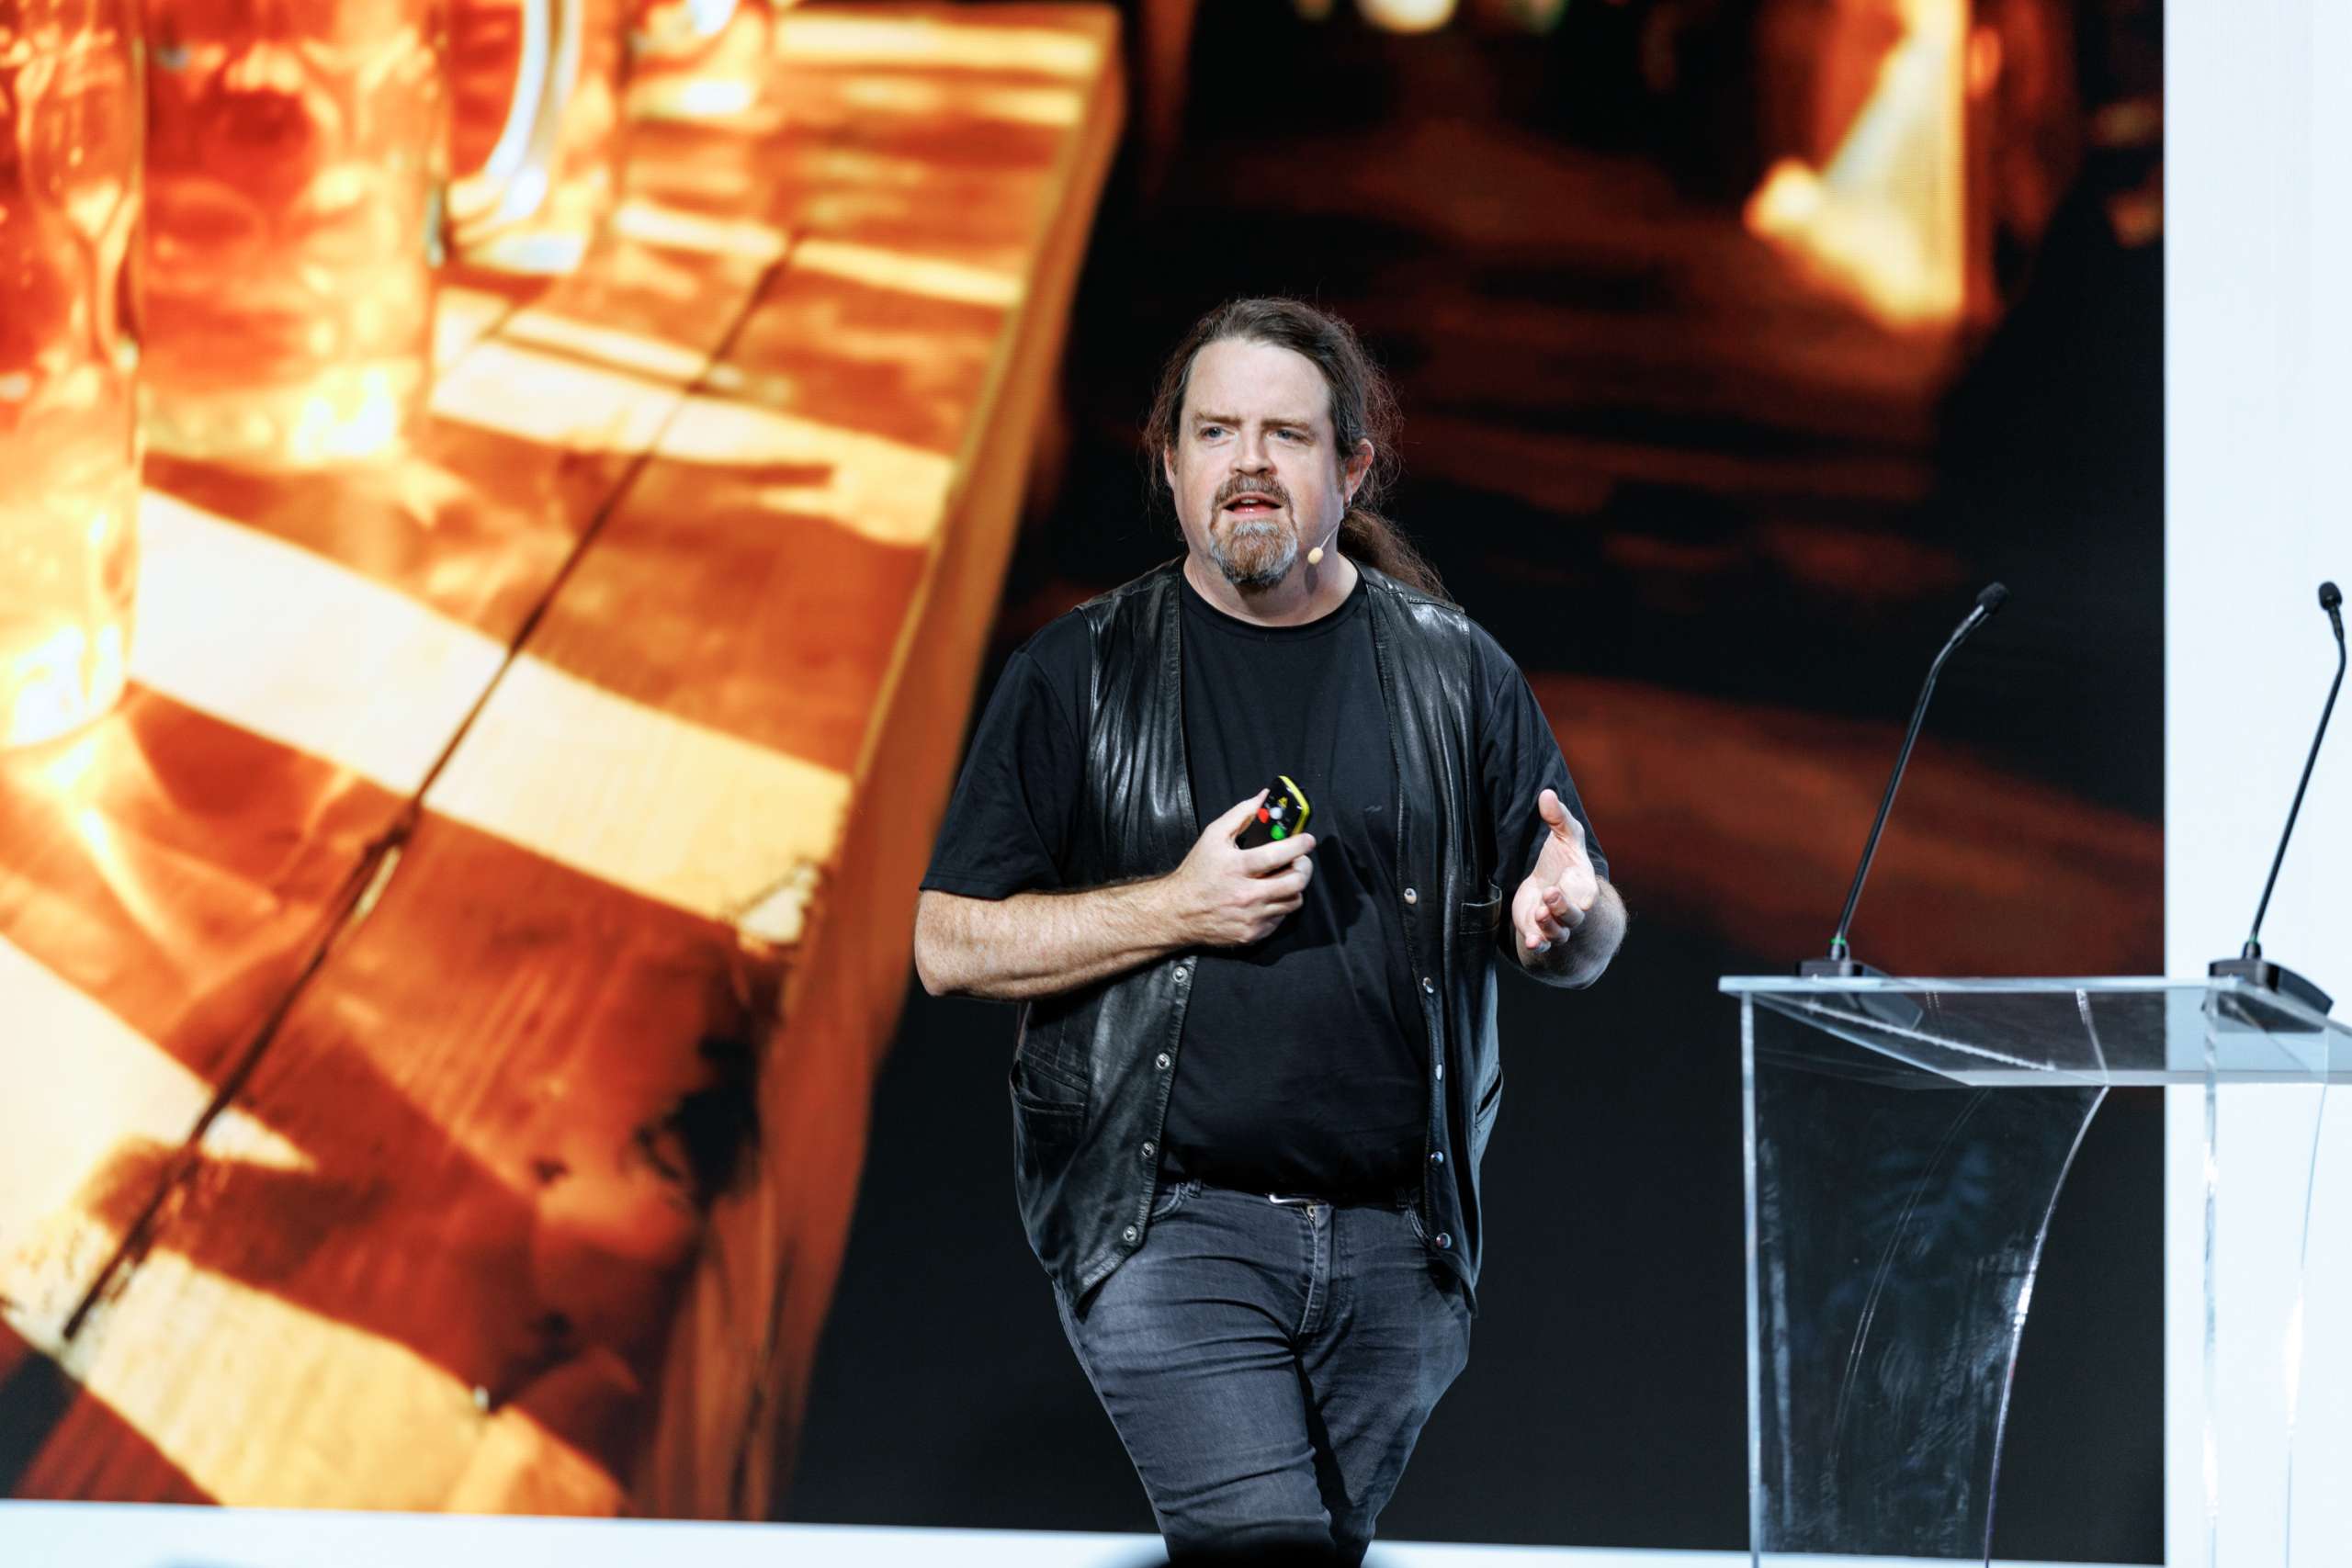
After a long first day and night, Zabbix Summit 2025’s special guest Dylan Beattie made some noise and woke everyone up with a talk entitled “Open Source, Open Mind: The Cost of Free Software.”
Dylan took the Summit audience on a journey through the history and philosophy of free and open source software, touching on questions about licensing issues, looking at the motivations of developers, discussing edge cases and challenges, and asking whether truly sustainable open-source ecosystems can exist.
Later, Inqbeo Founder Christian Anton shared a system in which a central Zabbix instance serves multiple tenants, with the architecture leveraging Kafka to stream metric data partitioned per tenant, storing results in S3 (in Prometheus format), and visualizing via Grafana. This enables isolation and the creation of custom dashboards.
Other main-stage sessions tackled topics like scaling Zabbix, managing large datasets, tag and template strategies, and AI/automation in monitoring.
Connecting people with the Community track
Zabbix Summit 2025 also introduced a Community track, a dedicated space at Zabbix where users, enthusiasts, and contributors could share ideas and shape the future of Zabbix. Instead of deeply technical or development-level presentations, this track focused on community-driven topics like integrations, templates, connectors, media types, and open resources.
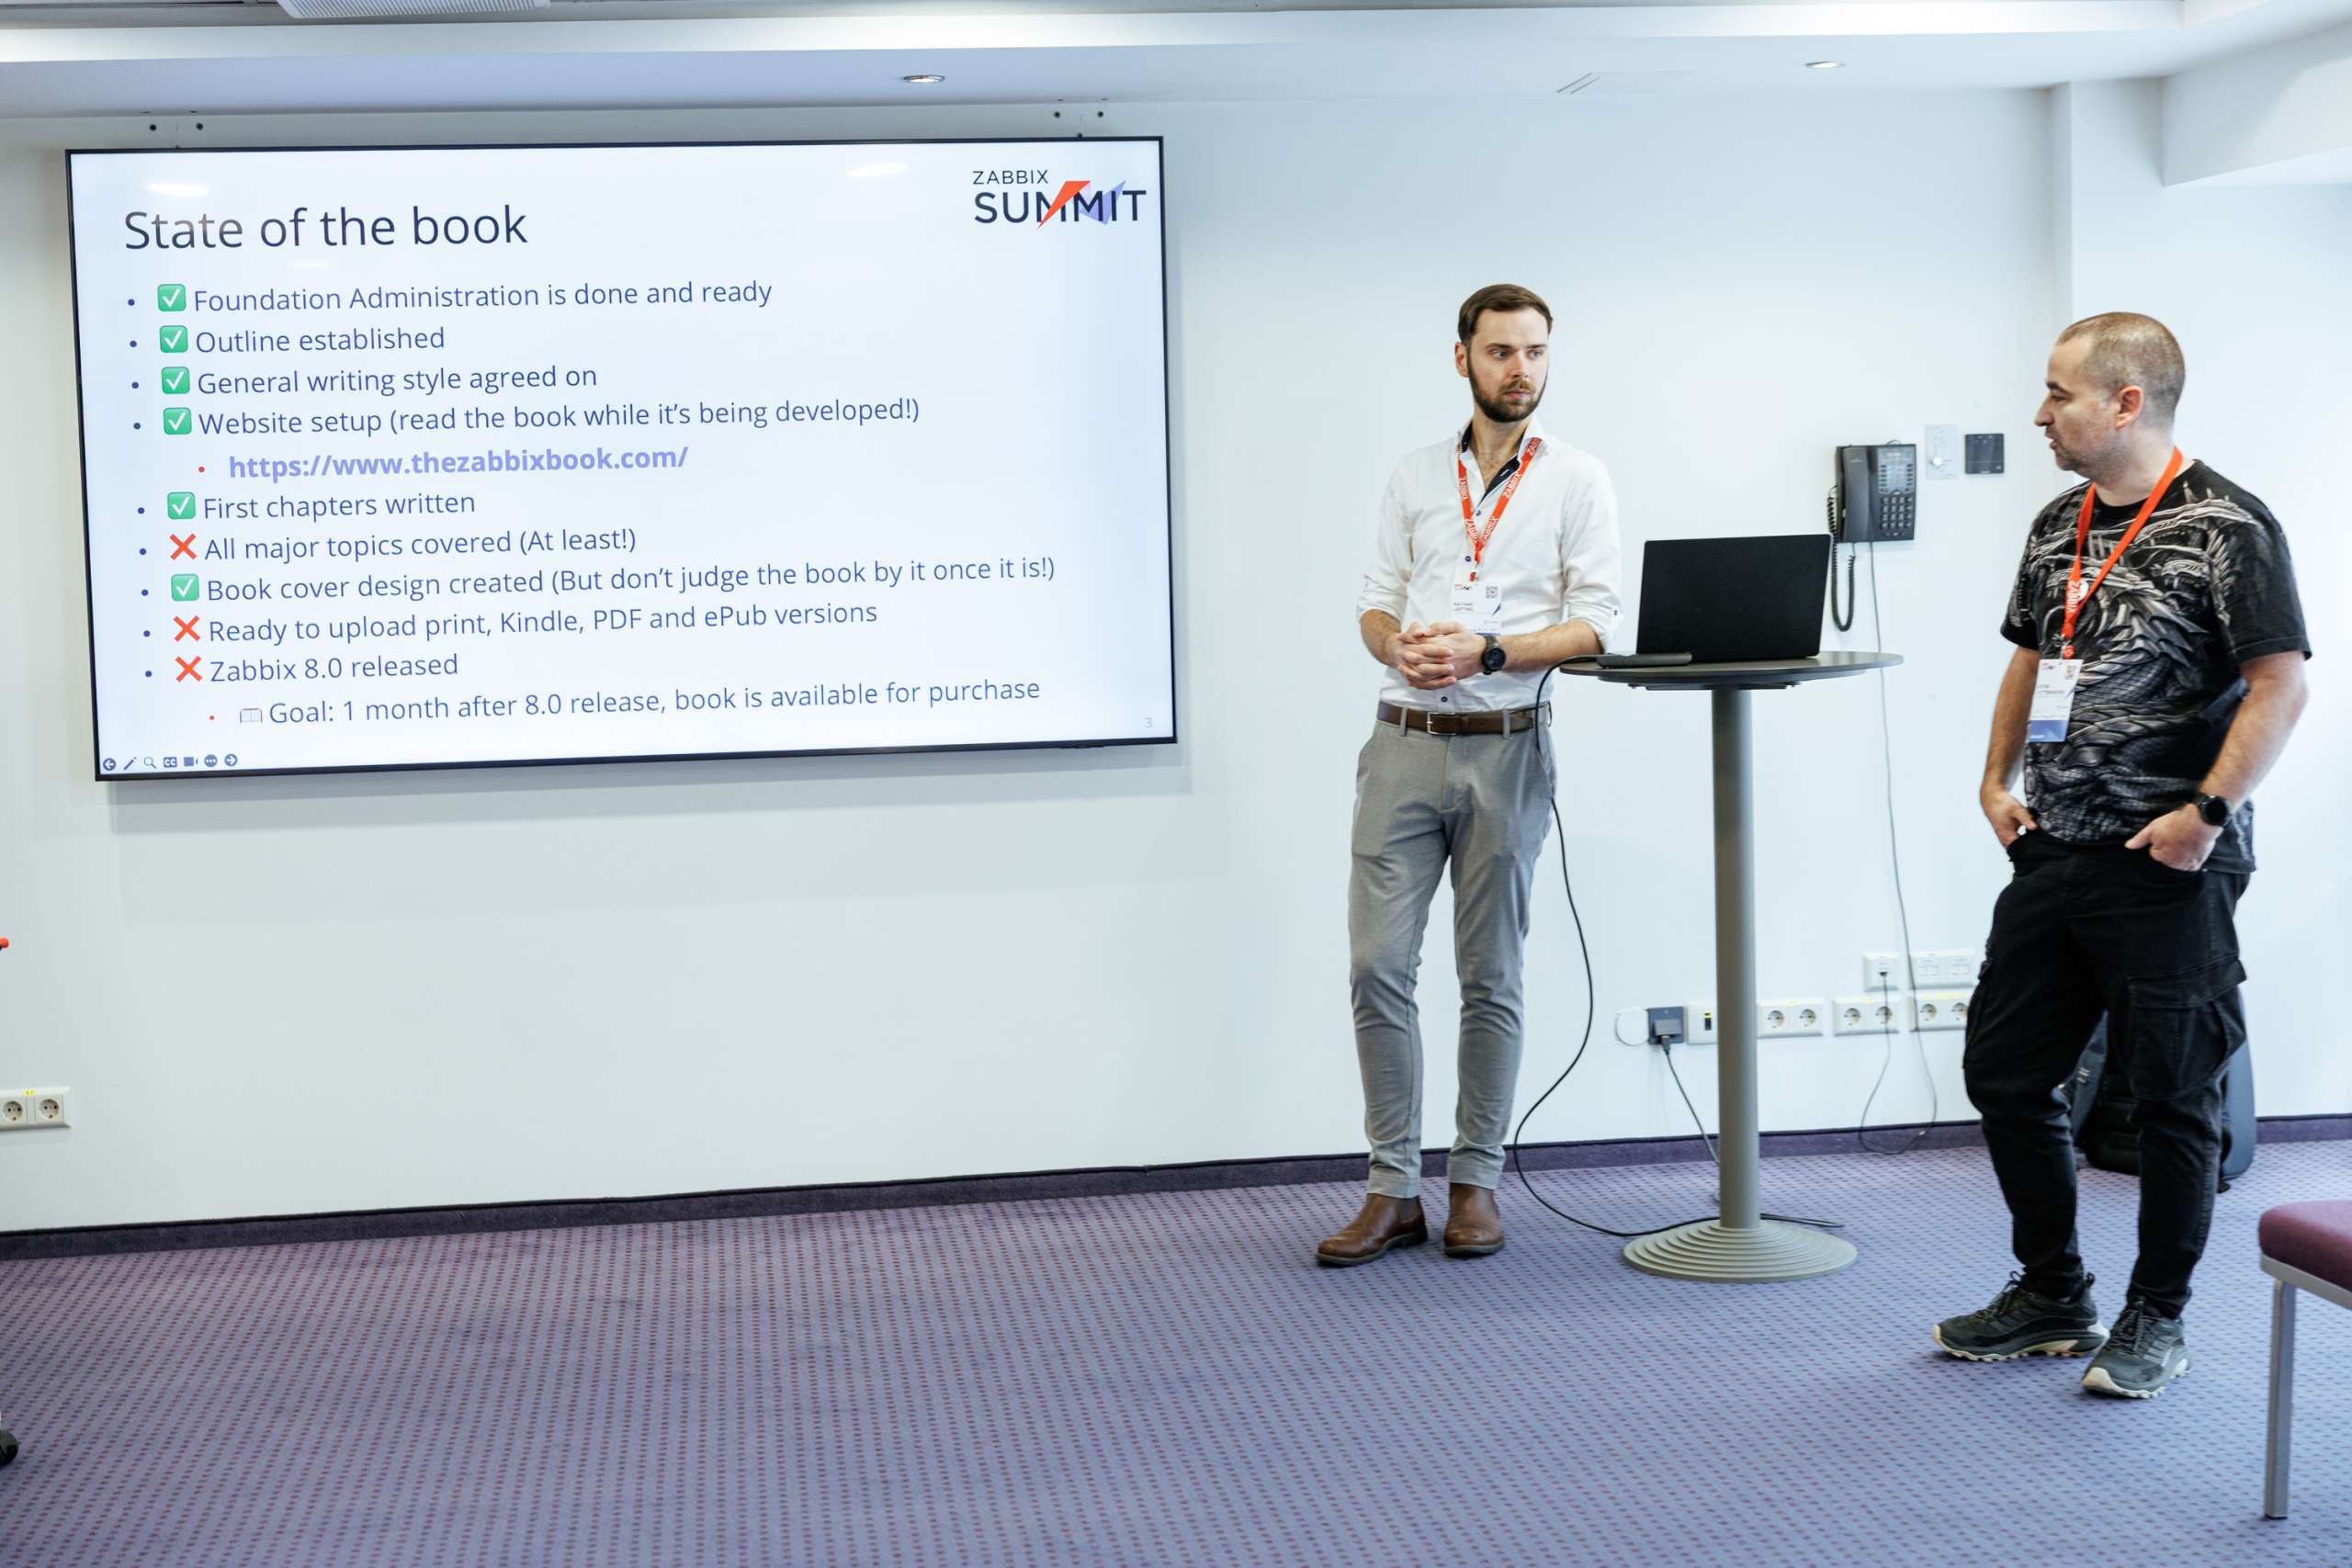
A key highlight was the “Zabbix Book Breakout Room”, led by Alexei Vladishev himself along with longtime community members Patrik Uytterhoeven, Brian van Baekel, and Nathan Liefting. Zabbix users were able to brainstorm ideas for new chapters, missing topics, translations, and community contributions to the online Zabbix Book.
Turning ideas into action
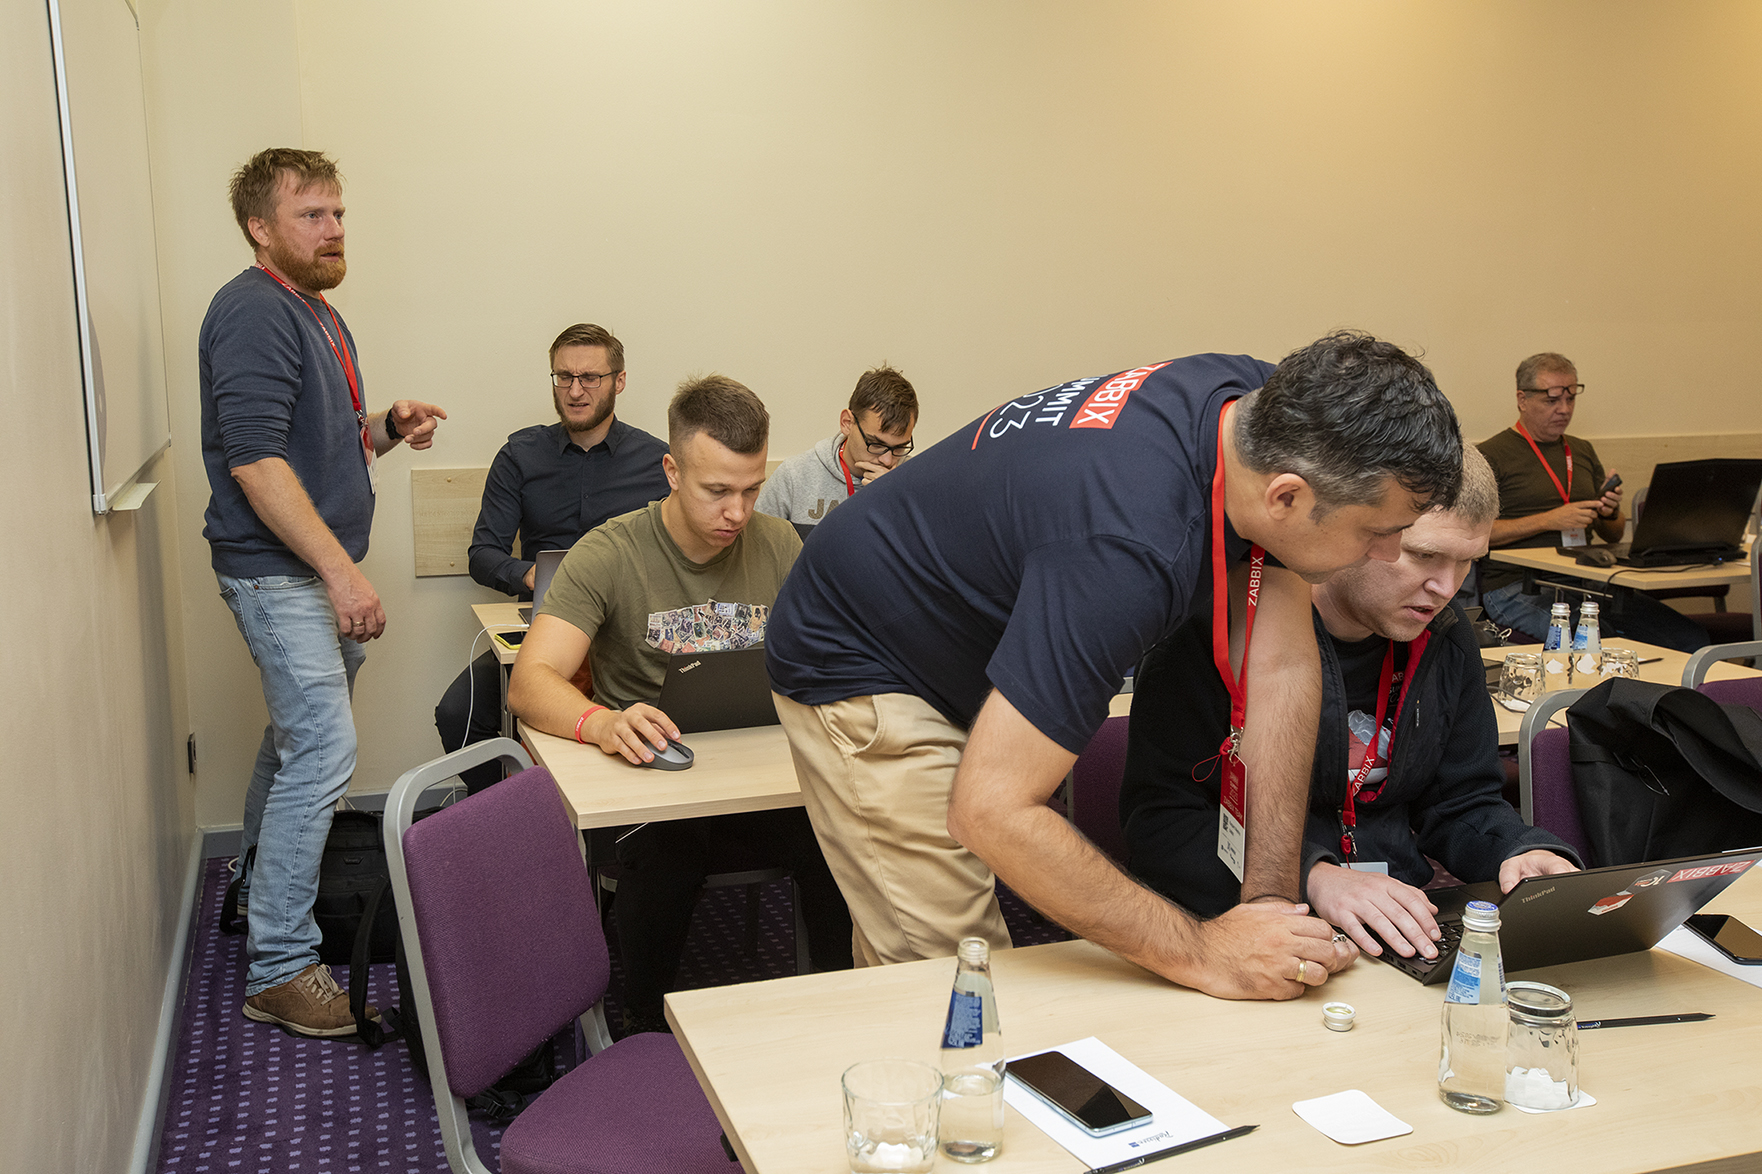
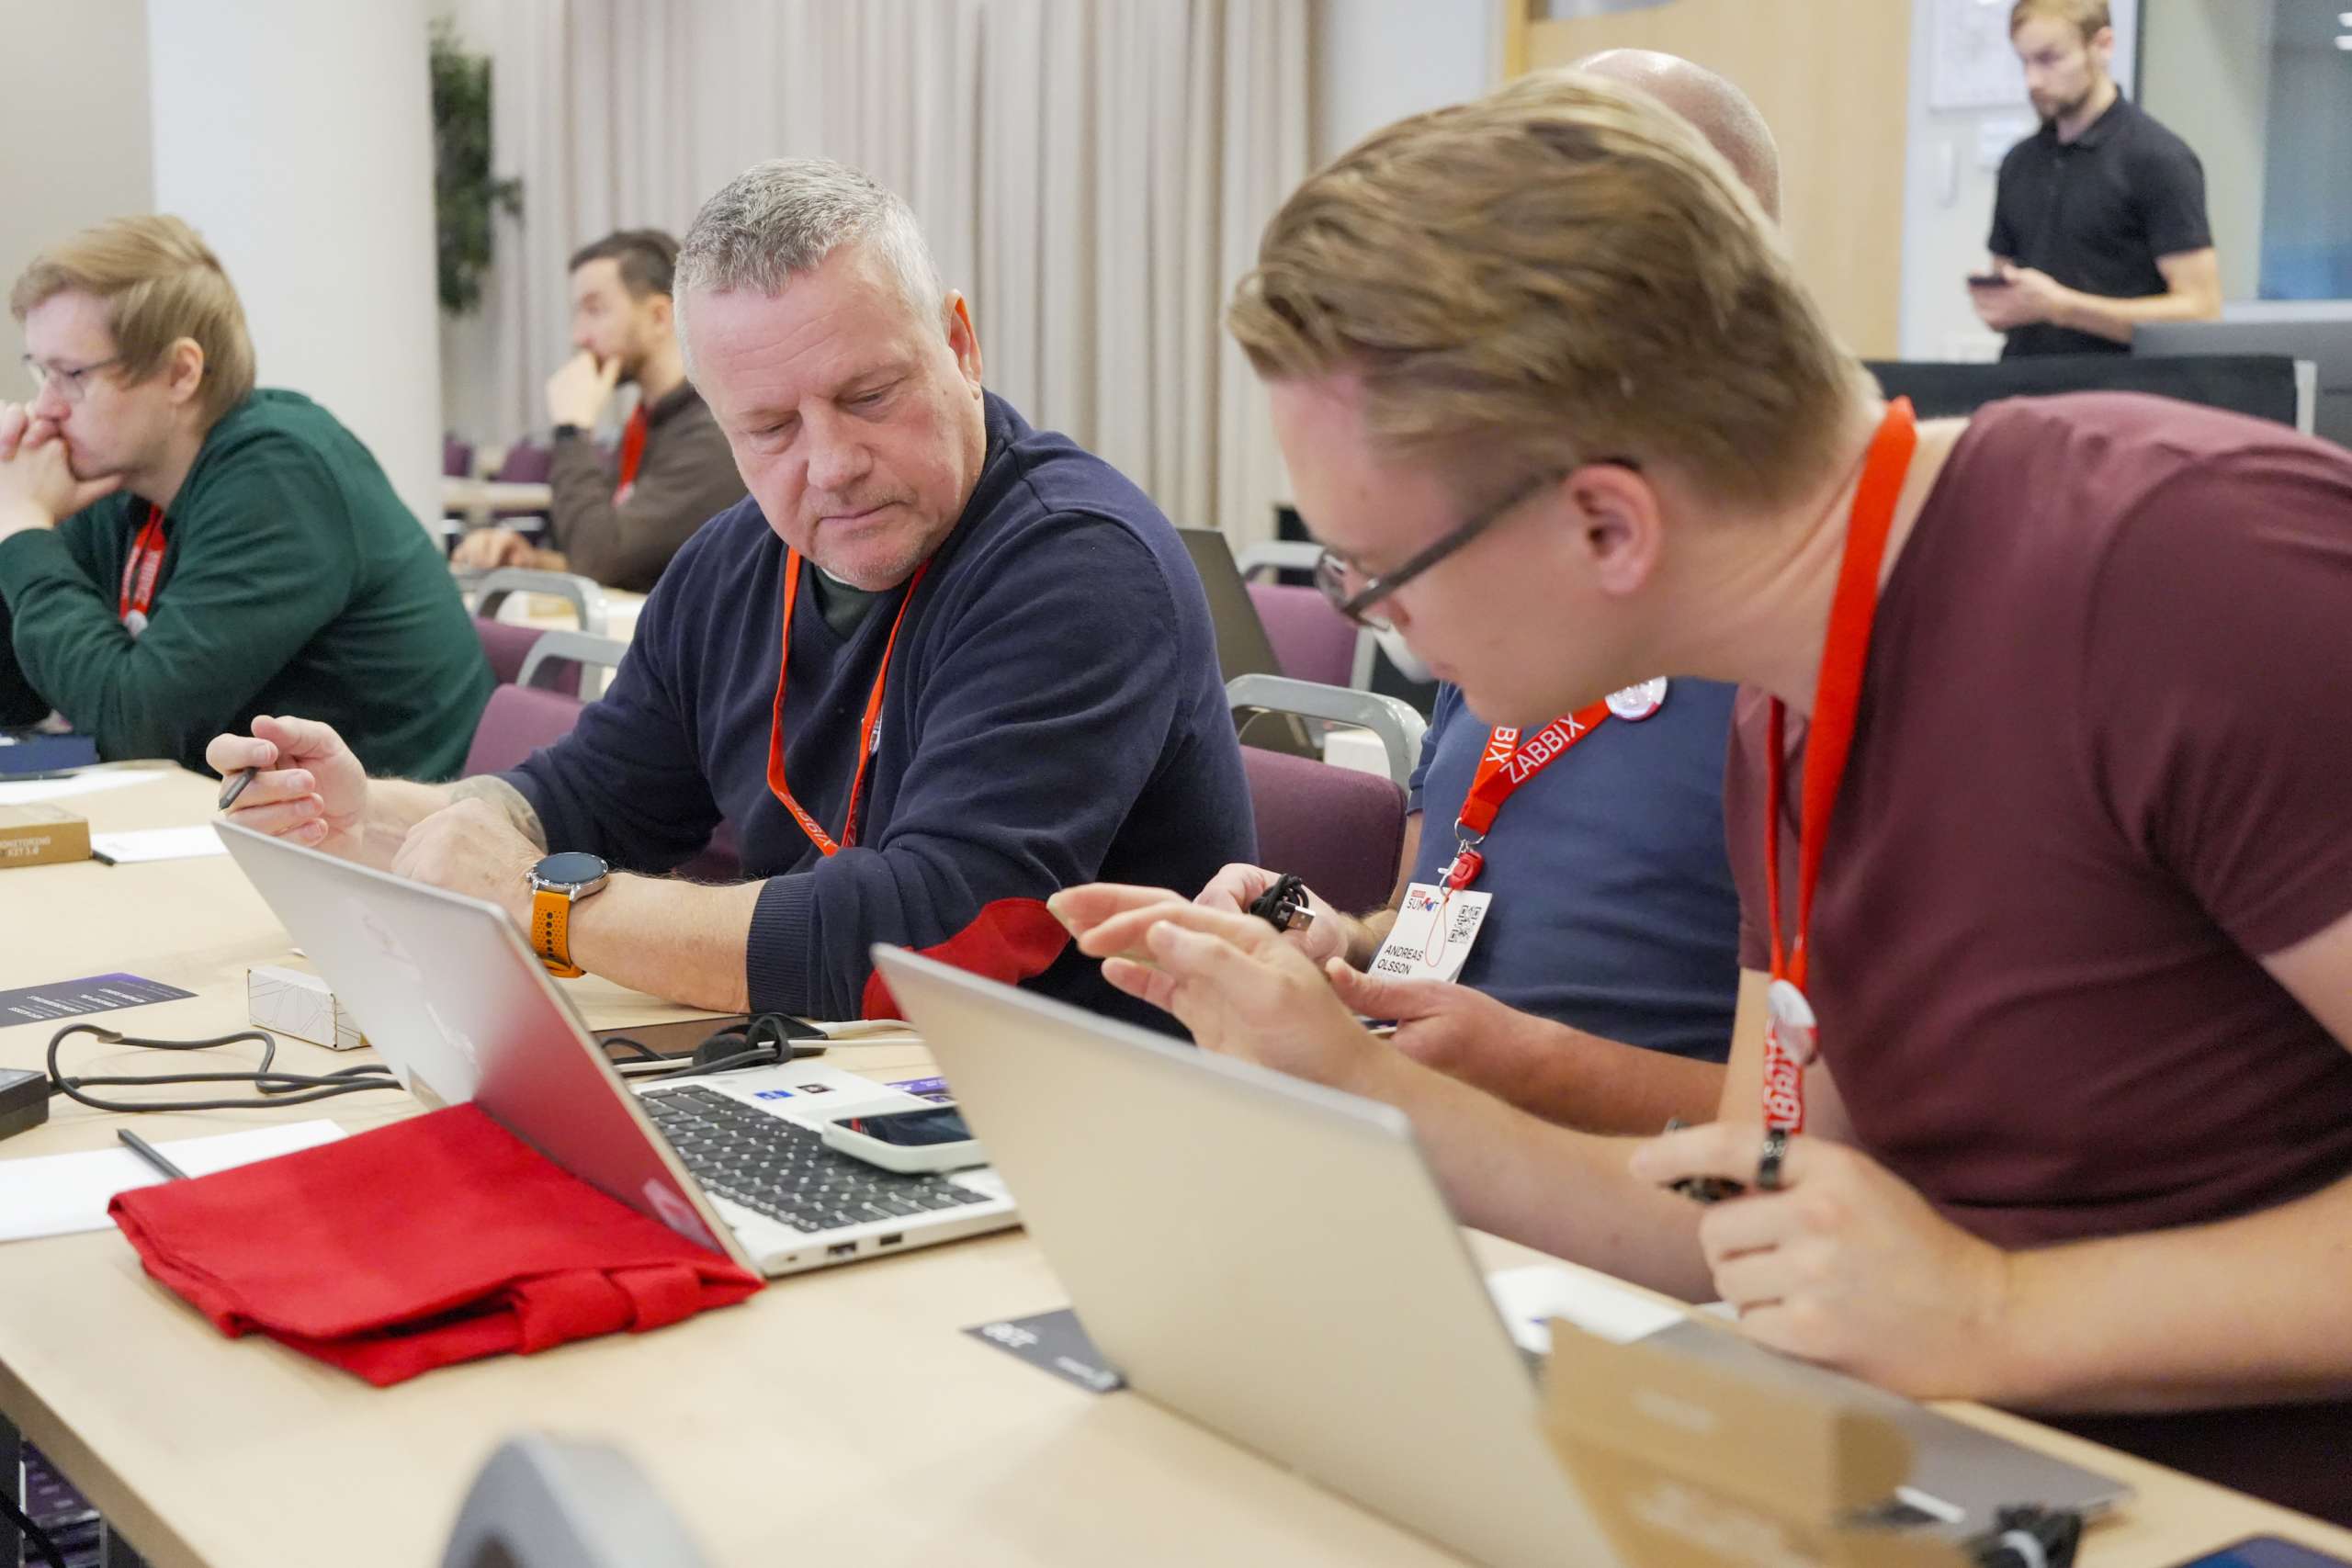
Day 2 was also full of hands-on workshops, including a fascinating one from the team at initMAX that was based on their day 1 presentation. Participants got kits with an ESP32 board, a camera, a 3D-printed counter mount, and a few other odds and ends. They were then guided step-by-step as they integrated the device into Zabbix, built monitoring scenarios, and used AI models to interpret camera images.
Meanwhile, the Summit also hosted training and certification exams before, during, and after the main event. Attendees could take courses like Automation & Integration with API, Database Monitoring, SNMP Monitoring, and level-up exams (Specialist and Professional) at discounted rates.
A different kind of networking
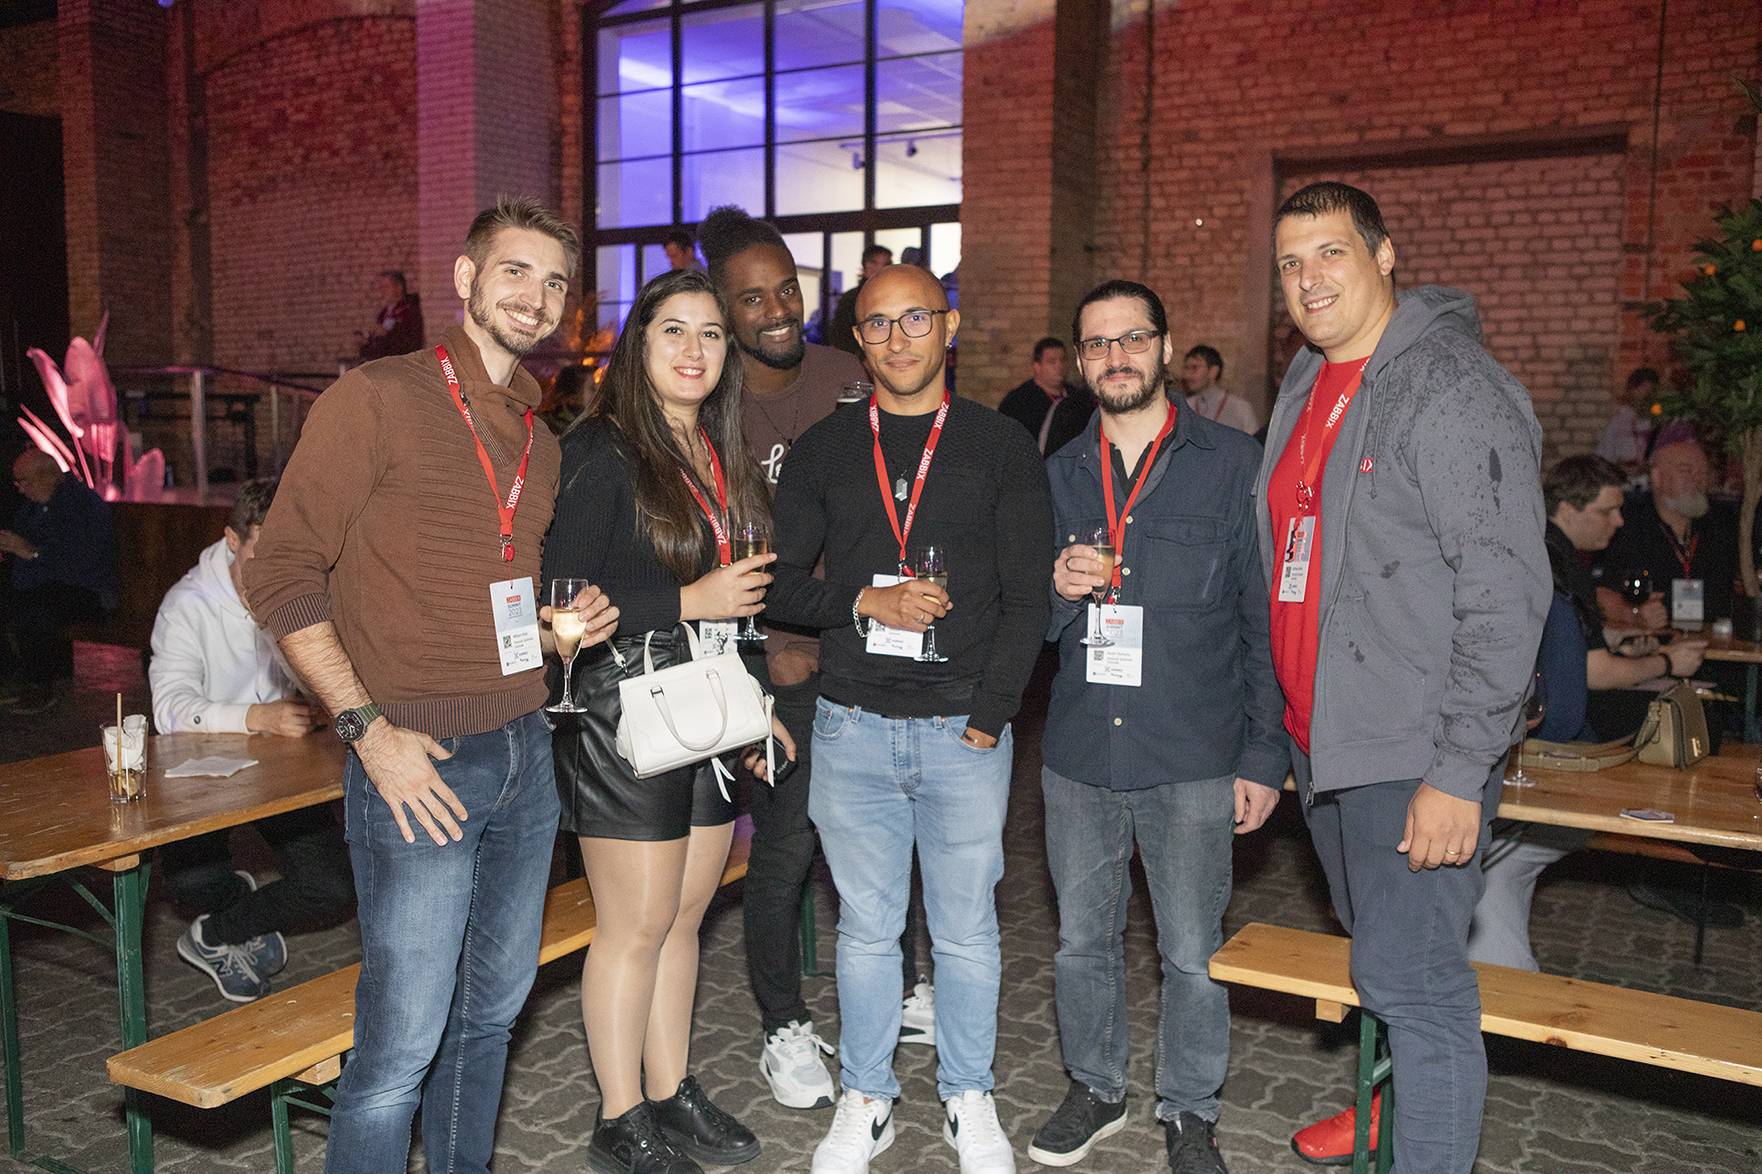
One of the things that makes the Zabbix Summit experience so special is the depth of the networking experience – there’s no awkward small talk or simple business card exchanges here, but rather a series of real connections made, deals closed, and new partnerships cemented.
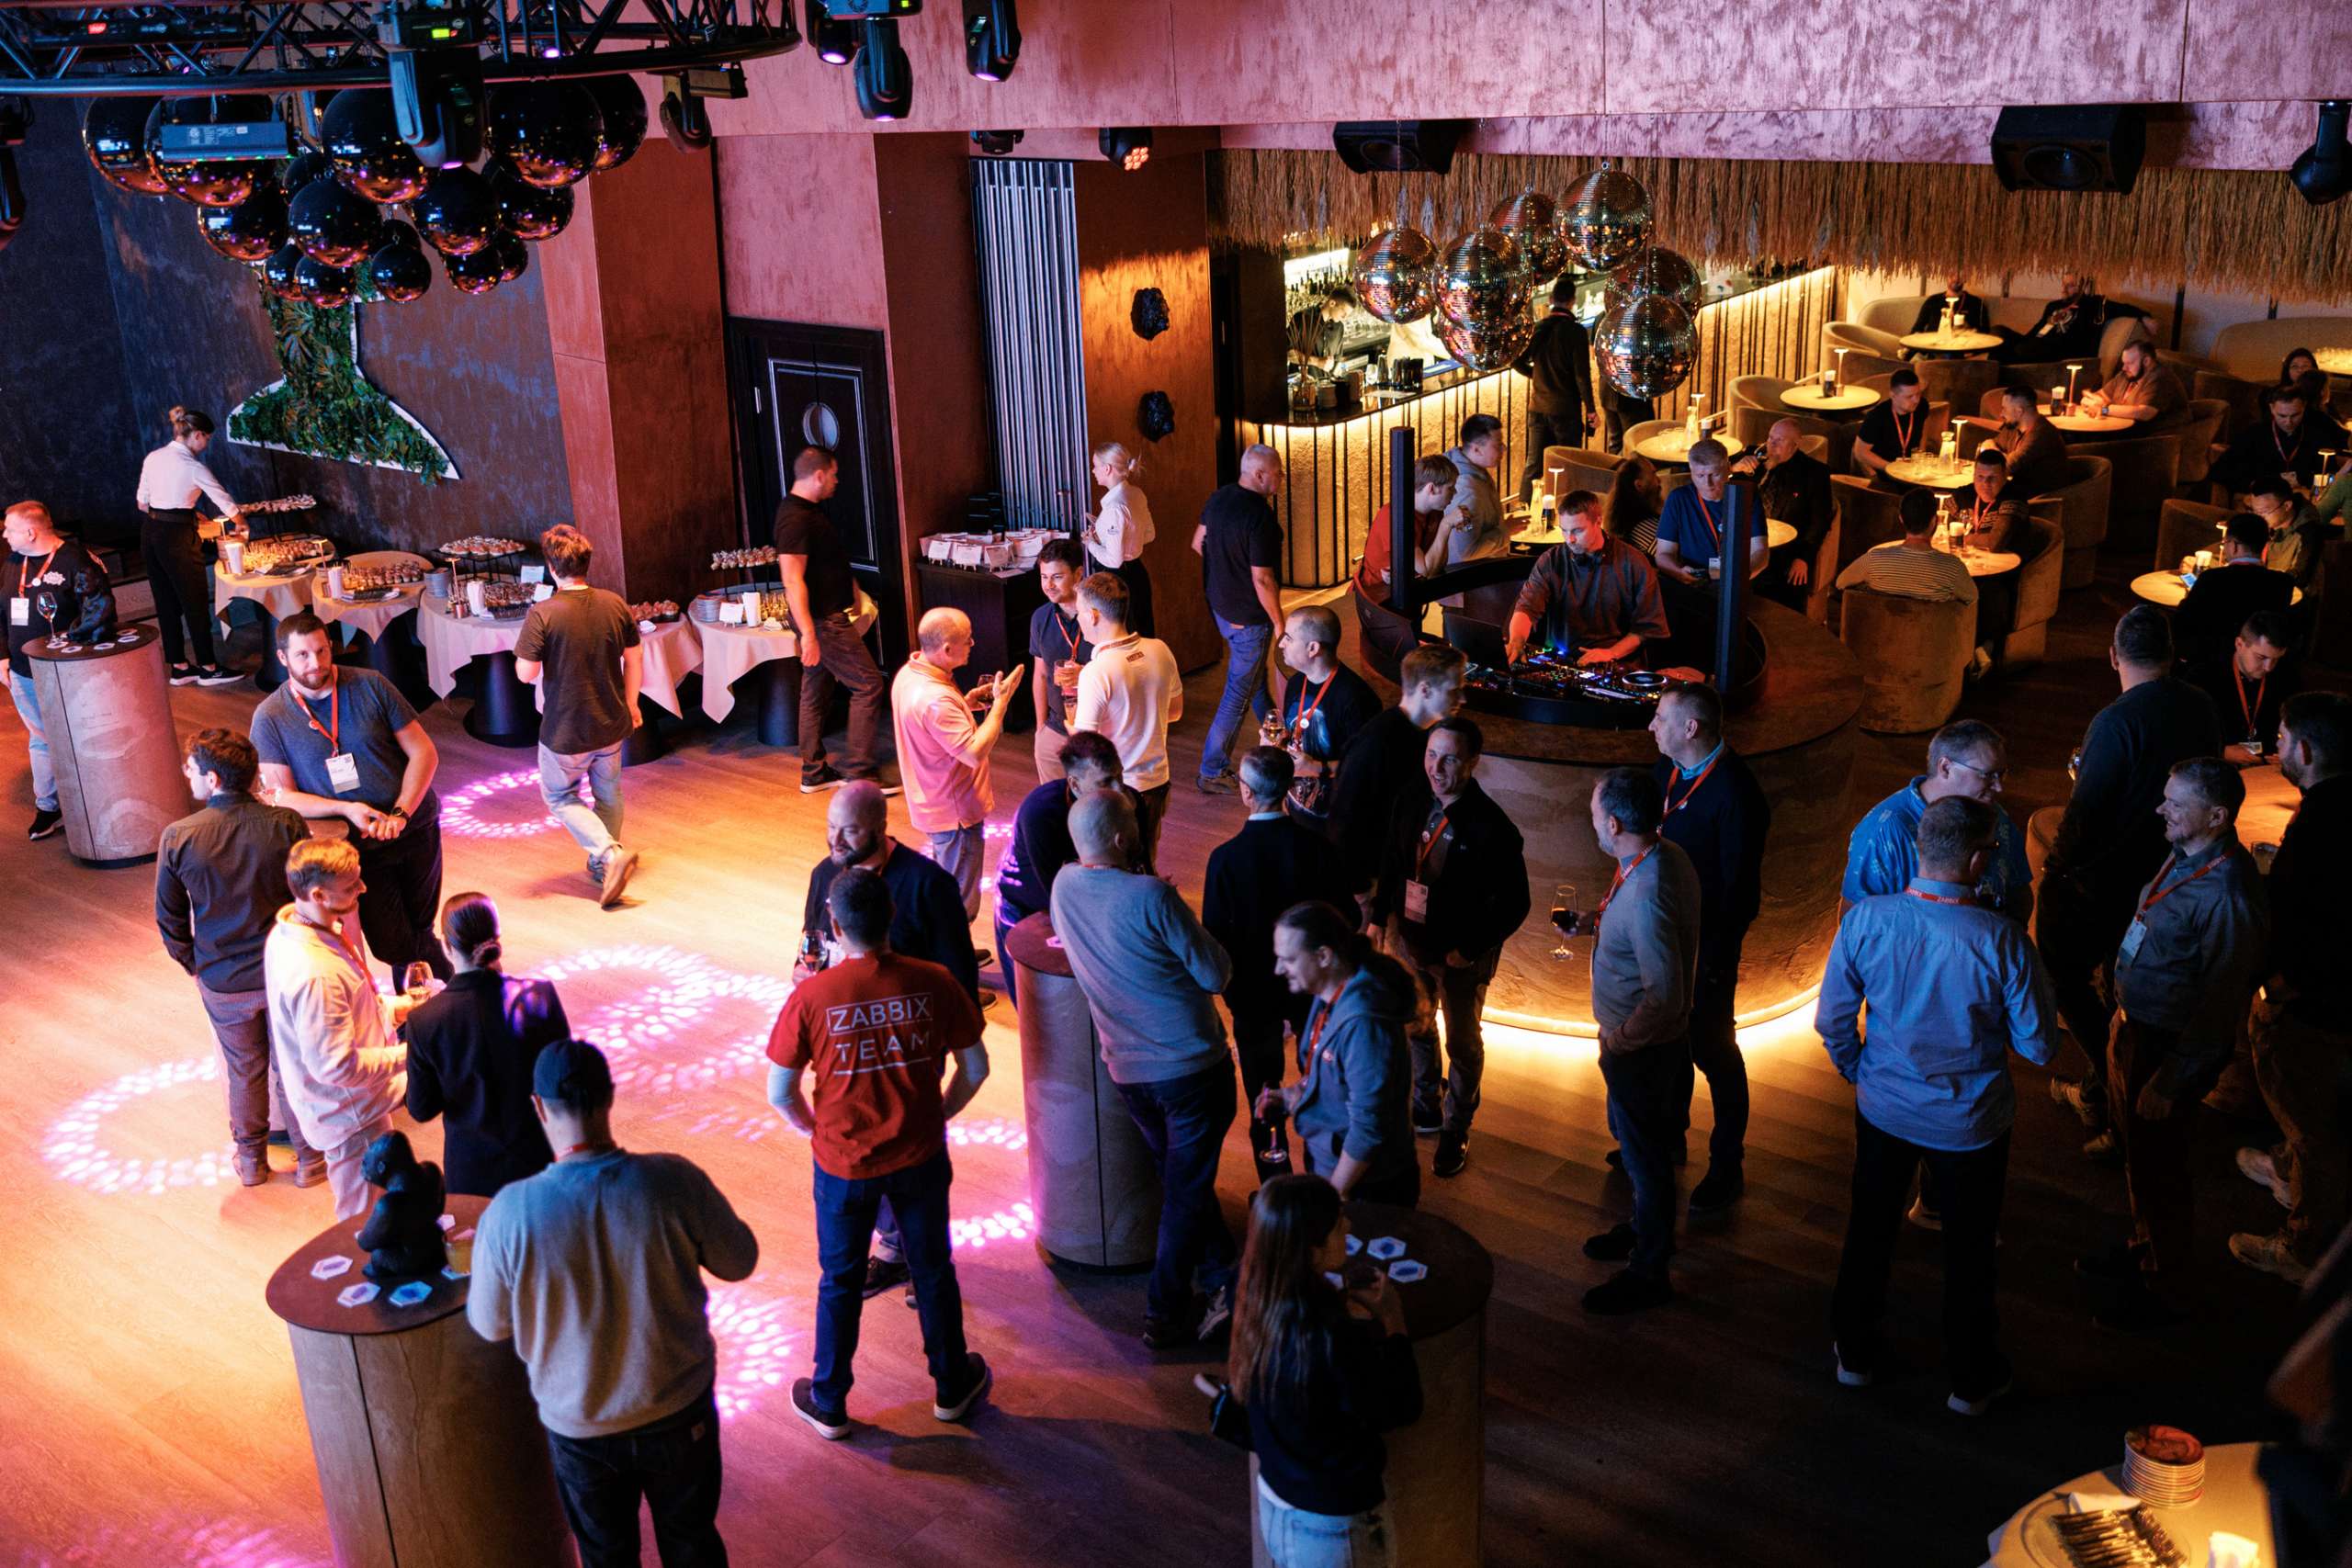
Accordingly, a lot of the magic at Zabbix Summit 2025 happened after hours, with everyone gathering at Riga’s famed Monkey Club for the Summit Welcome Event on October 8 to enjoy a lively atmosphere, a wide selection of cocktails, and plenty of opportunities to connect with fellow monitoring and observability enthusiasts.
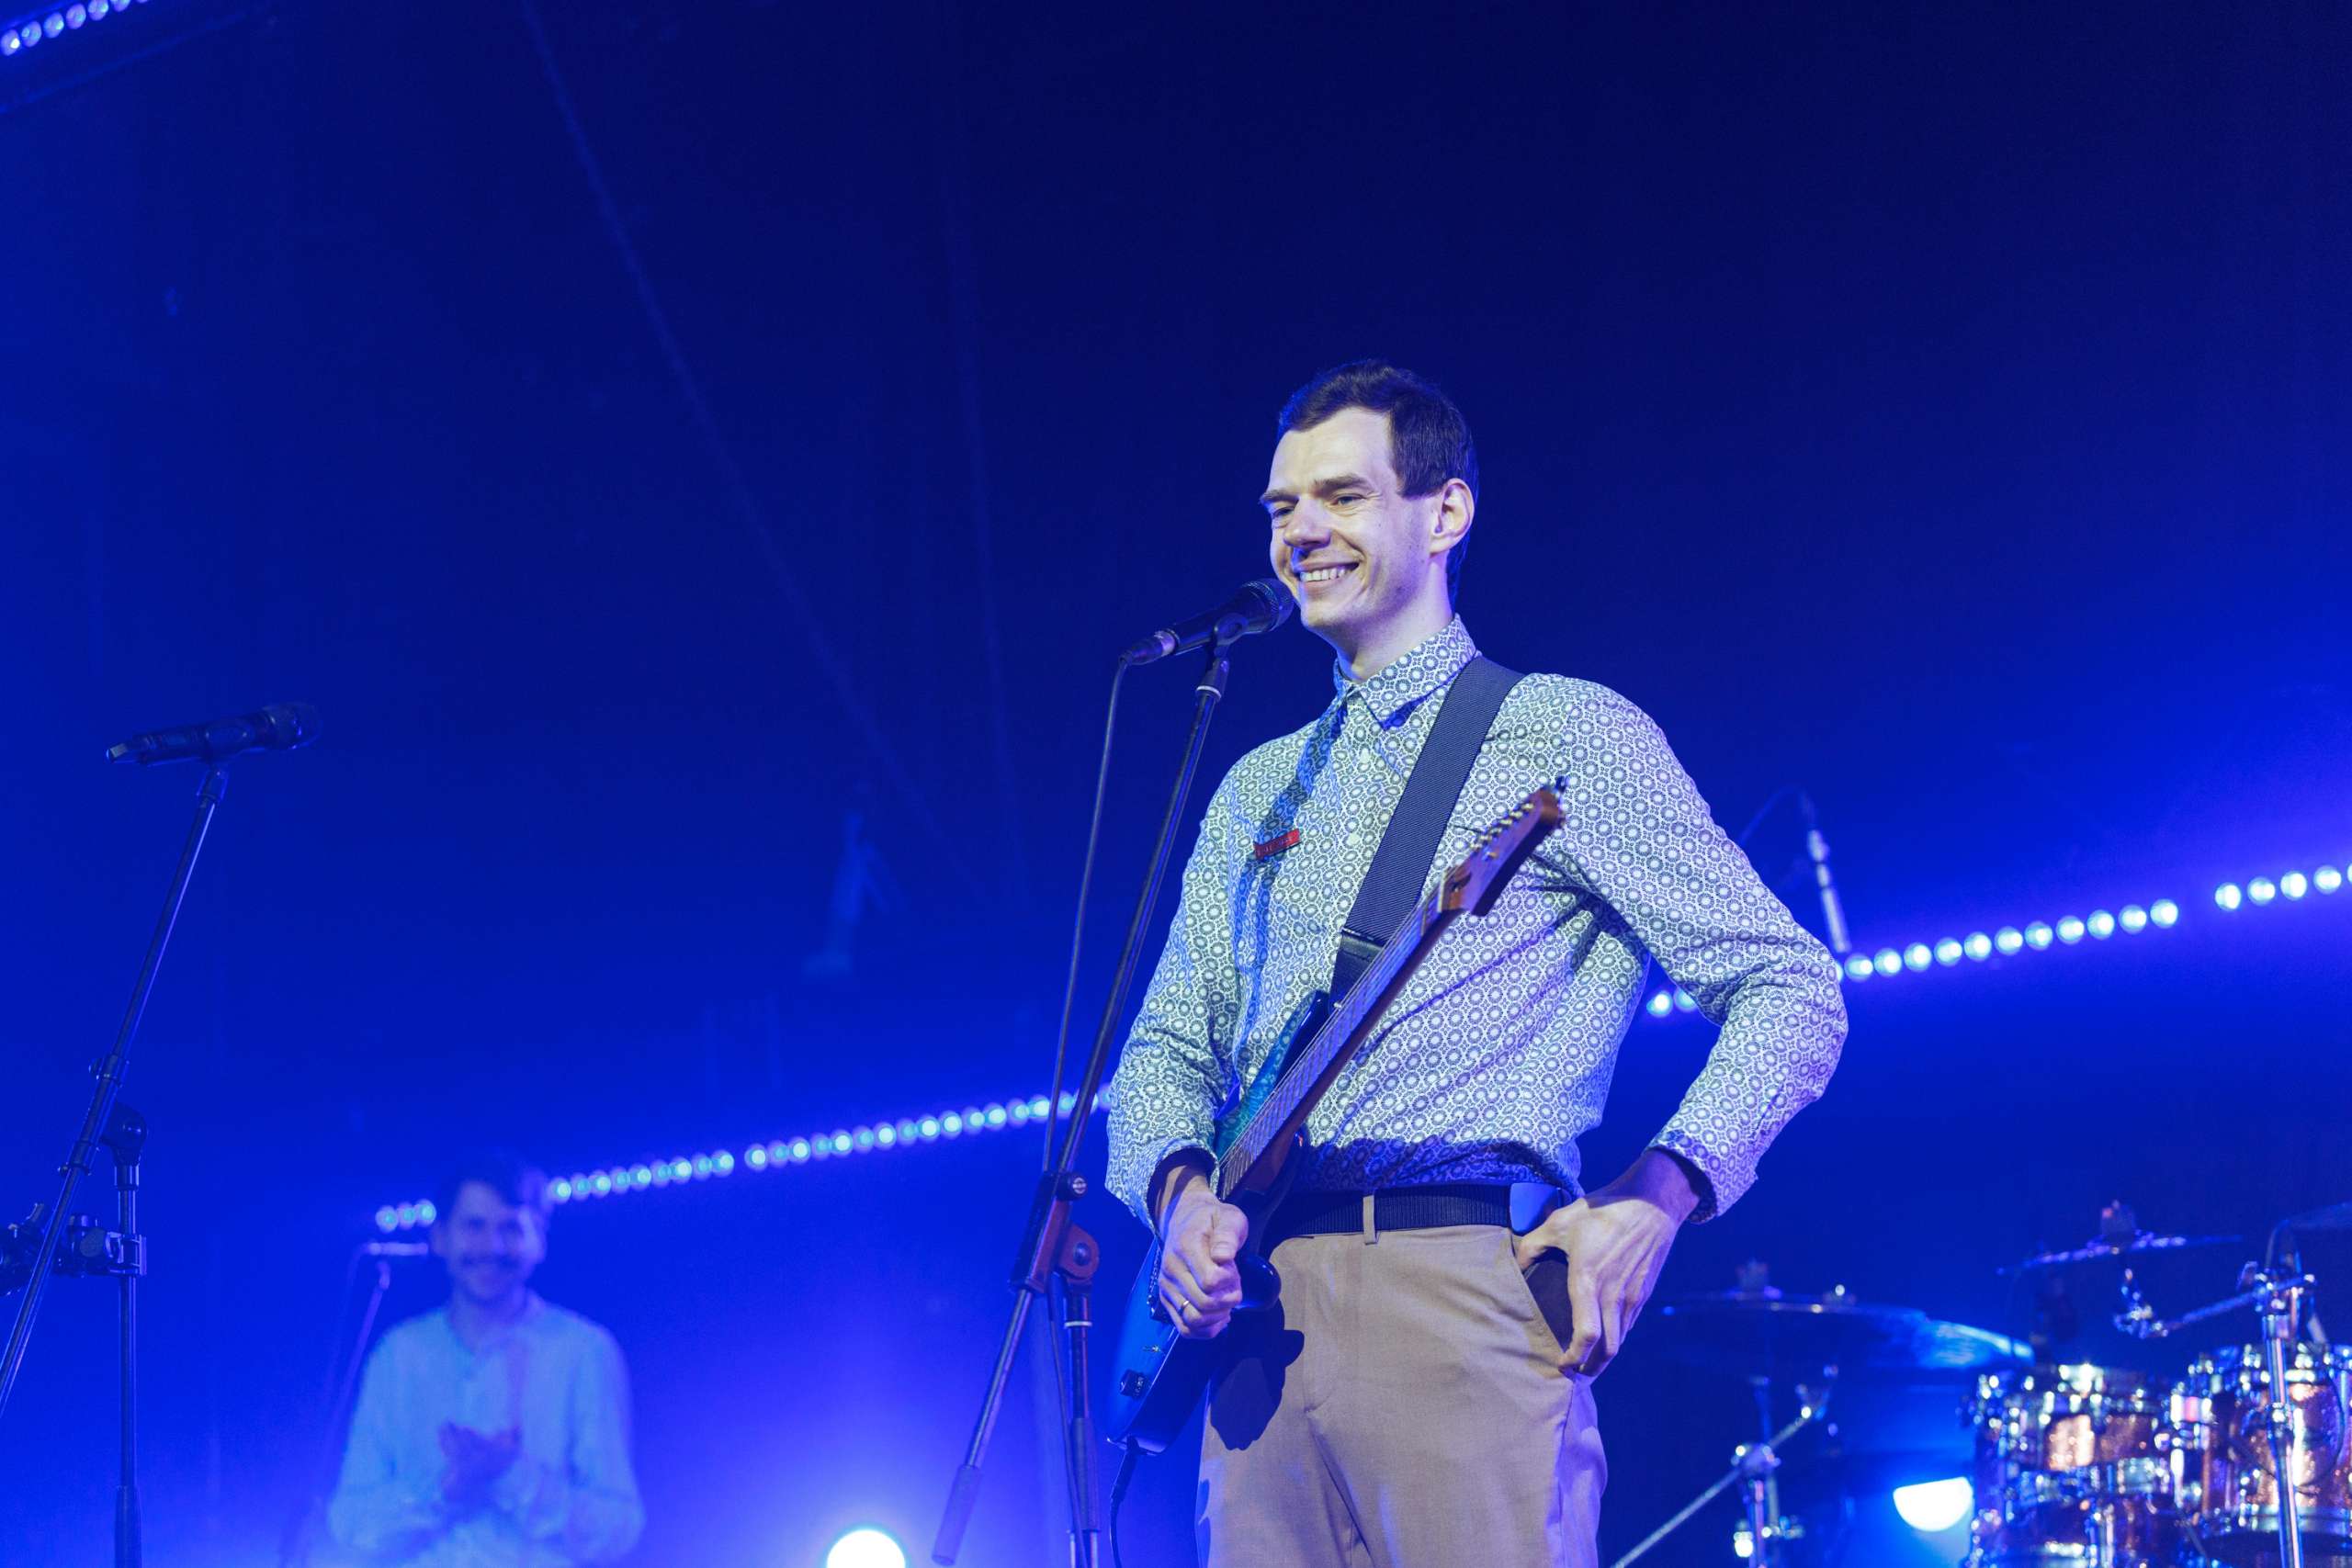
October 9’s Main Event took place in the Tallinn Quarter Angārs, which blended concert hall energy with an open-plan street food kitchen and bar that gave everyone plenty of room to mingle.
A special treat was provided in the form of an original Zabbix-related song by Zabbix PHP Developer and part-time rock star Vladimirs Maksimovs, which got the entire crowd on its feet and set the tone for an unforgettable evening.
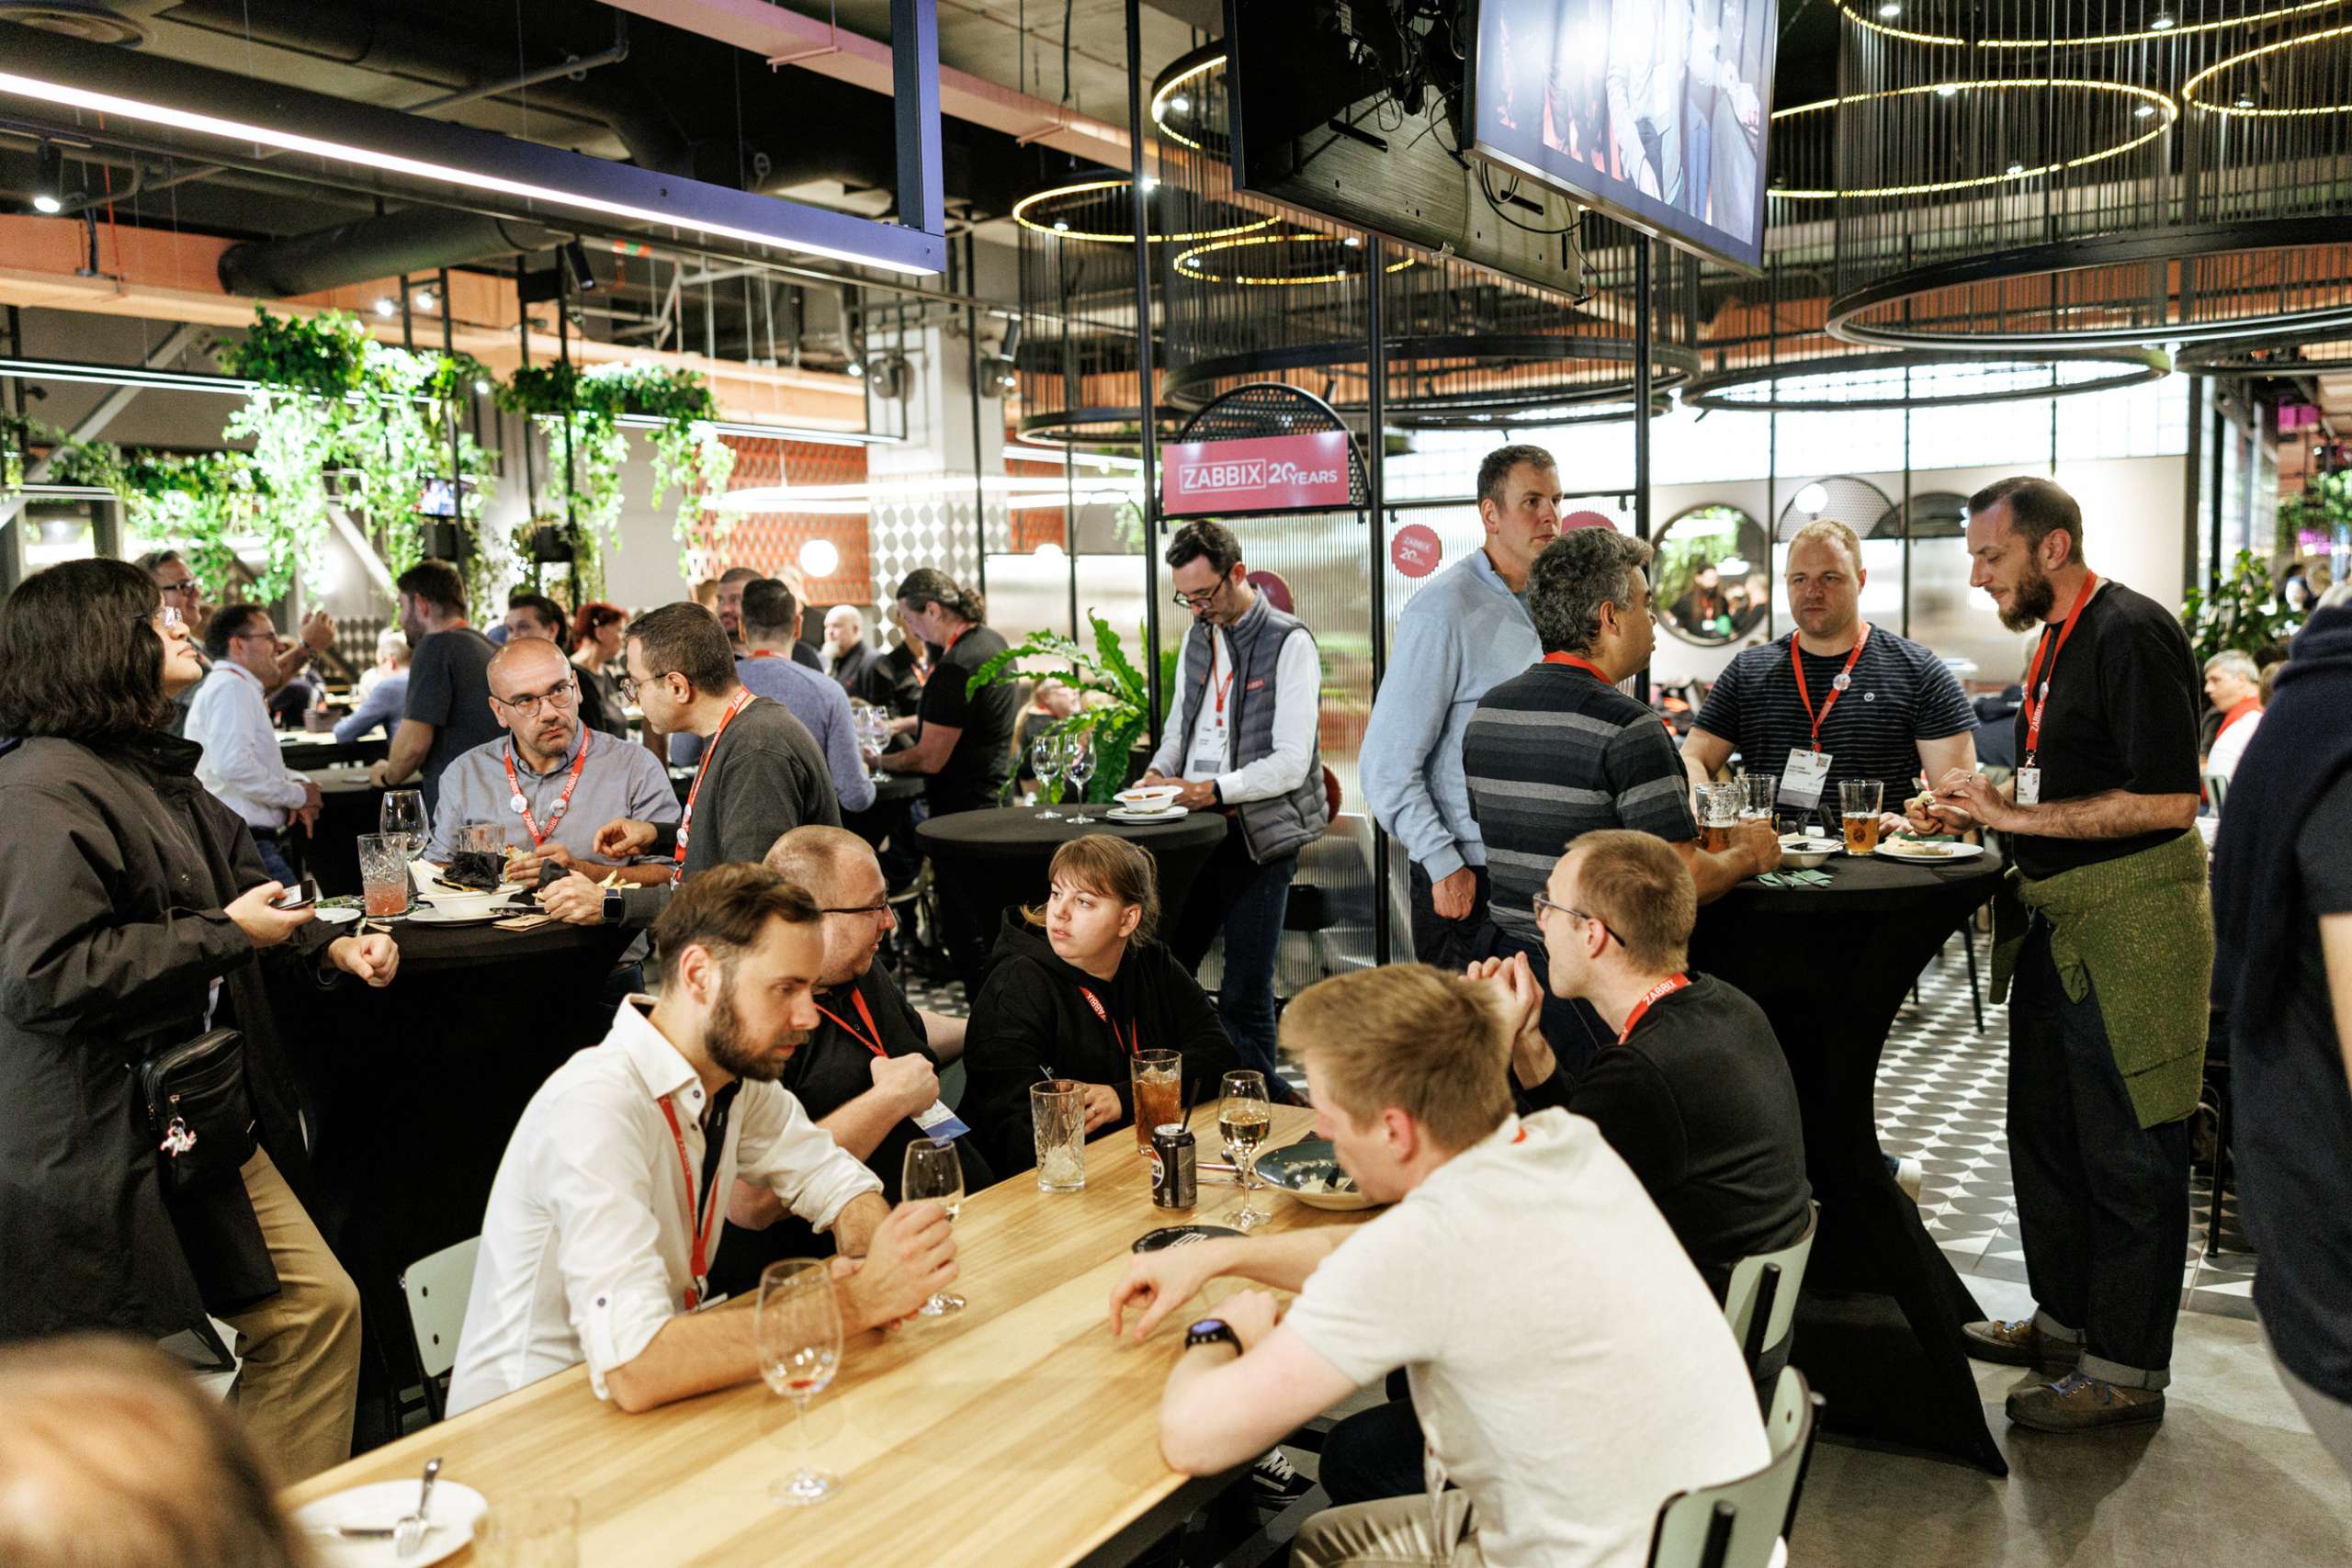
In what has become a bit of a tradition within a tradition, the Summit officially wrapped up on October 10 at Riga’s Burzma Food Hall, with its relaxed atmosphere, multiple cuisines, and communal tables. It’s proven to be the perfect place for reflecting on Summit highlights, swapping contact info, or plotting collaborations.
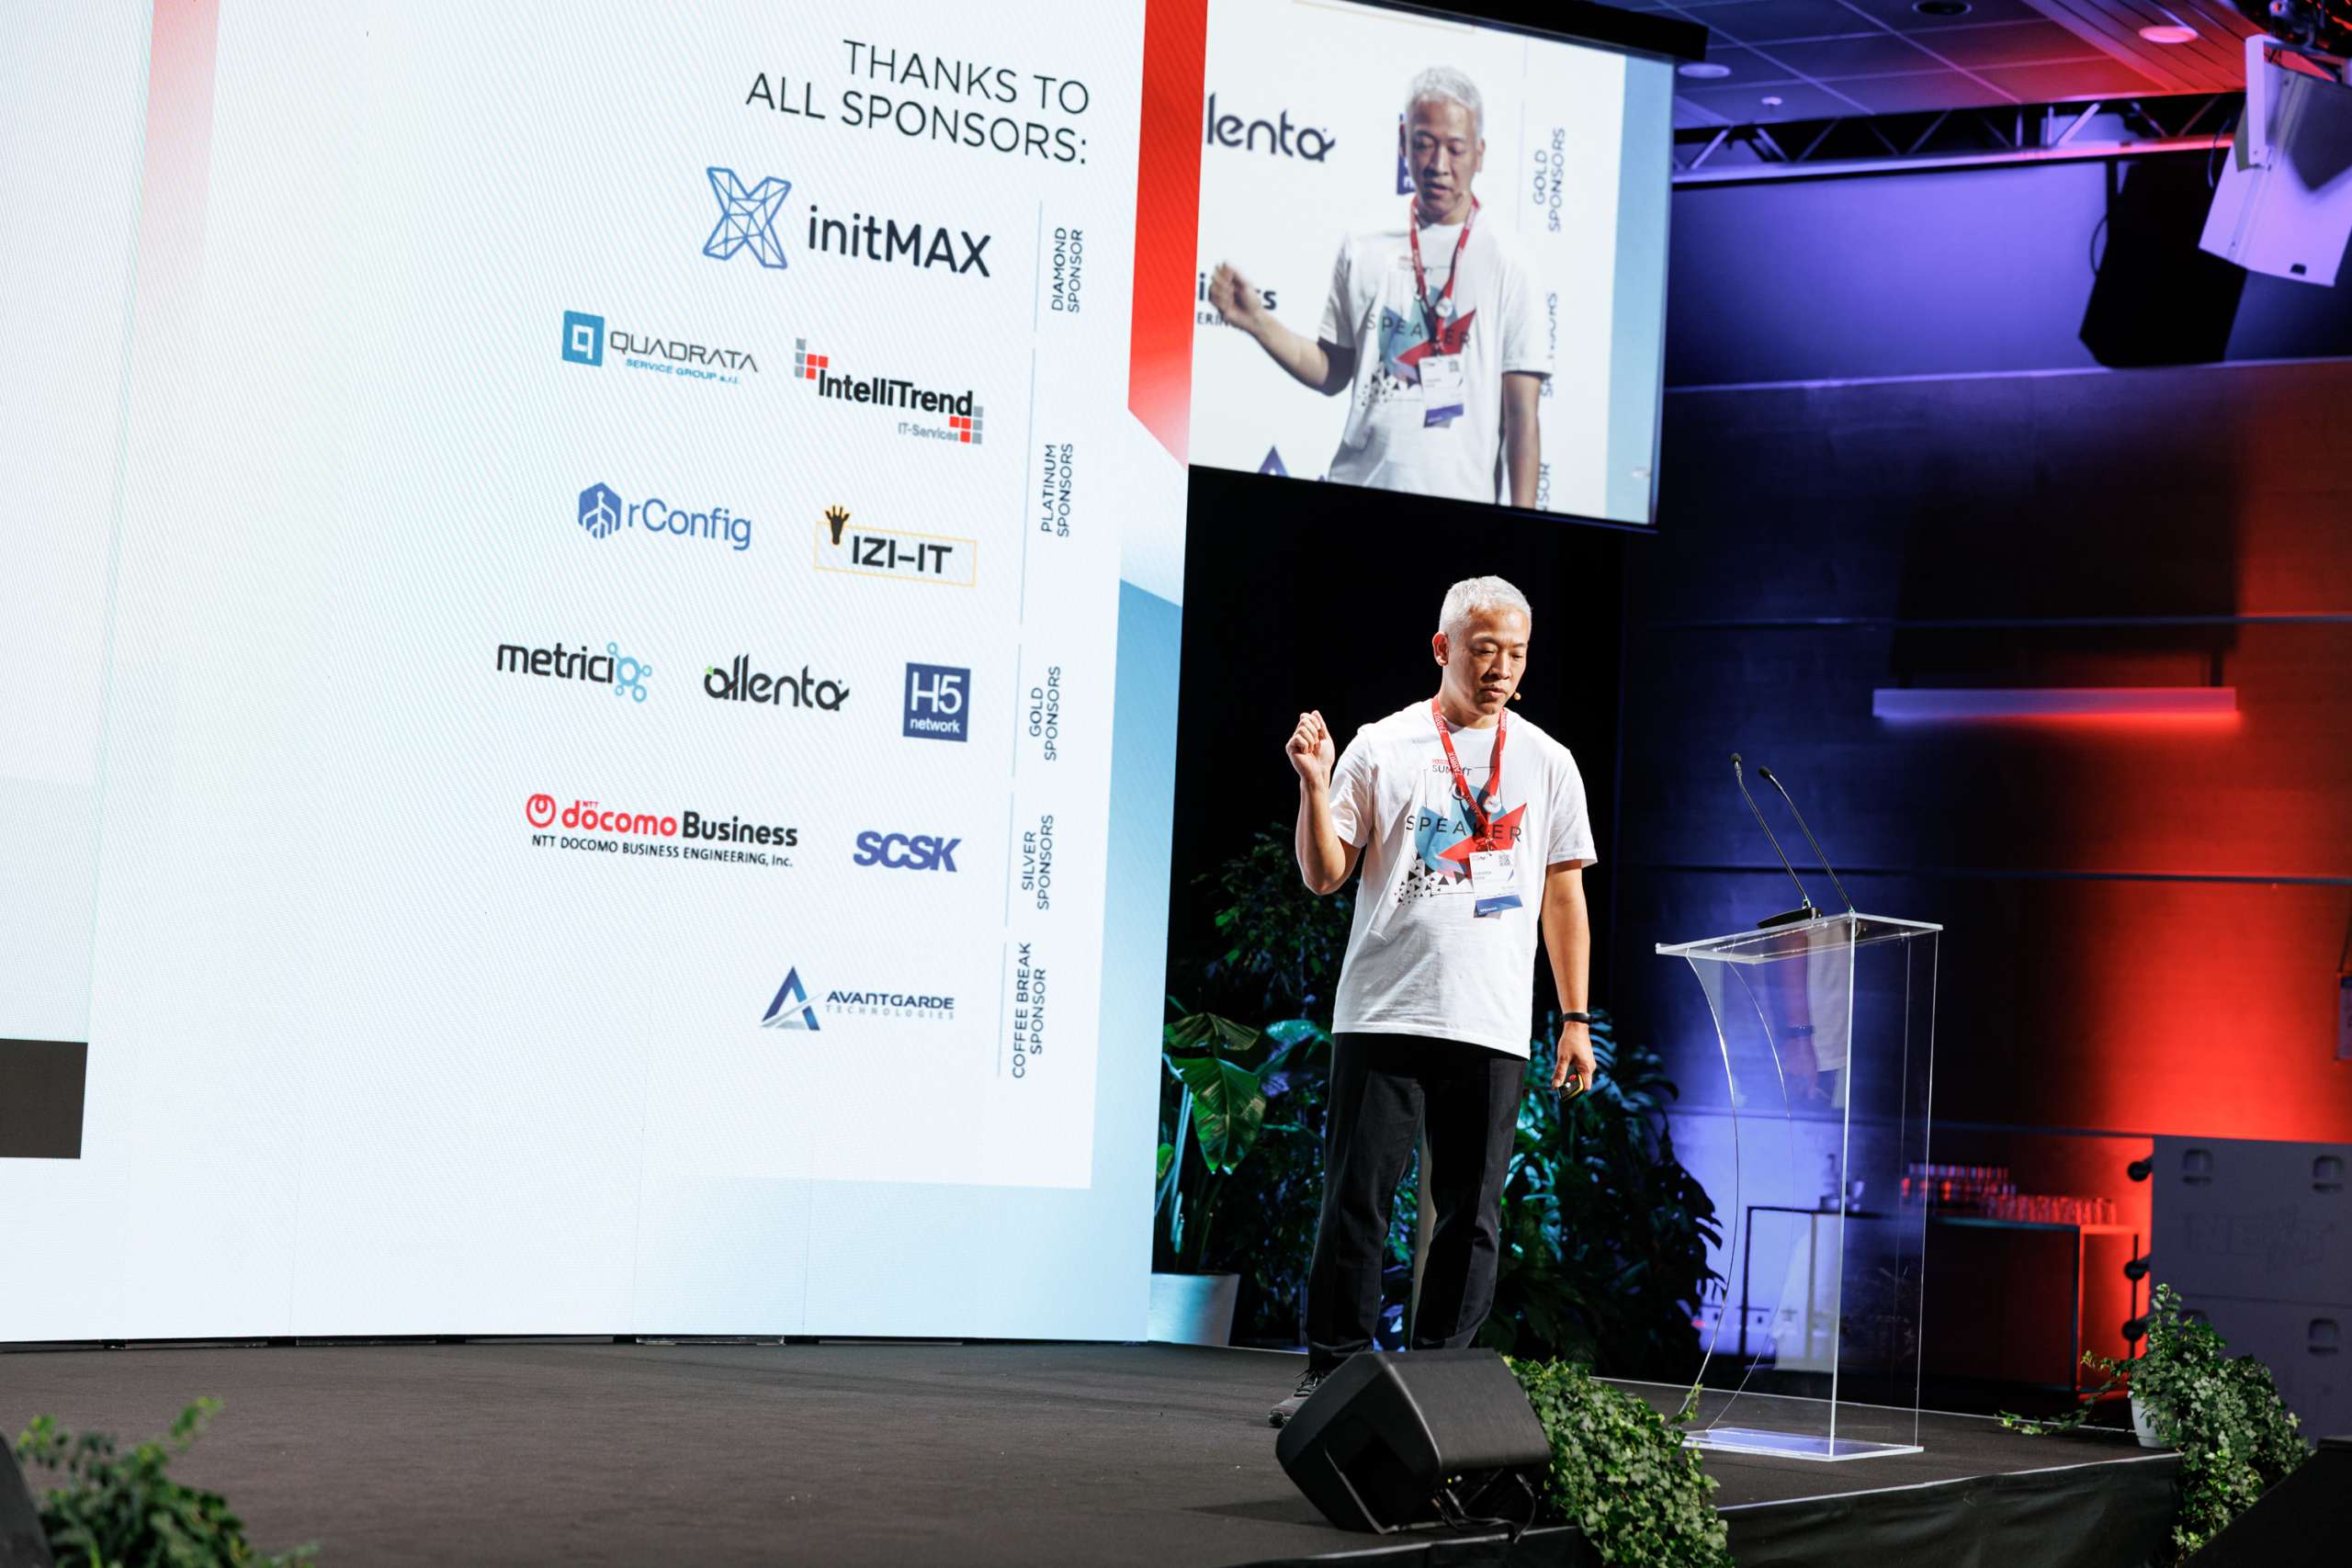
Thank you to our sponsors!
We want to extend our heartfelt thanks to all the sponsors of Zabbix Summit 2025, whose commitment not only helped us bring everyone together under one roof but also contributed to the growth of both Zabbix and the entire global monitoring ecosystem. We value your partnership and look forward to working with you for many years to come!
- initMAX – Diamond Sponsor
- IntelliTrend – Platinum Sponsor
- IZI-IT – Platinum Sponsor
- Quadrata – Platinum Sponsor
- rConfig – Platinum Sponsor
- Allenta – Gold Sponsor
- Metricio – Gold Sponsor
- H5 Network – Gold Sponsor
- Docomo Business – Silver Sponsor
- SCSK – Silver Sponsor
- Avantgarde Technologies – Lunch and coffee break sponsor
Thanks again to our sponsors and everyone else who helped make Zabbix Summit 2025 possible!
In case you couldn’t make it…
If you didn’t manage to make the trip, you can still enjoy the Summit atmosphere in the privacy of your own home! Recordings of both days are available on Zabbix’s YouTube channel:
The slides and texts of the presentations are also available here.
And that’s a wrap on Zabbix Summit 2025! From mind-blowing tech talks to caffeinated hallway chats and everything in between, this year’s Summit experience delivered. Whether you came for the deep dives or just the cool merch (no shame in that), we hope you went away inspired, connected, and maybe just a little more obsessed with monitoring and observability than before. See you in 2026!

The post Community, Coffee, and Code: A Zabbix Summit 2025 Recap appeared first on Zabbix Blog.