All posts by Aigars Kadiķis

Generating Zabbix Health CSV reports with custom frontend module

Post Syndicated from Aigars Kadiķis original https://blog.zabbix.com/generating-zabbix-health-csv-reports-with-custom-frontend-module/24369/

Have you ever wanted a button to export specific data to CSV directly from Zabbix frontend? My friend Gregory and I have solved this problem.

In this blog post, I will show you how with the help of a custom Zabbix frontend module, you can add an “Export to CSV” button and use it to export custom information. This can be installed as a frontend module. It’s applicable for versions Zabbix 5.0 LTS and Zabbix 6.0 LTS. As an additional benefit, we can use this module to polish our Zabbix instance, find misconfiguration, summarize existing configuration and locate potential bottlenecks.

Characteristics of the module

  • Define and store custom SQL queries in the user profile. It uses the “profiles” database table, specifically the columns “idx” and “value_str” to store the settings/data. We are not changing the database structure but using what’s available already.
  • Export an unlimited amount of rows via the CSV button.
  • Compatible with MySQL and PostgreSQL and general SQL syntax. Use the same language as you use directly in the SQL client.
  • SQL highlighter. It’s based on a well-known CodeMirror product. The Zabbix module is still completely standalone.
  • Protection to disallow running UPDATE, DELETE, INSERT, CREATE, ALTER, DROP commands.
  • Hyperlink support in the SQL output. Useful to generate a link used to navigate closer to the problem. Only hyperlinks which are related to zabbix sections (items.php, triggers.php) are supported.

What is it NOT?

  • The module does not provide an environment for “Zabbix User” or “Zabbix Admin” types of users to perform any reporting. Only users of “Zabbix Super Admin” type can use this module.

Install

Below you can find a sequence of commands used to download and install the “Export to CSV” module

Navigate to default directory of frontend modules:
cd /usr/share/zabbix/modules
Pick and create a name of directory:
mkdir -p zabbix-module-sqlexplorer
Navigate inside:
cd zabbix-module-sqlexplorer
Download version 1.4 of module:
wget https://github.com/gr8b/zabbix-module-sqlexplorer/releases/download/v1.6/v1.6.zip
Extract the archive:
unzip v1.6.zip
Remove the original source file, it is unnecessary:
rm v1.6.zip

Enable

Open “Administration” => “General” => “Modules” => click on “Scan directory“. After that, click “Enable“:

A new menu is available:

Now we can run an SQL query, see the result on the screen, and export the data to CSV:

Let’s talk about 5 beneficial use cases that this module can enable. Here Zabbix technical support engineers are sharing a few frequently used SQL commands.

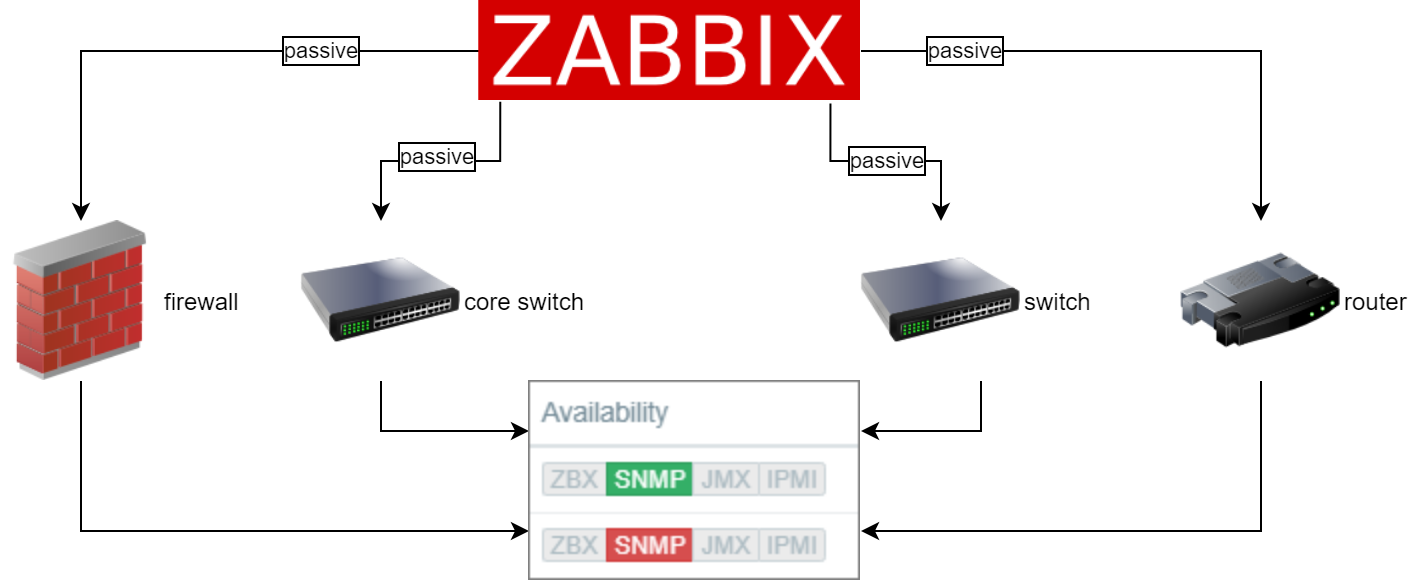
1) Ensure the basic data collection works

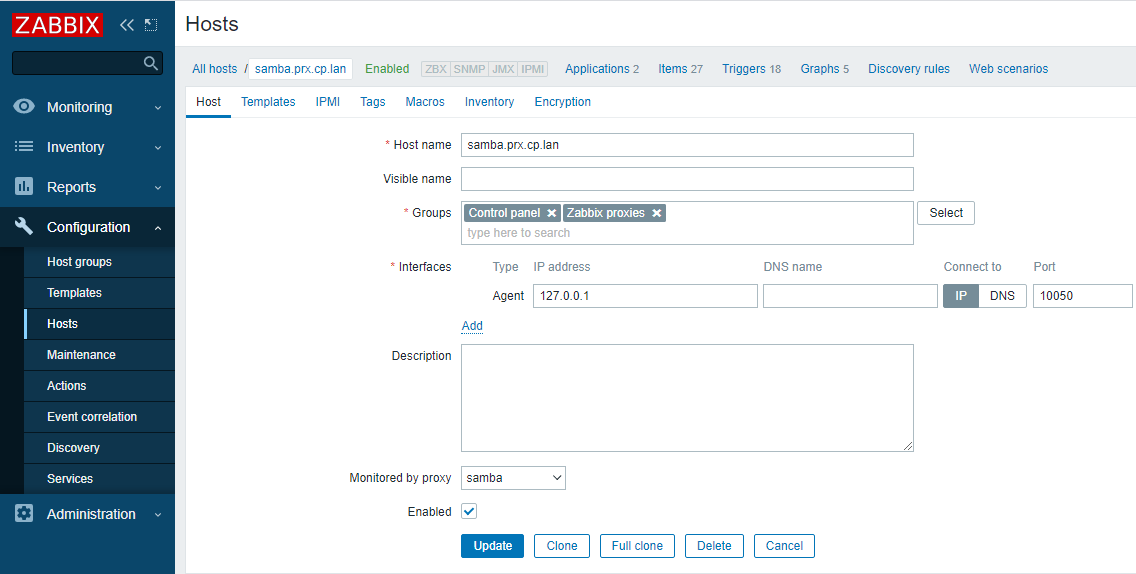
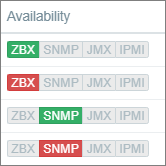
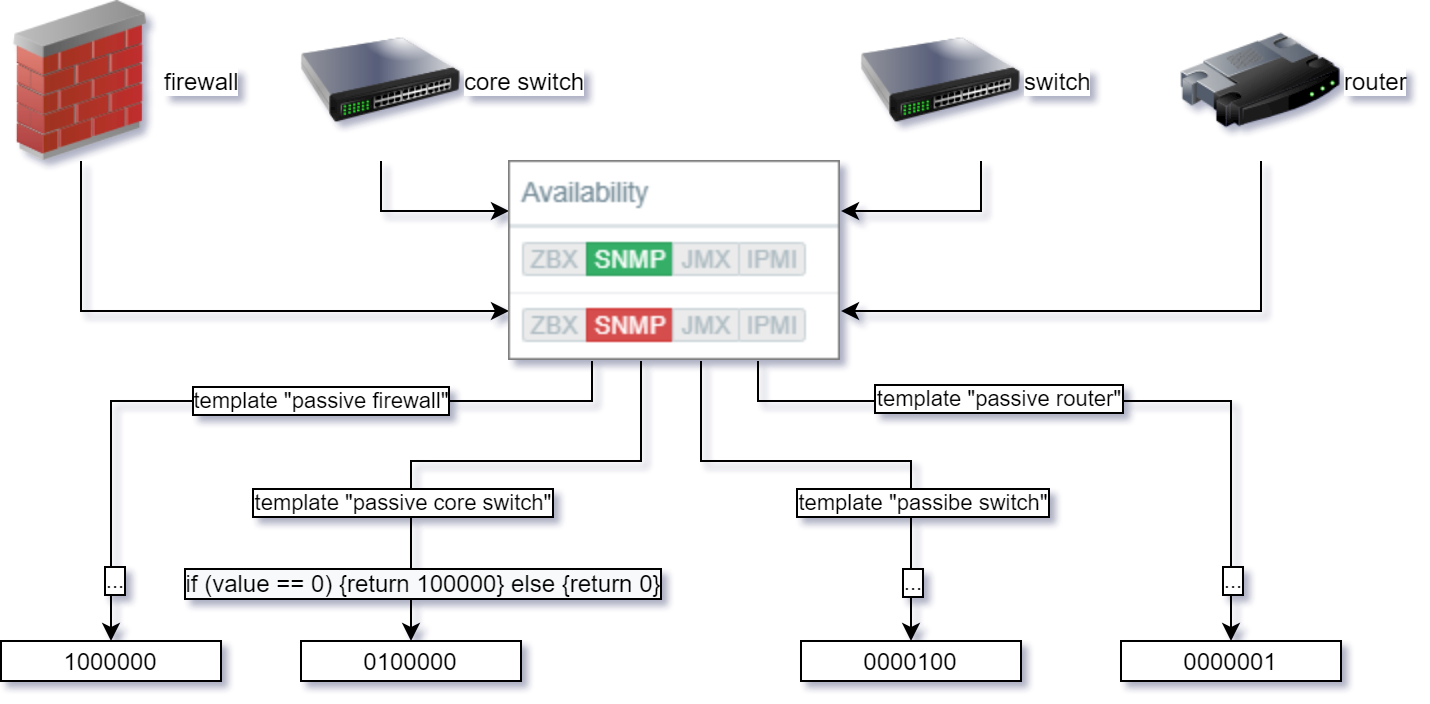
This section would be the basic minimum to maintain. In a perfect world, every host object (a device, a server) must be online 24/7. For each category (ZBX, SNMP, IPMI, JMX) we need to use a dedicated query. Let’s work with the 2 most popular categories – ZBX and SNMP.

Unreachable Zabbix agent (ZBX) hosts

Zabbix 5.0:

SELECT proxy.host AS proxy, hosts.host, hosts.error AS hostError, CONCAT('hosts.php?form=update&hostid=',hosts.hostid) AS goTo FROM hosts LEFT JOIN hosts proxy ON (hosts.proxy_hostid=proxy.hostid) WHERE hosts.status=0 AND LENGTH(hosts.error) > 0;

Zabbix 6.0:

SELECT proxy.host AS proxy, hosts.host, interface.error FROM hosts LEFT JOIN hosts proxy ON (hosts.proxy_hostid=proxy.hostid) JOIN interface ON (interface.hostid=hosts.hostid) WHERE LENGTH(interface.error) > 0 AND interface.type=1;

In the output, we receive a proxy object, host title, an error message, a clickable link to navigate immediately to the object.
Per every row in output, either we need to: 1) Fix the issue. Most likely it is a firewall/DNS/credential/timeout or network quality issue; 2) Delete host object; or 3) Disable host object.

Unreachable network (SNMP) devices

On Zabbix 5.0 use:

SELECT proxy.host AS proxy, hosts.host, hosts.snmp_error AS hostError, CONCAT('hosts.php?form=update&hostid=',hosts.hostid) AS goTo FROM hosts LEFT JOIN hosts proxy ON (hosts.proxy_hostid=proxy.hostid) WHERE hosts.status=0 AND LENGTH(hosts.snmp_error) > 0;

On Zabbix 6.0 use:

SELECT proxy.host AS proxy, hosts.host, interface.error, CONCAT('zabbix.php?action=host.edit&hostid=',hosts.hostid) AS goTo FROM hosts LEFT JOIN hosts proxy ON (hosts.proxy_hostid=proxy.hostid) JOIN interface ON (interface.hostid=hosts.hostid) WHERE LENGTH(interface.error) > 0 AND interface.type=2;

We receive the proxy title, host object, reason the host is not working and a clickable link to the object.

2) Improve speed of frontend

Ensure we have the best response time for all sections in GUI. If tables contain “unnecessary” data, the user experience will suffer for it. Nowadays, no one wants to spend longer than a few seconds waiting for data to be displayed on the screen.

Amount of user sessions

Zabbix 5.0:

SELECT COUNT(*) AS count, users.alias FROM sessions JOIN users ON (users.userid=sessions.userid) GROUP BY 2 ORDER BY 1 DESC;

Zabbix 6.0:

SELECT COUNT(*) AS count, users.username FROM sessions JOIN users ON (users.userid=sessions.userid) GROUP BY 2 ORDER BY 1 DESC;

The total number of sessions should not exceed 1000; it’s hard to imagine why it should be over 100. It is OK to delete all data in the “sessions” table and optimize/vacuum the table. This will improve the overall Zabbix GUI responsiveness and performance.

Don’t keep too many open problems onboard

Every monitoring tool is about identifying problems. If you keep too many open problems, then frontend will be slow. The following query will print trigger problems (the ones we receive in email) and so as internal problems, which reflect the health of the monitoring tool.

SELECT COUNT(*) AS count, CASE WHEN source=0 THEN 'surface' WHEN source>0 THEN 'internal' END AS level, CASE WHEN source=0 AND object=0 THEN 'trigger in a problem state' WHEN source=3 AND object=0 THEN 'cannot evaluate trigger expression' WHEN source=3 AND object=4 THEN 'data collection not working' WHEN source=3 AND object=5 THEN 'low level discovery not perfect' END AS problemCategory FROM problem GROUP BY 2,3 ORDER BY 2 DESC;

To decrease the number of “internal” problems, have a study on the point nr. 5 in this blog post.

3) Identify exceptions

Monitoring administrators can change item update frequency at a host level, can install a different trigger threshold at the host level, or install a different threshold inside a nested template tree. This section will highlight all overrides.

Item update interval differs between host/template levels

This query will print items and LLD rules with different update frequencies on the host level while comparing them with the template level. Most of the time,  having different update interval at the host level is done by accident.

SELECT h2.host AS Source, i2.name AS itemName, i2.key_ AS itemKey, i2.delay AS OriginalUpdateFrequency,h1.host AS exceptionInstalledOn, i1.delay AS FrequencyChild, CASE WHEN i1.flags=1 THEN 'LLD rule' WHEN i1.flags IN (0,4) THEN 'data collection' END AS itemCategory , CASE WHEN i1.flags=1 THEN CONCAT('host_discovery.php?form=update&context=host&itemid=',i1.itemid) WHEN i1.flags IN (0,4) THEN CONCAT('items.php?form=update&context=host&hostid=',h1.hostid,'&itemid=',i1.itemid) END AS goTo FROM items i1 JOIN items i2 ON (i2.itemid=i1.templateid) JOIN hosts h1 ON (h1.hostid=i1.hostid) JOIN hosts h2 ON (h2.hostid=i2.hostid) WHERE i1.delay <> i2.delay;

In the output, the “Source” column is a host object (a device) or a template object. The “Source” column is heavily related to “exceptionInstalledOn” column. “Source” VS “exceptionInstalledOn” practically tells there is a relation between a host and a template or between a template and another template.

FrequencyChild” column is the most important field, which describes an exception installed which differs from the original object.

The output allows navigating directly to the item where the update frequency stands out.

Connection characteristics and custom trigger thresholds

The query will show every installed override between host and template object or between template and parent template object. If template nesting is used at multiple levels, it will highlight if an overriding value if that is installed somewhere in the middle.

SELECT hm1.macro AS Macro, child.host AS owner, hm2.value AS defaultValue, parent.host AS OverrideInstalled, hm1.value AS OverrideValue FROM hosts parent, hosts child, hosts_templates rel, hostmacro hm1, hostmacro hm2 WHERE parent.hostid=rel.hostid AND child.hostid=rel.templateid AND hm1.hostid = parent.hostid AND hm2.hostid = child.hostid AND hm1.macro = hm2.macro AND parent.flags=0 AND child.flags=0 AND hm1.value <> hm2.value;

Abandoned items

A very lonely item that does not belong to any template.

SELECT hosts.host, items.key_,CONCAT('items.php?form=update&context=host&itemid=',items.itemid) AS goTo FROM items JOIN hosts ON (hosts.hostid=items.hostid) WHERE hosts.status=0 AND hosts.flags=0 AND items.status=0 AND items.templateid IS NULL AND items.flags=0;

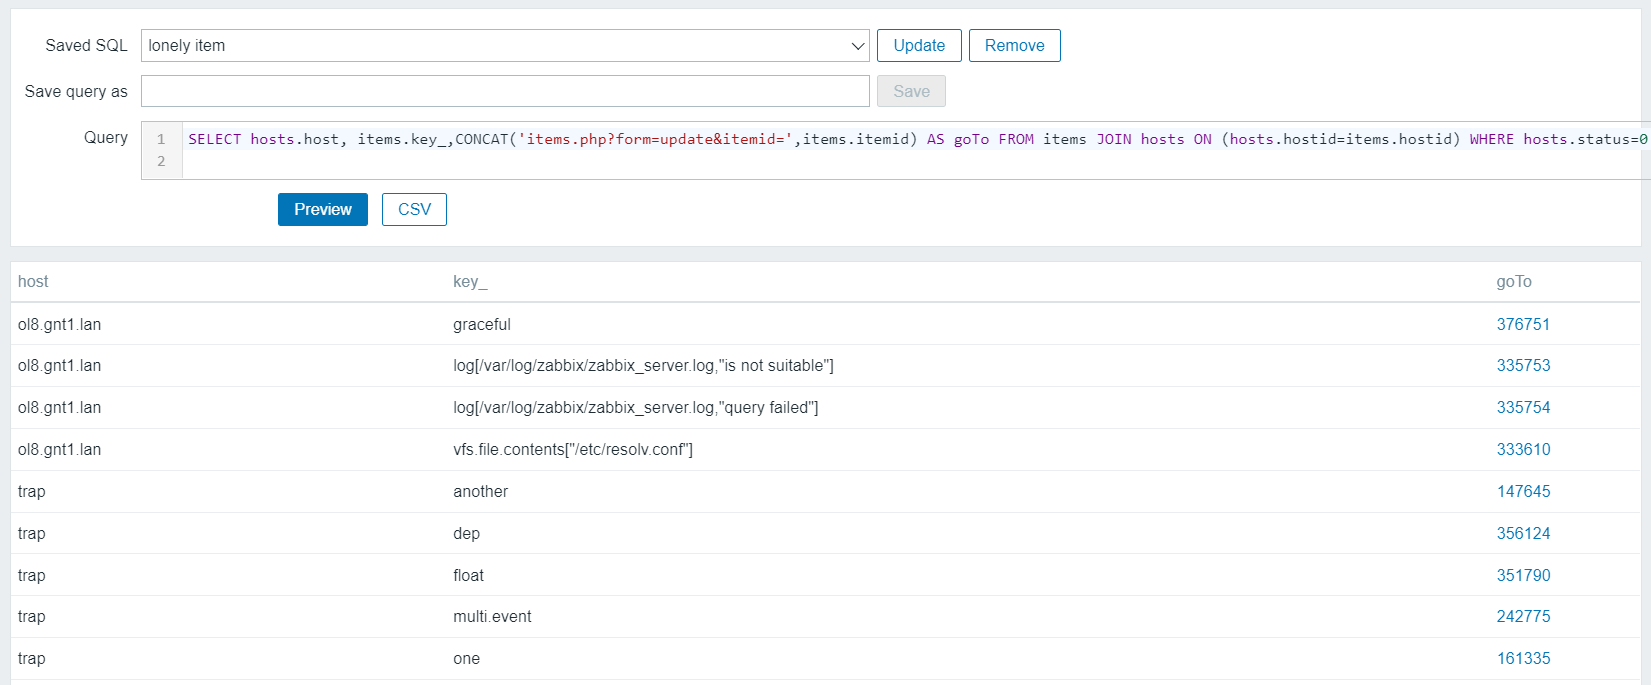
To keep up centralized management, it would be better to move and maintain the definition of the item to the template level.

4) Reporting

We can summarize an item and host configurations, enabled and disabled data collector items, and linked templates.

What data collection method is used?

To summarize all data collection techniques and see the membership by Zabbix proxy use the following command:

SELECT proxy.host AS proxy, CASE items.type WHEN 0 THEN 'Zabbix agent' WHEN 1 THEN 'SNMPv1 agent' WHEN 2 THEN 'Zabbix trapper' WHEN 3 THEN 'Simple check' WHEN 4 THEN 'SNMPv2 agent' WHEN 5 THEN 'Zabbix internal' WHEN 6 THEN 'SNMPv3 agent' WHEN 7 THEN 'Zabbix agent (active) check' WHEN 8 THEN 'Aggregate' WHEN 9 THEN 'HTTP test (web monitoring scenario step)' WHEN 10 THEN 'External check' WHEN 11 THEN 'Database monitor' WHEN 12 THEN 'IPMI agent' WHEN 13 THEN 'SSH agent' WHEN 14 THEN 'TELNET agent' WHEN 15 THEN 'Calculated' WHEN 16 THEN 'JMX agent' WHEN 17 THEN 'SNMP trap' WHEN 18 THEN 'Dependent item' WHEN 19 THEN 'HTTP agent' WHEN 20 THEN 'SNMP agent' WHEN 21 THEN 'Script item' END AS type,COUNT(*) FROM items JOIN hosts ON (hosts.hostid=items.hostid) LEFT JOIN hosts proxy ON (hosts.proxy_hostid=proxy.hostid) WHERE hosts.status=0 AND items.status=0 GROUP BY proxy.host, items.type ORDER BY 1,2,3 DESC;

Devices and linked templates

If one server runs as a database server, a web server, and an application server, there must be multiple templates linked. The following query can help to detect the linked templates.

MySQL:

SELECT proxy.host AS proxy, hosts.host, GROUP_CONCAT(template.host SEPARATOR ', ') AS templates FROM hosts JOIN hosts_templates ON (hosts_templates.hostid=hosts.hostid) LEFT JOIN hosts proxy ON (hosts.proxy_hostid=proxy.hostid) LEFT JOIN hosts template ON (hosts_templates.templateid=template.hostid) WHERE hosts.status IN (0,1) AND hosts.flags=0 GROUP BY 1,2 ORDER BY 1,3,2;

PostgreSQL:

SELECT proxy.host AS proxy, hosts.host, ARRAY_TO_STRING(ARRAY_AGG(template.host),', ') AS templates FROM hosts JOIN hosts_templates ON (hosts_templates.hostid=hosts.hostid) LEFT JOIN hosts proxy ON (hosts.proxy_hostid=proxy.hostid) LEFT JOIN hosts template ON (hosts_templates.templateid=template.hostid) WHERE hosts.status IN (0,1) AND hosts.flags=0 GROUP BY 1,2 ORDER BY 1,3,2;
Devices and all inventory fields
SELECT h.host,i.type,i.type_full,i.name,i.alias,i.os,i.os_full,i.os_short,i.serialno_a,i.serialno_b,i.tag,i.asset_tag,i.macaddress_a,i.macaddress_b,i.hardware,i.hardware_full,i.software,i.software_full,i.software_app_a,i.software_app_b,i.software_app_c,i.software_app_d,i.software_app_e,i.contact,i.location,i.location_lat,i.location_lon,i.notes,i.chassis,i.model,i.hw_arch,i.vendor,i.contract_number,i.installer_name,i.deployment_status,i.url_a,i.url_b,i.url_c,i.host_networks,i.host_netmask,i.host_router,i.oob_ip,i.oob_netmask,i.oob_router,i.date_hw_purchase,i.date_hw_install,i.date_hw_expiry,i.date_hw_decomm,i.site_address_a,i.site_address_b,i.site_address_c,i.site_city,i.site_state,i.site_country,i.site_zip,i.site_rack,i.site_notes,i.poc_1_name,i.poc_1_email,i.poc_1_phone_a,i.poc_1_phone_b,i.poc_1_cell,i.poc_1_screen,i.poc_1_notes,i.poc_2_name,i.poc_2_email,i.poc_2_phone_a,i.poc_2_phone_b,i.poc_2_cell,i.poc_2_screen,i.poc_2_notes FROM host_inventory i, hosts h WHERE i.hostid=h.hostid AND h.flags=0;

By default, it prints all columns. You can cut away the unnecessary ones. You can use the extracted data for analytics in other software, e.g., MS Excel.

External scripts in use

When migrating to the next release of Zabbix, it’s better to be aware of all external scripts and ensure the new server will support that. An external script is a custom solution for how you collect data. For example, a Python 2 language is not available on a newer operating system out of box.

SELECT items.key_,COUNT(*) FROM items JOIN hosts ON (hosts.hostid=items.hostid) WHERE hosts.status=0 AND items.status=0 AND items.type=10 GROUP BY 1 ORDER BY 2;


5) Polish your Zabbix instance

This section will require more work. Being a non-perfectionist is an advantage.

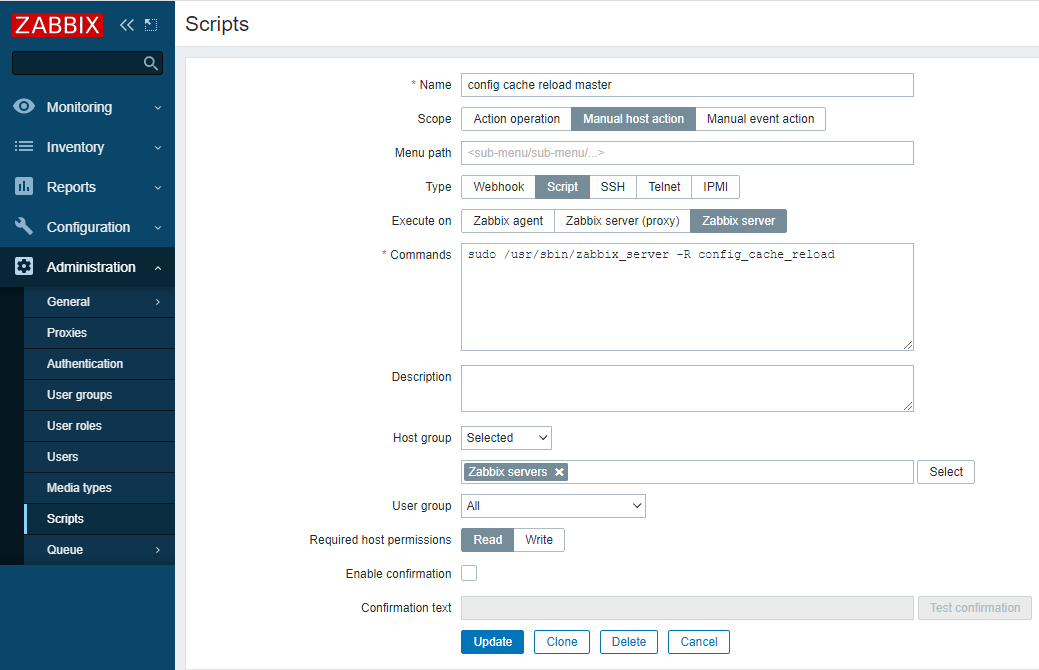
To work with internal events (data collection not working, trigger not working), we have to have a least one internal action enabled. It can be an action with a condition that will never be true:

Be careful, if you have huge infrastructure and currently everything is disabled, then don’t enable! Or enable only for 4h to generate some statistics and then turn it off. If you keep internal events ON and a lot of things are not working, it will create frontend very slow. And it will get even slower every day.

Data collection

Monitoring is based on data collection. If new data does not come in, we cannot detect if the service is up or down. The following query will list all data collector items which cannot receive the data.

SELECT hosts.name, items.key_ AS keyName, problem.name AS error, CONCAT('items.php?form=update&itemid=',objectid) AS goTo FROM problem JOIN items ON (items.itemid=problem.objectid) JOIN hosts ON (hosts.hostid=items.hostid) WHERE problem.source>0 AND problem.object=4;

The output provides a clickable link to navigate to the item and investigate. Common issues can be a timeout, wrong credentials, and permissions.

Trigger evaluation

When data is collected and if an item has a trigger linked, it’s possible that there is a problem in evaluating trigger logic. The result of the following query will show you why it’s impossible to detect the problem.

SELECT DISTINCT CONCAT('triggers.php?form=update&triggerid=',problem.objectid) AS goTo, hosts.name AS hostName, triggers.description AS triggerTitle, problem.name AS error FROM problem JOIN triggers ON (triggers.triggerid=problem.objectid) JOIN functions ON (functions.triggerid=triggers.triggerid) JOIN items ON (items.itemid=functions.itemid) JOIN hosts ON (hosts.hostid=items.hostid) WHERE problem.source > 0 AND problem.object=0;

Low-level discovery

The purpose of low-level discovery is to find all elements which exist in a particular system. For example, find all services on a windows system. If discovery is not working, then additional elements will not get covered, which means no data collection, no trigger, and no notification. The following query will show all erroneous LLD rules and the reason there is a problem:

SELECT hosts.name AS hostName, items.key_ AS itemKey, problem.name AS LLDerror, CONCAT('host_discovery.php?form=update&itemid=',problem.objectid) AS goTo FROM problem JOIN items ON (items.itemid=problem.objectid) JOIN hosts ON (hosts.hostid=items.hostid) WHERE problem.source > 0 AND problem.object=5;

That is it for today.

In the comments section below, let us know what kind of report your company desires to see.

Appendix

Know issues of the module:
  • When linking tables in SQL output, if there are multiple columns with the same name, only the first column will be printed. As a workaround, always use “AS ColumnName” directive to specify unique column names in the output.

New Agent 2 features in Zabbix 6.0 LTS by Aigars Kadiķis / Zabbix Summit Online 2021

Post Syndicated from Aigars Kadiķis original https://blog.zabbix.com/new-agent-2-features-in-zabbix-6-0-lts-by-aigars-kadikis-zabbix-summit-online-2021/18929/

Zabbix Agent 2 has been developed to provide additional benefits to our users – From a larger set of supported metrics to metric collection logic improvements and simplified custom monitoring plugin development. Let’s look at what new features Zabbix Agent 2 will receive in Zabbix 6.0 LTS.

The full recording of the speech is available on the official Zabbix Youtube channel.

What is Zabbix agent?

First, let’s talk about the key benefits you gain with Zabbix agent and how it can add an additional layer of flexibility to your monitoring:

  • Zabbix Agent is a daemon that collects your metrics
  • Available on Windows and Unix-like systems
  • Rich capabilities out of the box
    • Natively supports the collection of a large set of OS-level metrics such as memory/CPU/storage/file statistics and much more
    • Provides native log monitoring capabilities
    • Can be extended
  • Select the direction of the communication between the Zabbix server and the Zabbix agent
    • Push the metrics to the Zabbix server with active checks
    • Let the Zabbix server poll the agent with passive checks
  • Control over the data collection interval
    • Ability to schedule checks and define flexible metric collection intervals
    • For example – You can collect metrics at a specific time or only during working hours

Why Zabbix agent 2?

Now that the key benefits of using a Zabbix agent are clear, let’s answer the question – why should I consider using Zabbix agent 2 instead of sticking with the classical agent?

The main goal of Zabbix Agent 2 is the ability to have a simple and flexible to extend the metric collection capabilities of the agent. This is true for both the internal development of new native Zabbix Agent 2 metrics and for custom Zabbix Agent 2 plugin development done by our community. We manage to achieve this goal by developing the Zabbix Agent 2 in GO. Less code, more flexibility, and a much more modular approach – all of this thanks to the GO language.

In addition to the aforementioned metric collection improvements, with Zabbix agent 2, we were also able to solve many ongoing design problems. The Zabbix agent 2 introduces improvements such as:

  • Support for check concurrency for active checks (this was not the case with the classical Zabbix Agent – active check metrics were collected one at a time)
  • Support for persistent data storage on the Agent side
  • Reduced number of TCP connections between the Zabbix agent 2 and Zabbix server
  • HTTPS web site checks out of the box on Windows
  • Concurrency support provides the ability to read multiple log files in parallel
  • Out of the box monitoring for many different applications

Let’s take a look at some of the more popular systems that Zabbix Agent 2 can monitor out of the box

Certificate monitoring

The ability to perform certificate monitoring out of the box has been a long-awaited feature. One of the more common requests was monitoring the certificate expiry date. With Zabbix agent 2, it is possible to perform certificate monitoring with a native Zabbix agent item:

Zabbix agent item key for certificate monitoring:

web.certificate.get[hostname,<port>,<IP>]

This item will return:

  • X.509 fields
  • Validation result
  • Fingerprint field

Example:

web.certificate.get[blog.zabbix.com,443]

This item will collect multiple certificate metrics in bulk. We can then obtain the necessary information by using the Zabbix dependent items. You can take a look and download the latest official template from our git page. The template already contains the necessary master/dependent items – all you have to do is import the template and apply it to your hosts.

IoT monitoring – MQTT

Zabbix Agent 2 is capable of performing IoT monitoring out of the box. Zabbix Agent 2 provides items for both MQTT and Modbus monitoring.

Below you can find an example of how the mqtt.get item can obtain metrics on specific MQTT topics:

mqtt.get["tcp://host:1883","path/to/topic"]
mqtt.get["tcp://host:1883","path/to/#"]

Zabbix Agent 2 is also officially supported on Raspberry Pi devices. This makes things even easier for IoT monitoring since we can simply deploy our Zabbix Agent 2 on a Raspberry Pi device in close proximity to our monitored IoT devices.

Out of the box database monitoring

With the classical agent, we had to resort to using user custom monitoring approaches for database monitoring. This was achieved either by using UserParameters, external scripts, or some other custom approach. With Zabbix agent 2, we provide native database monitoring for a large selection of SQL and NoSQL database engines.

You can find the official Zabbix database monitoring templates on our git page. 

Systemd monitoring

Another long-awaited feature is native systemd monitoring. Zabbix Agent 2 provides a flexible set of items and discovery rules with which you can monitor a specific systemd unit property, discover systemd services in an automated fashion and retrieve all of the systemd unit properties in bulk.

Discover a list of systemd units and their details:

systemd.unit.discovery[<type>]

Retrieve all properties of a systemd unit:

systemd.unit.get[unit name,<interface>]

Retrieve information about a specific property of a systemd unit:

systemd.unit.info[unit name,<property>,<interface>]

These items can then be used to define triggers like:

  • If service is scheduled at system bootup but not running right now, then generate a problem
  • If service is not scheduled at startup but running right now, notify us that we forgot to enable the service
  • and much more!

You can find more information about the official systemd template on our git page.

Docker monitoring

As with previous templates, the Zabbix Agent 2 docker monitoring also provides items for individual metrics and discovery rules for automated container discovery:

  • Discover all containers or only currently running containers automatically
  • Per container monitoring
    • CPU
    • Memory
    • Network

You can find more information about the official Docker template on our git page

Additional applications supported by Zabbix agent 2

And that’s not all! Zabbix Agent 2 provides out of the box monitoring for many other systems, like:

  • Ceph –  an open-source software storage platform
  • Memcached –  a general-purpose distributed memory-caching system
  • Smart – Self-Monitoring, Analysis, and Reporting Technology

If you’re interested in the full list of the official Zabbix templates, you can find all of them on our git page

Agent 2 plugins

The underlying Zabbix Agent 2 structure is based on GO plugins. This approach is used for both the official Zabbix Agent 2 items and should be used for the development of custom community extensions.

On startup, Zabbix agent 2 scans a specific directory and determines the supported interfaces per each plugin. Next, Zabbix will validate the existing plugin configuration and register each plugin in the aforementioned directory. Now we can begin the monitoring workflow. Once a metric has been requested, Zabbix agent 2 will check if the plugin responsible for collecting the particular metric is currently active. If it’s inactive – Agent 2 will check if the specific plugin supports the Runner interface and attempt to start it. Next, Agent 2 will check if the Configurator interface is available and perform the plugin configuration. Lastly, once the plugin is active, Agent 2 will collect the metric by using the Exporter interface. Next time the metric is requested – the plugin will already be active, and Agent 2 can immediately request the metric from the Exporter interface.

But is there a situation when a plugin can remain inactive – does it get unloaded after some time? The plugin does not stay loaded in memory indefinitely. If a plugin hasn’t received a request for 24 hours, the plugin will be deactivated, and it will get unloaded from the memory.

Loadable plugins

Let’s summarize the Zabbix Agent 2 plugin logic:

  • External plugins are loadable on Zabbix agent 2 startup, with no need to recompile Zabbix Agent 2
  • Connections bidirectionally to the plugins using Unix sockets on Linux and Named Pipes on Windows
  • Backward compatible with older plugins
  • The plugin is deactivated if:
    • any related passive item key has not been used for 24h
    • the active item is not in the active checklist
  • Custom plugin architecture remains the same as it was for the internal plugins
  • Separate repository for community plugins and integrations

Supported platforms for Agent 2

At this point, you may be wondering – what about compatibility? Can I use Zabbix Agent 2 as a replacement for the classical Zabbix Agent? Can it be used on the same platforms? Let’s take a look at the platforms on which you can deploy Zabbix Agent 2:

  • RHEL/CentOS 6,7,8
  • SLES 15 SP1+
  • Debian 9,10,11, Ubuntu 18.04, 20.04
  • Raspberry Pi OS, Ubuntu ARM64
  • Windows 7 and later, Windows Server 2008R2 and later

If you wish to deploy Agent 2 on a system that is not officially supported, the main takeaway is – GO environment needs to be supported on the system. This means that for Zabbix Agent 2 to run, you will have to provide a set of dependencies for GO language support. If that’s the case – you should be able to compile Zabbix Agent 2 on your system.

New Agent keys

Finally, let’s cover some new Zabbix agent item keys that are available in Zabbix 6.0 LTS. Since we don’t plan on halting the support for the classical Zabbix Agent, these item keys will be supported by both Zabbix Agent and Zabbix Agent 2.

Agent variant

  • agent.hostmetadata – obtains the agent metadata from the Zabbix agent configuration
  • agent.variant
    • Returns 1 for C agent – Zabbix agent
    • Returns 2 for Go agent – Zabbix agent 2

File properties

  • vfs.file.permissions – returns 4-digit string containing octal number with Unix permissions
  • vfs.file.owner – returns the user ownership of file
  • vfs.file.get – returns information about a file. Similar to the stat command result
  • vfs.dir.get – get information about directories and files
  • vfs.file.cksum – now with md5 and sha256
  • vfs.file.size – measure the file size bytes or in lines in the file

vfs.dir.get on Windows

Below is an example of how most .get item keys behave. Here we can see bulk information about the contents of a directory in a JSON array. This can then be used in low-level discovery to automatically monitor the parameters for each entity obtained by the vfs.dir.get item. Below is an example output of the vfs.dir.get key executed on Windows. Note that this is just a partial output – the real JSON file will most likely contain multiple such elements related to each of the files discovered in the directory.

[{
  "basename": "input.json",
  "pathname": "c:\\app1\\temp\\input.json",
  "dirname": "c:\\app1\\temp",
  "type": "file",
  "user": "AKADIKIS-840-G2\\aigars",
  "SID": "S-1-5-21-341453538-698488186-381249278-1001",
  "size": 2506752,
  "time": {
    "access": "2021-11-03T09:19:42.5662347+02:00",
    "modify": "2020-12-21T16:00:46+02:00",
    "change": "2020-12-29T12:20:10.0104822+02:00"
  },
  "timestamp": {
    "access": 1635923982,
    "modify": 1608559246,
    "change": 1609237210
  }
}]

vfs.file.get on Linux

As we can see, the output of vfs.file.get is also very similar to the previous get request. As I’ve mentioned before – the information here is similar to what the stat command provides.

{
  "basename": "passwd",
  "pathname": "/etc/passwd",
  "dirname": "/etc",
  "type": "file",
  "user": "root",
  "group": "root",
  "permissions": "0644",
  "uid": 0,
  "gid": 0,
  "size": 3348,
  "time": {
    "access": "2021-11-03T09:27:21+0200",
    "modify": "2021-10-24T13:18:18+0300",
    "change": "2021-10-24T13:18:18+0300"
},
"timestamp": {
    "access": 1635924441,
    "modify": 1635070698,
    "change": 1635070698
  }
}

More dimensions for discovery keys

The functionality of some of the existing keys has also been improved in Zabbix 6.0 LTS. For example, for vfs.fs.discovery and vfs.fs.get keys Zabbix will now also collect the file system label as the value of the {#FSLABEL} macro.

  • vfs.fs.discovery – will now retrieve an additional label value – {#FSLABEL}
  • vfs.fs.get – will now retrieve an additional label value – {#FSLABEL}
[{
  "{#FSNAME}": "C:",
  "{#FSTYPE}": "NTFS",
  "{#FSLABEL}": "System",
  "{#FSDRIVETYPE}": "fixed"
}]

Questions

Q: Can we run both of the agents at the same time – Zabbix Agent and Zabbix Agent 2?

A: Yes, both of the agents can be started on the same machine. All we have to do is adjust the listen port for one of the agents since, by default, both of them will try to listen on port 10050. Therefore, we need to switch that port to something else for one of the agents. You can also simply disable the passive checks for one of the agents, so it’s not listening for incoming connections at all – such an approach will also work.


Q: Can I use the Zabbix agent if I don’t have administrative privileges?

A: Yes, most definitely. You can run the agent under any other user both on Windows and Linux. Just make sure that the user has access to the information (logs, files, folders, for example) that the Zabbix agent needs to monitor.


Q: Are there any use cases where the classical C Zabbix agent is better than Zabbix agent 2?

A: First off, the binary size for the classical Zabbix agent is definitely smaller, so that’s one benefit. The Zabbix Agent 2 also has a more complex set of dependencies required to run it, so if for some reason we cannot provide the necessary GO dependencies for Zabbix agent 2, then the classical Zabbix agent is the way to go. In addition, if you’re using some kind of automation or orchestration tools to deploy Zabbix agents – having the same type of agent everywhere will make life easier for you, so that’s something else to take into account when pi

The post New Agent 2 features in Zabbix 6.0 LTS by Aigars Kadiķis / Zabbix Summit Online 2021 appeared first on Zabbix Blog.

Zabbix frontend as a control panel for your devices

Post Syndicated from Aigars Kadiķis original https://blog.zabbix.com/zabbix-frontend-as-a-control-panel-for-your-devices/15545/

The ability to define and execute scripts on different Zabbix components in different scenarios can be extremely powerful. There are many different use cases where we can execute these scripts – to remediate an issue, forward our alerts to an external system, and much more. In this post, we will cover one of the lesser-known use cases – creating a control panel of sorts in which we can execute different scripts directly from our frontend.


Configuration cache

Let’s use two very popular Zabbix runtime commands for our use case –  ‘zabbix_server -R config_cache_reload’ and ‘zabbix_proxy -R config_cache_reload’. These commands can be used to force the Zabbix server and Zabbix proxy components to load the configuration changes on demand.

First, let’s discuss how these commands work:

It all starts with the configuration cache frequency, which is configured for the central Zabbix server. Have a look at the output:

grep CacheUpdateFrequency= /etc/zabbix/zabbix_server.conf

And on the Zabbix proxy side, there is a similar setting. Let’s take a look:

grep ConfigFrequency= /etc/zabbix/zabbix_proxy.conf

With a stock installation we have ‘CacheUpdateFrequency=60‘ for ‘zabbix-server‘ and we have ‘ConfigFrequency=3600‘ for ‘zabbix-proxy‘. This parameter represents how fast the Zabbix component will pick up the configuration changes that we have made in the GUI.

Apart from the frequency, we have also another variable which is: how long it actually takes to run one configuration sync cycle. To find the precise time value, we can use this command:

ps auxww | egrep -o "[s]ynced.*sec"

The output will produce a line like:

synced configuration in 14.295782 sec, idle 60 sec

This means that it takes approximately 14 seconds to load the configuration cache from the database. Then there is a break for the next 60 seconds. After that, the process repeats.

When the monitoring infrastructure gets big, we might need to start using larger values for ‘CacheUpdateFrequency‘ and ‘ConfigFrequency‘. By reducing the configuration reload frequency, we can offload our database. The best possible configuration performance-wise is to install ‘CacheUpdateFrequency=3600‘ in ‘zabbix_server.conf‘ and use ‘ConfigFrequency=3600‘ (it’s the default value) in ‘zabbix_proxy.conf‘.

Some repercussions arise with such a configuration. When we use values that are this large, there will be a delay of one hour until newly created entities are monitored or changes are applied to the existing entities.

Setting up the scripts

I would like to introduce a way we can force the configuration to be reloaded via GUI.
Some prerequisites must be configured:

1) Make sure the  ‘Zabbix server‘ host belongs to the “Zabbix servers” host group.

2) On the server where service ‘zabbix-server‘ runs, install a new sudoers rule:

cd /etc/sudoers.d
echo 'zabbix ALL=(ALL) NOPASSWD: /usr/sbin/zabbix_server -R config_cache_reload' | sudo tee zabbix_server_config_cache_reload
chmod 0440 zabbix_server_config_cache_reload

The sudoers file is required because out of the box the service ‘zabbix-server‘ runs with user ‘zabbix‘ which does not have access to interact with the local system.

3) We will also create Zabbix hosts representing our Zabbix proxies. These hosts must belong to the ‘Zabbix proxies’ host group.

Notice that in the screenshot the host ‘127.0.0.1′ is using ‘Monitored by proxy‘. This is extremely important since we do not care about the agent interface in the use case with proxies – the interface can contain an arbitrary address/DNS name. What we care about is the ‘Monitored by proxy’ field. Our command will be executed on the proxy that we select here.

4) On the server where service ‘zabbix-proxy‘ runs, install a new sudoers rule:

cd /etc/sudoers.d
echo 'zabbix ALL=(ALL) NOPASSWD: /usr/sbin/zabbix_proxy -R config_cache_reload' | sudo tee zabbix_proxy_config_cache_reload
chmod 0440 zabbix_proxy_config_cache_reload

5) Make the following changes in the ‘/etc/zabbix/zabbix_proxy.conf‘ proxy configuration file: ‘EnableRemoteCommands=1‘. Restart the ‘zabbix-proxy’ service afterwards.

6) Open ‘Administration’ => ‘Scripts’ and define the following commands:
For the ‘Zabbix servers’ host group:

sudo /usr/sbin/zabbix_server -R config_cache_reload	

Since this is a custom command that we will execute, the type of the script will be ‘Script’. The first script will be executed on the Zabbix server – we are forcing the central Zabbix server to reload its configuration cache. In this example, all users with at least ‘Read’ access to the Zabbix server host will be able to execute the script. You can limit this as per your internal Zabbix policies.

Below you can see how it should look:

For the ‘Zabbix proxies’ host group:

sudo /usr/sbin/zabbix_proxy -R config_cache_reload	

The only thing that we change for the proxy script is the ‘Command’ and ‘Execute on’ parameters, since now the command will be executed on the Zabbix proxy which is monitoring the target host:

Frontend as a control panel

I prefer to add an additional host group “Control panel” which contains the central Zabbix server and all Zabbix proxies.

Now when we need to reload our configuration cache, we can open ‘Monitoring’ => ‘Hosts‘ and filter out host group ‘Control panel’. Then click on the proxy host in question and select ‘config cache reload proxy’:

It takes 5 seconds to complete and then we will see the result of script execution. In this case – ‘command sent successfully’:

By the way, we can bookmark this page too 😉

With this approach, you can create ‘Control panel’ host groups and scripts for different types of tasks that you can execute directly from the Zabbix frontend! This allows us to use our Zabbix frontend not just for configuration and data overview, but also as a control panel of sorts for our hosts.
If you have any questions, comments, or wish to share your use cases for using scripts in the frontend – leave us a comment! Your use case could be the one to inspire many other Zabbix community members to give it a try.

Agentless Oracle database monitoring with ODBC

Post Syndicated from Aigars Kadiķis original https://blog.zabbix.com/agentless-oracle-database-monitoring-with-odbc/15589/

Did you know that Zabbix has an out-of-the-box template for collecting Oracle database metrics? With this template, we can collect data like database, tablespace, ASM, and many other metrics agentlessly, by using ODBC. This blog post will guide you on how to set up ODBC monitoring for Oracle 11.2, 12.1, 18.5, or 19.2 database servers. This post can serve as the perfect set of guidelines for deploying Oracle database monitoring in your environment.

Download Instant client and SQLPlus

The provided commands apply for the following operating systems: CentOS 8, Oracle Linux 8, or Rocky Linux.

First we have to download the following packages:
oracle-instantclient19.12-basic-19.12.0.0.0-1.x86_64.rpm
oracle-instantclient19.12-sqlplus-19.12.0.0.0-1.x86_64.rpm
oracle-instantclient19.12-odbc-19.12.0.0.0-1.x86_64.rpm

Here we are downloading

Oracle instant client – required, to establish connectivity to an Oracle database
SQLPlus  – A tool that we can use to test the connectivity to an Oracle database
Oracle ODBC package – contains the required ODBC drivers and configuration scripts to enable ODBC connectivity to an Oracle database

Upload the packages to the Zabbix server (or proxy, if you wish to monitor your Oracle DB on a proxy) and place it in:

/tmp/oracle-instantclient19.12-basic-19.12.0.0.0-1.x86_64.rpm
/tmp/oracle-instantclient19.12-sqlplus-19.12.0.0.0-1.x86_64.rpm
/tmp/oracle-instantclient19.12-odbc-19.12.0.0.0-1.x86_64.rpm

Solve OS dependencies

Install ‘libaio’ and ‘libnsl’ library:

dnf -y install libaio-devel libnsl

Otherwise, we will receive errors:

# rpm -ivh /tmp/oracle-instantclient19.12-basic-19.12.0.0.0-1.x86_64.rpm
error: Failed dependencies:
        libaio is needed by oracle-instantclient19.12-basic-19.12.0.0.0-1.x86_64
        libnsl.so.1()(64bit) is needed by oracle-instantclient19.12-basic-19.12.0.0.0-1.x86_64
# rpm -ivh /tmp/oracle-instantclient19.12-basic-19.12.0.0.0-1.x86_64.rpm
error: Failed dependencies:
        libnsl.so.1()(64bit) is needed by oracle-instantclient19.12-basic-19.12.0.0.0-1.x86_64

Check if Oracle components have been previously deployed on the system. The commands below should provide an empty output:

rpm -qa | grep oracle
ldconfig -p | grep oracle

Install Oracle Instant Client

rpm -ivh /tmp/oracle-instantclient19.12-basic-19.12.0.0.0-1.x86_64.rpm

Make sure that the package ‘oracle-instantclient19.12-basic-19.12.0.0.0-1.x86_64’ is installed:

rpm -qa | grep oracle

LD config

The official Oracle template page at git.zabbix.com talks about the method to configure Oracle ENV Usage for the service. For this version 19.12 of instant client, it is NOT REQUIRED to create a ‘/etc/sysconfig/zabbix-server’ file with content:

export ORACLE_HOME=/usr/lib/oracle/19.12/client64
export PATH=$PATH:$ORACLE_HOME/bin
export LD_LIBRARY_PATH=$ORACLE_HOME/lib:/usr/lib64:/usr/lib:$ORACLE_HOME/bin
export TNS_ADMIN=$ORACLE_HOME/network/admin

While we did install the rpm package, the Oracle 19.12 client package did auto-configure LD path at the global level – it means every user on the system can use the Oracle instant client. We can see the LD path have been configured under:

cat /etc/ld.so.conf.d/oracle-instantclient.conf

This will print:

/usr/lib/oracle/19.12/client64/lib

To ensure that the required Oracle libraries are recognized by the OS, we can run:

ldconfig -p | grep oracle

It should print:

liboramysql19.so (libc6,x86-64) => /usr/lib/oracle/19.12/client64/lib/liboramysql19.so
libocijdbc19.so (libc6,x86-64) => /usr/lib/oracle/19.12/client64/lib/libocijdbc19.so
libociei.so (libc6,x86-64) => /usr/lib/oracle/19.12/client64/lib/libociei.so
libocci.so.19.1 (libc6,x86-64) => /usr/lib/oracle/19.12/client64/lib/libocci.so.19.1
libnnz19.so (libc6,x86-64) => /usr/lib/oracle/19.12/client64/lib/libnnz19.so
libmql1.so (libc6,x86-64) => /usr/lib/oracle/19.12/client64/lib/libmql1.so
libipc1.so (libc6,x86-64) => /usr/lib/oracle/19.12/client64/lib/libipc1.so
libclntshcore.so.19.1 (libc6,x86-64) => /usr/lib/oracle/19.12/client64/lib/libclntshcore.so.19.1
libclntshcore.so (libc6,x86-64) => /usr/lib/oracle/19.12/client64/lib/libclntshcore.so
libclntsh.so.19.1 (libc6,x86-64) => /usr/lib/oracle/19.12/client64/lib/libclntsh.so.19.1
libclntsh.so (libc6,x86-64) => /usr/lib/oracle/19.12/client64/lib/libclntsh.so

Note: If for some reason the ldconfig command shows links to other dynamic libraries – that’s when we might have to create a separate ENV file for Zabbix server/Proxy, which would link the Zabbix application to the correct dynamic libraries, as per the example at the start of this section.

Check if the Oracle service port is reachable

To save us some headache down the line, let’s first check the network connectivity to our Oracle database host. Let’s check if we can reach the default Oracle port at the network level. In this example, we will try to connect to the default Oracle database port, 1521. Depending on which port your Oracle database is listening for connections, adjust accordingly,. Make sure the output says ‘Connected to 10.1.10.15:1521’:

nc -zv 10.1.10.15 1521

Test connection with SQLPlus

We can simulate the connection to the Oracle database before moving on with the ODBC configuration. Make sure that the Oracle username and password used in the command are correct. For this task, we will first need to install the SQLPlus package.:

rpm -ivh /tmp/oracle-instantclient19.12-sqlplus-19.12.0.0.0-1.x86_64.rpm

To simulate the connection, we can use a one-liner command. In the example command I’m using the username ‘system’ together with the password ‘oracle’ to reach out to the Oracle database server ‘10.1.10.15’ via port ‘1521’ and connect to the service name ‘xe’:

sqlplus64 'system/oracle@(DESCRIPTION=(ADDRESS_LIST=(ADDRESS=(PROTOCOL=TCP)(HOST=10.1.10.15)(PORT=1521)))(CONNECT_DATA=(SERVER=DEDICATED)(SERVICE_NAME=xe)))'

In the output we can see: we are using the 19.12 client to connect to 11.2 server:

SQL*Plus: Release 19.0.0.0.0 - Production on Mon Sep 6 13:47:36 2021
Version 19.12.0.0.0
Copyright (c) 1982, 2021, Oracle.  All rights reserved.
Connected to:
Oracle Database 11g Express Edition Release 11.2.0.2.0 - 64bit Production

Note: This gives us an extra hint regarding the Oracle instant client – newer versions of the client are backwards compatible with the older versions of the Oracle database server. Though this doesn’t apply to every version of Oracle client/server, please check the Oracle instant client documentation first.

ODBC connector

When it comes to configuring ODBC, let’s first install the ODBC driver manager

dnf -y install unixODBC

Now we can see that we have two new files –  ‘/etc/odbc.ini’ (possibly empty) and ‘/etc/odbcinst.ini’.

The file ‘/etc/odbcinst.ini’ describes driver relation. Currently, when we ‘grep’ the keyword ‘oracle’ there is no oracle relation installed, the output is empty when we run:

grep -i oracle /etc/odbcinst.ini

Our next step is to Install Oracle ODBC driver package:

rpm -ivh /tmp/oracle-instantclient19.12-odbc-19.12.0.0.0-1.x86_64.rpm

The ‘oracle-instantclient*-odbc’ package contains a script that will update the ‘/etc/odbcinst.ini’ configuration automatically:

cd /usr/lib/oracle/19.12/client64/bin
./odbc_update_ini.sh / /usr/lib/oracle/19.12/client64/lib

It will print:

 *** ODBCINI environment variable not set,defaulting it to HOME directory!

Now when we print the file on the screen:

cat /etc/odbcinst.ini

We will see that there is the Oracle 19 ODBC driver section added at the end of the file::

[Oracle 19 ODBC driver]
Description     = Oracle ODBC driver for Oracle 19
Driver          = /usr/lib/oracle/19.12/client64/lib/libsqora.so.19.1
Setup           =
FileUsage       =
CPTimeout       =
CPReuse         =

It’s important to check if there are no errors produced in the output when executing the ‘ldd’ command. This ensures that the dependencies are satisfied and accessible and there are no conflicts with the library versioning:

ldd /usr/lib/oracle/19.12/client64/lib/libsqora.so.19.1

It will print something similar like:

linux-vdso.so.1 (0x00007fff121b5000)
libdl.so.2 => /lib64/libdl.so.2 (0x00007fb18601c000)
libm.so.6 => /lib64/libm.so.6 (0x00007fb185c9a000)
libpthread.so.0 => /lib64/libpthread.so.0 (0x00007fb185a7a000)
libnsl.so.1 => /lib64/libnsl.so.1 (0x00007fb185861000)
librt.so.1 => /lib64/librt.so.1 (0x00007fb185659000)
libaio.so.1 => /lib64/libaio.so.1 (0x00007fb185456000)
libresolv.so.2 => /lib64/libresolv.so.2 (0x00007fb18523f000)
libclntsh.so.19.1 => /usr/lib/oracle/19.12/client64/lib/libclntsh.so.19.1 (0x00007fb1810e6000)
libclntshcore.so.19.1 => /usr/lib/oracle/19.12/client64/lib/libclntshcore.so.19.1 (0x00007fb180b42000)
libodbcinst.so.2 => /lib64/libodbcinst.so.2 (0x00007fb18092c000)
libc.so.6 => /lib64/libc.so.6 (0x00007fb180567000)
/lib64/ld-linux-x86-64.so.2 (0x00007fb1864da000)
libnnz19.so => /usr/lib/oracle/19.12/client64/lib/libnnz19.so (0x00007fb17fdba000)
libltdl.so.7 => /lib64/libltdl.so.7 (0x00007fb17fbb0000)

When we executed the ‘odbc_update_ini.sh’ script, a new DSN (data source name) file was made in ‘/root/.odbc.ini’. This is a sample configuration ODBC configuration file which describes what settings this version of ODBC driver supports.

Let’s move this configuration file from the user directories to a location accessible system-wide:

cat /root/.odbc.ini | sudo tee -a /etc/odbc.ini

And remove the file from the user directory completely:

rm /root/.odbc.ini

This way, every user in the system will use only this one ODBC configuration file.

We can now alter the existing configuration – /etc/odbc.ini. I’m highlighting things that have been changed from the defaults:

[Oracle11g]
AggregateSQLType = FLOAT
Application Attributes = T
Attributes = W
BatchAutocommitMode = IfAllSuccessful
BindAsFLOAT = F
CacheBufferSize = 20
CloseCursor = F
DisableDPM = F
DisableMTS = T
DisableRULEHint = T
Driver = Oracle 19 ODBC driver
DSN = Oracle11g
EXECSchemaOpt =
EXECSyntax = T
Failover = T
FailoverDelay = 10
FailoverRetryCount = 10
FetchBufferSize = 64000
ForceWCHAR = F
LobPrefetchSize = 8192
Lobs = T
Longs = T
MaxLargeData = 0
MaxTokenSize = 8192
MetadataIdDefault = F
QueryTimeout = T
ResultSets = T
ServerName = //10.1.10.15:1521/xe
SQLGetData extensions = F
SQLTranslateErrors = F
StatementCache = F
Translation DLL =
Translation Option = 0
UseOCIDescribeAny = F
UserID = system
Password = oracle

DNS – Data source name. Should match the section name in brackets, e.g.:[Oracle11g]
ServerName – Oracle server address
UserID – Oracle user name
Password – Oracle user password

To test the connection from the command line, let’s use the isql command-line tool which should simulate the ODBC connection akin to what the Zabbix is doing when gathering metrics:

isql -v Oracle11g

The isql command in this example picks up the ODBC settings (Username, Password, Server address) from the odbc.ini file. All we have to do is reference the particular DSN – Oracle11g

On the other hand, if we do not prefer to keep the password on the filesystem (/etc/odbc.ini), we can erase the lines ‘UserID’ and ‘Password’. Then we can test the ODBC connection with:

isql -v Oracle11g 'system' 'oracle'

In case of a successful connection it should print:

+---------------------------------------+
| Connected!                            |
|                                       |
| sql-statement                         |
| help [tablename]                      |
| quit                                  |
|                                       |
+---------------------------------------+
SQL>

And that’s it for the ODBC configuration! Now we should be able to apply the Oracle by ODBC template in Zabbix

Don’t forget that we also need to provide the necessary Oracle credentials to start collecting Oracle database metrics:

The lessons learned in this blog post can be easily applied to ODBC monitoring and troubleshooting in general, not just Oracle. If you’re having any issues or wish to share your experience with ODBC or Oracle database monitoring – feel free to leave us a comment!

Maintaining Zabbix API token via JavaScript

Post Syndicated from Aigars Kadiķis original https://blog.zabbix.com/maintaining-zabbix-api-token-via-javascript/15561/

In this blog post, we will talk about maintaining and storing the Zabbix API session key in an automated fashion. The blog post builds upon the Close problem automatically via Zabbix API subject and can be used as extra configuration for this particular use-case. The blog post also shares a great example of synthetic monitoring by way of JavaScript preprocessing – how to emulate a scenario in an automated fashion and get alerted in case of any problems.

Prerequisites

First, let us create the Zabbix API user and user macros where we will store our username, password, Zabbix URL and the API session key.

1) Open “Administration” => “Users”. Create a new user ‘api’ with password ‘zabbix’. At the permissions tab set User Type “Zabbix Super Admin”.

2) Go to “Administration” => “General” => “Macros”. Configure base characteristics:

      {$Z_API_PHP} = http://demo.zabbix.demo/api_jsonrpc.php
     {$Z_API_USER} = api
 {$Z_API_PASSWORD} = zabbix
{$Z_API_SESSIONID} =

It’s OK to leave {$Z_API_SESSIONID} empty for now.

3) Let’s check if the Zabbix backend server can reach the Zabbix frontend server. Make sure that you are logged into the Zabbix backend server by looking up the zabbix_server process:

ps auxww | grep "[z]abbix_server.*conf"

Ensure that we can reach the Zabbix frontend by curling the Zabbix frontend server from the Zabbix backend server:

curl -s "http://demo.zabbix.demo/index.php" | grep Zabbix

4) Download template “Check and repair Zabbix API token” and import it in your instance.

5) Create a new host with an Agent interface and link the template. The IP address of the host does not matter. The template will use an agentless check to do the monitoring, it will use an “HTTP agent” item.

How it works

Our goal for today is to figure out a way to keep the Zabbix API authentication token up to date in a user macro. This way we can reuse the macro repeatedly for items, action operations and scripts that require for us to use the Zabbix API. We need to ensure that even if the token changes, the macro gets automatically updated with the new token value! Let’s try and understand each step of the underlying workflow required for us to achieve this goal.

The first component of our workflow is the “Validate session key raw” item. This is an HTTP agent item that performs a POST request with an arbitrary method – proxy.get in this case, but we could have used ANY other method. We simply want to check if an arbitrary Zabbix API call can be executed with the current {$Z_API_SESSIONID} macro value.

The second part of the workflow is the “Repair session key” dependent item. This item utilizes the JavaScript preprocessing step with custom JavaScript code to check the values obtained by the previous item and generate a new authentication token if that is necessary.

The third item – “Status”, is another dependent item that uses regular expression preprocessing steps to check for different error messages or status codes in the value of the “Validate session key raw” item. Most of the triggers defined in this template will react to the values obtained by this item.


Below you can see the full underlying workflow:

Code-wise, the magic is implemented with the following JavaScript code snippet:

if (value.match(/Session terminated/)) {

var req = new CurlHttpRequest();

// Zabbix API
var json_rpc='{$Z_API_PHP}'

// lib curl header
req.AddHeader('Content-Type: application/json');

// First request to get authentication token
var token =  JSON.parse(req.Post(json_rpc,
'{"jsonrpc":"2.0","method":"user.login","params":{"user":"{$Z_API_USER}","password":"{$Z_API_PASSWORD}"},"id":1,"auth":null}'
));

// If authentication was unsuccessful
if ( token.error )
{
// Login name or password is incorrect
return 32500;
}

else {
// Update the macro

// Get the global macro ID
// We cannot plot here a very native Zabbix macro because it will be automatically expanded
// Must use a workaround to distinguish a dollar sign from the actual macro name and merge with '+'
var id = JSON.parse(req.Post(json_rpc,
'{"jsonrpc":"2.0","method":"usermacro.get","params":{"output":["globalmacroid"],"globalmacro":true,"filter":{"macro":"{$'+'Z_API_SESSIONID'+'}"}},"auth":"'+token.result+'","id":1}'
)).result[0].globalmacroid;

// This line contains a keyword '+value+' which will grab exactly the previous value outside this JavaScript snippet
var overwrite = JSON.parse(req.Post(json_rpc,
'{"jsonrpc":"2.0","method":"usermacro.updateglobal","params":{"globalmacroid":"'+id+'","value":"'+token.result+'"},"auth":"'+token.result+'","id":1}'
));

// Return the id (an integer) of the macro, which was updated
return overwrite.result.globalmacroids[0];
}

} else {
return 0;
}

Throughout the JavaScript code, we are extracting a value from one step and using that as an input for the next step.

After the data has been collected, the values are analyzed by 4 triggers. 3 out of these 4 triggers prints a misconfiguration problem that requires a human investigation. We also have a “repairing Zabbix API session key in background” title, which is the main trigger that indicates a token has been expired and repair automatically.

And that’s it – now any integration that requires a Zabbix API authentication token can receive the current token value by referencing the user macro that we created in the article. We’ve ensured that the token is always going to stay up to date and in case of any issues, we will receive an alert from Zabbix!

Triggers, calculated and aggregated items in Zabbix 5.4

Post Syndicated from Aigars Kadiķis original https://blog.zabbix.com/triggers-calculated-and-aggregated-items-in-zabbix-5-4/14880/

In earlier Zabbix versions, we had three categories of things we could manage inside the instance — triggers, calculated items, and aggregated items. Each of them had its own syntax, so we could not be sure what syntax to use in a certain case. That’s why we introduced the unified syntax for every category inside the monitoring tool that will ease up the documentation task and the configuration process. To appreciate the innovation, we need to recap these three categories in Zabbix.

Contents

I. What’s different in Zabbix 5.4? (1:52)
II. Examples (9:20)
III. Aggregated checks (14:09)
IV. Questions & Answers (19:08)

The trigger is a logic implying calculating some formula. If it is true, it will generate an event, a so-called problem. At the same time, calculated items are doing calculations as well, but at the end, they store a value inside the database. This value will be either an integer or a floating number. So, both these things are doing calculations, but before Zabbix 5.4 the syntax was different.

What’s different in Zabbix 5.4?

Each item has a tag:tagvalue

It all starts almost with the item as it is how we collect the metrics. Previously, it was always an application type of thing. Whenever we designed an item, it could be a memory-type of thing, a network, CPU, etc. Now, we have these column tags.

TAG:TAGVALUE

As you can see in this example, the tag value is ‘Application’. This really lets us have a flawless upgrade operation. The ‘Application’ field is completely gone, and now we have only tags on this item level.

Period and time shift is one argument now

Previously, whenever we were dealing with trigger functions, most of the time, the first argument was the interval to be used as an input. We had two arguments: we could analyze metrics for the specified period with <period> and, to go back in time and use <time shift> after comma — <period>,<time shift>.

We have decided to use one argument — <period:time shift>.

If you want to analyze data for yesterday, or last week, or last year, you can now use one argument:

  • <1h> — during the last one hour,
  • <1h:now-1d> — during the same hour one day ago,
  • <1d:now/d> — yesterday during the day.

STR(), REGEX(), IREGEX() => FIND()

Another big change — the functions searching for the data containing a string will now be converted into one function — find().

So, the string function — STR(), which was less CPU-intensive, could search for a string. If we needed a more complex pattern, we used REGEX() or, in case-sensitive cases, the regular expression function — IREGEX(). Now, we can use a single function covering all the needs, including case-sensitive search, — find().

It contains more arguments, which specify a string way to search, and consumes less CPU power. Or we might really need to utilize the regular expression thing.

New syntax

So, in the earlier Zabbix version, the trigger had a curly parenthesis at the beginning and at the end, the key in the middle, and the trigger function mathematical calculations with the dot in the middle: {host:key.max(15m)}.

The unified syntax will always start with the function. This lets us use recursions — as some functions support multiple arguments, we can put a function inside the function thus eliminating the previous limitations: max(/host/key,15m).

This syntax is very similar to that used in the Linux file system — it starts with the forward slash, then comes the host name, and the item key with the interval (including shifting) after the first comma.

Now, the same syntax is used for triggers and calculated items. In addition, previously, we did have the aggregated items. Now, if you want to do some aggregation, you’ll have to use calculated items inside the interface.

Examples

Now, there are many things you can accomplish, which were not possible before.

Absolute time periods

We might need to know what has happened today, for instance, whether the workstation is on at 10 a.m. We can do it by summing up the agent.ping items. So, if the agent.ping is zero, then it is still offline and no one has turned the workstation on. Otherwise, the agent.ping will be 1.

sum(/host/key, 1d:now/d+1d) = 0 and time() > 100000

  • We might need to find out the maximum workstation uptime yesterday. If the uptime is bigger than 10 hours, a person might have been working at the computer for too long and might need a reminder that there’s life outside.

trendmax(/host/key, 1d:now/d)>10h

  • When analyzing user sessions, we might search for the maximum peak last week. To do that, here we compare the last week’s peak with yesterday’s peak and find out that it has doubled. So, it’s a problem and we can get an event.

trendmax(/host/key, 1d:now/d) > trendmax(/host/key, 1d:now/w) / 2

  • We can also analyze activity, for instance, the stock module memory utilization per Windows machine for the previous month. So, we are looking at the maximum memory used during the previous month per server, not the workstation, and then compare the used memory with the memory available.

trendmax(/host/key1, 1M:now/M) < last(/host/key2) / 2

Here, the server is not utilizing half of the available memory, so we will get notified.

The beauty of this trigger is that the stock template already contains all those 12 items — a collection per-used memory, a collection per-total memory. All we need to do is go to the Trigger section, install this trigger, and as soon as one single metric comes in, it will generate the event about the last month as all the data is stored inside the database.

Compare string between two hosts

Now, we can compare text strings. We can use a different type of input, for instance, different servers (say, node 1, node 2), and compare the agent versions. If the version is different or the same, you can decide what the problem is. It will fire up an event, and we can indicate what the difference between those versions is in the event title.

last(/node1/agent.version) <> last(/node2/agent.version)

Aggregated checks

Aggregation on current host (foreach)

You might need to calculate something and store the data in the database.

In this example, if we have a website. we will have a template containing a web scenario, which consists of multiple steps, such as checking for pages. It will provide the Latest data page and the response time per page.

In the Templates, we can select this calculated item, and, for instance, aggregate all those built-in response time metrics.

Average web page response time: avg(last_foreach(//web.test.time[check performance,*,resp]))

The ‘*’, the wildcard, will tell Zabbix to aggregate all the items reflecting the response time, and the double forward slash means aggregation for the current host. ‘foreach’ will now be all over the place whenever we do the aggregation. This command is the same as used in the Windows PowerShell used to go through the different types of elements: either through the hosts, either through the items.

We might use a different type of aggregation using the same approach. For instance, when monitoring the disk space, we are capturing the used space by the Linux or Windows machine that can have different drives or different modes. Using one calculated item, we can aggregate the total used space per all the mounts or all the drives on the server. This might be useful, for instance, to estimate how much disk space you need if it’s time to purchase an SSD drive.

Total used space on all drives: sum(last_foreach(//vfs.fs.size[*,used]))

Aggregation by host group

Another type of functionality — aggregation by the host group.

You might have a group, for instance, ‘MySQL servers’ with the official solution looking for the queries per second. It will aggregate all the queries per second in one single item. If there is a pool of MySQL servers, then you will end up seeing the total number of these queries and afterward linking a trigger on this item.

MySQL queries per second: sum(last_foreach(/*/mysql.queries.rate?[group=”MySQL servers”]))

Aggregation by tag:value

You can do the aggregation not only by host group but also by utilizing the item Tags (tag name and tag value). It does not need to be a tag on the item level. You can mark your host element with the role on the host level. So, you create this item inside the template, and it will search for all these items, which belong to a specific host with this tag and tag value, and do the aggregation. You will end up with an item, which has used space metrics (domain controllers in this example).

Used space on domain controllers: sum(last_foreach(/*/vfs.fs.size[*,used]?[tag=”Role:Domain Controller”]))

Questions & Answers

Question. After the upgrade, what will happen with the trigger item syntax? Do we have to rebuild everything?

Answer. It gets upgraded automatically. However, as per the results of my testing in the test environment, some items have to be checked. I would highly suggest extracting the configuration and testing the upgrade process beforehand to learn how those items will affect the system (just to be on the safe side).

Question. Are there any changes or improvements in the predictive trigger syntax?

Answer. You should definitely take a look at the roadmap for the exact information.

Question. When we’re doing an aggregation, is it always going to be on a single host or can we specify a host group or a tag?

Answer. Surely. Aggregation by host group is possible as it was before. Still, it’s more flexible now. We need to specify a host, a wildcard for the host item, and then we can add additional value by using the host group or by specifying what kind of tag the item should have. Then your parameters will be respected. We can combine all those things, that is, filter by host group and by the tag name and tag value.

In addition, when we’re doing the upgrade, the prototype items and triggers for the low-level discovery rules are also going to be automatically switched over.


Correlation between devices across client site

Post Syndicated from Aigars Kadiķis original https://blog.zabbix.com/correlation-between-devices-across-client-site/14657/

In this blog post, we will talk about aggregating different kinds of devices that are disconnected from the general network. Finding out how many devices per kind are “down” right now. This can be useful in the Internet Service Provider type of situation.

A property

It all starts with a property.

A property can be a building, a block. Most likely it has a firewall and a core switch at the top of everything.

A building can have floors. Floors can own a switch. An edge switch.

Each floor can have rooms or departments. It may be enough to put there a router to feed all devices around.

Vision

When something goes off, we want to see “what is the damage?” If a major component goes down, that should be a priority to concentrate on.

In general, we target much more descriptive message like:

=> 2 edge switches down

=> A core switch is down

=> 15 routers down

=> Firewall is down

For the best experience, we target to have only one message.

Prerequisites

To inform us how many devices are down, we need to make sure:

1) Each client host must belong to a host group. The name of host group describes the location of the property, for example “Riga/Block7”:

2) Each host object owns a macro {$PROPERTY_HOST_GROUP}. This can be delivered through the template. The macro value must be the same as the name of the host group: “Riga/Block7”

3) There is one virtual host in the client pool. This host will do the aggregations, determine what kind of devices are down and how many of them.

4) At least one passive check must work for devices. SNMP polling must be in place.

How it works?

Monitoring software is executing passive checks:

As a result, it will generate red/green icons:

A “Zabbix internal” type can read the status of the icon:

zabbix[host,agent,"available"]
zabbix[host,snmp,"available"]

if the icon is red, a number 0 will be reported

if the icon is green, a number 2 will be reported

2 items in the template

There are 2 items in the template per category. At first, the “availability” item fetch the status of the icon and then a dependable item transforms this information into another number:

// Router:
if (value == 0) {return 1} else {return 0}

// Switch:
if (value == 0) {return 100} else {return 0}

// Core switch:
if (value == 0) {return 100000} else {return 0}

// Firewall:
if (value == 0) {return 1000000} else {return 0}

Aggregation

Each device type will generate numbers like 1 or 100 or 100000 or 1000000.

We can have 2 options:

1) Link a trigger directly on the calculated number. If the integer number is bigger, it’s more critical to the client.

2) We can also operate with dependable items. Here is one method to transform calculated item back into dependent items:

// Routers down:
if (value == 0) {return 1} else {return 0}

// Switches down:
if (value > 99) {return value.replace(/..$/,"") % 1000} else {return 0}
// % 1000 is because the client can have 999 switches

// Core switches down:
if (value > 99999) {return value.replace(/.....$/,"") % 10} else {return 0}
// % 10 is because the client can have 9 core switches

// Firewalls down:
if (value > 999999) {return value.replace(/......$/,"") % 10} else {return 0}
// % 10 is because the client can have 9 firewalls

Detect flapping

It would be quite useful to detect when some devices are changing up/down too frequently. No elegant solution here, be we can have a workaround. We can clone all 4 items:

and, per each item, add a second preprocessing step “Discard unchanged”:

We will result up in +4 items:

One last step, to create additional +4 items to count how many metrics the “changes” item did receive. Here is a sample of one:

Macro value of {$FLAP} can be ‘1d’.

Known issues with the solution to detect flapping

If service ‘zabbix-server’ will receive a restart, It will generate “+1 flap” per each device type.

If a device in one category change state to “up” and another device in the same category in the same minute changes state to “down”. This will not be detected 🙁

How far we can go?

How many classifications we can use? The calculated item is limited to a 64-bit integer which is ‘18446744073709551615’, there are 20 digits in this number. Because it starts with a ‘1’ it means that safely we can use only 19 digits.

Proof of concept template

available

There are 6 templates included in one XML file:

To use this solution:

1) Import XML file.

2) Clone “Property” template.

3) Open a cloned “Property” template and install the correct value of macro {$PROPERTY_HOST_GROUP}. Value must be the same a the host group where all client devices are in.

4) In the same host group where all client devices are in, create a dummy host, apply the “aggregate status” template and assign “Property” template to this host.

5) Assign “binary” templates (the ones which contain a ‘1’ in a name) to devices (switches, core switches, firewalls) the client owns.

Alright, that is it for today. Bye!

Save 2 clicks, test data preprocessing

Post Syndicated from Aigars Kadiķis original https://blog.zabbix.com/save-2-clicks-test-data-preprocessing/13249/

This topic is related to template development from scratch, bulk data input, and a lot of dependable items having different preprocessing steps each.

If these keywords resonate with you, keep reading.

Story stars back in a day when a “Test now” button was invented inside the item preprocessing section. In this way, we can simulate the entire preprocessing stack. A very cool feature to have.

Nevertheless, we tend to copy over and over again the data input:

While this is fine for small projects with simple preprocessing steps which match our knowledge league. It is not so OK in we have ambition to solve the impossible. Figure out a data preprocessing rule(s) which suit our needs.

For a template development process, the solution is to skip data input and inject a static value in the very first preprocessing step. Let me introduce the concept.

JavaScript preprocessing step 1:

return 'this is input text';

JavaScript preprocessing step 2:

return value.replace("text","data");

Now we have static input, no need to spend time to “click” the input data.

Sometimes the input is not just one line but multiple lines, and tabs, and spaces and double quotes and single quotes and special characters. To respect all these things, we must get our hands dirty with the base64 format.

To prepare input data as base64 string, on windows systems it can be easily done with Notepad++. Just select all text and select “Plugin commands” => “Base64 Encode” (functionality is not there with a lite version of Notepad++):

After that, we need to copy all content to clipboard:

Create the first JavasSript preprocessing with the content from the clipboard. Here is the same example:

return 'PD94bWwgdmVyc2lvbj0iMS4wIiBlbmNvZGluZz0iVVRGLTE2Ij8+DQo8am9ibG9nPg0KICA8am9iX2xvZ192ZXJzaW9uIHZlcnNpb249IjIuMCIvPg0KICA8aGVhZGVyPg0KICAgIDxzdGFydF90aW1lPkpvYiBzdGFydGVkOiBNb25kYXksIEF1Z3VzdCAxMCwgMjAyMCBhdCAxOjAwOjA1IFBNPC9zdGFydF90aW1lPg0KICA8L2hlYWRlcj4NCiAgPGZvb3Rlcj4NCiAgICA8ZW5kX3RpbWU+Sm9iIGVuZGVkOiBNb25kYXksIEF1Z3VzdCAxMCwgMjAyMCBhdCAzOjE3OjUwIFBNPC9lbmRfdGltZT4NCiAgICA8T3BlcmF0aW9uRXJyb3JzIFR5cGU9ImpvYmZ0cl9qb2Jjb21wbF9zaHV0ZG93biI+Sm9iIGNvbXBsZXRpb24gc3RhdHVzOiBDYW5jZWxlZCBieSBzZXJ2aWNlIHNodXRkb3duPC9PcGVyYXRpb25FcnJvcnM+DQogICAgPGNvbXBsZXRlU3RhdHVzPjE8L2NvbXBsZXRlU3RhdHVzPg0KICAgIDxhYm9ydFVzZXJOYW1lPlRoZSBqb2Igd2FzIGNhbmNlbGVkIGJlY2F1c2UgdGhlIHJlc3BvbnNlIHRvIGEgbWVkaWEgcmVxdWVzdCBhbGVydCB3YXMgQ2FuY2VsLCBvciBiZWNhdXNlIHRoZSBhbGVydCB3YXMgY29uZmlndXJlZCB0byBhdXRvbWF0aWNhbGx5IHJlc3BvbmQgd2l0aCBDYW5jZWwsIG9yIGJlY2F1c2UgdGhlIEJhY2t1cCBFeGVjIEpvYiBFbmdpbmUgc2VydmljZSB3YXMgc3RvcHBlZC48L2Fib3J0VXNlck5hbWU+DQogIDwvZm9vdGVyPg0KPC9qb2Jsb2c+DQo=';

In the next step, there must be decoding scheduled. Kindly copy the code 1:1. Configure it as a second preprocessing step:

var k = "ABCDEFGHIJKLMNOPQRSTUVWXYZabcdefghijklmnopqrstuvwxyz0123456789+/="
function d(e) {
    var t, n, o, r, a = "",
        i = "",
        c = "",
        l = 0;
    for (/[^A-Za-z0-9+/=]/g.exec(e) && alert("1"), e = e.replace(/[^A-Za-z0-9+/=]/g, ""); t = k.indexOf(e.charAt(l++)) << 2 | (o = k.indexOf(e.charAt(l++))) >> 4, n = (15 & o) << 4 | (r = k.indexOf(e.charAt(l++))) >> 2, i = (3 & r) << 6 | (c = k.indexOf(e.charAt(l++))), a += String.fromCharCode(t), 64 != r && (a += String.fromCharCode(n)), 64 != c && (a += String.fromCharCode(i)), t = n = i = "", o = r = c = "", l < e.length;);
    return unescape(a)
}
return d(value);

This is how it looks like:

Go to testing section and ensure the data in Zabbix is similar as it was in Notepad++:

Data has been successfully decoded. Multiple lines, quite original stuff. The tabs are not visible with a naked human eye but they are there, I promise!

Now we can “play” out the next preprocessing steps and try out different things:

When one preprocessing has been figured out, just clone the item and start to developing a next one. Sure, if we succeed the ambition, it will be required to spend 5 minutes to go through all items, remove first 2 steps and link the item to master key 😉

Ok. That is it for today. Bye.

By the way, on Linux system to have base64 string we only need:

  1. A command where the output entertains us
  2. Pipe it to ‘base64 -w0’
systemctl list-unit-files --type=service | base64 -w0

What takes disk space

Post Syndicated from Aigars Kadiķis original https://blog.zabbix.com/what-takes-disk-space/13349/

In today’s class let’s talk about where the disk space goes. Which items and hosts objects consume the disk space the most.

The post will cover things like:
Biggest tables in a database
Biggest data coming to the instance right now
Biggest data inside one partition of the DB table
Print hosts and items which consumes the most disk space

Biggest tables

In general, the leading tables are:

history
history_uint
history_str
history_text
history_log
events

‘history_uint’ will store integers. ‘history’ will store decimal numbers.
‘history_str’, ‘history_text’, ‘history_log’ stores textual data.
In the table ‘events’ goes problem events, internal events, agent auto-registration events, discovery events.

Have a look yourself in a database which tables take the most space. On MySQL:

SELECT table_name,
       table_rows,
       data_length,
       index_length,
       round(((data_length + index_length) / 1024 / 1024 / 1024),2) "Size in GB"
FROM information_schema.tables
WHERE table_schema = "zabbix"
ORDER BY round(((data_length + index_length) / 1024 / 1024 / 1024),2) DESC
LIMIT 8;

On PostgreSQL:

SELECT *, pg_size_pretty(total_bytes) AS total , pg_size_pretty(index_bytes) AS index ,
       pg_size_pretty(toast_bytes) AS toast , pg_size_pretty(table_bytes) AS table
FROM (SELECT *, total_bytes-index_bytes-coalesce(toast_bytes, 0) AS table_bytes
   FROM (SELECT c.oid,
             nspname AS table_schema,
             relname AS table_name ,
             c.reltuples AS row_estimate ,
             pg_total_relation_size(c.oid) AS total_bytes ,
             pg_indexes_size(c.oid) AS index_bytes ,
             pg_total_relation_size(reltoastrelid) AS toast_bytes
      FROM pg_class c
      LEFT JOIN pg_namespace n ON n.oid = c.relnamespace
      WHERE relkind = 'r' ) a) a;

Detect big data coming to instance right now

Analyze ‘history_log’ table for the last 30 minutes:

SELECT hosts.host,items.itemid,items.key_,
COUNT(history_log.itemid)  AS 'count', AVG(LENGTH(history_log.value)) AS 'avg size',
(COUNT(history_log.itemid) * AVG(LENGTH(history_log.value))) AS 'Count x AVG'
FROM history_log 
JOIN items ON (items.itemid=history_log.itemid)
JOIN hosts ON (hosts.hostid=items.hostid)
WHERE clock > UNIX_TIMESTAMP(NOW() - INTERVAL 30 MINUTE)
GROUP BY hosts.host,history_log.itemid
ORDER BY 6 DESC
LIMIT 1\G

With PostgreSQL:

SELECT hosts.host,history_log.itemid,items.key_,
COUNT(history_log.itemid) AS "count", AVG(LENGTH(history_log.value))::NUMERIC(10,2) AS "avg size",
(COUNT(history_log.itemid) * AVG(LENGTH(history_log.value)))::NUMERIC(10,2) AS "Count x AVG"
FROM history_log 
JOIN items ON (items.itemid=history_log.itemid)
JOIN hosts ON (hosts.hostid=items.hostid)
WHERE clock > EXTRACT(epoch FROM NOW()-INTERVAL '30 MINUTE')
GROUP BY hosts.host,history_log.itemid,items.key_
ORDER BY 6 DESC
LIMIT 5
\gx

Re-run the same query but replace ‘history_log’ (in all places) with ‘history_text’ or ‘history_str’.

Which hosts consume the most space

This is a very heavy query. We will go back one day and analyze 6 minutes of that data:

SELECT ho.hostid, ho.name, count(*) AS records, 
(count(*)* (SELECT AVG_ROW_LENGTH FROM information_schema.tables 
WHERE TABLE_NAME = 'history_text' and TABLE_SCHEMA = 'zabbix')/1024/1024) AS 'Total size average (Mb)', 
sum(length(history_text.value))/1024/1024 + sum(length(history_text.clock))/1024/1024 + sum(length(history_text.ns))/1024/1024 + sum(length(history_text.itemid))/1024/1024 AS 'history_text Column Size (Mb)'
FROM history_text
LEFT OUTER JOIN items i on history_text.itemid = i.itemid 
LEFT OUTER JOIN hosts ho on i.hostid = ho.hostid 
WHERE ho.status IN (0,1)
AND clock > UNIX_TIMESTAMP(now() - INTERVAL 1 DAY - INTERVAL 6 MINUTE)
AND clock < UNIX_TIMESTAMP(now() - INTERVAL 1 DAY)
GROUP BY ho.hostid
ORDER BY 4 DESC
LIMIT 5\G

If “6-minute query” works in a relatively good time frame, try “INTERVAL 60 MINUTE”.
If “INTERVAL 60 MINUTE” works good, try “INTERVAL 600 MINUTE”.

Analyze in partition level (MySQL)

On MySQL, if database table partitioning is enabled we can list the biggest partitions on a filesystem:

ls -lh history_log#*

It will print:

-rw-r-----. 1 mysql mysql  44M Jan 24 20:23 history_log#p#p2021_02w.ibd
-rw-r-----. 1 mysql mysql  24M Jan 24 21:20 history_log#p#p2021_03w.ibd
-rw-r-----. 1 mysql mysql 128K Jan 11 00:59 history_log#p#p2021_04w.ibd

From previous output, we can take partition name ‘p2021_02w’ and use it in a query:

SELECT ho.hostid, ho.name, count(*) AS records, 
(count(*)* (SELECT AVG_ROW_LENGTH FROM information_schema.tables 
WHERE TABLE_NAME = 'history_log' and TABLE_SCHEMA = 'zabbix')/1024/1024) AS 'Total size average (Mb)', 
sum(length(history_log.value))/1024/1024 + 
sum(length(history_log.clock))/1024/1024 +
sum(length(history_log.ns))/1024/1024 + 
sum(length(history_log.itemid))/1024/1024 AS 'history_log Column Size (Mb)'
FROM history_log PARTITION (p2021_02w)
LEFT OUTER JOIN items i on history_log.itemid = i.itemid 
LEFT OUTER JOIN hosts ho on i.hostid = ho.hostid 
WHERE ho.status IN (0,1)
GROUP BY ho.hostid
ORDER BY 4 DESC
LIMIT 10;

You can reproduce a similar scenario while listing:

ls -lh history_text#*
ls -lh history_str#*

Free up disk space (MySQL)

Deleting a host in GUI will not free up data space on MySQL. It will create empty rows in table where the new data can be inserted. If you want to really free up disk space, we can rebuild partition. At first list all possible partition names:

SHOW CREATE TABLE history\G

To rebuild partition:

ALTER TABLE history REBUILD PARTITION p202101160000;

Free up disk space (PostgreSQL)

On PostgreSQL, there is a process which is responsible for vacuuming the table. To ensure a vacuum has been done lately, kindly run:

SELECT schemaname, relname, n_live_tup, n_dead_tup, last_autovacuum
FROM pg_stat_all_tables
WHERE n_dead_tup > 0
ORDER BY n_dead_tup DESC;

In output, we look at ‘n_dead_tup’ it means a dead tuple.
If the last auto vacuum has not occurred in last 10 days, it’s bad. We have to install a different definition. We can increase vacuum priority by having:

vacuum_cost_page_miss = 10
vacuum_cost_page_dirty = 20
autovacuum_vacuum_threshold = 50
autovacuum_vacuum_scale_factor = 0.01
autovacuum_vacuum_cost_delay = 20ms
autovacuum_vacuum_cost_limit = 3000
autovacuum_max_workers = 6

Alright. That is it for today.

Examine Data Overview

Post Syndicated from Aigars Kadiķis original https://blog.zabbix.com/examine-data-overview/13225/

In this lab, let’s practice to create an on-screen report of the data (most recent metrics) which is very important for us.

This post represents one technique how to advance from functionality under:
“Monitoring” => “Overview”.

To create a report of the things you are fancy, we need to somehow mark those things. We need to mark items to belong under a specific application. The best way is to modify the name of an existing application and add some extra keywords inside. Please don’t create a second application. I will explain later why to not do so.

Here is a thought process of how to mark items under a single application.

Sample 1:

Total Memory
Total amount of CPU cores

Sample 2:

Current usage CPU
Current usage Memory

Sample 3:

TCP state ESTABLISHED
TCP state LISTEN
TCP state TIME_WAIT
...

It’s always only one application. Notice that each group has a common keyword: “Total”, “Current usage”, “TCP state”.

Now to list the data coming from a specific application:

  1. “Monitoring” => “Overview”
  2. Select “Data overview”
  3. Pick a “Host groups”
  4. Set an “Application”
  5. On the right top corner set Hosts location: “Left”
  6. Apply

It is always quite challenging to think of a naming system which is very independent and not overlapping. Good luck and keep “challenge accepted” running in your heart.

Of course, you can create an “extra” application for each item, for example, an application “Overview1”, but that will create a duplicate entry while browsing data under:
“Monitoring” => “Latest data”.

It’s possible to reach some limitations in the “Data overview” page if there are more than 50 entries to represent. We will see the message at the bottom of the page:

Not all results are displayed. Please provide more specific search criteria.

To solve this problem starting with 5.2 there is an option to configure the limit (default is 50):

On version 5.0 to customize this, have to modify ‘defines.inc.php’

# cd /usr/share/zabbix/include
# grep ZBX_MAX_TABLE_COLUMNS defines.inc.php
define('ZBX_MAX_TABLE_COLUMNS', 50);

Summarize devices that are not reachable

Post Syndicated from Aigars Kadiķis original https://blog.zabbix.com/summarize-devices-that-are-not-reachable/13219/

In this lab, we will list all devices which are not reachable by a monitoring tool. This is good when we want to improve the overall monitoring experience and decrease the size queue (metrics which has not been arrived at the instance).

Tools required for the job: Access to a database server or a Windows computer with PowerShell

To summarize devices that are not reachable at the moment we can use a database query. Tested and works on 4.0, 5.0, on MySQL and PostgreSQL:

SELECT hosts.host,
       interface.ip,
       interface.dns,
       interface.useip,
       CASE interface.type
           WHEN 1 THEN 'ZBX'
           WHEN 2 THEN 'SNMP'
           WHEN 3 THEN 'IPMI'
           WHEN 4 THEN 'JMX'
       END AS "type",
       hosts.error
FROM hosts
JOIN interface ON interface.hostid=hosts.hostid
WHERE hosts.available=2
  AND interface.main=1
  AND hosts.status=0;

A very similar (but not exactly the same) outcome can be obtained via Windows PowerShell by contacting Zabbix API. Try this snippet:

$headers = New-Object "System.Collections.Generic.Dictionary[[String],[String]]"
$headers.Add("Content-Type", "application/json")
$url = 'http://192.168.1.101/api_jsonrpc.php'
$user = 'api'
$password = 'zabbix'

# authorization
$key = Invoke-RestMethod $url -Method 'POST' -Headers $headers -Body "
{
    `"jsonrpc`": `"2.0`",
    `"method`": `"user.login`",
    `"params`": {
        `"user`": `"$user`",
        `"password`": `"$password`"
    },
    `"id`": 1
}
" | foreach { $_.result }
echo $key

# filter out unreachable Agent, SNMP, JMX, IPMI hosts
Invoke-RestMethod $url -Method 'POST' -Headers $headers -Body "
{
    `"jsonrpc`": `"2.0`",
    `"method`": `"host.get`",
    `"params`": {
        `"output`": [`"interfaces`",`"host`",`"proxy_hostid`",`"disable_until`",`"lastaccess`",`"errors_from`",`"error`"],
        `"selectInterfaces`": `"extend`",
        `"filter`": {`"available`": `"2`",`"status`":`"0`"}
    },
    `"auth`": `"$key`",
    `"id`": 1
}
" | foreach { $_.result }  | foreach { $_.interfaces } | Out-GridView

# log out
Invoke-RestMethod $url -Method 'POST' -Headers $headers -Body "
{
    `"jsonrpc`": `"2.0`",
    `"method`": `"user.logout`",
    `"params`": [],
    `"id`": 1,
    `"auth`": `"$key`"
}
"

Set a valid credential (URL, username, password) on the top of the code before executing it.

The benefit of PowerShell here is that we can use some on-the-fly filtering:

What is the exact meaning of the field ‘type’ we can understand by looking on the previous database query:

       CASE interface.type
           WHEN 1 THEN 'ZBX'
           WHEN 2 THEN 'SNMP'
           WHEN 3 THEN 'IPMI'
           WHEN 4 THEN 'JMX'
       END AS "type",

On Windows PowerShell, it is possible to download the unreachable hosts directly to CSV file. To do that, in the code above, we need to change:

Out-GridView

to

Export-Csv c:\temp\unavailable.hosts.csv

Alright, this was the knowledge bit today. Let’s keep Zabbixing!

Close problem automatically via Zabbix API

Post Syndicated from Aigars Kadiķis original https://blog.zabbix.com/close-problem-automatically-via-zabbix-api/12461/

Today we are talking about a use case when it’s impossible to find a proper way to write a recovery expression for the Zabbix trigger. In other words, we know how to identify problems. But there is no good way to detect when the problem is gone.

This mostly relates to a huge environment, for example:

  • Got one log file. There are hundreds of patterns inside. We respect all of them. We need them
  • SNMP trap item (snmptrap.fallback) with different patterns being written inside

In these situations, the trigger is most likely configured to “Event generation mode: Multiple.” This practically means: when a “problematic metric” hits the instance, it will open +1 additional problem.

Goal:
I just need to receive an email about the record, then close the event.

As a workaround (let’s call it a solution here), we can define an action which will:

  1. contact an API endpoint
  2. manually acknowledge the event and close it

The biggest reason why this functionality is possible is that: when an event hits the action, the operation actually knows the event ID of the problem. The macro {EVENT.ID} saves the day.

To solve the problem, we need to install API characteristics at the global level:

     {$Z_API_PHP}=http://127.0.0.1/api_jsonrpc.php
    {$Z_API_USER}=api
{$Z_API_PASSWORD}=zabbix

NOTE
‘http://127.0.0.1/api_jsonrpc.php’ means the frontend server runs on the same server as systemd:zabbix-server. If it is not the case, we need to plot a front-end address of Zabbix GUI + add ‘api_jsonrpc.php’.

We will have 2 actions. The first one will deliver a notification to email:

After 1 minute, a second action will close the event:

This is a full bash snippet we must put inside. No need to change anything. It works with copy and paste:

url={$Z_API_PHP}
    user={$Z_API_USER}
password={$Z_API_PASSWORD}

# authorization
auth=$(curl -sk -X POST -H "Content-Type: application/json" -d "
{
	\"jsonrpc\": \"2.0\",
	\"method\": \"user.login\",
	\"params\": {
		\"user\": \"$user\",
		\"password\": \"$password\"
	},
	\"id\": 1,
	\"auth\": null
}
" $url | \
grep -E -o "([0-9a-f]{32,32})")

# acknowledge and close event
curl -sk -X POST -H "Content-Type: application/json" -d "
{
	\"jsonrpc\": \"2.0\",
	\"method\": \"event.acknowledge\",
	\"params\": {
		\"eventids\": \"{EVENT.ID}\",
		\"action\": 1,
		\"message\": \"Problem resolved.\"
	},
	\"auth\": \"$auth\",
	\"id\": 1
}" $url

# close api key
curl -sk -X POST -H "Content-Type: application/json" -d "
{
    \"jsonrpc\": \"2.0\",
    \"method\": \"user.logout\",
    \"params\": [],
    \"id\": 1,
    \"auth\": \"$auth\"
}
" $url

Zabbix API scripting via curl and jq

Post Syndicated from Aigars Kadiķis original https://blog.zabbix.com/zabbix-api-scripting-via-curl-and-jq/12434/

In this lab we will use a bash environment and utilities ‘curl’ and ‘jq’ to perform Zabbix API calls, do some scripting.

‘curl’ is a tool to exchange JSON messages over HTTP/HTTPS.
‘jq’ utility helps to locate and extract specific elements in output.

To follow the lab we need to install ‘jq’:

# On CentOS7/RHEL7:
yum install epel-release && yum install jq

# On CentOS8/RHEL8:
dnf install jq

# On Ubuntu/Debian:
apt install jq

# On any 64-bit Linux platform:
curl -skL "https://github.com/stedolan/jq/releases/download/jq1.5/jq-linux64" -o /usr/bin/jq && chmod +x /usr/bin/jq

Obtaining an authorization token

In order to operate with API calls we need to:

  • Define an API endpoint. this is an URL, a PHP file which is designed to accept requests
  • Obtain an authorization token

If you tend to execute API calls from frontend server then most likelly.

url=http://127.0.0.1/api_jsonrpc.php
# or:
url=http://127.0.0.1/zabbix/api_jsonrpc.php

It’s required to set the URL variable to jump to the next step. Test if you have it configured:

echo $url

Any API call needs to be used via authorization token. To put one token in variable use the command:

auth=$(curl -s -X POST -H 'Content-Type: application/json-rpc' \
-d '
{"jsonrpc":"2.0","method":"user.login","params":
{"user":"api","password":"zabbix"},
"id":1,"auth":null}
' $url | \
jq -r .result
)

Note
Notice there is user ‘api’ with password ‘zabbix’. This is a dedicated user for API calls.

Check if you have a session key. It should be 32 character HEX string:

echo $auth

Though process

1) visit the documentation page and pick an API flavor for example alert.get:

{
"jsonrpc": "2.0",
"method": "alert.get",
"params": {
	"output": "extend",
	"actionids": "3"
},
"auth": "038e1d7b1735c6a5436ee9eae095879e",
"id": 1
}

2) Let’s use our favorite text editor and build in Find&Replace functionality to escape all double quotes:

{
\"jsonrpc\": \"2.0\",
\"method\": \"alert.get\",
\"params\": {
	\"output\": \"extend\",
	\"actionids\": \"3\"
},
\"auth\": \"038e1d7b1735c6a5436ee9eae095879e\",
\"id\": 1
}

NOTE
Don’t ever think to do this process manually by hand!

3) Replace session key 038e1d7b1735c6a5436ee9eae095879e with our variable $auth

{
\"jsonrpc\": \"2.0\",
\"method\": \"alert.get\",
\"params\": {
	\"output\": \"extend\",
	\"actionids\": \"3\"
},
\"auth\": \"$auth\",
\"id\": 1
}

4) Now let’s encapsulate the API command with curl:

curl -s -X POST \
-H 'Content-Type: application/json-rpc' \
-d " \

{
\"jsonrpc\": \"2.0\",
\"method\": \"alert.get\",
\"params\": {
	\"output\": \"extend\",
	\"actionids\": \"3\"
},
\"auth\": \"$auth\",
\"id\": 1
}

" $url

By executing the previous command, it should already print a JSON content in response.
To make the output more beautiful we can pipe it to jq .:

curl -s -X POST \
-H 'Content-Type: application/json-rpc' \
-d " \

{
\"jsonrpc\": \"2.0\",
\"method\": \"alert.get\",
\"params\": {
	\"output\": \"extend\",
	\"actionids\": \"3\"
},
\"auth\": \"$auth\",
\"id\": 1
}

" $url | jq .

Wrap everything together in one file

This is ready to use the snippet:

#!/bin/bash

# 1. set connection details
url=http://127.0.0.1/api_jsonrpc.php
user=api
password=zabbix

# 2. get authorization token
auth=$(curl -s -X POST \
-H 'Content-Type: application/json-rpc' \
-d " \
{
 \"jsonrpc\": \"2.0\",
 \"method\": \"user.login\",
 \"params\": {
  \"user\": \"$user\",
  \"password\": \"$password\"
 },
 \"id\": 1,
 \"auth\": null
}
" $url | \
jq -r '.result'
)

# 3. show triggers in problem state
curl -s -X POST \
-H 'Content-Type: application/json-rpc' \
-d " \
{
 \"jsonrpc\": \"2.0\",
    \"method\": \"trigger.get\",
    \"params\": {
        \"output\": \"extend\",
        \"selectHosts\": \"extend\",
        \"filter\": {
            \"value\": 1
        },
        \"sortfield\": \"priority\",
        \"sortorder\": \"DESC\"
    },
    \"auth\": \"$auth\",
    \"id\": 1
}
" $url | \
jq -r '.result'

# 4. logout user
curl -s -X POST \
-H 'Content-Type: application/json-rpc' \
-d " \
{
    \"jsonrpc\": \"2.0\",
    \"method\": \"user.logout\",
    \"params\": [],
    \"id\": 1,
    \"auth\": \"$auth\"
}
" $url

Conveniences

We can use https://jsonpathfinder.com/ to identify what should be the path to extract an element.

For example, to list all Zabbix proxies we will use and API call:

curl -s -X POST \
-H 'Content-Type: application/json-rpc' \
-d " \
{
    \"jsonrpc\": \"2.0\",
    \"method\": \"proxy.get\",
    \"params\": {
        \"output\": [\"host\"]
    },
    \"auth\": \"$auth\",
    \"id\": 1
} 
" $url

It may print content like:

{"jsonrpc":"2.0","result":[{"host":"broceni","proxyid":"10387"},{"host":"mysql8mon","proxyid":"12066"},{"host":"riga","proxyid":"12585"}],"id":1}

Inside JSONPathFinder by using a mouse click at the right panel, we can locate a sample element what we need to extract:

It suggests a path ‘x.result[1].host’. This means to extract all elements we can remove the number and use ‘.result[].host’ like this:

curl -s -X POST \
-H 'Content-Type: application/json-rpc' \
-d " \
{
    \"jsonrpc\": \"2.0\",
    \"method\": \"proxy.get\",
    \"params\": {
        \"output\": [\"host\"]
    },
    \"auth\": \"$auth\",
    \"id\": 1
} 
" $url | jq -r '.result[].host'

Now it prints only the proxy titles:

broceni
mysql8mon
riga

That is it for today. Bye.

Zabbix API calls through Postman

Post Syndicated from Aigars Kadiķis original https://blog.zabbix.com/zabbix-api-calls-through-postman/12198/

Zabbix API calls can be used through the graphical user interface (GUI), no need to jump to scripting. An application to perform API calls is called Postman.

Benefits:

  • Available on Windows, Linux, or MAC
  • Save/synchronize your collection with Google account
  • Can copy and paste examples from the official documentation page

Let’s go to basic steps on how to perform API calls:

1st step – Grab API method user.login and use a dedicated username and password to obtain and session token:

{
    "jsonrpc": "2.0",
    "method": "user.login",
    "params": {
        "user": "api",
        "password": "zabbix"
    },
    "id": 1
}

This is how it looks in Postman:

NOTE
We recommend using a dedicated user for API calls. For example, a user called “api”. Make sure the user type has been chosen as “Zabbix Super Admin” so through this user we can access any type of information.

2nd step – Use API method trigger.get to list all triggers in the problem state:

{
    "jsonrpc": "2.0",
    "method": "trigger.get",
    "params": {
        "output": [
            "triggerid",
            "description",
            "priority"
        ],
        "filter": {
            "value": 1
        },
        "sortfield": "priority",
        "sortorder": "DESC"
    },
    "auth": "<session key>",
    "id": 1
}

Replace “<session key>” inside the API snippet to make it work. Then click “Send” button. It will list all triggers in the problem state on the right side:

Postman conveniences – Environments

Environments are “a must” if you:

  • Have a separate test, development, and production Zabbix instance
  • Plan to migrate Zabbix to next version (4.0 to 5.0) so it’s better to test all API calls beforehand

On the top right corner, there is a button Manage Environments. Let’s click it.

Now Create an environment:

Each environment must consist of url and auth key:

Now we have one definition prod. Can close window with [X]:

In order to work with your new environment, select a newly created profile prod. It’s required to substitute Zabbix API endpoint with {{url}} and plot {{auth}} to serve as a dynamic authorization key:

NOTE
Every time we notice an API procedure does not work anymore, all we need to do is to enter Manage environments section and install a new session tokken..

Topic in video format:
https://youtu.be/B14tsDUasG8?t=2513