Post Syndicated from Sébastien Stormacq original https://aws.amazon.com/blogs/aws/cloudwatch-internet-monitor-end-to-end-visibility-into-internet-performance-for-your-applications/
How many times have you had monitoring dashboards show you a normal situation, and at the same time, you have received customer tickets reporting your app is “slow” or unavailable to them? How much time did it take to diagnose these customer reports?
You told us one of your challenges when monitoring internet-facing applications is to gather data outside of AWS to build a realistic picture of how your application behaves for your customers connected to multiple and geographically distant internet providers. Capturing and monitoring data about internet traffic before it reaches your infrastructure is either difficult or very expensive.
I am happy to announce the public preview of Amazon CloudWatch Internet Monitor, a new capability of CloudWatch that gives visibility into how an internet issue might impact the performance and availability of your applications. It allows you to reduce the time it takes to diagnose internet issues from days to minutes.
Internet Monitor uses the connectivity data that we capture from our global networking footprint to calculate a baseline of performance and availability for internet traffic. This is the same data that we use at AWS to monitor our own internet uptime and availability. With Internet Monitor, you can gain awareness of problems that arise on the internet experienced by your end users in different geographic locations and networks.
There is no need to instrument your application code. You can enable the service in the CloudWatch section of the AWS Management Console and start to use it immediately.
Let’s See It in Action
Getting started with Internet Monitor is easy. Let’s imagine I want to monitor the network paths between my customers and my AWS resources. I open the AWS Management Console and navigate to CloudWatch. I select Internet Monitor on the left-side navigation menu. Then, I select Create monitor.
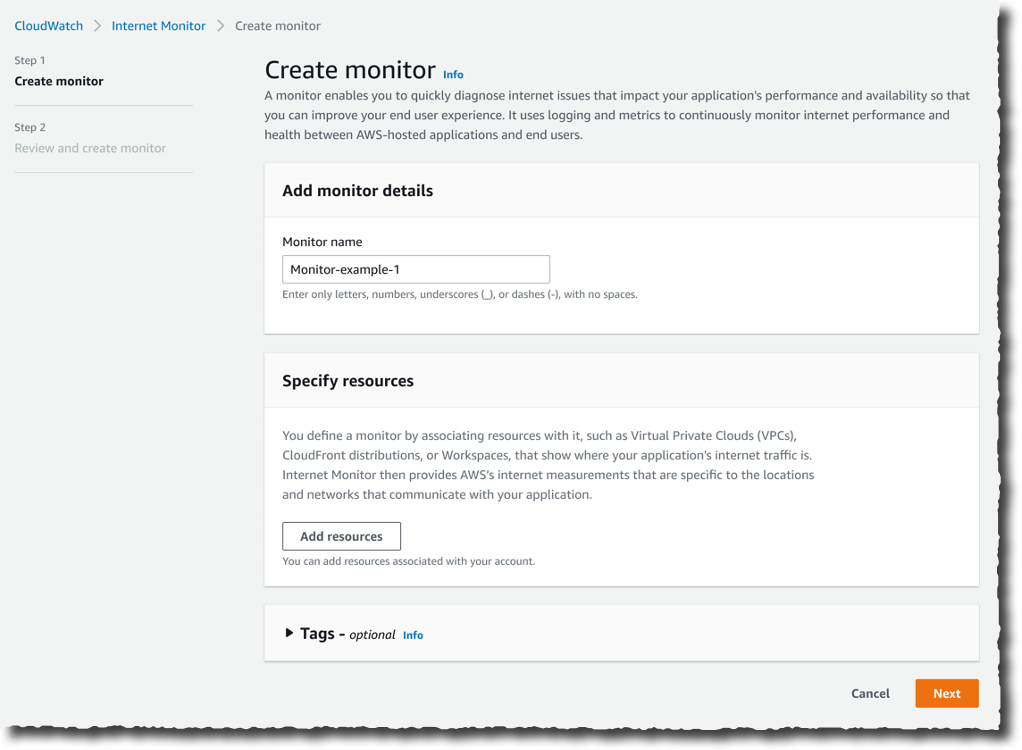
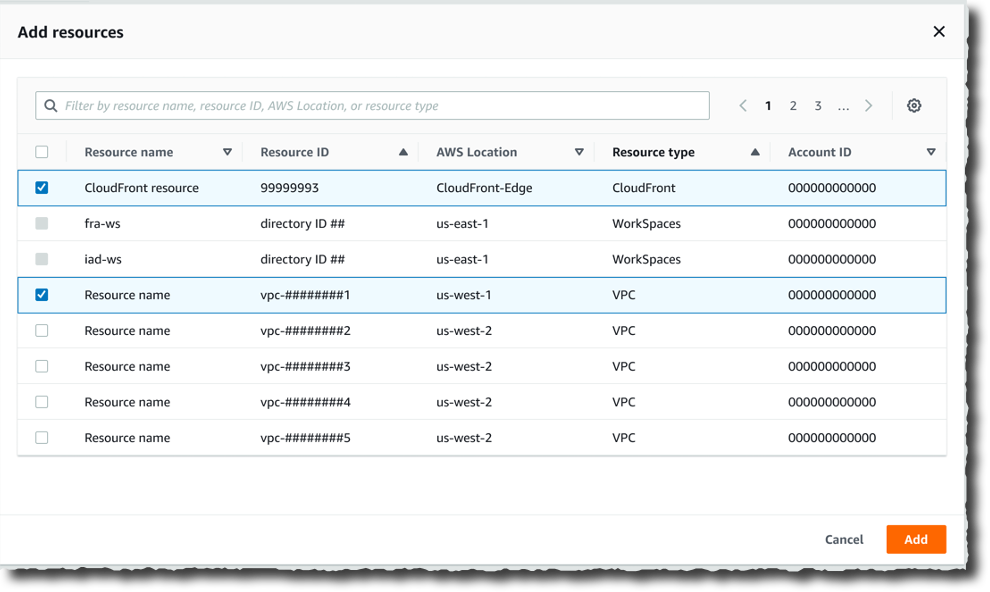
On the Create monitor page, I enter a Monitor name, and I select Add resources to choose the resources to monitor. For this demo, I select the VPC and the CloudFront distribution hosting my customer-facing application.
I have the opportunity to review my choices. Then, I select Create monitor.
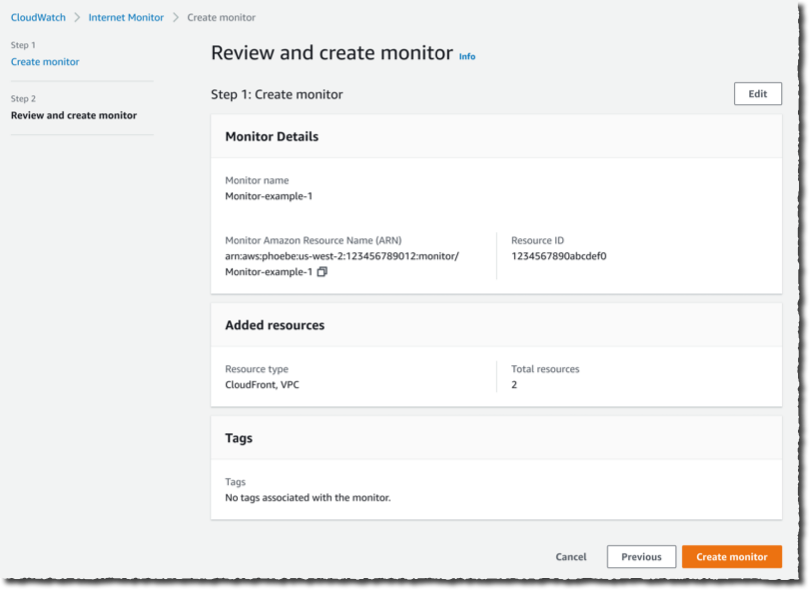
From that moment on, Internet Monitor starts to collect data based on my application’s resource logs behind the scene. There is no need for you to activate (or pay for) VPC Flow Logs, CloudFront logs, or other log types.
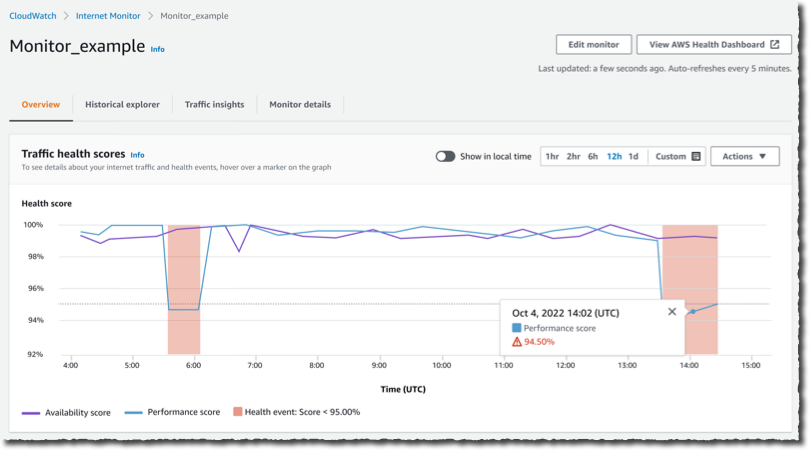
After a while, I receive customer complaints about our application being slow. I open Internet Monitor again, I select the monitor I created earlier (Monitor_example), and I immediately see that the application suffers from internet performance issues.
The Health scores graph shows you performance and availability information for your global traffic. AWS has substantial historical data about internet performance and availability for network traffic between geographic locations for different network providers and services. By applying statistical analysis to the data, we can detect when the performance and availability towards your application have dropped, compared to an estimated baseline that we’ve calculated. To make it easier to see those drops, we report that information to you in the form of an estimated performance score and an availability score.
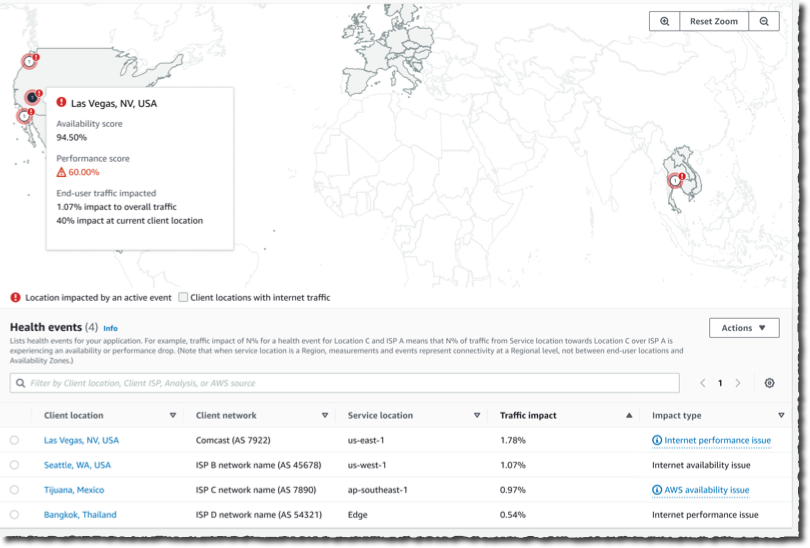
I scroll a bit down the page. The Internet traffic overview map shows the overall event status across all monitored locations. I look at the details in the Health events table. It also highlights other events that are happening globally, sorted by total traffic impact. I notice that a performance issue in Las Vegas, Nevada, US, is affecting my application traffic the most.
 Now that I have identified the issue, I am curious about the historical data. Has it happened before?
I select the Historical Explorer tab to understand trends and see earlier data related to this location and network provider. I can view aggregated metrics such as performance score, availability score, bytes transferred, and round-trip time at p50, p90, and p95 percentiles, for a customized timeframe, up to 18 months in the past.
 I can see today’s incident is not the first one. This specific client location and network provider has had multiple issues in the past few months.
 Now that I understand the context, I wonder what action I can take to mitigate the issue.
I switch to the Traffic insights tab. I see overall traffic data and top client locations that are being monitored based on total traffic (bytes). Apparently, Las Vegas, Nevada, US, is one of the top client locations.

I select the graph to see traffic details for Las Vegas, Nevada, US. In the Lowest Time To First Byte (TTFB) column, I see AWS service and AWS Region setup recommendations for all of the top client location and network combinations. The Predicted Time To First Byte in the table shows the potential impact if I make the suggested architectural change.
In this example, Internet Monitor suggests having CloudFront distribute the traffic currently distributed by EC2 and to allow for some additional traffic to be served by EC2 instances in us-east-1 in addition to us-east-2.

Available Today
Internet Monitor is available in public preview today in 20 AWS Regions:
- In the Americas: US East (Ohio), US East (N. Virginia), US West (N. California), US West (Oregon), Canada (Central), South America (São Paulo).
- In Asia and Pacific: Asia Pacific (Hong Kong), Asia Pacific (Mumbai), Asia Pacific (Seoul), Asia Pacific (Singapore), Asia Pacific (Sydney), Asia Pacific (Tokyo).
- In Europe, Middle East, and Africa: Africa (Cape Town), Europe (Frankfurt), Europe (Ireland), Europe (London), Europe (Milan), Europe (Paris), Europe (Stockholm), Middle East (Bahrain)
Note that AWS CloudFormation support is missing at the moment; it will be added soon.
There is no costs associated with the service during the preview period. Just keep in mind that Internet Monitor vends metrics and logs to CloudWatch; you will be charged for these additional CloudWatch logs and CloudWatch metrics.
Whether you work for a startup or a large enterprise, CloudWatch Internet Monitor helps you be proactive about your application performance and availability. Give it a try today!