Post Syndicated from original https://www.backblaze.com/blog/ssd-edition-2022-drive-stats-review/
Welcome to the 2022 SSD Edition of the Backblaze Drive Stats series. The SSD Edition focuses on the solid state drives (SSDs) we use as boot drives for the data storage servers in our cloud storage platform. This is opposed to our traditional Drive Stats reports which focus on our hard disk drives (HDDs) used to store customer data.
We started using SSDs as boot drives beginning in Q4 of 2018. Since that time, all new storage servers and any with failed HDD boot drives have had SSDs installed. Boot drives in our environment do much more than boot the storage servers. Each day they also read, write, and delete log files and temporary files produced by the storage server itself. The workload is similar across all the SSDs included in this report.
In this report, we look at the failure rates of the SSDs that we use in our storage servers for 2022, for the last 3 years, and for the lifetime of the SSDs. In addition, we take our first look at the temperature of our SSDs for 2022, and we compare SSD and HDD temperatures to see if SSDs really do run cooler.
Overview
As of December 31, 2022, there were 2,906 SSDs being used as boot drives in our storage servers. There were 13 different models in use, most of which are considered consumer grade SSDs, and we’ll touch on why we use consumer grade SSDs a little later. In this report, we’ll show the Annualized Failure Rate (AFR) for these drive models over various periods of time, making observations and providing caveats to help interpret the data presented.
The dataset on which this report is based is available for download on our Drive Stats Test Data webpage. The SSD data is combined with the HDD data in the same files. Unfortunately, the data itself does not distinguish between SSD and HDD drive types, so you have to use the model field to make that distinction. If you are just looking for SSD data, start with Q4 2018 and go forward.
2022 Annual SSD Failure Rates
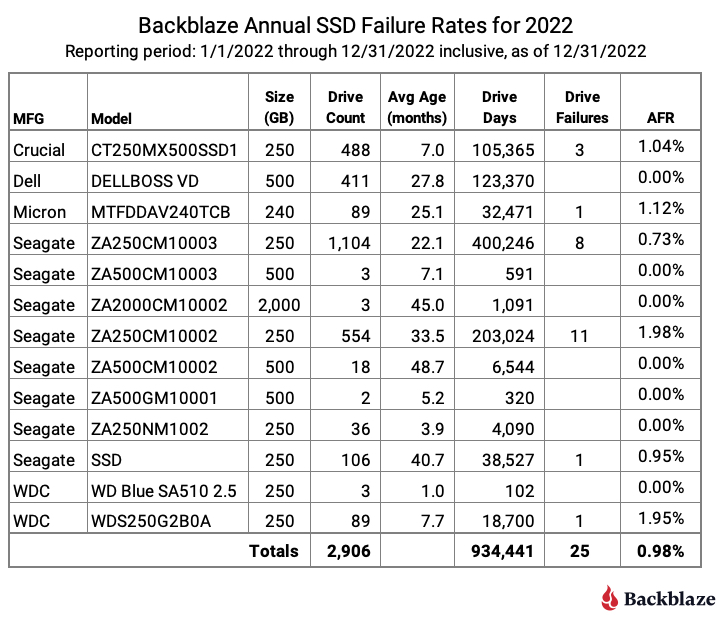
As noted, at the end of 2022, there were 2,906 SSDs in operation in our storage servers. The table below shows data for 2022. Later on we’ll compare the 2022 data to previous years.
Observations and Caveats
- For 2022, seven of the 13 drive models had no failures. Six of the seven models had a limited number of drive days—less than 10,000—meaning that there is not enough data to make a reliable projection about the failure rates of those drive models.
- The Dell SSD (model: DELLBOSS VD) has zero failures for 2022 and has over 100,000 drive days for the year. The resulting AFR is excellent, but this is an M.2 SSD mounted on a PCIe card (half-length and half-height form factor) meant for server deployments, and as such it may not be generally available. By the way, BOSS stands for Boot Optimized Storage Solution.
- Besides the Dell SSD, three other drive models have over 100,000 drive days for the year, so there is sufficient data to consider their failure rates. Of the three, the Seagate (model: ZA250CM10003, aka: Seagate BarraCuda 120 SSD ZA250CM10003) has the lowest AFR at 0.73%, with the Crucial (model: CT250MX500SSD1) coming in next with an AFR of 1.04% and finally, the Seagate (model: ZA250CM10002, aka: Seagate BarraCuda SSD ZA250CM10002) delivers an AFR of 1.98% for 2022.
Annual SSD Failure Rates for 2020, 2021, and 2022
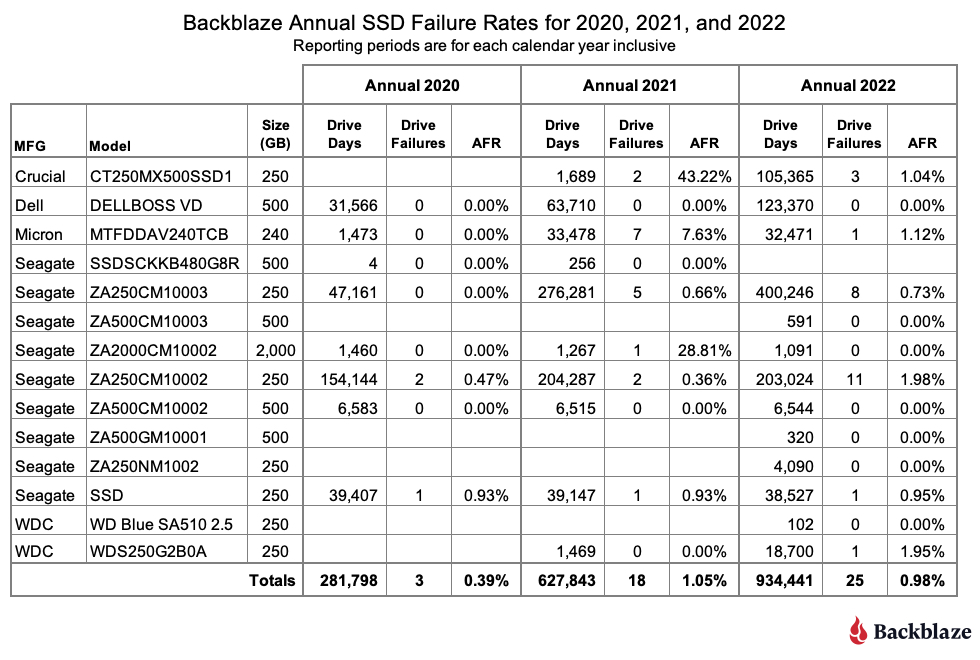
The 2022 annual chart above presents data for events that occurred in just 2022. Below we compare the 2022 annual data to the 2020 and 2021 (respectively) annual data where the data for each year represents just the events which occurred during that period.
Observations and Caveats
- As expected, the Crucial drives (model: CT250MX500SSD1) recovered nicely in 2022 after having a couple of early failures in 2021. We expect that trend to continue.
- Four new models were introduced in 2022, although none have a sufficient number of drive days to discern any patterns even though none of the four models have experienced a failure as of the end of 2022.
- Two of the 250GB Seagate drives have been around all three years, but they are going in different directions. The Seagate drive (model: ZA250CM10003) has delivered a sub-1% AFR over all three years. While the AFR for the Seagate drive (model: ZA250CM10002) slipped in 2022 to nearly 2%. Model ZA250CM10003 is the newer model of the two by about a year. There is little difference otherwise except the ZA250CM10003 uses less idle power, 116mW versus 185mW for the ZA250CM10002. It will be interesting to see how the younger model fares over the next year. Will it follow the trend of its older sibling and start failing more often, or will it chart its own course?
SSD Temperature and AFR: A First Look
Before we jump into the lifetime SSD failure rates, let’s talk about SSD SMART stats. Here at Backblaze, we’ve been wrestling with SSD SMART stats for several months now, and one thing we have found is there is not much consistency on the attributes, or even the naming, SSD manufacturers use to record their various SMART data. For example, terms like wear leveling, endurance, lifetime used, life used, LBAs written, LBAs read, and so on are used inconsistently between manufacturers, often using different SMART attributes, and sometimes they are not recorded at all.
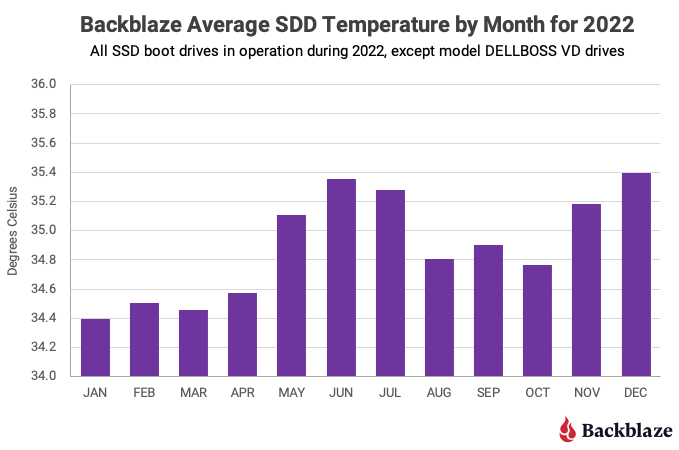
One SMART attribute that does appear to be consistent (almost) is drive temperature. SMART 194 (raw value) records the internal temperature of the SSD in degrees Celsius. We say almost, because the Dell SSD (model: DELLBOSS VD) does not report raw or normalized values for SMART 194. The chart below shows the monthly average temperature for the remaining SSDs in service during 2022.
Observations and Caveats
- There were an average of 67,724 observations per month, ranging from 57,015 in February to 77,174 in December. For 2022, the average temperature varied only one degree Celsius from the low of 34.4 degrees Celsius to the high of 35.4 degrees Celsius over the period.
- For 2022, the average temperature was 34.9 degrees Celsius. The average temperature of the hard drives in the same storage servers over the same period was 29.1 degrees Celsius. This difference seems to fly in the face of conventional wisdom that says SSDs run cooler than HDDs. One possible reason is that, in all of our storage servers, the boot drives are further away from the cool aisle than the data drives. That is, the data drives get the cool air first. If you have any thoughts, let us know in the comments.
- The temperature variation across all drives for 2022 ranged from 20 degrees Celsius (four observations) to 61 degrees Celsius (one observation). The chart below shows the observations for the SSD’s across that temperature range.
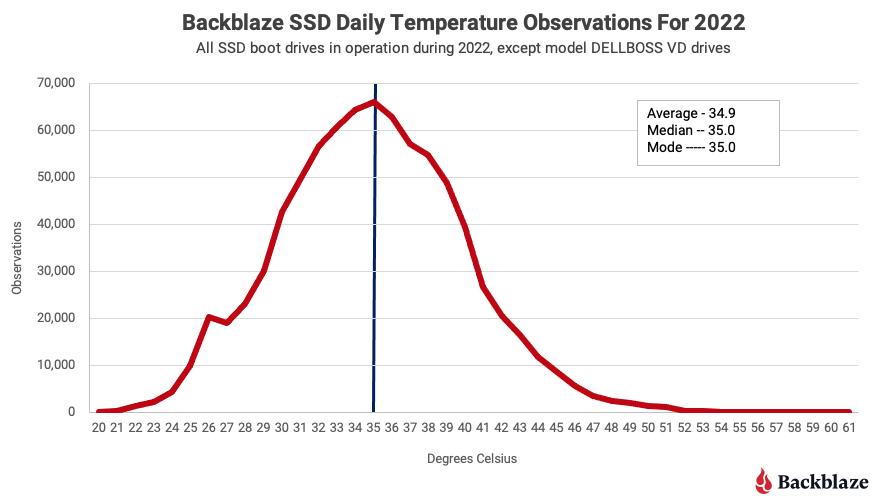
The shape of the curve should look familiar: it’s a bell curve. We’ve seen the same type of curve when plotting the temperature observations of the storage server hard drives. The SSD curve is for all operational SSD drives, except the Dell SSDs. We attempted to plot the same curve for the failed SSDs, but with only 25 failures in 2022, the curve was nonsense.
Lifetime SSD Failure Rates
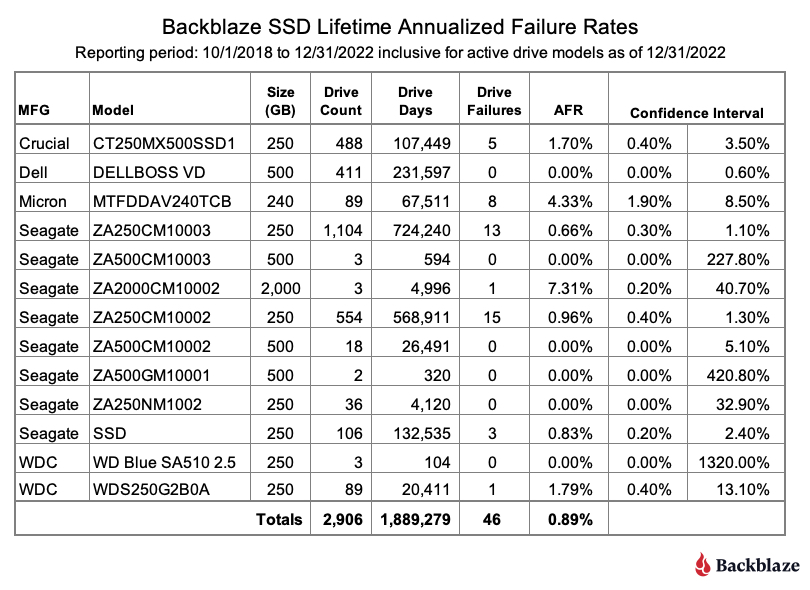
The lifetime failure rates are based on data from the entire time the given drive model has been in service in our system. This data goes back as far as Q4 2018, although most of the drives were put in service in the last three years. The table below shows the lifetime AFR for all of the SSD drive models in service as of the end of 2022.
Observations and Caveats
- The overall Lifetime AFR was 0.89% as of the end of 2022. This is lower than the Lifetime AFR 1.04% as of the end of 2021.
- There are several very large confidence intervals. That is due to the limited amount of data (drive days) for those drive models. For example, there are only 104 drive days for the WDC model WD Blue SA510 2.5. As we accumulate more data, those confidence intervals should become more accurate.
- We like to see a confidence interval of 1.0% or less for a given drive model. Only three drive models met this criteria:
- Dell model DELLBOSS VD: lifetime AFR–0.00%
- Seagate model ZA250CM10003: lifetime AFR–0.66%
- Seagate model ZA250CM10002: lifetime AFR–0.96%
- The Dell SSD, as noted earlier in this report, is an M.2 SSD mounted on a PCIe card and may not be generally available. The two Seagate drives are consumer level SSDs. In our case, a less expensive consumer level SSD works for our needs as there is no customer data on a boot drive, just boot files as well as log and temporary files. More recently as we have purchased storage servers from Supermicro and Dell, they bundle all of the components together into a unit price per storage server. If that bundle includes enterprise class SSDs or an M.2 SSD on a PCIe card, that’s fine with us.
The SSD Stats Data
We acknowledge that 2,906 SSDs is a relatively small number of drives on which to perform our analysis, and while this number does lead to wider than desired confidence intervals, it’s a start. Of course we will continue to add SSD boot drives to the study group, which will improve the fidelity of the data presented. In the meantime, we expect our readers will apply their usual skeptical lens to the data presented and use it accordingly.
The complete dataset used to create the information used in this review is available on our Hard Drive Test Data page. As noted earlier you’ll find SSD and HDD data in the same files, and you’ll have to use the model number to distinguish one record from another. You can download and use this data for free for your own purpose. All we ask are three things: 1) you cite Backblaze as the source if you use the data, 2) you accept that you are solely responsible for how you use the data, and 3) you do not sell this data to anyone; it is free.
Good luck, and let us know if you find anything interesting.
The post The SSD Edition: 2022 Drive Stats Review appeared first on Backblaze Blog | Cloud Storage & Cloud Backup.