All posts by Akhil B

Build enterprise-scale log ingestion pipelines with Amazon OpenSearch Service

Post Syndicated from Akhil B original https://aws.amazon.com/blogs/big-data/build-enterprise-scale-log-ingestion-pipelines-with-amazon-opensearch-service/

Organizations of all sizes generate massive volumes of logs across their applications, infrastructure, and security systems to gain operational insights, troubleshoot issues, and maintain regulatory compliance. However, implementing log analytic solutions presents significant challenges, including complex data ingestion pipelines and the need to balance cost and performance while scaling to handle petabytes of data.

Amazon OpenSearch Service addresses these challenges by providing high-performance search and analytics capabilities, making it straightforward to deploy and manage OpenSearch clusters in the AWS Cloud without the infrastructure management overhead. A well-designed log analytics solution can help support proactive management in a variety of use cases, including debugging production issues, monitoring application performance, or meeting compliance requirements.

In this post, we share field-tested patterns for log ingestion that have helped organizations successfully implement logging at scale, while maintaining optimal performance and managing costs effectively.

Solution overview

Organizations can choose from several data ingestion architectures, such as:

Irrespective of the chosen pattern, a scalable log ingestion architecture should comprise the following logical layers:

  • Collect layer – This is the initial stage where logs are gathered from various sources, including application logs, system logs, and more.
  • Buffer layer – This layer acts as a temporary storage layer to handle spikes in log volume and prevents data loss during downstream processing issues. This layer also maintains system stability during high load.
  • Process layer – This layer transforms the unstructured logs into structured formats while adding relevant metadata and contextual information needed for effective analysis.
  • Store layer – This layer is the final destination for processed logs (OpenSearch in this case), which supports various access patterns, including querying, historical analysis, and data visualization.

OpenSearch Ingestion offers a purpose-built, fully managed experience that simplifies the data ingestion process. In this post, we focus on using OpenSearch Ingestion to load logs from Amazon Simple Storage Service (Amazon S3) into an OpenSearch Service domain, a common and efficient pattern for log analytics.

OpenSearch Ingestion is a fully managed, serverless data ingestion service that streamlines the process of loading data into OpenSearch Service domains or Amazon OpenSearch Serverless collections. It’s powered by Data Prepper, an open source data collector that filters, enriches, transforms, normalizes, and aggregates data for downstream analysis and visualization.

OpenSearch Ingestion uses pipelines as a mechanism that consists of the following major components:

  • Source – The input component of a pipeline. It defines the mechanism through which a pipeline consumes records.
  • Buffer – A persistent, disk-based buffer that stores data across multiple Availability Zones to enhance durability. OpenSearch Ingestion dynamically allocates OCUs for buffering, which increases pricing as you may need additional OCUs to maintain ingestion throughput.
  • Processors – The intermediate processing units that can filter, transform, and enrich records into a desired format before publishing them to the sink. The processor is an optional component of a pipeline.
  • Sink – The output component of a pipeline. It defines one or more destinations to which a pipeline publishes records. A sink can also be another pipeline, so you can chain multiple pipelines together.

Because of its serverless nature, OpenSearch Ingestion automatically scales to accommodate varying workload demands, alleviating the need for manual infrastructure management while providing built-in monitoring capabilities. Users can focus on their data processing logic rather than spending time on operational complexities, making it an efficient solution for managing data pipelines in OpenSearch environments.

The following diagram illustrates the architecture of the log ingestion pipeline.

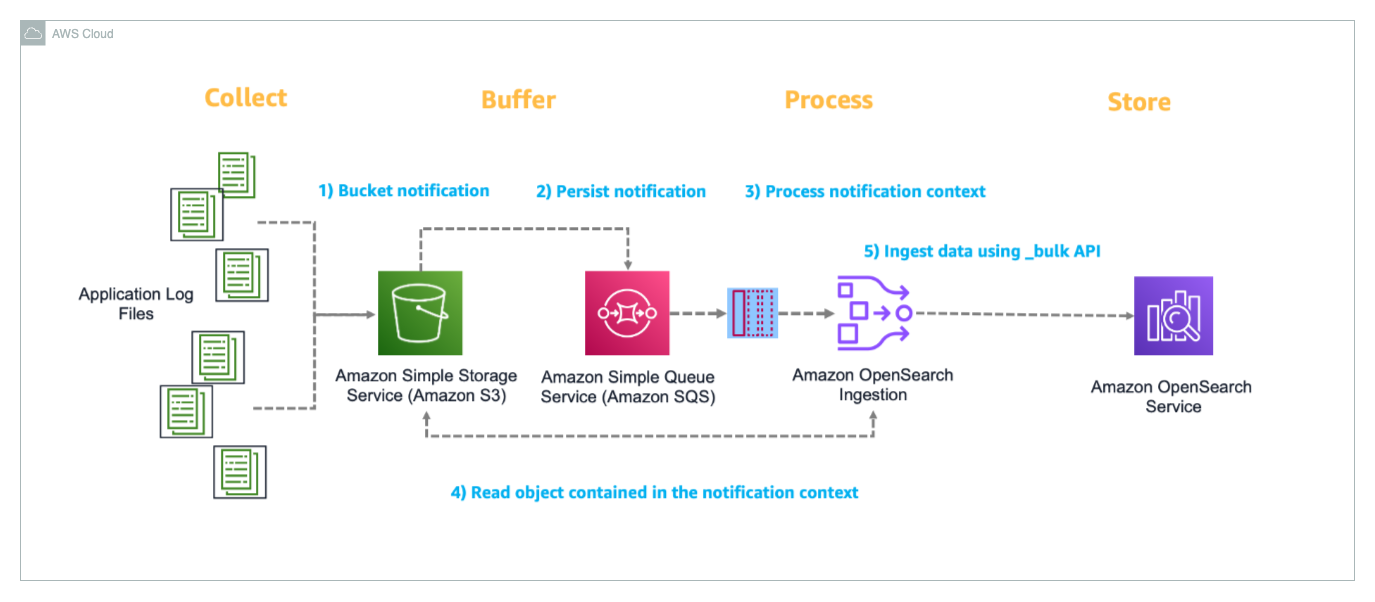
Let’s walk through how this solution processes Apache logs from ingestion to visualization:

  1. The source application generates Apache logs that need to be analyzed and stores them in an S3 bucket, which acts as the central storage location for incoming log data. When a new log file is uploaded to the S3 bucket (ObjectCreate event), Amazon S3 automatically triggers an event notification that is configured to send messages to a designated Amazon Simple Queue Service (Amazon SQS) queue.
  2. The SQS queue reliably manages and tracks the notifications of new files uploaded to Amazon S3, making sure the file event is delivered to the OpenSearch Ingestion pipeline. A dead-letter queue (DLQ) is configured to capture failed event processing.
  3. The OpenSearch Ingestion pipeline monitors the SQS queue, retrieving messages that contain information about newly uploaded log files. When a message is received, the pipeline reads the corresponding log file from Amazon S3 for processing.
  4. After the log file is retrieved, the OpenSearch Ingestion pipeline parses the content, and uses the OpenSearch Bulk API to efficiently ingest the processed log data into the OpenSearch Service domain, where it becomes available for search and analysis.
  5. The ingested data can be visualized and analyzed through OpenSearch Dashboards, which provides a user-friendly interface for creating custom visualizations, dashboards, and performing real-time analysis of the log data with features like search, filtering, and aggregations.

In the following sections, we guide you through the steps to ingest application log files from Amazon S3 into OpenSearch Service using OpenSearch Ingestion. Additionally, we demonstrate how to visualize the ingested data using OpenSearch Dashboards.

Prerequisites

This post assumes you have the following:

Deploy the solution

The solution uses a Python AWS Cloud Development Kit (AWS CDK) project to deploy an OpenSearch Service domain and associated components. This project demonstrates event-based data ingestion into the OpenSearch Service domain in a no code approach using OpenSearch Ingestion pipelines.

The deployment is automated using the AWS CDK and comprises the following steps:

  1. Clone the GitHub repo.
    git clone [email protected]:aws-samples/sample-log-ingestion-pipeline-for-amazon-opensearch-service.git

  2. Create a virtual environment and install the Python dependencies:
python3 -m venv .venv
source .venv/bin/activate
pip install -r requirements.txt
  1. Update the following environment variables in cdk.json:
    1. domain_name: The OpenSearch domain to be created in your AWS account.
    2. user_name: The user name for the internal primary user to be created within the OpenSearch domain.
    3. user_password: The password for the internal primary user.

This deployment creates a public-facing OpenSearch domain but is secured through fine-grained access control (FGAC). For production workloads, consider deploying within a virtual private cloud (VPC) with additional security measures. For more information, see Security in Amazon OpenSearch Service.

  1. Bootstrap the AWS CDK stack and initiate the deployment. Provide your AWS account number and the AWS Region where you want deploy the solution:
cdk bootstrap <Account ID>/<region>
cdk deploy --all

The process takes about 30–45 minutes to complete.

Verify the solution resources

When the previous steps are complete, you can check for the created resources.

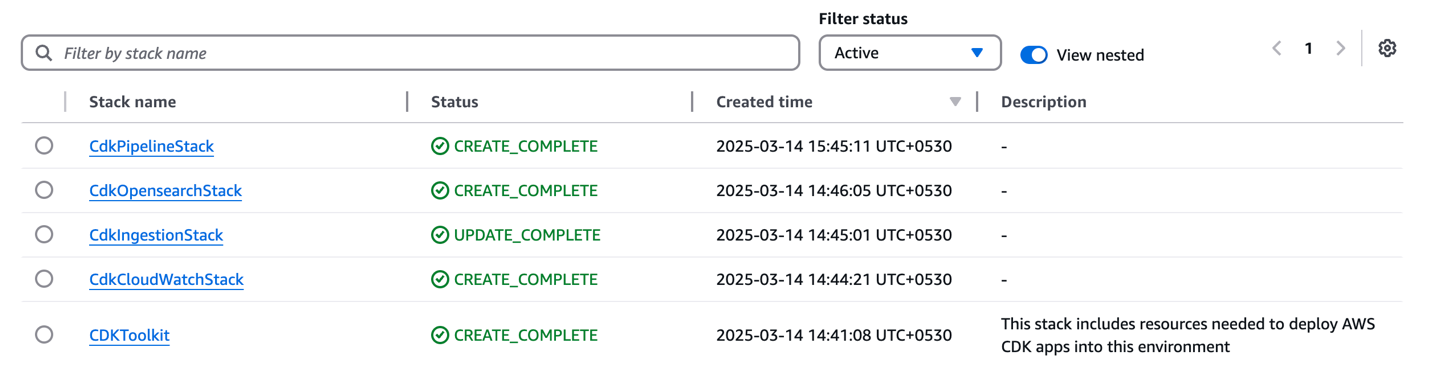
You can confirm the existence of the stacks on the AWS CloudFormation console. As shown in the following screenshot, the CloudFormation stacks have been created and deployed by cdk bootstrap and cdk deploy.

image-2

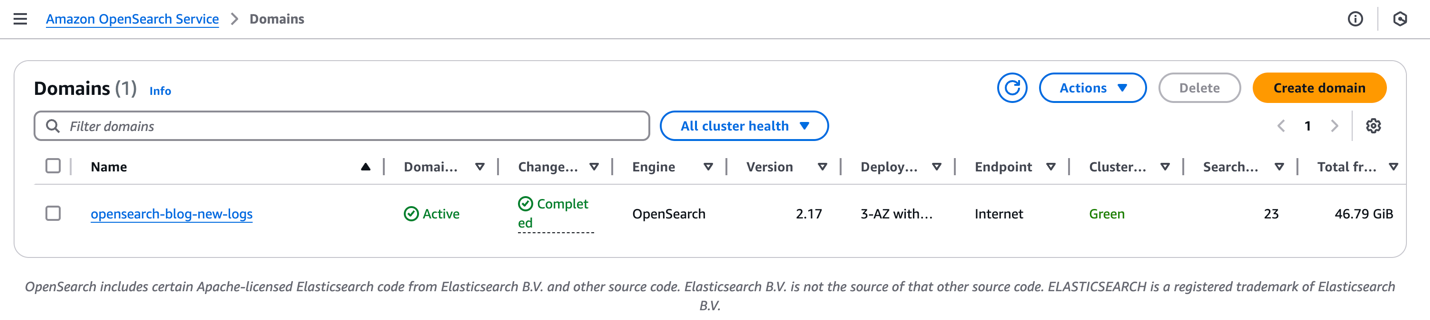
On the OpenSearch Service console, under Managed clusters in the navigation pane, choose Domains. You can confirm the domain created.

image-3

On the OpenSearch Service console, under Ingestion in the navigation pane, choose Pipelines. You can see the pipeline apache-log-pipeline created.

image-4

Configure security options

To configure your security roles, complete the following steps:

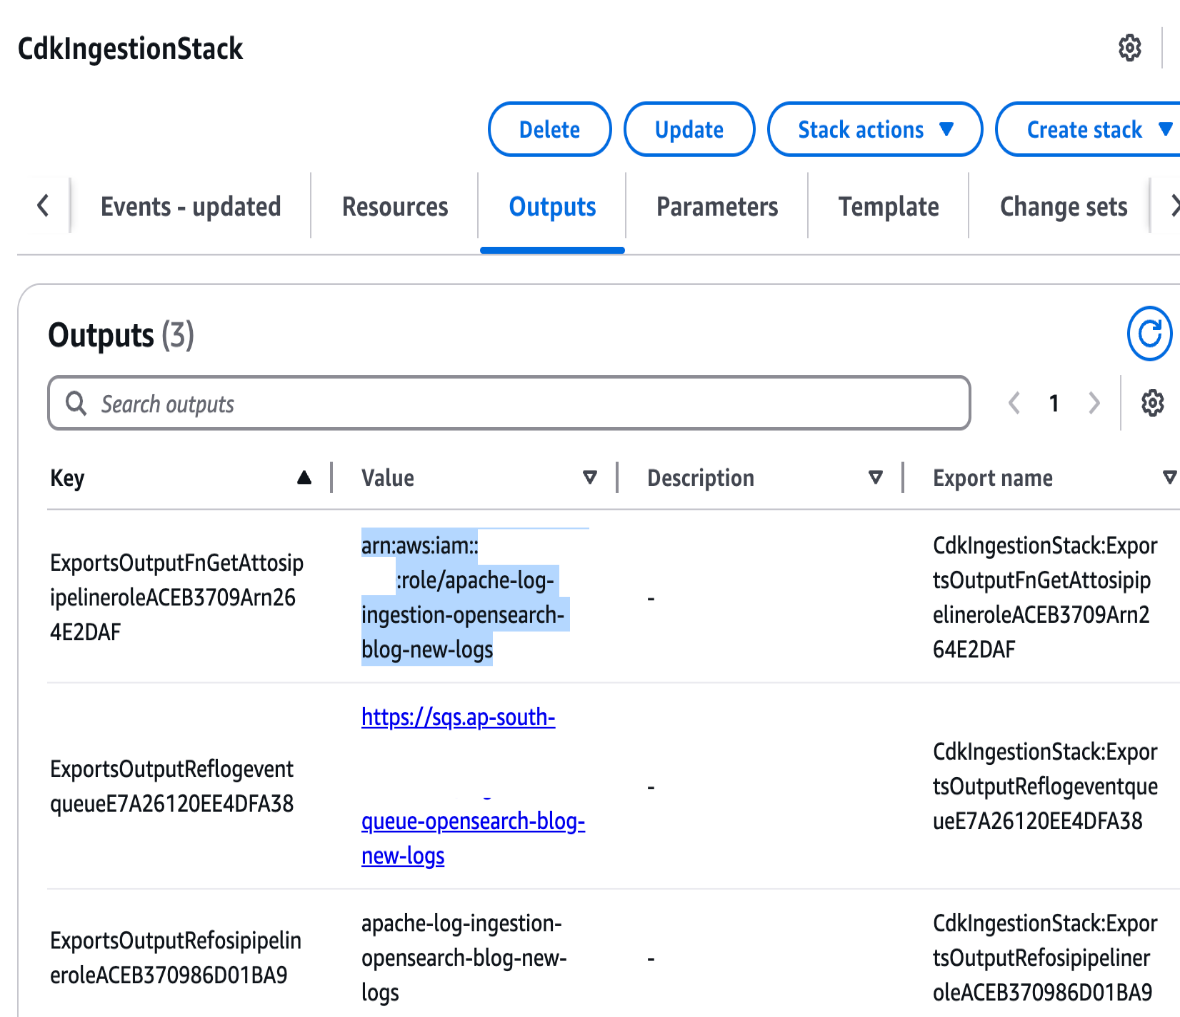
  1. On the AWS CloudFormation console, open the stack CdkIngestionStack, and on the Outputs tab, copy the Amazon Resource Name (ARN) of osi-pipeline-role.

image-5

  1. Open the OpenSearch Service console in the deployed Region within your AWS account and choose the domain you created.
  2. Choose the link for OpenSearch Dashboards URL.
  3. In the login prompt, enter the user credentials that were provided in cdk.json.

After a successful login, the OpenSearch Dashboards console will be displayed.

  1. If you’re prompted to select a tenant, select the Global tenant.
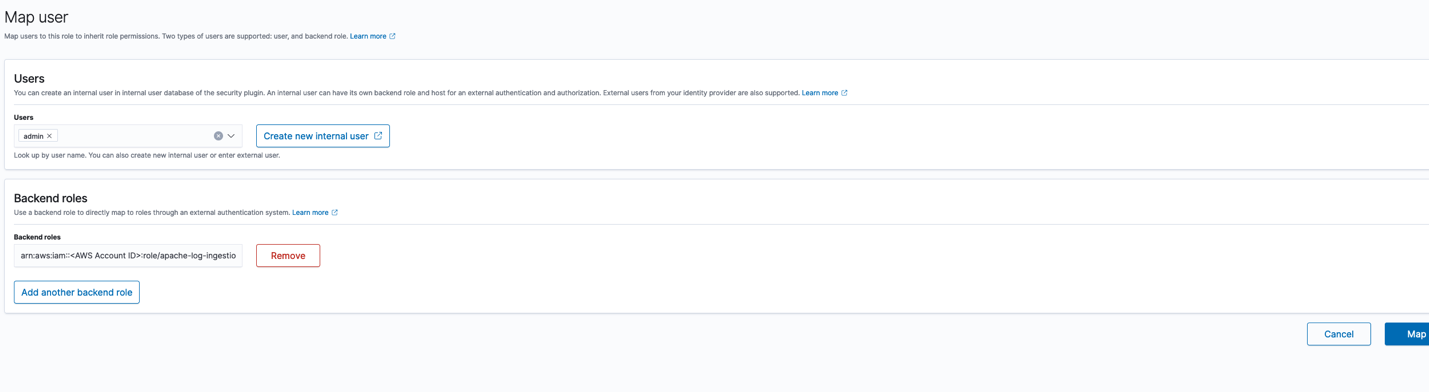
  2. In the Security options, navigate to the Roles section and choose the all_access role.
  3. On the all_access role page, navigate to mapped_users and choose Manage.
  4. Choose Add another backend role under Backend roles and enter the IAM role ARN you copied.
  5. Confirm by choosing Map.

image-6

Create an index template

The next step is to create an index template. Complete the following steps:

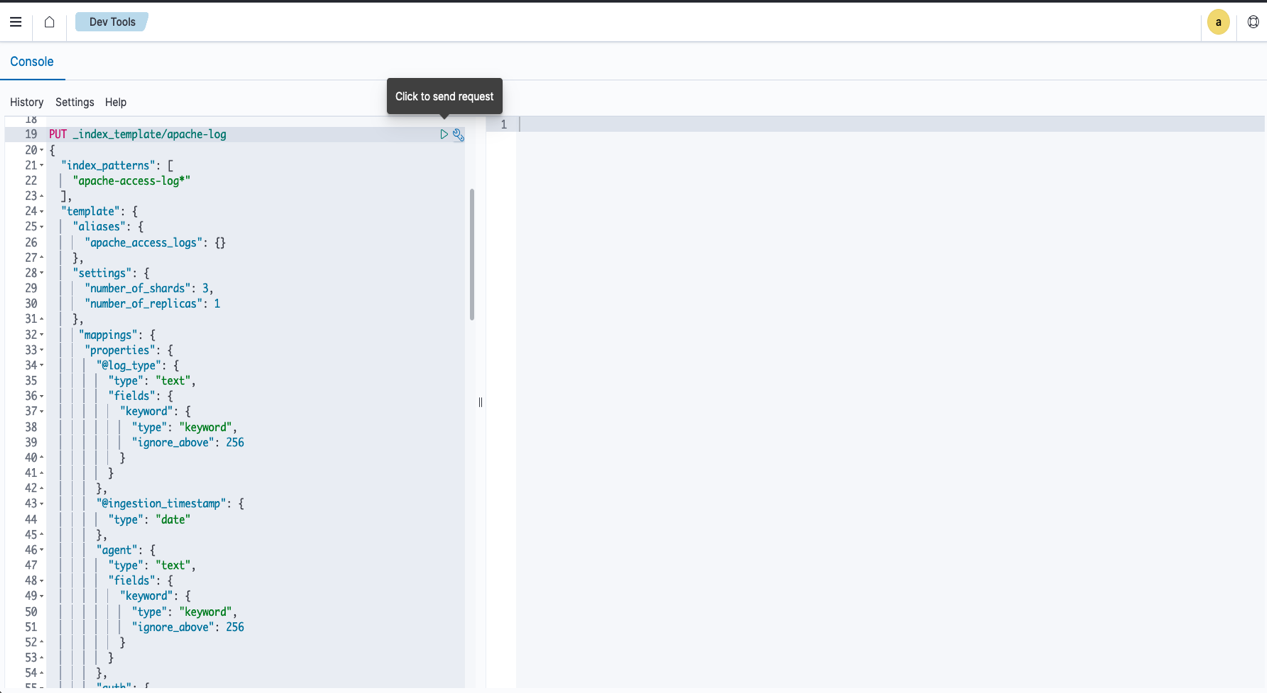
  1. On the Dev Tools console, copy the contents of the file index_template.txt within the opensearch_object directory.
  2. Enter the code in the Dev Tools console.

This index template defines the mapping and settings for our OpenSearch index.

  1. Choose the play icon to submit the request and create a template.

image-7

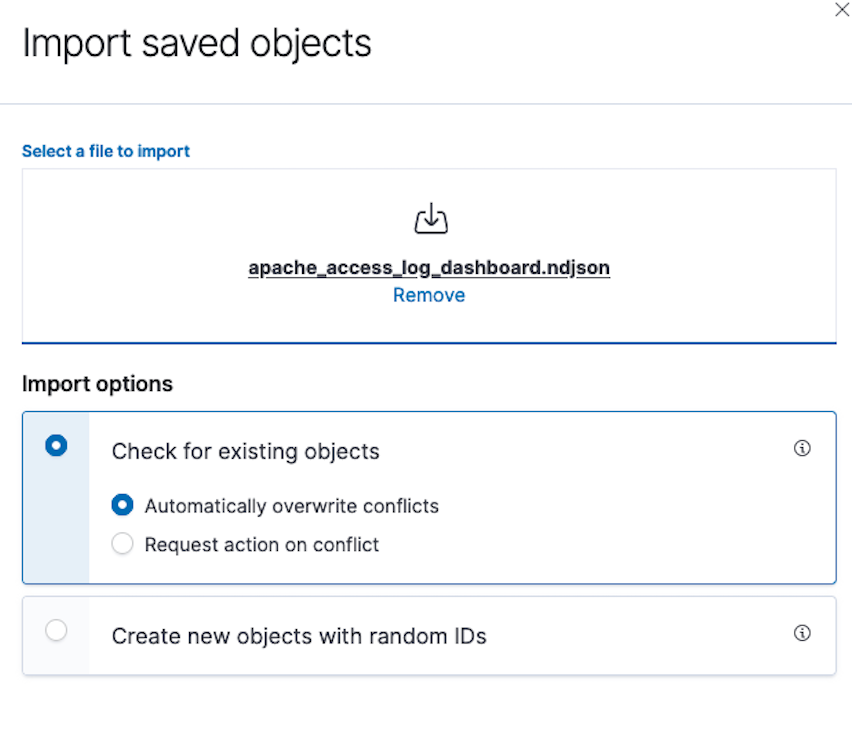
  1. In the Dashboard Management section, choose Saved Objects and choose Import.
  2. Choose Import and choose the apache_access_log_dashboard.ndjson file within the opensearch_object directory.
  3. Choose Check for existing objects.
  4. Choose Automatically overwrite conflicts and choose Import.

Ingest data

Now you can proceed with the data ingestion.

  1. On the Amazon S3 console, open the S3 bucket opensearch-logging-blog-<Account ID>.
  2. Upload the data file apache_access_log.gz (within the apache_log_data directory). The file can be uploaded in any prefix.

For this solution, we use Apache access logs as our example data source. Although this pipeline is configured for Apache log format, it can be modified to support other log types by adjusting the pipeline configuration. See Overview of Amazon OpenSearch Ingestion for details about configuring different log formats.

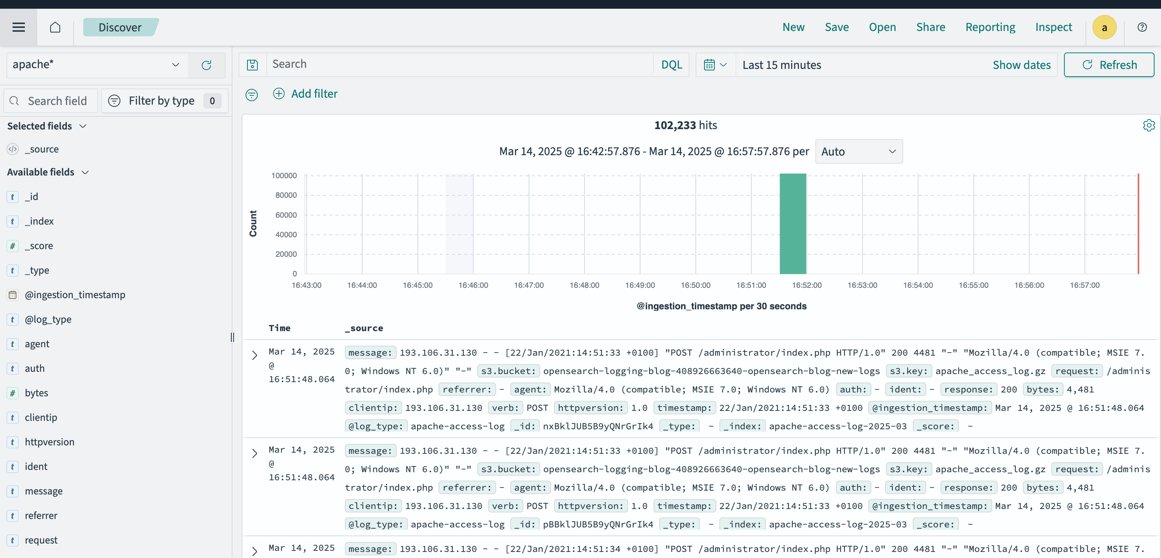
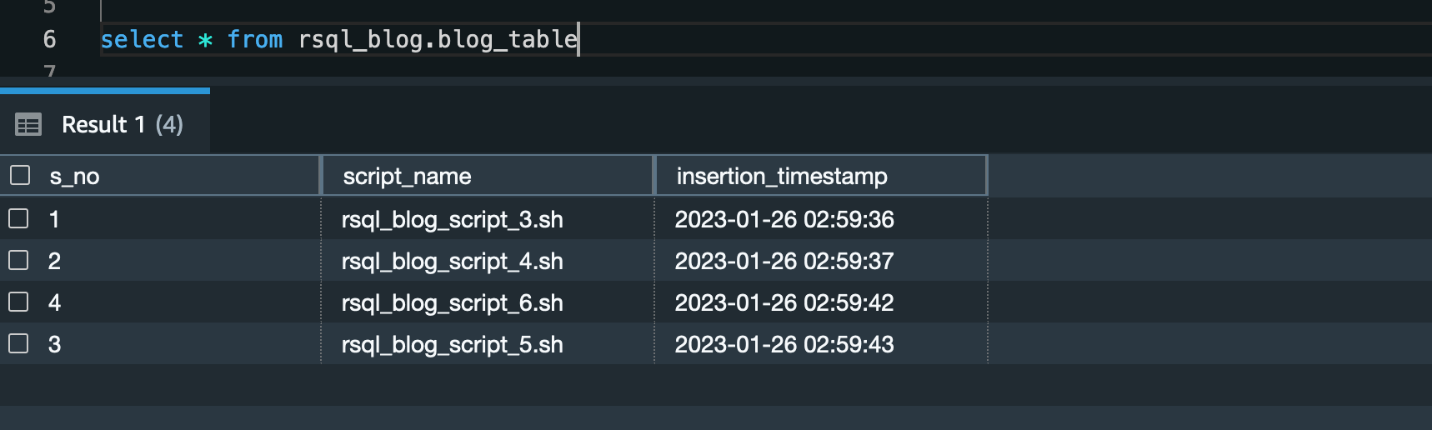
  1. After a few minutes, navigate to the Discover tab in OpenSearch Dashboards, where you can find that the data is ingested.
  2. Confirm that the apache* index pattern is selected.

image-8

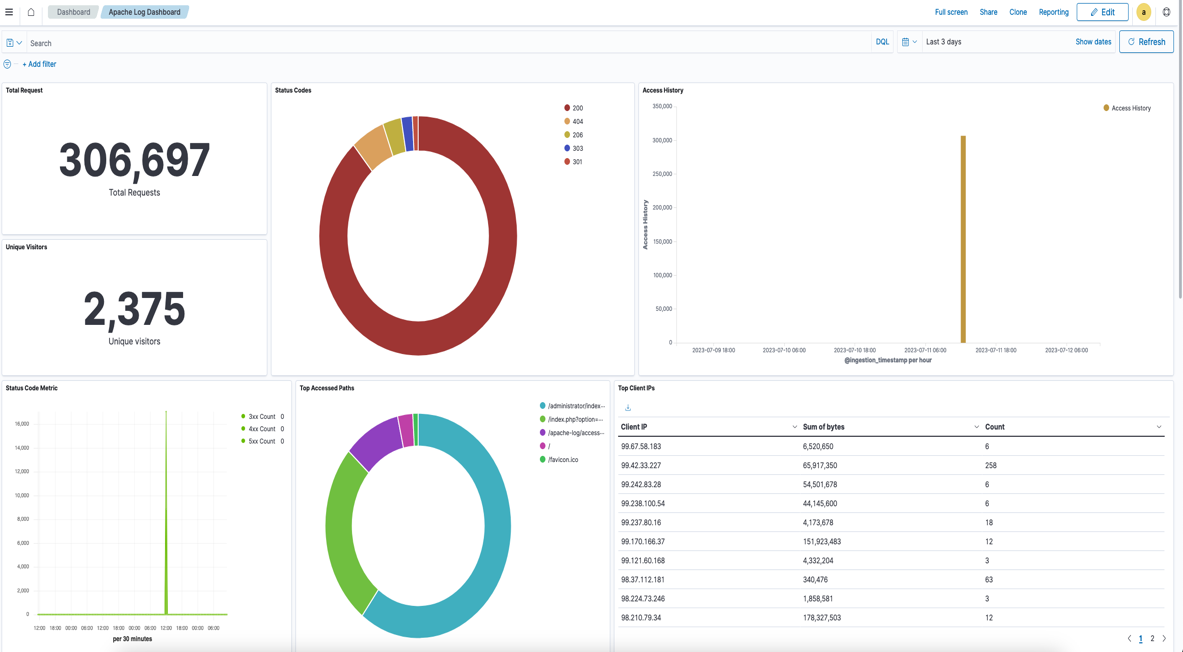
  1. 5. On the Dashboards tab, choose Apache Log Dashboard.

The dashboard will be populated by the data and visuals should be displayed.

image-10

Operational best practices

When designing your log analytics platform on OpenSearch Service, make sure you follow the recommended operational best practices for cluster configuration, data management, performance, monitoring, and cost optimization. For detailed guidance, refer to Operational best practices for Amazon OpenSearch Service.

Clean up

To avoid ongoing charges for the resources that you created, delete them by completing the following steps:

  1. On the Amazon S3 console, open the bucket opensearch-logging-blog-<Account ID> and choose Empty.
  2. Follow the prompts to delete the contents of the bucket.
  3. Delete the AWS CDK stacks using the following command:
cdk destroy --all --force

Conclusion

As organizations continue to generate increasing volumes of log data, having a well-architected logging solution becomes crucial for maintaining operational visibility and meeting compliance requirements.

Implementing a robust logging infrastructure requires careful planning. In this post, we explored a field-tested approach in building a scalable, efficient, and cost-effective logging solution using OpenSearch Ingestion.

This solution serves as a starting point that can be customized based on specific organizational needs while maintaining the core principles of scalability, reliability, and cost-effectiveness.

Remember that logging infrastructure is not a “set-and-forget” system. Regular monitoring, periodic reviews of storage patterns, and adjustments to index management policies will help make sure your logging solution continues to serve your organization’s evolving needs effectively.

To dive deeper into OpenSearch Ingestion implementation, explore our comprehensive Amazon OpenSearch Service Workshops, which include hands-on labs and reference architectures. For additional insights, see Build a serverless log analytics pipeline using Amazon OpenSearch Ingestion with managed Amazon OpenSearch Service. You can also visit our Migration Hub if you’re ready to migrate legacy or self-managed workloads to OpenSearch Service.


About the authors

Akhil B is a Data Analytics Consultant at AWS Professional Services, specializing in cloud-based data solutions. He partners with customers to design and implement scalable data analytics platforms, helping organizations transform their traditional data infrastructure into modern, cloud-based solutions on AWS. His expertise helps organizations optimize their data ecosystems and maximize business value through modern analytics capabilities.

Ramya Bhat is a Data Analytics Consultant at AWS, specializing in the design and implementation of cloud-based data platforms. She builds enterprise-grade solutions across search, data warehousing, and ETL that enable organizations to modernize data ecosystems and derive insights through scalable analytics. She has delivered customer engagements across healthcare, insurance, fintech, and media sectors.

Chanpreet Singh is a Senior Consultant at AWS, specializing in the Data and AI/ML space. He has over 18 years of industry experience and is passionate about helping customers design, prototype, and scale Big Data and Generative AI applications using AWS native and open-source tech stacks. In his spare time, Chanpreet loves to explore nature, read, and spend time with his family.

Generic orchestration framework for data warehousing workloads using Amazon Redshift RSQL

Post Syndicated from Akhil B original https://aws.amazon.com/blogs/big-data/generic-orchestration-framework-for-data-warehousing-workloads-using-amazon-redshift-rsql/

Tens of thousands of customers run business-critical workloads on Amazon Redshift, AWS’s fast, petabyte-scale cloud data warehouse delivering the best price-performance. With Amazon Redshift, you can query data across your data warehouse, operational data stores, and data lake using standard SQL. You can also integrate AWS services like Amazon EMR, Amazon Athena, Amazon SageMaker, AWS Glue, AWS Lake Formation, and Amazon Kinesis to take advantage of all of the analytic capabilities in the AWS Cloud.

Amazon Redshift RSQL is a native command-line client for interacting with Amazon Redshift clusters and databases. You can connect to an Amazon Redshift cluster, describe database objects, query data, and view query results in various output formats. You can use Amazon Redshift RSQL to replace existing extract, transform, load (ETL) and automation scripts, such as Teradata BTEQ scripts. You can wrap Amazon Redshift RSQL statements within a shell script to replicate existing functionality in the on-premise systems. Amazon Redshift RSQL is available for Linux, Windows, and macOS operating systems.

This post explains how you can create a generic configuration-driven orchestration framework using AWS Step Functions, Amazon Elastic Compute Cloud (Amazon EC2), AWS Lambda, Amazon DynamoDB, and AWS Systems Manager to orchestrate RSQL-based ETL workloads. If you’re migrating from legacy data warehouse workloads to Amazon Redshift, you can use this methodology to orchestrate your data warehousing workloads.

Solution overview

Customers migrating from legacy data warehouses to Amazon Redshift may have a significant investment in proprietary scripts like Basic Teradata Query (BTEQ) scripting for database automation, ETL, or other tasks. You can now use the AWS Schema Conversion Tool (AWS SCT) to automatically convert proprietary scripts like BTEQ scripts to Amazon Redshift RSQL scripts. The converted scripts run on Amazon Redshift with little to no changes. To learn about new options for database scripting, refer to Accelerate your data warehouse migration to Amazon Redshift – Part 4.

During such migrations, you may also want to modernize your current on-premises, third-party orchestration tools with a cloud-native framework to replicate and enhance your current orchestration capability. Orchestrating data warehouse workloads includes scheduling the jobs, checking if the pre-conditions have been met, running the business logic embedded within RSQL, monitoring the status of the jobs, and alerting if there are any failures.

This solution allows on-premises customers to migrate to a cloud-native orchestration framework that uses AWS serverless services such as Step Functions, Lambda, DynamoDB, and Systems Manager to run the Amazon Redshift RSQL jobs deployed on a persistent EC2 instance. You can also deploy the solution for greenfield implementations. In addition to meeting functional requirements, this solution also provides full auditing, logging, and monitoring of all ETL and ELT processes that are run.

To ensure high availability and resilience, you can use multiple EC2 instances that are a part of an auto scaling group along with Amazon Elastic File System (Amazon EFS) to deploy and run the RSQL jobs. When using auto scaling groups, you can install RSQL onto the EC2 instance as a part of the bootstrap script. You can also deploy the Amazon Redshift RSQL scripts onto the EC2 instance using AWS CodePipeline and AWS CodeDeploy. For more details, refer to Auto Scaling groups, the Amazon EFT User Guide, and Integrating CodeDeploy with Amazon EC2 Auto Scaling.

The following diagram illustrates the architecture of the orchestration framework.

Architecture Diagram

The key components of the framework are as follows:

  1. Amazon EventBridge is used as the ETL workflow scheduler, and it triggers a Lambda function at a preset schedule.
  2. The function queries a DynamoDB table for the configuration associated to the RSQL job and queries the status of the job, run mode, and restart information for that job.
  3. After receiving the configuration, the function triggers a Step Functions state machine by passing the configuration details.
  4. Step Functions starts running different stages (like configuration iteration, run type check, and more) of the workflow.
  5. Step Functions uses the Systems Manager SendCommand API to trigger the RSQL job and goes into a paused state with TaskToken. The RSQL scripts are persisted on an EC2 instance and are wrapped in a shell script. Systems Manager runs an AWS-RunShellScript SSM document to run the RSQL job on the EC2 instance.
  6. The RSQL job performs ETL and ELT operations on the Amazon Redshift cluster. When it’s complete, it returns a success/failure code and status message back to the calling shell script.
  7. The shell script calls a custom Python module with the success/failure code, status message, and the callwait TaskToken that was received from Step Functions. The Python module logs the RSQL job status in the job audit DynamoDB audit table, and exports logs to the Amazon CloudWatch log group.
  8. The Python module then performs a SendTaskSuccess or SendTaskFailure API call based on the RSQL job run status. Based on the status of the RSQL job, Step Functions either resumes the flow or stops with failure.
  9. Step Functions logs the workflow status (success or failure) in the DynamoDB workflow audit table.

Prerequisites

You should have the following prerequisites:

Deploy AWS CDK stacks

Complete the following steps to deploy your resources using the AWS CDK:

  1. Clone the GitHub repo:
    git clone https://github.com/aws-samples/amazon-redshift-rsql-orchestration-framework.git

  2. Update the following the environment parameters in cdk.json (this file can be found in the infra directory):
    1. ec2_instance_id – The EC2 instance ID on which RSQL jobs are deployed
    2. redshift_secret_id – The name of the Secrets Manager key that stores the Amazon Redshift database credentials
    3. rsql_script_path – The absolute directory path in the EC2 instance where the RSQL jobs are stored
    4. rsql_log_path – The absolute directory path in the EC2 instance used for storing the RSQL job logs
    5. rsql_script_wrapper – The absolute directory path of the RSQL wrapper script (rsql_trigger.sh) on the EC2 instance.

    The following is a sample cdk.json file after being populated with the parameters

        "environment": {
          "ec2_instance_id" : "i-xxxx",
          "redshift_secret_id" : "blog-secret",
          "rsql_script_path" : "/home/ec2-user/blog_test/rsql_scripts/",
          "rsql_log_path" : "/home/ec2-user/blog_test/logs/",
          "rsql_script_wrapper" : "/home/ec2-user/blog_test/instance_code/rsql_trigger.sh"
        }
    

  3. Deploy the AWS CDK stack with the following code:
    cd amazon-redshift-rsql-orchestration-framework/lambdas/lambda-layer/
    sh zip_lambda_layer.sh
    cd ../../infra/
    python3 -m venv ./venv
    source .venv/bin/activate
    pip install -r requirements.txt
    cdk bootstrap <AWS Account ID>/<AWS Region>
    cdk deploy --all

Let’s look at the resources the AWS CDK stack deploys in more detail.

CloudWatch log group

A CloudWatch log group (/ops/rsql-logs/) is created, which is used to store, monitor, and access log files from EC2 instances and other sources.

The log group is used to store the RSQL job run logs. For each RSQL script, all the stdout and stderr logs are stored as a log stream within this log group.

DynamoDB configuration table

The DynamoDB configuration table (rsql-blog-rsql-config-table) is the basic building block of this solution. All the RSQL jobs, restart information and run mode (sequential or parallel), and sequence in which the jobs are to be run are stored in this configuration table.

The table has the following structure:

  • workflow_id – The identifier for the RSQL-based ETL workflow.
  • workflow_description – The description for the RSQL-based ETL workflow.
  • workflow_stages – The sequence of stages within a workflow.
  • execution_type – The type of run for RSQL jobs (sequential or parallel).
  • stage_description – The description for the stage.
  • scripts – The list of RSQL scripts to be run. The RSQL scripts must be placed in the location defined in a later step.

The following is an example of an entry in the configuration table. You can see the workflow_id is blog_test_workflow and the description is Test Workflow for Blog.

It has three stages that are triggered in the following order: Schema & Table Creation Stage, Data Insertion Stage 1, and Data Insertion Stage 2. The stage Schema & Table Creation Stage has two RSQL jobs running sequentially, and Data Insertion Stage 1 and Data Insertion Stage 2 each have two jobs running in parallel.

{
	"workflow_id": "blog_test_workflow",
	"workflow_description": "Test Workflow for Blog",
	"workflow_stages": [{
			"execution_flag": "y",
			"execution_type": "sequential",
			"scripts": [
				"rsql_blog_script_1.sh",
				"rsql_blog_script_2.sh"
			],
			"stage_description": "Schema & Table Creation Stage"
		},
		{
			"execution_flag": "y",
			"execution_type": "parallel",
			"scripts": [
				"rsql_blog_script_3.sh",
				"rsql_blog_script_4.sh"
			],
			"stage_description": "Data Insertion Stage 1"
		},
		{
			"execution_flag": "y",
			"execution_type": "parallel",
			"scripts": [
				"rsql_blog_script_5.sh",
				"rsql_blog_script_6.sh"
			],
			"stage_description": "Data Insertion Stage 2"
		}
	]
}

DynamoDB audit tables

The audit tables store the run details for each RSQL job within the ETL workflow with a unique identifier for monitoring and reporting purposes. The reason why there are two audit tables is because one table stores the audit information at a RSQL job level and the other stores it at a workflow level.

The job audit table (rsql-blog-rsql-job-audit-table) has the following structure:

  • job_name – The name of the RSQL script
  • workflow_execution_id – The run ID for the workflow
  • execution_start_ts – The start timestamp for the RSQL job
  • execution_end_ts – The end timestamp for the RSQL job
  • execution_status – The run status of the RSQL job (Running, Completed, Failed)
  • instance_id – The EC2 instance ID on which the RSQL job is run
  • ssm_command_id – The Systems Manager command ID used to trigger the RSQL job
  • workflow_id – The workflow_id under which the RSQL job is run

The workflow audit table (rsql-blog-rsql-workflow-audit-table) has the following structure:

  • workflow_execution_id – The run ID for the workflow
  • workflow_id – The identifier for a particular workflow
  • execution_start_ts – The start timestamp for the workflow
  • execution_status – The run status of the workflow or state machine (Running, Completed, Failed)
  • rsql_jobs – The list of RSQL scripts that are a part of the workflow
  • execution_end_ts – The end timestamp for the workflow

Lambda functions

The AWS CDK creates the Lambda functions that retrieve the config data from the DynamoDB config table, update the audit details in DynamoDB, trigger the RSQL scripts on the EC2 instance, and iterate through each stage. The following is a list of the functions:

  • rsql-blog-master-iterator-lambda
  • rsql-blog-parallel-load-check-lambda
  • rsql-blog-sequential-iterator-lambda
  • rsql-blog-rsql-invoke-lambda
  • rsql-blog-update-audit-ddb-lambda

Step Functions state machines

This solution implements a Step Functions callback task integration pattern that enables Step Functions workflows to send a token to an external system via multiple AWS services.

The AWS CDK deploys the following state machines:

  • RSQLParallelStateMachine – The parallel state machine is triggered if the execution_type for a stage in the configuration table is set to parallel. The Lambda function with a callback token is triggered in parallel for each of the RSQL scripts using a Map state.
  • RSQLSequentialStateMachine – The sequential state machine is triggered if the execution_type for a stage in the configuration table is set to sequential. This state machine uses a iterator design pattern to run each RSQL job within the stage as per the sequence mentioned in the configuration.
  • RSQLMasterStatemachine – The primary state machine iterates through each stage and triggers different state machines based on the run mode (sequential or parallel) using a Choice state.

Move the RSQL script and instance code

Copy the instance_code and rsql_scripts directories (present in the GitHub repo) to the EC2 instance. Make sure the framework directory within instance_code is copied as well.

The following screenshots show that the instance_code and rsql_scripts directories are copied to the same parent folder on the EC2 instance.

Instance Code Scripts Image
Instance Code EC2 Copy Image
RSQL Script Image
RSQL Script EC2 Copy Image

RSQL script run workflow

To further illustrate the mechanism to run the RSQL scripts, see the following diagram.

RSQL Script Workflow Diagram

The Lambda function, which gets the configuration details from the configuration DynamoDB table, triggers the Step Functions workflow, which performs the following steps:

  1. A Lambda function defined as a workflow step receives the Step Functions TaskToken and configuration details.
  2. The TaskToken and configuration details are passed onto the EC2 instance using the Systems Manger SendCommand API call. After the Lambda function is run, the workflow branch goes into paused state and waits for a callback token.
  3. The RSQL scripts are run on the EC2 instance, which perform ETL and ELT on Amazon Redshift. After the scripts are run, the RSQL script passes the completion status and TaskToken to a Python script. This Python script is embedded within the RSQL script.
  4. The Python script updates the RSQL job status (success/failure) in the job audit DynamoDB table. It also exports the RSQL job logs to the CloudWatch log group.
  5. The Python script passes the RSQL job status (success/failure) and the status message back to the Step Functions workflow along with TaskToken using the SendTaskSuccess or SendTaskFailure API call.
  6. Depending on the job status received, Step Functions either resumes the workflow or stops the workflow.

If EC2 auto scaling groups are used, then you can use the Systems Manager SendCommand to ensure resilience and high availability by specifying one or more EC2 instances (that are a part of the auto scaling group). For more information, refer to Run commands at scale.

When multiple EC2 instances are used, set the max-concurrency parameter of the RunCommand API call to 1, which makes sure that the RSQL job is triggered on only one EC2 instance. For further details, refer to Using concurrency controls.

Run the orchestration framework

To run the orchestration framework, complete the following steps:

  1. On the DynamoDB console, navigate to the configuration table and insert the configuration details provided earlier. For instructions on how to insert the example JSON configuration details, refer to Write data to a table using the console or AWS CLI.DynamoDB Config Insertion
  2. On the Lambda console, open the rsql-blog-rsql-workflow-trigger-lambda function and choose Test.Workflow Trigger Lambda Function
  3. Add the test event similar to the following code and choose Test:
    {
    	"workflow_id": "blog_test_workflow",
    	"workflow_execution_id": "demo_test_26"
    }

    Workflow Trigger Lambda function Payload

  4. On the Step Functions console, navigate to the rsql-master-state-machine function to open the details page.RSQL Master Step Function
  5. Choose Edit, then choose Workflow Studio New. The following screenshot shows the primary state machine.RSQL Master Step Function Flow
  6. Choose Cancel to leave Workflow Studio, then choose Cancel again to leave edit mode. You’re directed back to the details page.
    RSQL Master Step Function Details
  7. On the Executions tab, choose the latest run.
    RSQL Master Step Function Execution
  8. From the Graph view, you can check the status of each state by choosing it. Every state that uses an external resource has a link to it on the Details tab.RSQL Master Step Function Execution Graph
  9. The orchestration framework runs the ETL load, which consists of the following sample RSQL scripts:
    • rsql_blog_script_1.sh – This script creates a schema rsql_blog within the database
    • rsql_blog_script_2.sh – This script creates a table blog_table within the schema created in the earlier script
    • rsql_blog_script_3.sh – Inserts one row into the table created in the previous script
    • rsql_blog_script_4.sh – Inserts one row into the table created in the previous script
    • rsql_blog_script_5.sh – Inserts one row into the table created in the previous script
    • rsql_blog_script_6.sh – Inserts one row into the table created in the previous script

You need to replace these RSQL scripts with the RSQL scripts developed for your workloads by inserting the relevant configuration details into the configuration DynamoDB table (rsql-blog-rsql-config-table).

Validation

After you run the framework, you’ll find a schema (called rsql_blog) with one table (called blog_table) created. This table consists of four rows.

RSQL Execution Table

You can check the logs of the RSQL job in the CloudWatch log group (/ops/rsql-logs/) and also the run status of the workflow in the workflow audit DynamoDB table (rsql-blog-rsql-workflow-audit-table).

RSQL Script CloudWatch Logs
RSQL Workflow Audit Record

Clean up

To avoid ongoing charges for the resources that you created, delete them. AWS CDK deletes all resources except data resources such as DynamoDB tables.

  • First, delete all AWS CDK stacks
    cdk destroy --all

  • On the DynamoDB console, select the following tables and delete them:
    • rsql-blog-rsql-config-table
    • rsql-blog-rsql-job-audit-table
    • rsql-blog-rsql-workflow-audit-table

Conclusion

You can use Amazon Redshift RSQL, Systems Manager, EC2 instances, and Step Functions to create a modern and cost-effective orchestration framework for ETL workflows. There is no overhead to create and manage different state machines for each of your ETL workflow. In this post, we demonstrated how to use this configuration-based generic orchestration framework to trigger complex RSQL-based ETL workflows.

You can also trigger an email notification through Amazon Simple Notification Service (Amazon SNS) within the state machine to the notify the operations team of the completion status of the ETL process. Further, you can achieve a event-driven ETL orchestration framework by using EventBridge to start the workflow trigger lambda function.


About the Authors

Akhil is a Data Analytics Consultant at AWS Professional Services. He helps customers design & build scalable data analytics solutions and migrate data pipelines and data warehouses to AWS. In his spare time, he loves travelling, playing games and watching movies.


Ramesh Raghupathy is a Senior Data Architect with WWCO ProServe at AWS. He works with AWS customers to architect, deploy, and migrate to data warehouses and data lakes on the AWS Cloud. While not at work, Ramesh enjoys traveling, spending time with family, and yoga.

Raza Hafeez is a Senior Data Architect within the Shared Delivery Practice of AWS Professional Services. He has over 12 years of professional experience building and optimizing enterprise data warehouses and is passionate about enabling customers to realize the power of their data. He specializes in migrating enterprise data warehouses to AWS Modern Data Architecture.

Dipal Mahajan is a Lead Consultant with Amazon Web Services based out of India, where he guides global customers to build highly secure, scalable, reliable, and cost-efficient applications on the cloud. He brings extensive experience on Software Development, Architecture and Analytics from industries like finance, telecom, retail and healthcare.