Post Syndicated from Alex Waddell original https://aws.amazon.com/blogs/security/reduce-triage-time-for-security-investigations-with-detective-visualizations-and-export-data/
To respond to emerging threats, you will often need to sort through large datasets rapidly to prioritize security findings. Amazon Detective recently released two new features to help you do this. New visualizations in Detective show the connections between entities related to multiple Amazon GuardDuty findings, and a new export data feature helps you use the data from Detective in your other tools and automated workflows.
By using these new features, you can quickly analyze, correlate, and visualize the large amounts of data generated by sources like Amazon Virtual Private Cloud (Amazon VPC) Flow Logs, AWS CloudTrail, Amazon GuardDuty findings, and Amazon Elastic Kubernetes Service (Amazon EKS) audit logs.
In this post, we’ll show you how you can use these new features to help reduce the time it takes to assess, investigate, and prioritize a security incident.
A security finding is raised
The workflow starts with GuardDuty. GuardDuty continuously monitors AWS accounts, Amazon Elastic Compute Cloud (Amazon EC2) instances, EKS clusters, and data stored in Amazon Simple Storage Service (Amazon S3) for malicious activity without the use of security software or agents.
If GuardDuty detects potential malicious activity, such as anomalous behavior, credential exfiltration, or command and control (C2) infrastructure communication, it generates detailed security incidents called findings.
Depending on the severity and complexity of the GuardDuty finding, the resolution might require deep investigation. Consider an example that involves cryptocurrency mining. If you frequently see a cryptocurrency finding on your EC2 instances, you might have a recurring malware issue that has enabled a backdoor. If a threat actor is attempting to compromise your AWS environment, they typically perform a sequence of actions that lead to multiple findings and unusual behavior. When security findings are investigated in isolation, it can lead to a misinterpretation of their significance and difficulty in finding the root cause. When you need more context around a finding, Detective can help.
Detective automatically collects log data and events from sources like CloudTrail logs, Amazon VPC Flow Logs, GuardDuty findings, and Amazon EKS audit logs and maintains up to a year of aggregated data for analysis. Detective uses machine learning to create a behavioral graph for these data sources that helps show how security issues have evolved. It highlights what AWS resources might be compromised and flags unusual activity like new API calls, new user agents, and new AWS Regions.
The search capabilities work across AWS workloads, providing the information required to show the potential impact of an incident. Detective helps you answer questions like: How did this security incident happen? What AWS resources were affected? How can we prevent this from happening again?
Finding groups help connect the dots of an incident
You can use finding groups, a recent feature of Detective, to help with your investigations. A finding group is a collection of entities related to a single potential security incident that should be investigated together. An entity can be an AWS resource like an EC2 instance, IAM role, or GuardDuty finding, but it can also be an IP address or user agent. For a full list of entities collected, see Searching for a finding or entity in the Detective User Guide.
Grouping these entities together helps provide context and a more complete understanding of the threat landscape. This makes it simpler for you to identify relationships between different events and to assess the overall impact of a potential threat.
In the cryptocurrency mining example described previously, finding groups could show the relationship between the cryptocurrency mining finding and a C2 finding so that you know the two are related and the AWS resources affected. To learn more about working with Detective finding groups, see How to improve security incident investigations using Amazon Detective finding groups.
Figure 1 shows the finding groups overview page on the Detective console, with a list of finding groups filtered by status. The dashboard also shows the severity, title, observed tactics, accounts, entities, and the total number of findings for each finding group. For more information about the attributes of finding groups, see Analyzing finding groups.
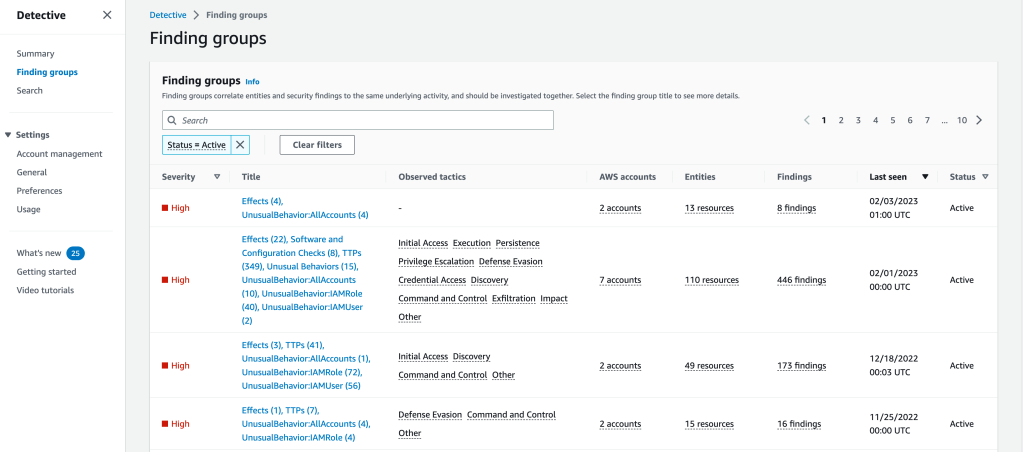
Figure 1: Finding groups overview
To see details about the finding group, select the title of the finding group to access the details page, which includes Details, Visualization, Involved entities, and Involved findings. On this panel, you can view entities and findings included in a finding group and interact with them. The information presented is the same in the Visualization panel, the Involved entities panel, and the Involved findings panel. The different views allow you to view the information in the way that is helpful for you. Figure 2 shows an example of the Details and Visualization for a specific finding group.
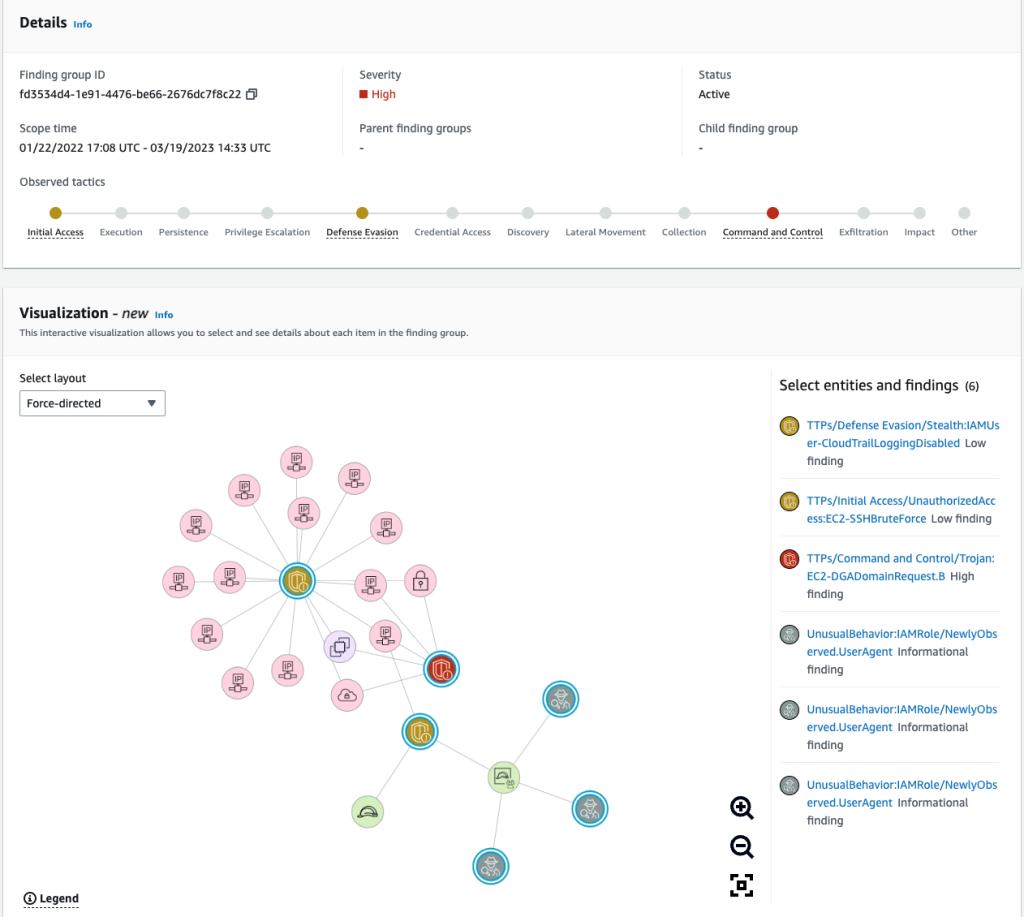
Figure 2: Details and Visualization
Note: Finding groups with over 100 nodes (findings and entities) do not include a graph visualization.
Visualizations to show you the situation
The new visualizations in Detective provide three layouts that display the same information from finding groups, but allow you to choose and arrange the different entities so that you can focus on the highest priority finding or resources.
To determine what each visual element represents, choose the Legend in the bottom left corner of the panel. You can change the placement of findings in the Visualization panel by selecting a different layout from the Select layout dropdown menu. Figure 2 in the preceding section shows the Force-directed layout, where the positioning of entities and findings presents an even distribution of links with minimal overlap, while maintaining consistent distance between items.
Figure 3 shows the Visualization panel with the Circle layout, where nodes are displayed in a circular layout. You can use the Legend to understand the different categories of Findings, Compute, Network, Identity, Storage, or Other.
If you’re unfamiliar with these terms, see Amazon Detective terms and concepts to learn more.
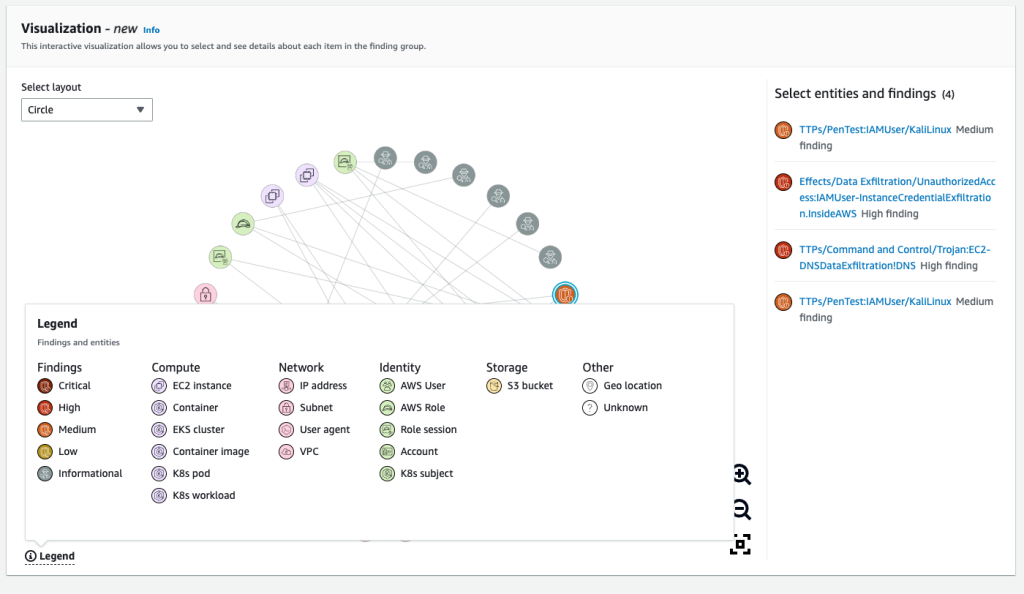
Figure 3: Visualization panel with Circle layout and Legend
Figure 4 shows the Visualization panel with the Grid layout, where nodes are divided into four different columns: evidence, identity entities, GuardDuty findings, and other entities (compute, network, and storage).
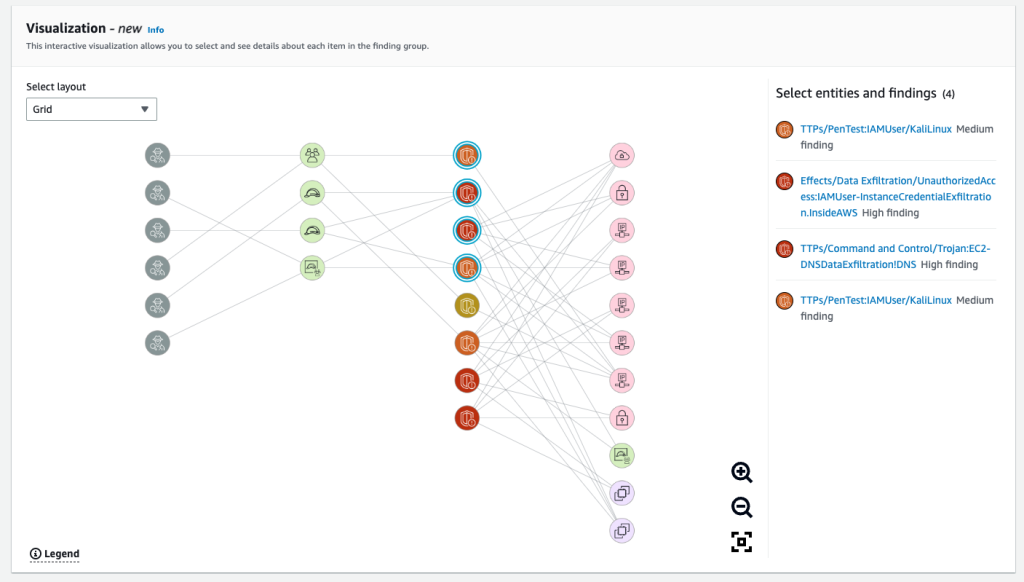
Figure 4: Visualization panel with Grid layout
In the Visualization panel, you can select one or more (using ctrl/cmd+click) nodes. Selected nodes are listed next to the graph, and you can select each node’s title for more information. Selecting an entity’s title opens a new page that displays detailed information about that entity, whereas selecting a finding or evidence expands the right sidebar to show details on the selected finding or evidence.
You can rearrange chosen entities and findings as needed to help improve your understanding of their connections. This can help speed up your assessment of findings. Figure 5 shows the Visualization panel with four nodes selected and the sidebar displaying information relevant to the selected finding.
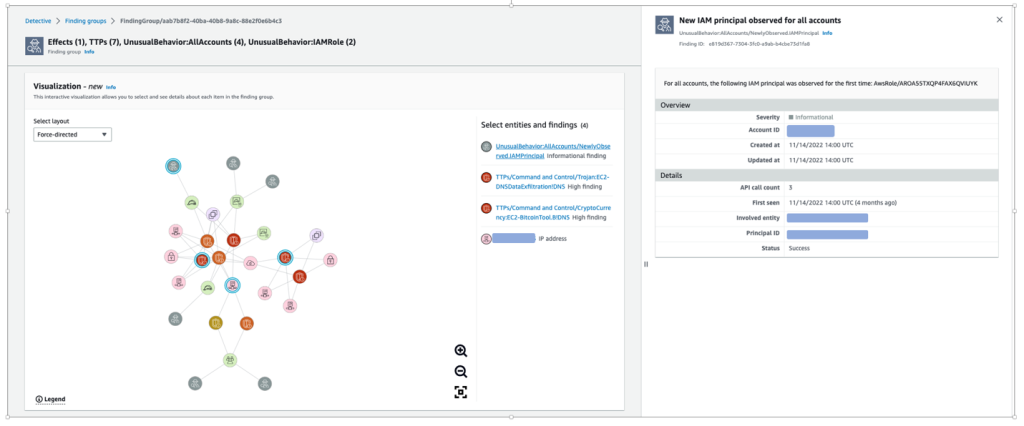
Figure 5: Visualization panel with evidence selected
Finding groups and visualizations provide an overview of the entities and resources related to a security activity. Presenting the information in this way highlights the interconnections between various activities. This means that you no longer have to use multiple tools or query different services to collect information or investigate entities and resources. This can help you reduce triage and scoping times and make your investigations faster and more comprehensive.
Increased flexibility for investigation with simpler data access
To expand the scope of your investigation or confirm if a security incident has taken place, you might want to combine data from Detective with your own tools or different services. This is where export data comes into play.
Detective has several Summary page panels that you can use as a starting point for your investigations because they highlight potentially suspicious activity. The panels include roles and users with the most API call volume, EC2 instances with the most traffic volume, and EKS clusters with the most Kubernetes pods created.
With export data, you can now export these panels as common-separated values (CSV) files and import the data into other AWS services or third-party applications, or manipulate the data with spreadsheet programs.
Export from the Detective console Summary screen
In the Detective console, on the Summary page, you will see an Export option on several summary panes. This is enabled and available for anyone with access to Detective. Figure 6 shows summary information for the roles and users with the most API call volume.
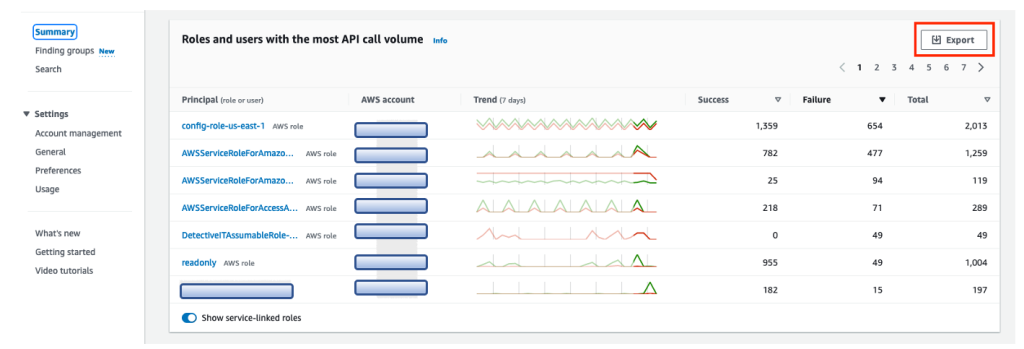
Figure 6: Detective console Summary screen
Choose Export to download a CSV file containing the data for the summary information. The file is downloaded to your browser’s default download folder on your local device. When you view the data, it will look something like the spreadsheet in Figure 7:
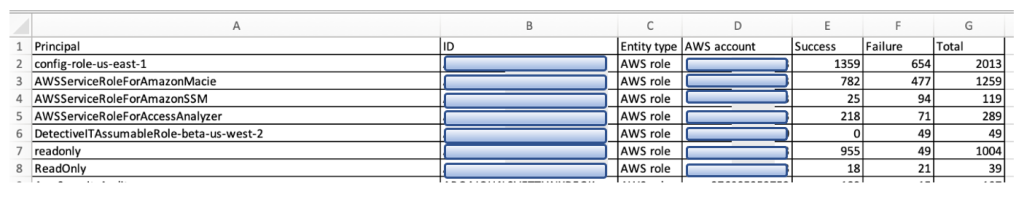
Figure 7: Example CSV data export from Detective console Summary
Export from the Detective console Search screen
You can also export data using the Search capability of Detective. After you apply specific filters to search for findings or entities based on your use case, an Export button appears at the top of the search results in Detective. Figure 8 shows an example of filtering for a particular CIDR range. Choose Export to download the CSV file containing the filtered data.
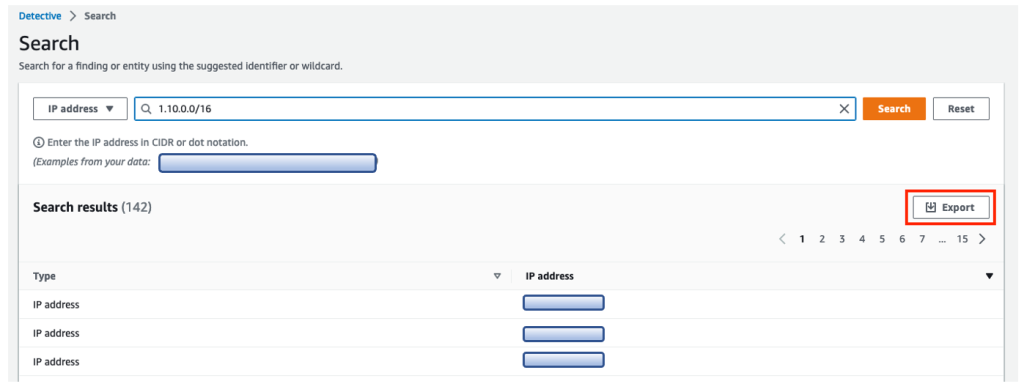
Figure 8: Detective search results filtering for a CIDR range
Conclusion
In this blog post, you learned how to use the two new features of Detective to visualize findings and export data. By using these new features, you and your teams can investigate an incident in the way that best fits your workflow. New visualizations show the entities involved in an issue and surface nuanced connections that can be difficult to find when you’re faced with line after line of log data. The new data export feature makes it simpler to integrate the insights discovered in Detective with the tools and automations that your team is already using.
These features are automatically enabled for both existing and new customers in AWS Regions that support Detective. There is no additional charge for finding groups. If you don’t currently use Detective, you can start a free 30-day trial. For more information on finding groups, see Analyzing finding groups in the Amazon Detective User Guide.
If you have feedback about this post, submit comments in the Comments section below. You can also start a new thread on Amazon Detective re:Post or contact AWS Support.
Want more AWS Security news? Follow us on Twitter.