Post Syndicated from Margaret Jonson original https://aws.amazon.com/blogs/security/reinforce-2025-genai-sessions/

A full conference pass is $1,099. Register today with the code flashsale150 to receive a limited time $150 discount, while supplies last.
From proof of concepts to large scale production deployments, the rapid advancement of generative AI has ushered in unique opportunities for innovation, but it also introduces a new set of security challenges (and opportunities) that organizations must address. How do you protect retrieval-augmented generation (RAG) or training data while maintaining model effectiveness? What controls are needed for large language model (LLM) interactions? How can I take full advantage of AI agents and model context protocol (MCP) while minimizing risk? At AWS re:Inforce 2025, we’re bringing together security experts, practitioners, and industry leaders to answer these questions with real-world, prescriptive guidance and more.
This year, our generative AI security sessions have been specifically curated and designed to help you build and maintain secure, production AI systems at scale. Whether you’re just beginning your AI security journey or leading mature, enterprise-wide AI initiatives, you’ll find deep practical guidance, hands-on experience, and strategic insights to advance your organization’s security posture.
From foundational concepts to advanced defensive techniques, these sessions encompass critical areas including data protection, model security, identity management, and AI agent resilience. You’ll learn directly from AWS security experts, customers who have successfully implemented secure AI systems, and industry leading partners who are setting new standards in AI safety and security.
In this blog, we highlight some “can’t miss” sessions that cover how to secure AI, but also how security practitioners can leverage AI to help with their critical security missions as well! Join in on the fun, and register for re:Inforce 2025!
Innovation talk
Engage with top AWS executives in our Innovation Talks series, where you’ll gain invaluable insights into the forefront of cloud technology. Explore the latest advancements in generative AI, discover robust cloud security strategies, and uncover pioneering architectural concepts that are revolutionizing application development and expanding the possibilities of the AWS Cloud.
SEC301 | Innovation Talk | From possibility to production: A strong, flexible foundation for AI security
Speakers: Hart Rossman (AWS) & Becky Weiss (AWS)
Discover how AWS removes the heavy lifting of AI security, enabling you to accelerate from development to production. This session reveals how the proven AWS security foundation, combined with flexible controls and automated reasoning, helps organizations confidently deploy AI innovations. Through real-world examples, learn how to transform security from a potential roadblock into an innovation enabler. Leave with practical guidance for securing AI workloads today and strategic insights into addressing emerging security challenges, including data security and agentic AI. Learn how the AWS approach to AI security helps you start ahead while maintaining strong security controls.
Breakout sessions, chalk talks, and lightning talks
Breakout sessions are lecture-style, one-hour sessions delivered by AWS experts, customers, and partners—perfect for deepening your knowledge on important topics, gaining actionable insights, and connecting with industry leaders.
Chalk talks are one-hour long, highly interactive sessions with a small audience. This format is ideal for diving deep into specific topics, engaging directly with AWS experts, and getting your questions answered in real time.
Lightning talks are short (20 minute) theater presentations dedicated to a specific customer story, service demo, or AWS Partner offering.
SEC303 | Breakout session | Behind the shields: AWS and Anthropic’s approach to secure AI
Speakers: Matt Saner (AWS) & Shahzeb Jiwani (Anthropic)
Enterprise AI adoption demands robust security. In this session, Join Anthropic’s head of risk governance along with AWS security leaders to reveal how AWS and Anthropic collaborate to deliver enterprise-grade security for LLMs and the generative AI workloads they enable. Learn about the multi-layered security approach spanning infrastructure, data, and models. We’ll explore real-world security architectures, governance frameworks, and risk mitigation strategies. You will leave with a deeper understanding of how to leverage AWS and Anthropic’s security capabilities to accelerate your organization’s AI initiatives while maintaining stringent security and compliance requirements.
SEC304 | Breakout session | Amazon.com testing frameworks and tools for GenAI security and privacy
Speakers: Alex Torres (AWS), Josh Haycraft (Amazon), & Jess Clark (Amazon)
GenAI solutions are launching in a unique, rapidly-shifting security landscape: they may be trained on customer data, they may integrate with internal services or datastores, and they will provide generated content to customers or to other systems. Learn how Amazon.com creates toolkits, systems and frameworks to leverage Large Language Models and Generative AI to enrich customer interactions to promote agility and innovation.
TDR301 | Breakout session | Innovations in AWS detection and response for integrated security outcomes
Speakers: Himanshu Verma (AWS) & Ryan Holland (AWS)
Discover how the latest AWS detection and response capabilities can help secure your cloud environment more effectively. Learn practical ways to achieve integrated security outcomes through enhanced threat detection, automated vulnerability management, and streamlined response – all at scale. We’ll show you how to use AWS security services to protect workloads and data, centralize security monitoring, manage security posture continuously, and unify security data, while leveraging generative AI for security operations. Walk away with actionable insights on integrating AWS detection and response services to strengthen and simplify your security across AWS.
SEC431 | Chalk talk | Dive deep into data protection architectures for Amazon Bedrock Agents
Speakers: Andrew Kane (AWS) & Gabrielle Dompreh (AWS)
Join this chalk talk to understand how Amazon Bedrock protects your data across Agents and related features, such as Knowledge Bases and Guardrails. Learn about security considerations for cross-region deployments, multi-agent collaboration, and prompt caching. Gain deep insights into architecting secure generative AI solutions that maintain data protection, and discover architectural patterns that keep your applications safe and secure.
APS231 | Chalk talk | Using AWS services to mitigate the OWASP Top 10 for LLM threats
Speakers: Mark Keating (AWS) & Cameron Smith (AWS)
You’ve identified your generative AI use case, tested it and are creating a secure application architecture design. How do you know what generative AI specific threats you should be protecting against, and what tools or services are available that can help? You may have heard of the OWASP Top 10 for LLM Applications, but where or how do you start? Join us as we discuss the OWASP Top 10 threats, the differences between versions, and how AWS can help you mitigate these threats.
DAP332 | Chalk talk | Executive perspective: Risk management for generative AI workloads
Speakers: Jason Garman (AWS) & Mark Ryland (AWS)
Don’t let the perceived complexity of responsible AI keep you from deploying generative AI applications on AWS. In this chalk talk, we will present a framework for breaking down AI safety and security risks, introduce AWS best practices for keeping enterprise data secure in generative AI applications using zero trust principles, and mitigate safety risks using technologies such as Bedrock Guardrails. Discover as a group with fellow security leaders how to identify safety and security risks relevant to your workload, implement appropriate mitigation strategies, and measure efficacy over time.
GRC337 | Chalk talk | Build compliant AI: Implementing controls for emerging regulations
Speakers: Samuel Waymouth (AWS) & Mark Keating (AWS)
As AI adoption accelerates, organizations face increasing regulatory scrutiny and compliance requirements. In this session, learn about the evolving global regulatory landscape for AI, data privacy, and data sovereignty, then see how you can map regulatory requirements and security controls to AWS services and features. We will demonstrate how generative AI can work as a tool for assessment, risk classification and generating compliance guidance. We also show you how to use the latest threat modelling resources developed by AWS. Security professionals and AI practitioners will learn actionable strategies for building AI systems aligned with compliance standards while also maintaining innovation velocity.
SEC221 | Lightning talk | Raising the tide: How AWS is shaping the future of secure AI
Speakers: Matt Saner (AWS)
AI security is a top priority for AWS. By building AI solutions that are secure by design, AWS helps customers innovate quickly with confidence while mitigating emerging threats. But securing AI goes beyond individual organizations—it requires industry-wide standards and best practices. AWS actively contributes to global AI security efforts, including its participation industry standards bodies such as CoSAI (The Coalition for Secure AI), to make sure AI technologies are safe, resilient, and trustworthy. This session will explore how AWS is leading AI security innovation, protecting customers, and collaborating to help shape the future of AI security for the entire industry.
SEC322 | Lightning talk | Managing digital identity in the age of generative AI
Speakers: Arthur Mnev (AWS) & Lily Ashidam (AWS)
In this session, we will explore the challenges and solutions for managing identities in generative AI workloads. This session covers securing API access for LLMs, implementing proper authentication for, in, and with AI services, and maintaining data lineage. Learn practical approaches towards securing generative AI applications while maintaining compliance and governance requirements.
SEC323 | Lightning talk | A practical guide to generative AI agent resilience
Speakers: Yiwen Zhang (AWS) & Jennifer Moran (AWS)
As generative AI agents dominate headlines and technological discussions, enterprise adoption remains in its infancy. GenAI agent resilience is a crucial factor in successful implementation and building user trust. While traditional workload resilience practices—such as database availability, workload capacity, observability, and disaster recovery—remain relevant, GenAI agents present unique challenges. This session delves into the critical dimensions of GenAI agent resilience, including LLM model adaptability, latency management, tool availability, observability, and financial sustainability. We will share practical strategies for building robust, reliable GenAI agents that enterprises can trust and maintain.
SEC326 | Lightning Talk | Secure remote MCP server deployment for Gen AI on AWS
Speakers: Aaron Brown (AWS) & James Ferguson (AWS)
Discover how to securely build and deploy remote Model Context Protocol (MCP) servers on AWS that implement the protocol’s security and trust principles. This session demonstrates OAuth 2.1 authorization patterns that enforce user consent, data privacy, and tool safety requirements. Learn to implement robust security controls using Amazon Cognito, API Gateway, and Lambda while maintaining protocol compliance. Explore practical examples of authorization flows, access controls, and security monitoring that align with MCP specifications.
TDR322 | Lightning talk | How AWS uses generative AI to advance native security services
Speakers: Marshall Jones (AWS) & Himanshu Verma (AWS)
Discover how AWS leverages generative AI to enhance native security services. This session demonstrates how AWS implements AI capabilities across its security portfolio to improve threat detection, investigation, and response. Explore practical implementations in Amazon GuardDuty and Amazon Inspector that enable automated analysis and natural language security queries. Leave with insights into how AWS makes security more intelligent and efficient through generative AI.
Interactive sessions (builders’ sessions, code talks, and workshops)
Interact with small groups led by an AWS expert providing interactive learning about how to build on AWS. Each builders’ session begins with a short explanation or demonstration of what attendees are building—then it’s your turn to build! The expert will guide you end-to-end through this hands-on experience. Or join Code Talks, our code-focused interactive sessions where AWS experts lead a discussion featuring live coding or code samples as they illuminate the “why” behind AWS solutions. Attendees are encouraged to ask questions and follow along.
Workshops are two-hour interactive sessions where you collaborate in teams or work individually to solve real-world challenges by using AWS services, making them perfect for hands-on learning. Each workshop begins with a brief lecture, followed by dedicated time to work through the problem.
Note: Don’t forget to bring your laptop to build alongside AWS experts.
SEC351 | Builders’ session | Accelerating incident response, compliance & auditing using generative AI
Speakers: Snehal Nahar (AWS), Ravindra Kori (AWS), Rayette Toles-Abdullah (AWS), & Abhijit Barde (AWS)
In this session, we will learn how to use AWS native generative AI capabilities to reduce time to recovery after an incident using enterprise communication tools such as Slack. We will also learn how to use detective controls to identify events that may result in an incident, and also how to use preventive controls to mitigate the risk of an incident occurring. We will use services like Amazon Q Developer, AWS Config, AWS CloudTrail Lake, Amazon CloudWatch and other observability features.
SEC352 | Builders’ session | Agentic AI for security: Building intelligent egress traffic controls
Speakers: Ranjith Rayaprolu (AWS), Anil Nadiminti (AWS), Michael Leighty (AWS), & Dwaragha Sivalingam (AWS)
Learn to build AI-powered security agents that protect your cloud infrastructure. This hands-on session shows you how to use Amazon Bedrock and Bedrock Agents to create intelligent systems that watch over your network. You’ll build Generative AI agents that monitor egress traffic, spot potential threats, and automatically update network firewall to block malicious traffic. Walk away with the skills to implement AI-powered security agents that can reason, decide, and act to protect your cloud infrastructure.
SEC353 | Builders’ session | Threat modeling for generative AI applications
Speakers: Laura Verghote (AWS), Isabelle Mos (AWS), Samuel Waymouth (AWS), & Omar Zoma (AWS)
In this builders’ session, you will learn how to systematically identify and analyze security threats specific to generative AI applications. As organizations rapidly adopt large language models and other generative AI capabilities, understanding the unique security challenges – from prompt injection to data poisoning – becomes critical. You will be guided through the process of creating threat models for common generative AI architectures, with a particular focus on applications built using AWS services like Amazon Bedrock.
SEC451 | Builders’ session | From logs to defense: Generative AI for security automation
Speakers: Ravindra Kori (AWS), Siavash Iran (AWS), Lily Ashidam (AWS), & Yiwen Zhang (AWS)
In this technical session, we’ll demonstrate how to transform traditional operating system log analysis into an intelligent, automated defense system using AWS native services and generative AI. We’ll explore how to build a comprehensive solution that captures security-relevant logs from Windows and Linux systems.
APS351 | Builders’ session | Securing generative AI agents using AWS Well-Architected Framework
Speakers: Krupanidhi Jay (AWS), Ryan Dsouza (AWS), Birender Pal (AWS), & Omkar Mukadam (AWS)
Learn hands-on how to build secure generative AI agent solutions following the AWS Well-Architected Framework’s Generative AI Lens security best practices. Work through practical implementations of endpoint security, prompt engineering guardrails, monitoring systems, and protection against excessive agency while building a production-ready generative AI agent. Through hands-on exercises, build a secure generative AI agent solution incorporating these controls on AWS, involving Amazon Bedrock, Amazon CloudWatch, AWS Identity and Access Management (IAM), and more. You must bring your laptop to participate.
APS353 | Builders’ session | Red teaming your LLM security at scale
Speakers: Otto Kruse (AWS), Owen Hawkins (AWS), Aaron Brown (AWS), & Jeff Lombardo (AWS)
Step into the shoes of an AI-powered red team adversary in the GenAI Red Team Challenge. In this intensive workshop, you’ll deploy an AI security agent to orchestrate sophisticated threat chains against GenAI applications, systematically discovering and exploiting vulnerabilities from prompt injection to boundary testing while mastering automated security testing workflows. In addition, you’ll learn to apply countermeasures, from prompt templating to guardrails. This hands-on, gamified experience helps you think like a threat actor and equips you with practical skills in automated vulnerability testing and risk mitigation against common MITRE and OWASP vulnerabilities for LLM-based applications. You must bring your laptop to participate.
GRC354 | Builders’ session | Best practices for using generative AI to manage cloud compliance
Speakers: Adnan Bilwani (AWS), Ali Maaz (AWS), Artur Rodrigues (AWS), & Peter Pereira (AWS)
Learn how to leverage Amazon Q Developer to streamline cloud compliance management using AWS Config. This hands-on builders’ session demonstrates how to create intelligent compliance checks, automate remediation workflows, and generate detailed compliance reports using generative AI capabilities. Through practical exercises, learn to implement automated compliance monitoring that combines the power of generative AI with AWS Config’s robust compliance framework. You must bring your laptop to participate.
IAM451 | Builders’ session | Securing GenAI apps: Fine-grained access control for Bedrock Agents
Speakers: Edward Sun (AWS), Pravin Nair (AWS), Dustin Ellis (AWS), & Kevin Hakanson (AWS)
Want to secure generative AI applications accessing your organizational data? Learn how to implement intelligent access controls for Amazon Bedrock-powered applications accessing your organizational data. In this builders’ session, you’ll build a defense-in-depth approach that combines authentication using Amazon Cognito and fine-grained authorization with Amazon Verified Permissions to secure access for Bedrock AI agents. Implement layered permissions that protect sensitive data without limiting your GenAI capabilities. You must bring your laptop to participate.
TDR251 | Builders’ session | Build your first AI security assistant with Amazon Q
Speakers: Scott Taggart (AWS), Joe Wagner (AWS), Laura Verghote (AWS), & Riggs Goodman III (AWS)
Discover how to build your first AI-powered security assistant using Amazon Q Business – no AI expertise required. In this hands-on session, you’ll create three practical security workflows: an automated Amazon GuardDuty incident investigator that contextualizes security findings, an AWS Security Hub compliance report generator that streamlines policy assessments, and an Amazon Inspector-based vulnerability management helper that accelerates remediation. Perfect for security practitioners who want to enhance AWS security operations with generative AI while mastering core AWS security services through practical application. You must bring your laptop to participate.
IAM441 | Code talk | The right way to secure AI agents with code examples
Speakers: Jeff Lombardo (AWS) & Fei Yuan (AWS)
Generative AI agents run tasks on behalf of human users and often interact with each other across on-premises environments and different cloud providers. This brings new challenges in identity authentication, propagation, delegation, and resource authorization in the overall agentic AI solution. Learn how Amazon Cognito’s OAuth2-based identity management, machine-to-machine authentication, combined with Amazon Verified Permissions fine-grained authorization can enable secure delegation patterns for AI agents, while preserving human identity and consent, agent machine identity, and other request context throughout the agent chain. We will walk through real-world examples with agents built on Amazon Bedrock or other frameworks.
TDR341 | Code talk | Build AI security agents with Amazon Bedrock and Amazon Security Lake
Speakers: Chris Lamont-Smith (AWS) & Pratima Singh (AWS)
In this code talk, explore how to enhance security operations by creating AI agents using Amazon Bedrock and Amazon Security Lake. Through live coding demonstrations, learn to build automated workflows that combine autonomous decision-making capabilities with generative AI for security analysis and response. See how to implement agents that analyze logs, provide contextual insights, and execute response procedures. Discover practical approaches for integrating custom tools and leveraging large language models in your security workflows.
SEC371 | Workshop | Red Team approaches to practical generative AI defenses
Speakers: Mac Stevens (AWS) & Cameron Smith (AWS)
This workshop takes a hands-on approach to Generative AI security, focusing on Amazon Bedrock, Amazon SageMaker, and related services. We’ll begin by examining Bedrock’s core security principles, including data protection during inference and in features like Agents, Guardrails, and Knowledge Bases. Participants will gain insights into the internal architectures and security implications of context windows, system prompts, agent orchestration, and more. The session then transitions into hands-on red teaming exercises using SageMaker. We’ll subsequently explore defensive strategies against these threat vectors and discuss methods for integrating these practices into development workflows. Participants will leave equipped with a holistic understanding of Generative AI security, from individual model protection to safeguarding complex, multi-component systems.
APS371 | Workshop | Securing your generative AI applications on AWS
Speakers: Mark Keating (AWS) & Maitreya Ranganath (AWS)
In this workshop, discover how to secure generative AI applications using AWS services and features. Explore how to deploy a vulnerable sample generative AI application and then layer security controls to protect, detect, and respond to security issues. Learn how to apply similar controls to the generative AI applications in your organization. You must bring your laptop to participate.
DAP371 | Workshop | Defend your AI: Mitigate prompt injection with Amazon Bedrock
Speakers: Mark Keating (AWS) & Maitreya Ranganath (AWS)
Master the art of identifying and mitigating prompt injection vulnerabilities in generative AI systems through this hands-on workshop. Using Amazon Bedrock, participants will explore both offensive and defensive prompt engineering techniques to understand the security implications of large language models in production environments. In this session you will understand how prompt injection attacks work, complete an interactive ‘capture the flag’ style challenge attempting to exploit a simulated AI environment, and learn to implement defensive controls using Amazon Bedrock Guardrails. You must bring your laptop to participate.
Register now
Don’t miss this opportunity to learn from industry experts and AWS leaders about securing your AI implementations. Register for AWS re:Inforce 2025 today to reserve your spot in these sessions. Browse the full re:Inforce catalog to learn more about sessions in other tracks, plus partner sessions and code talks.
If you have feedback about this post, submit comments in the Comments section below.


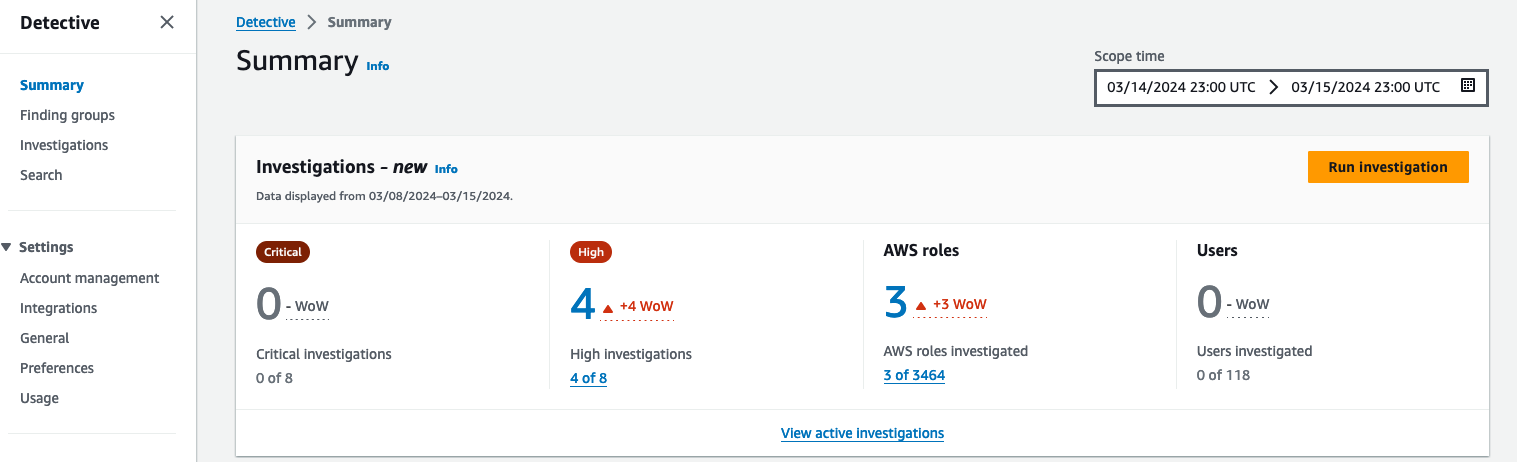
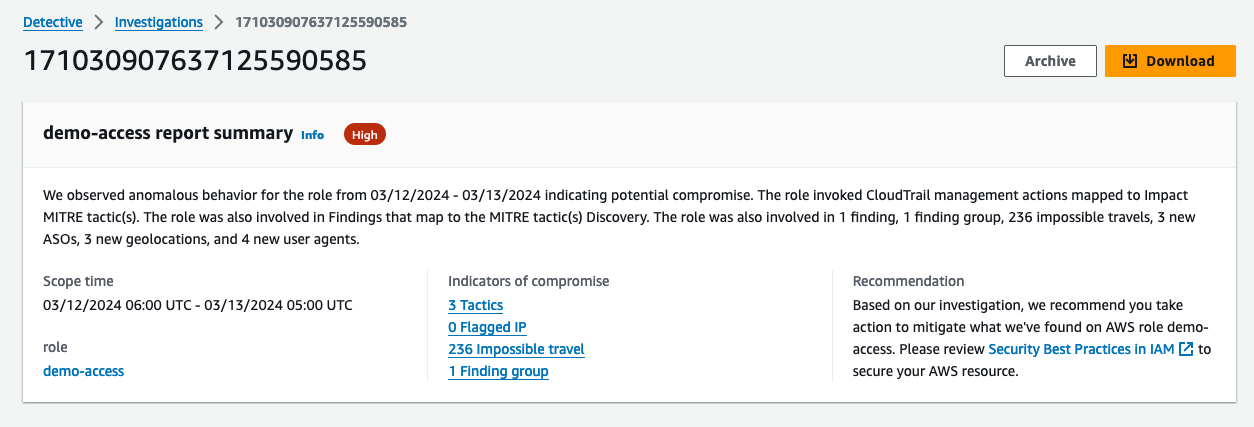
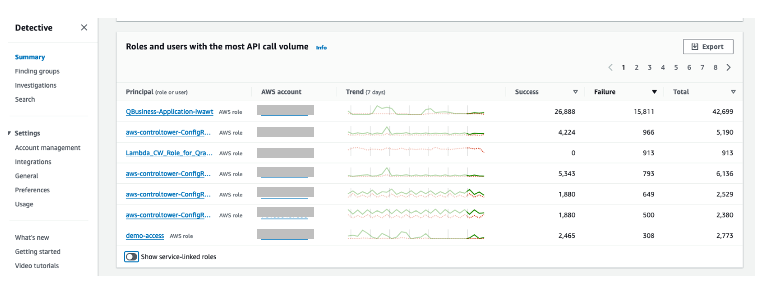
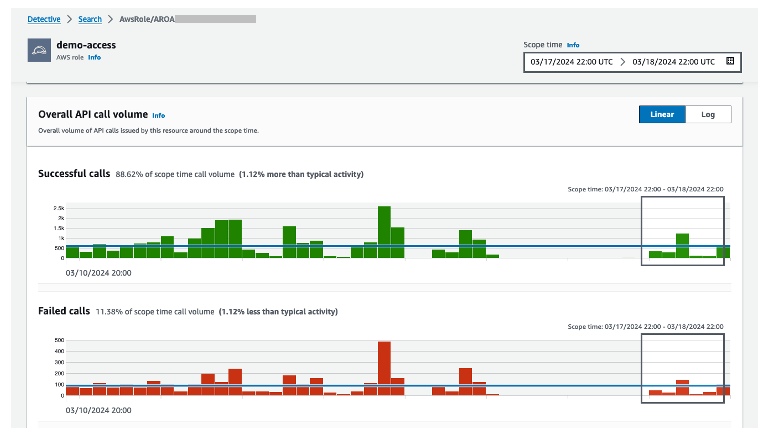
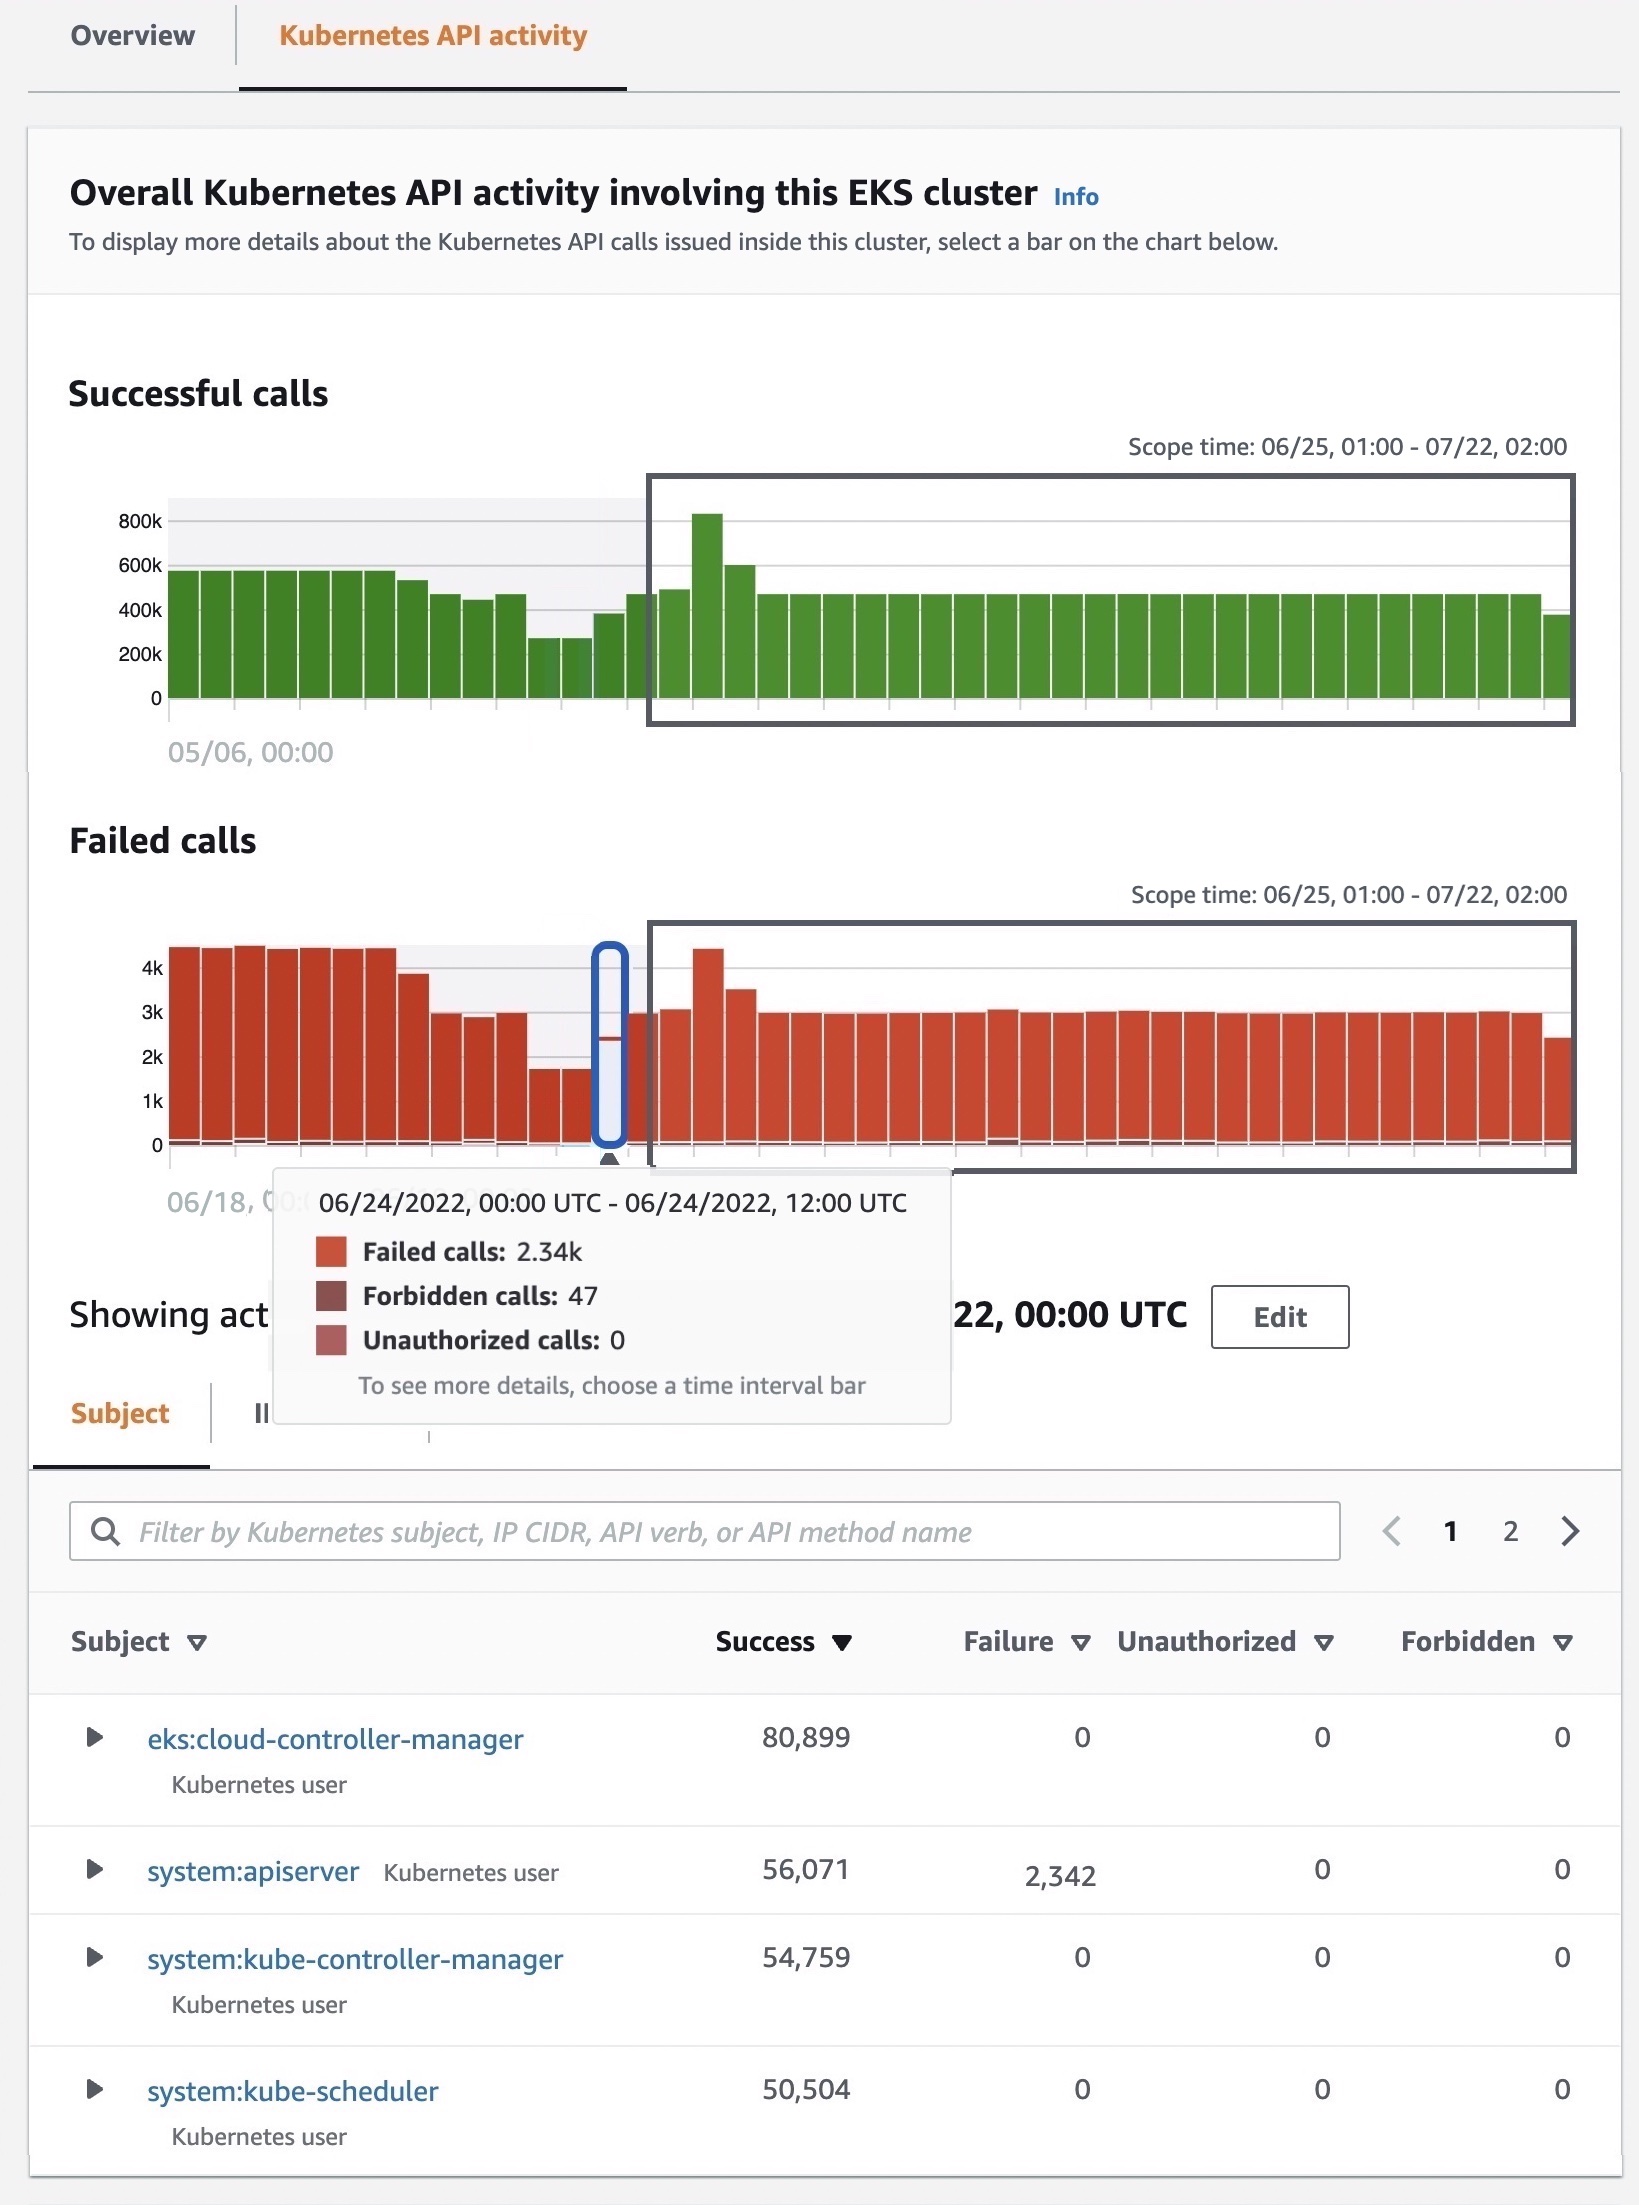
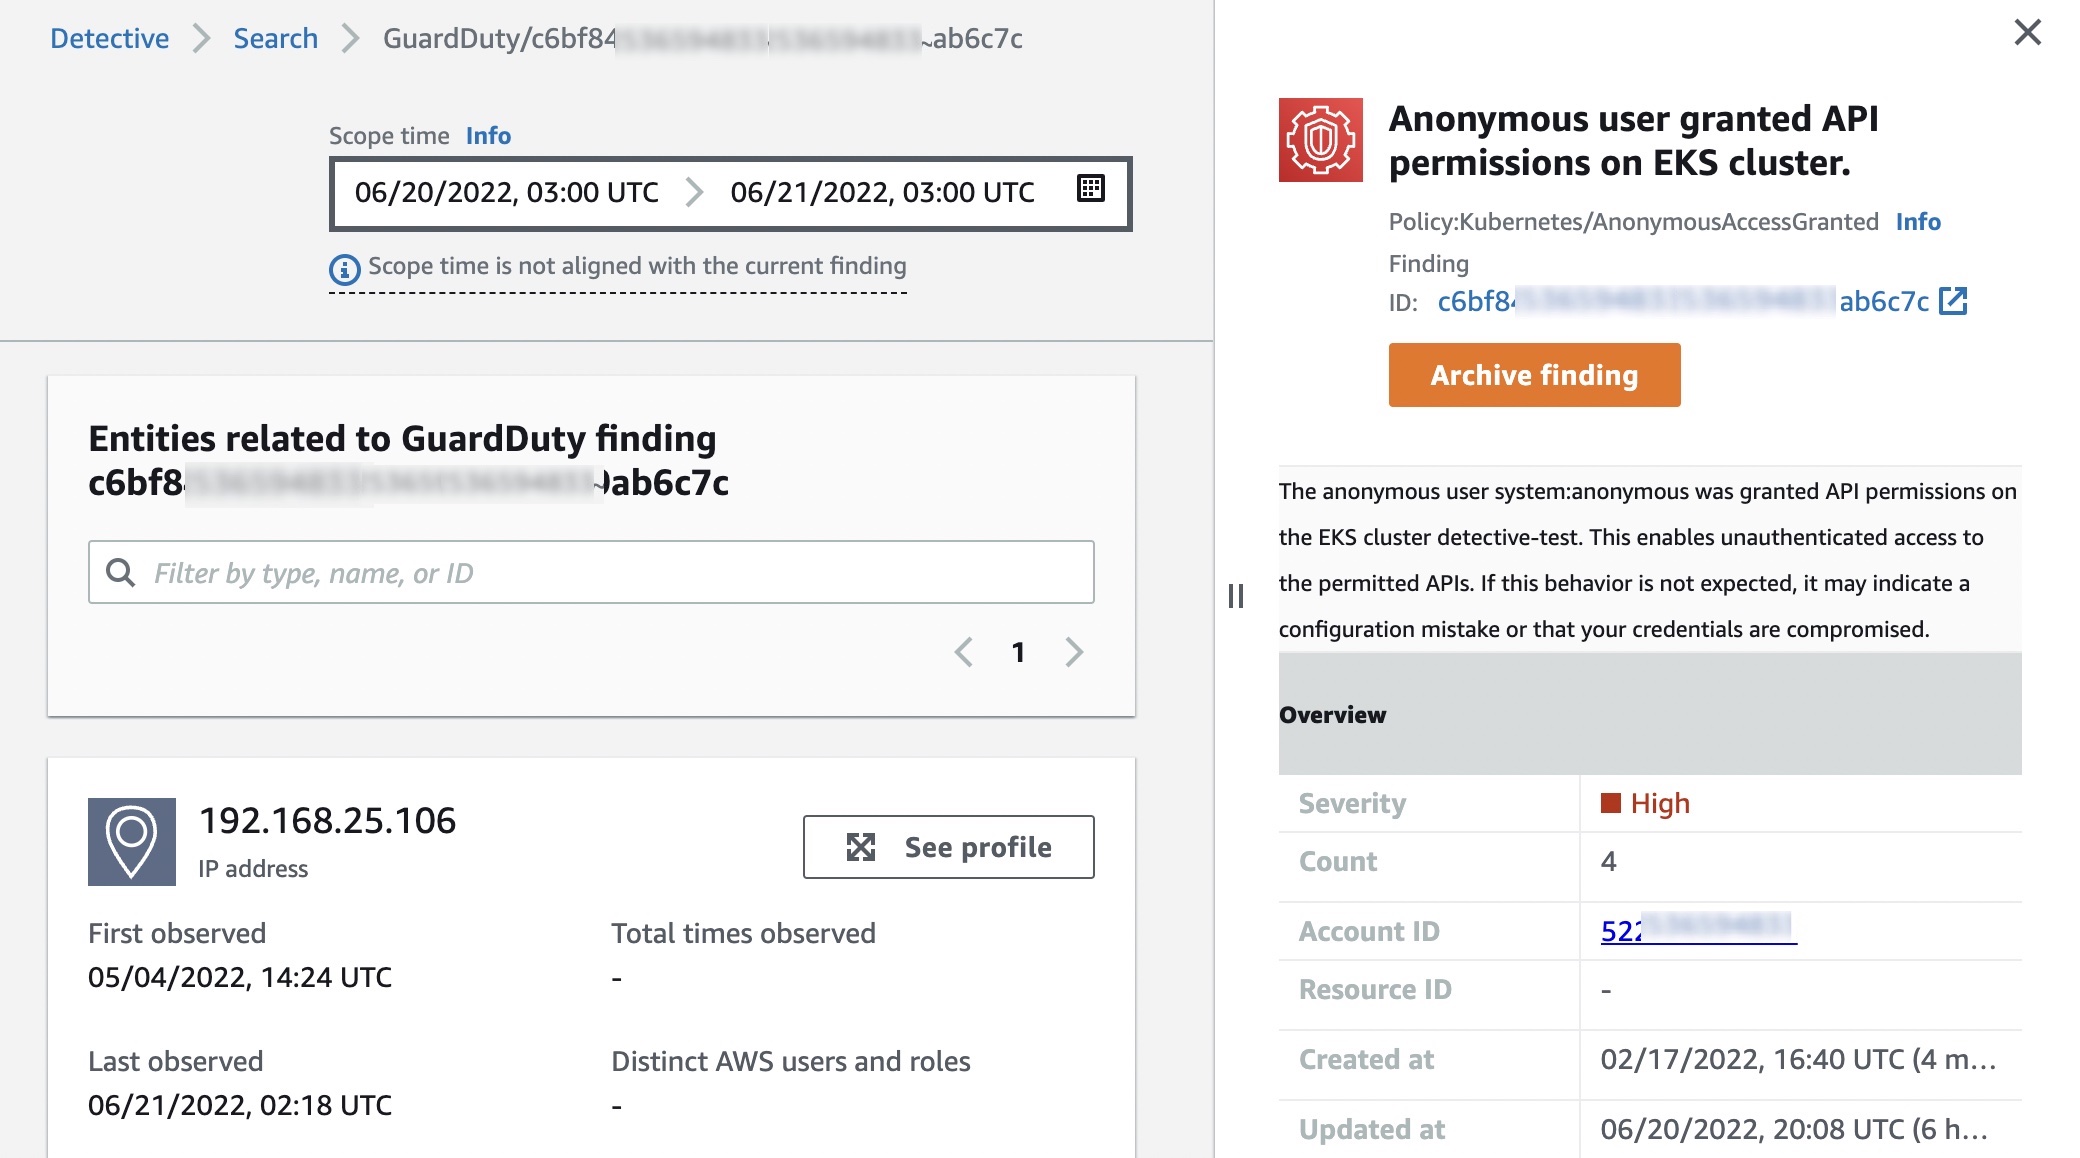
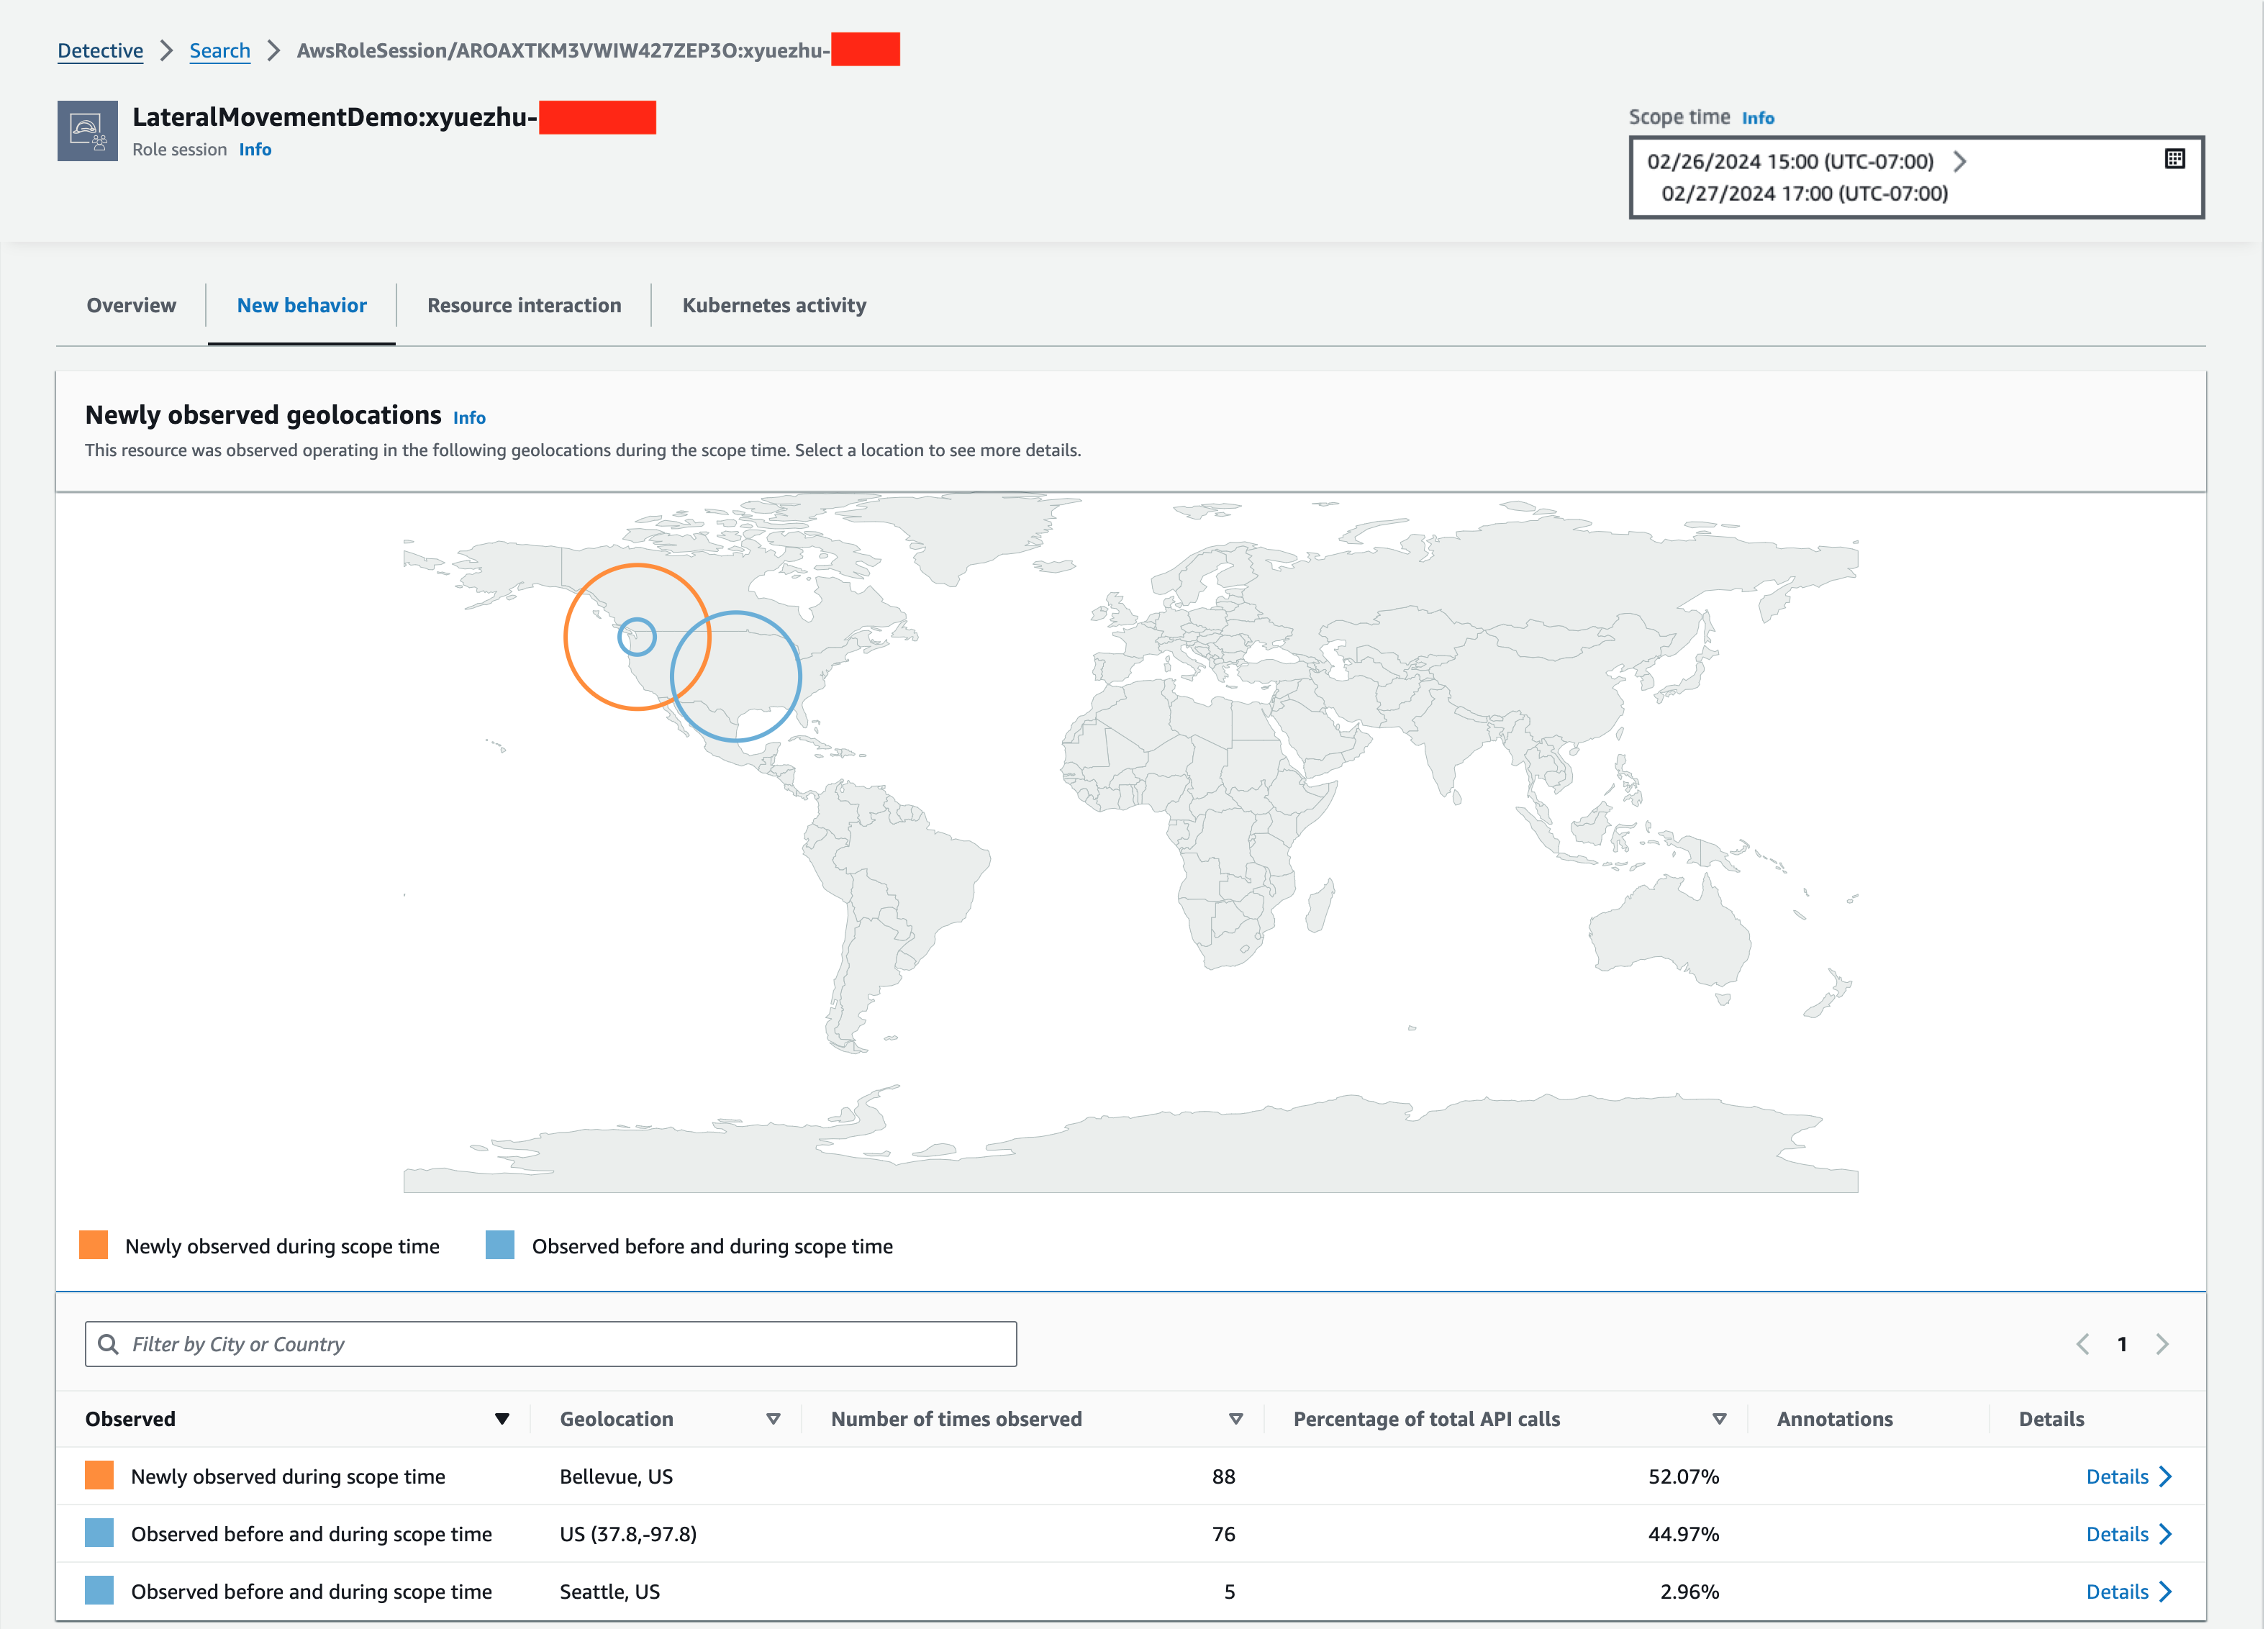
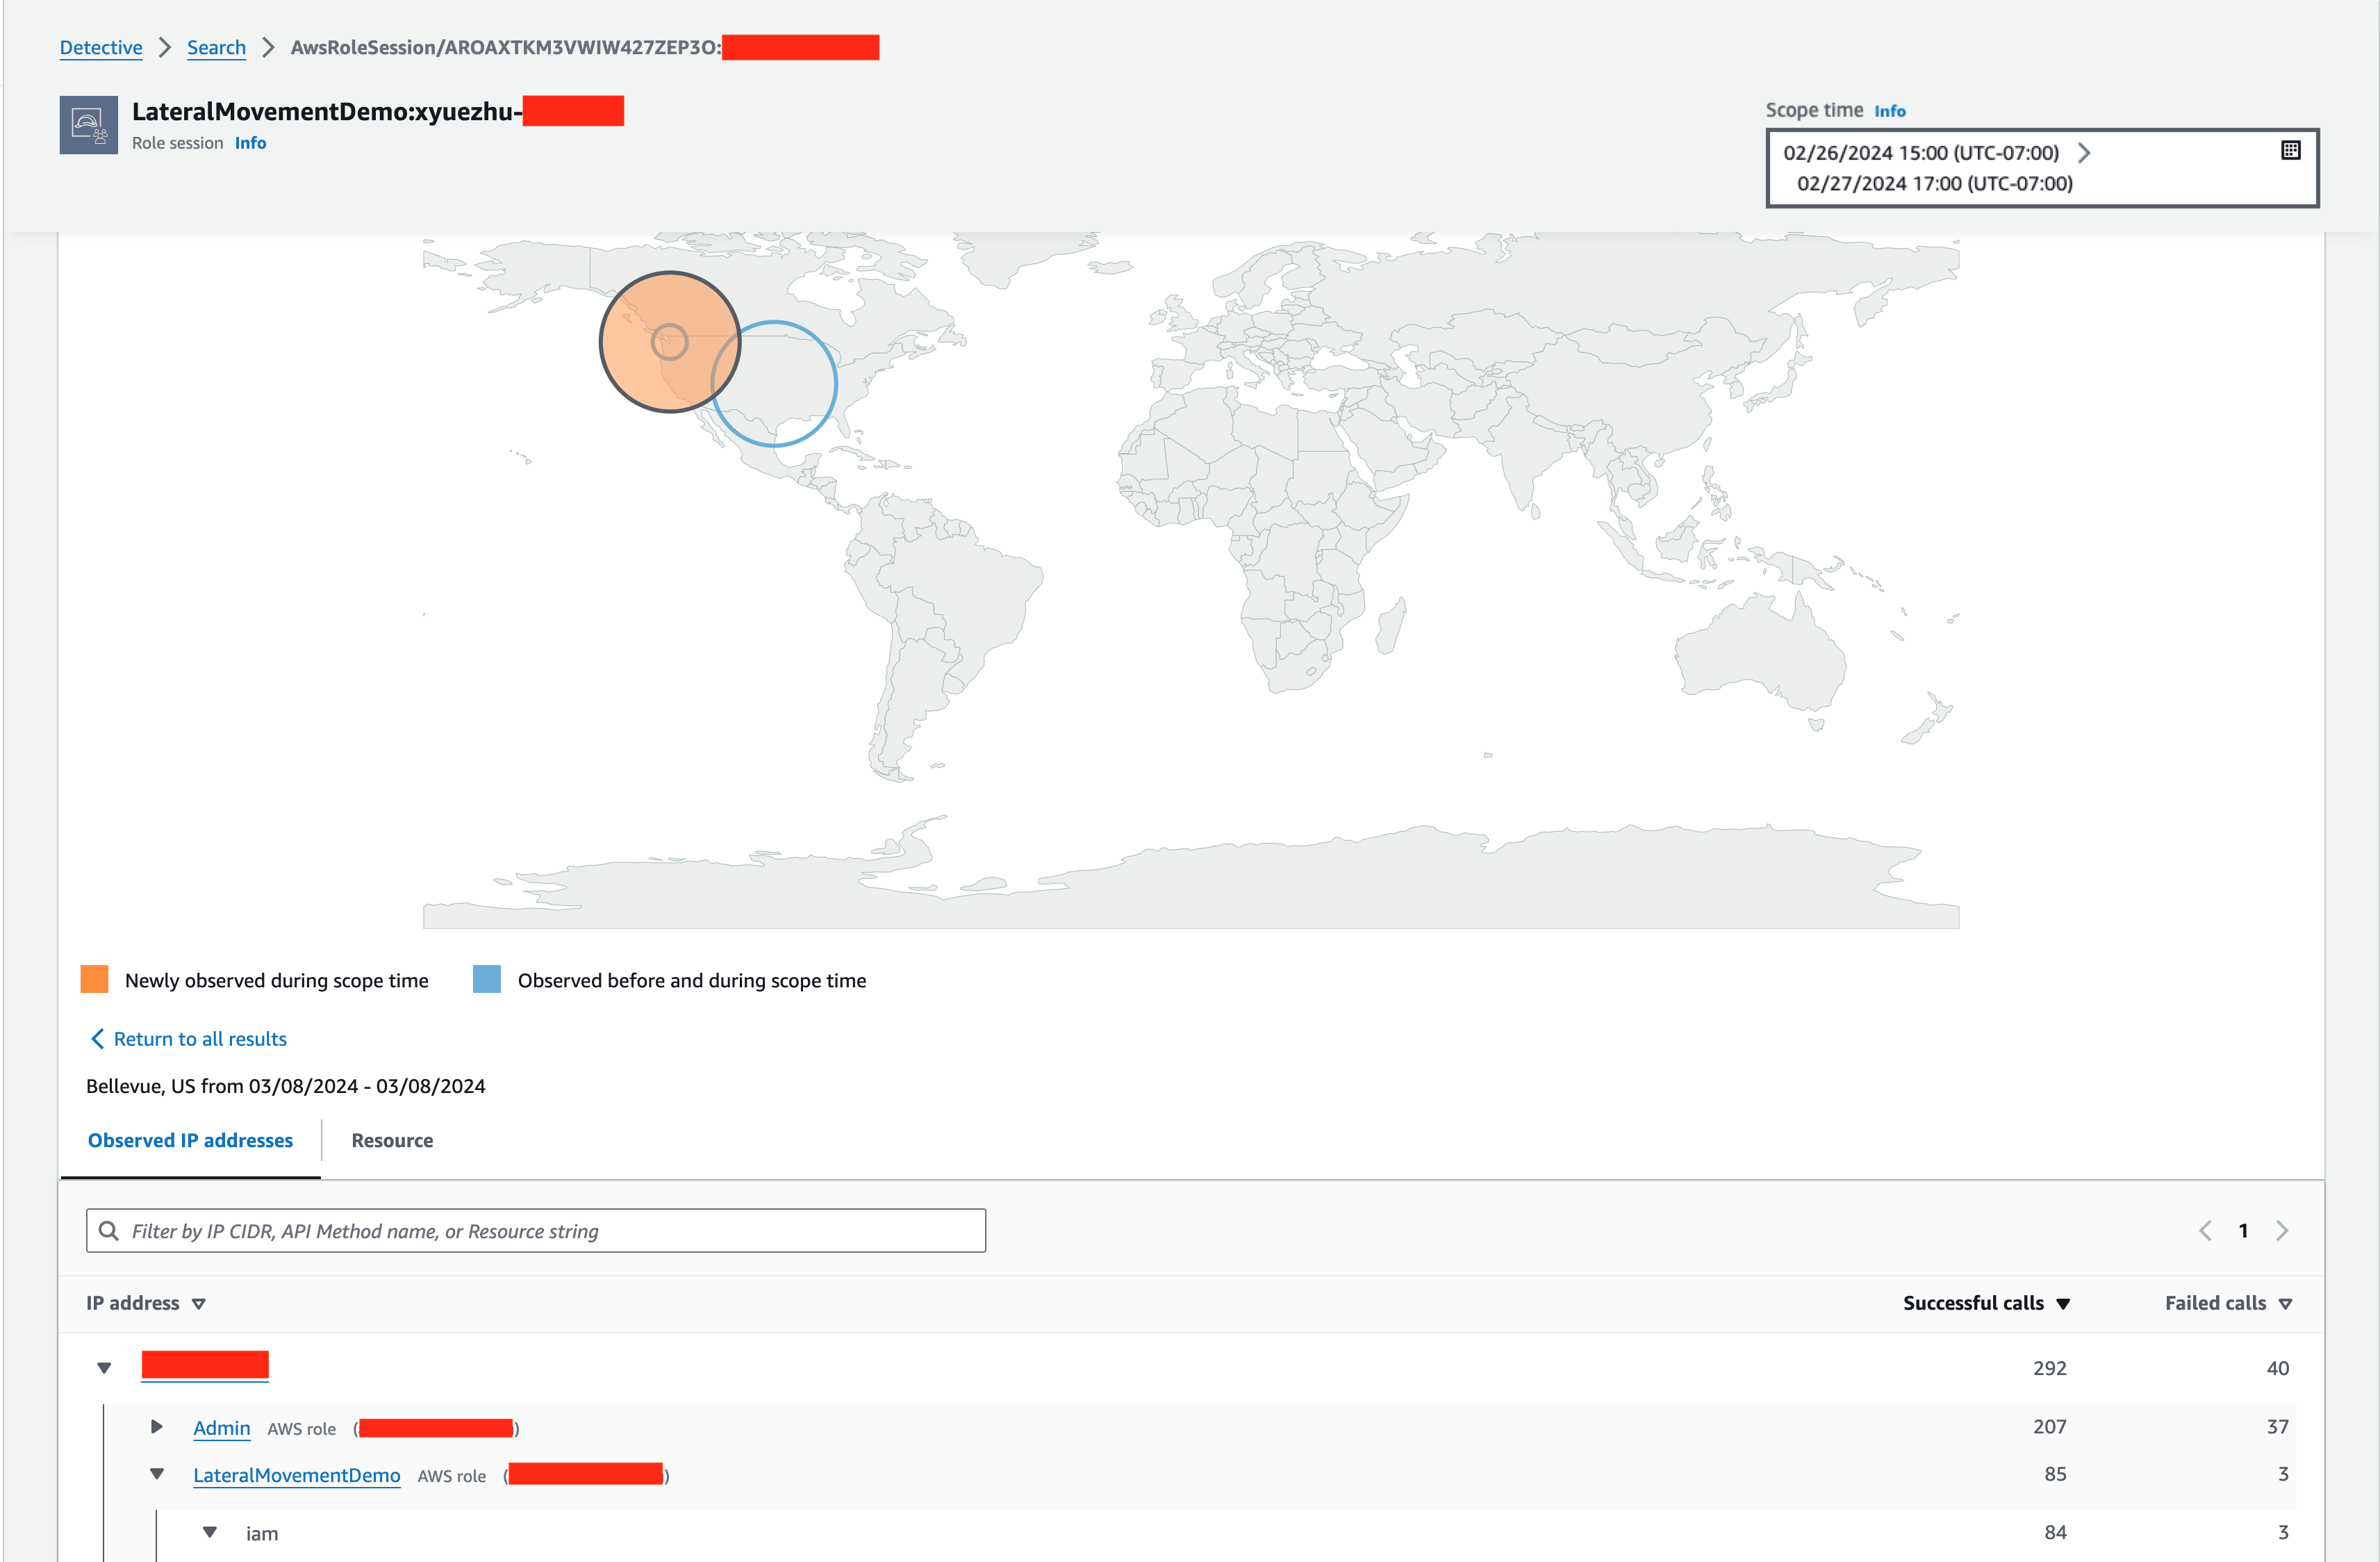
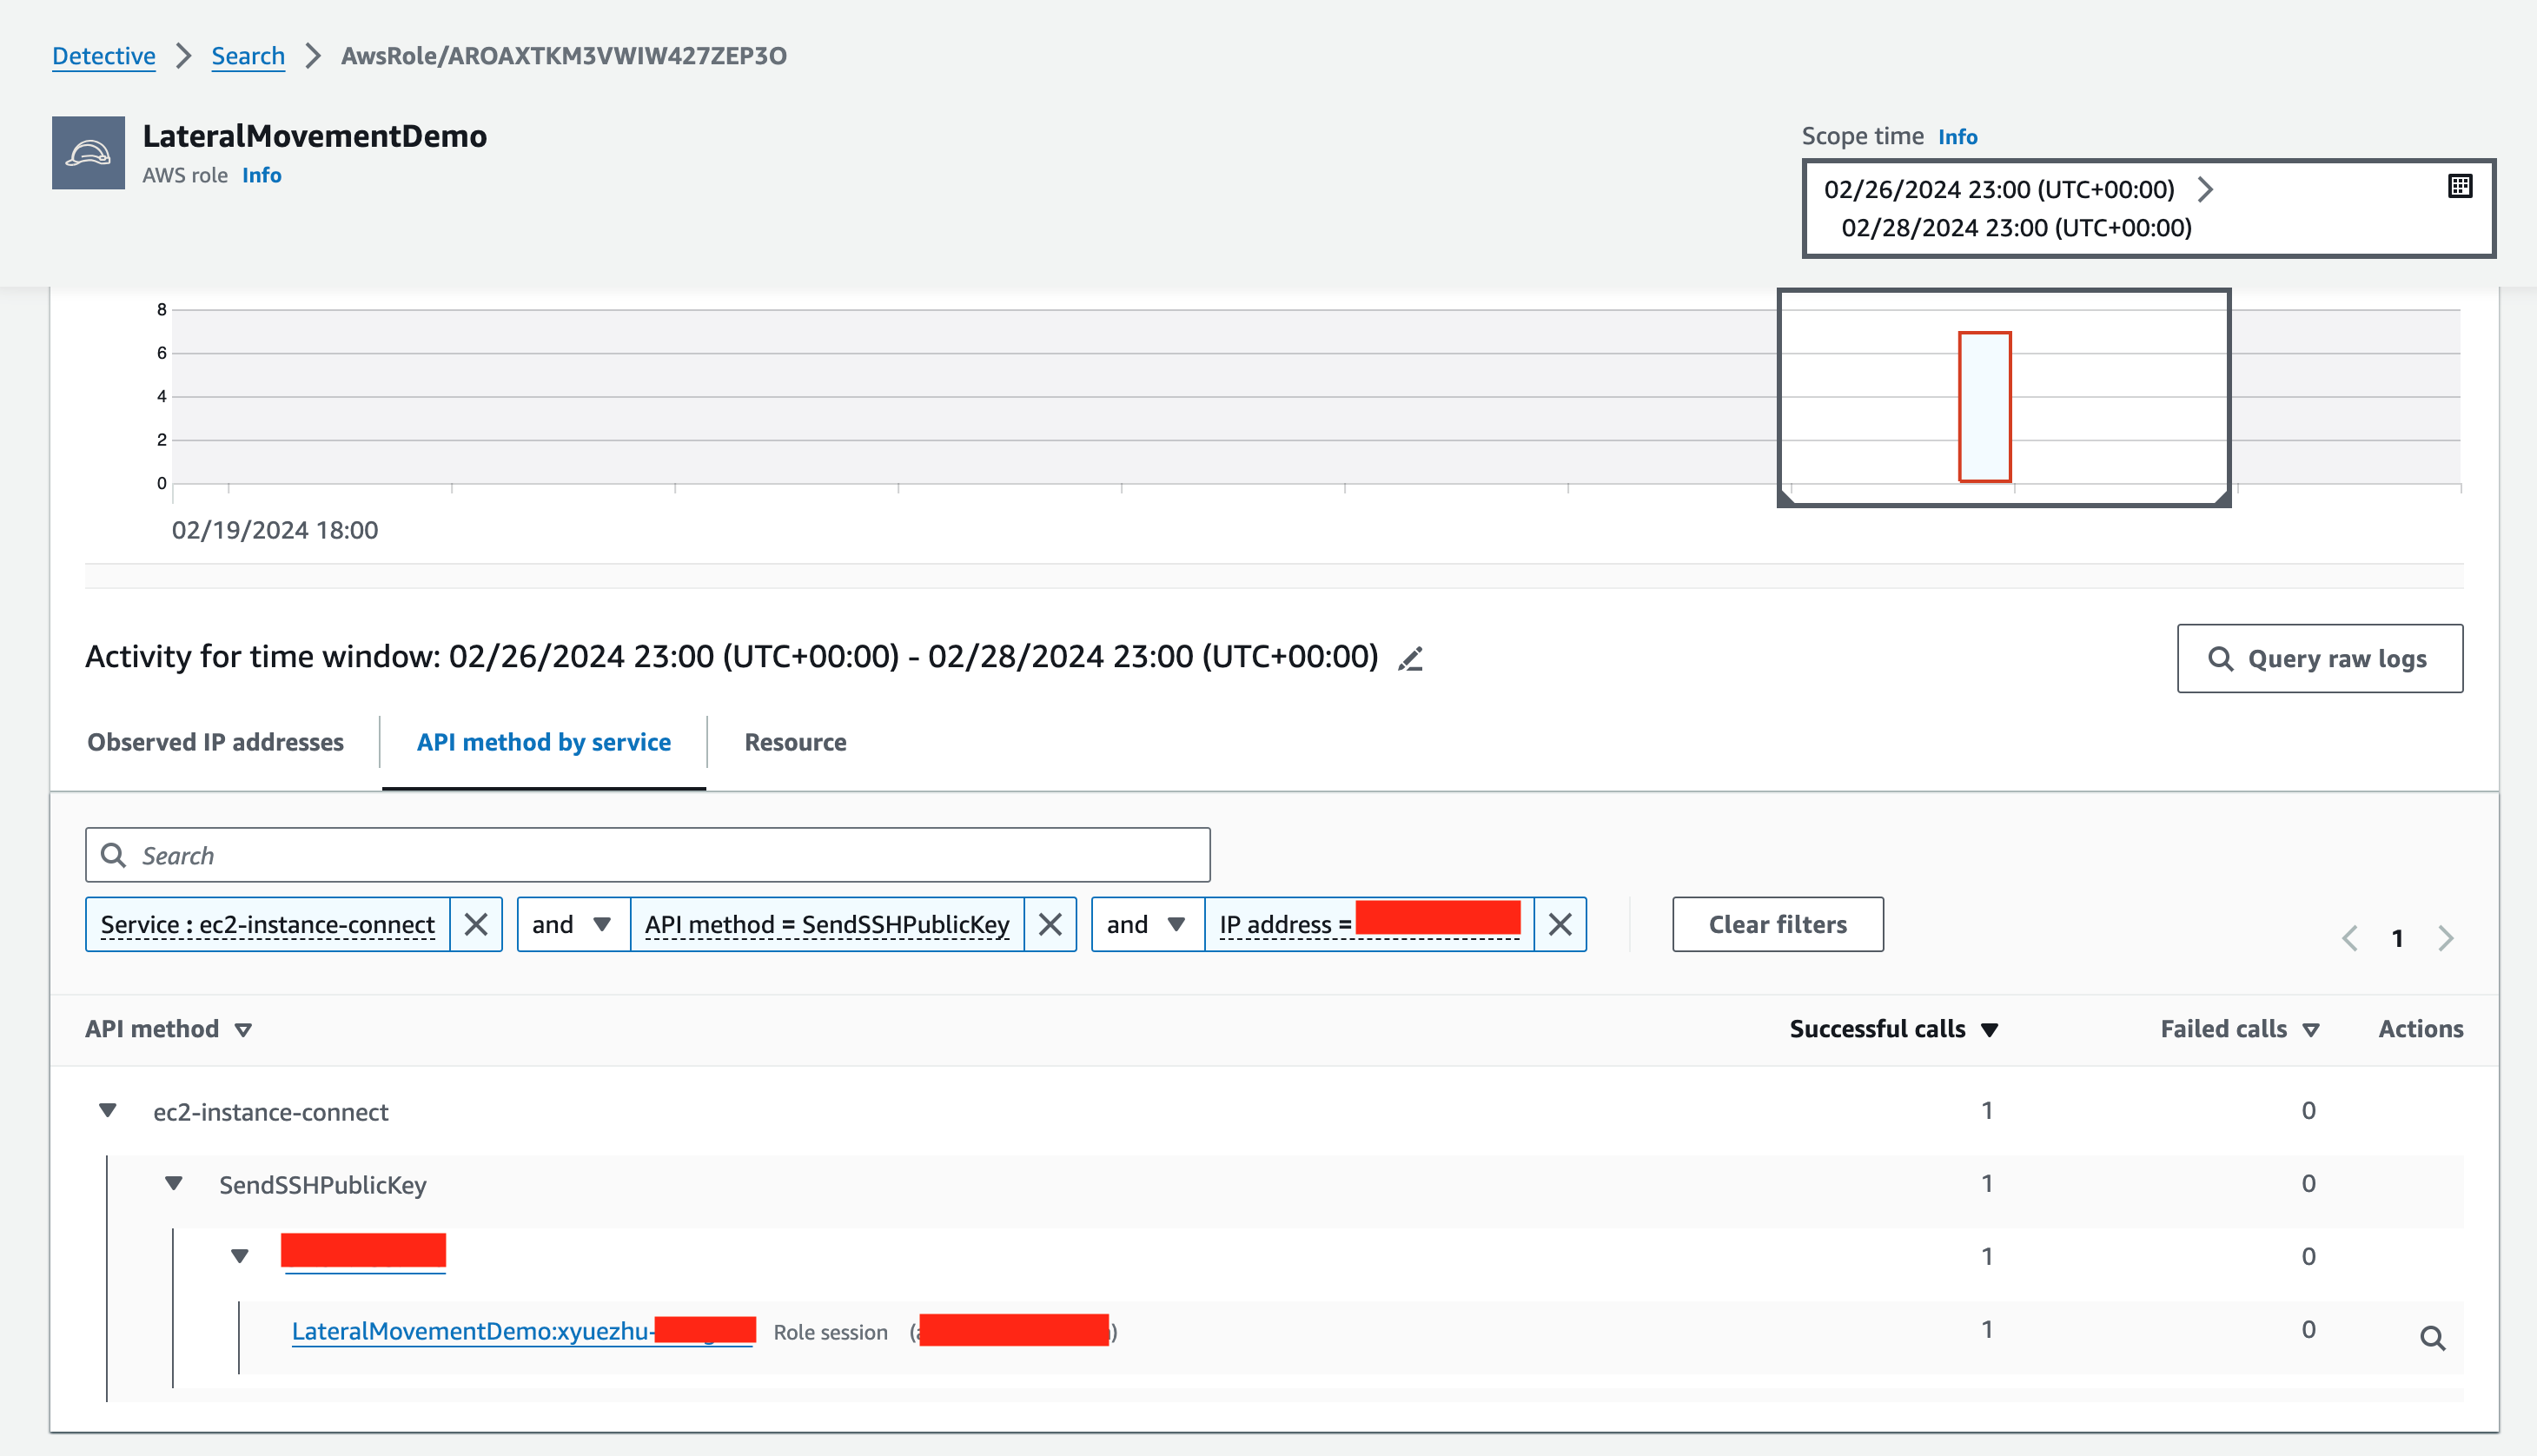
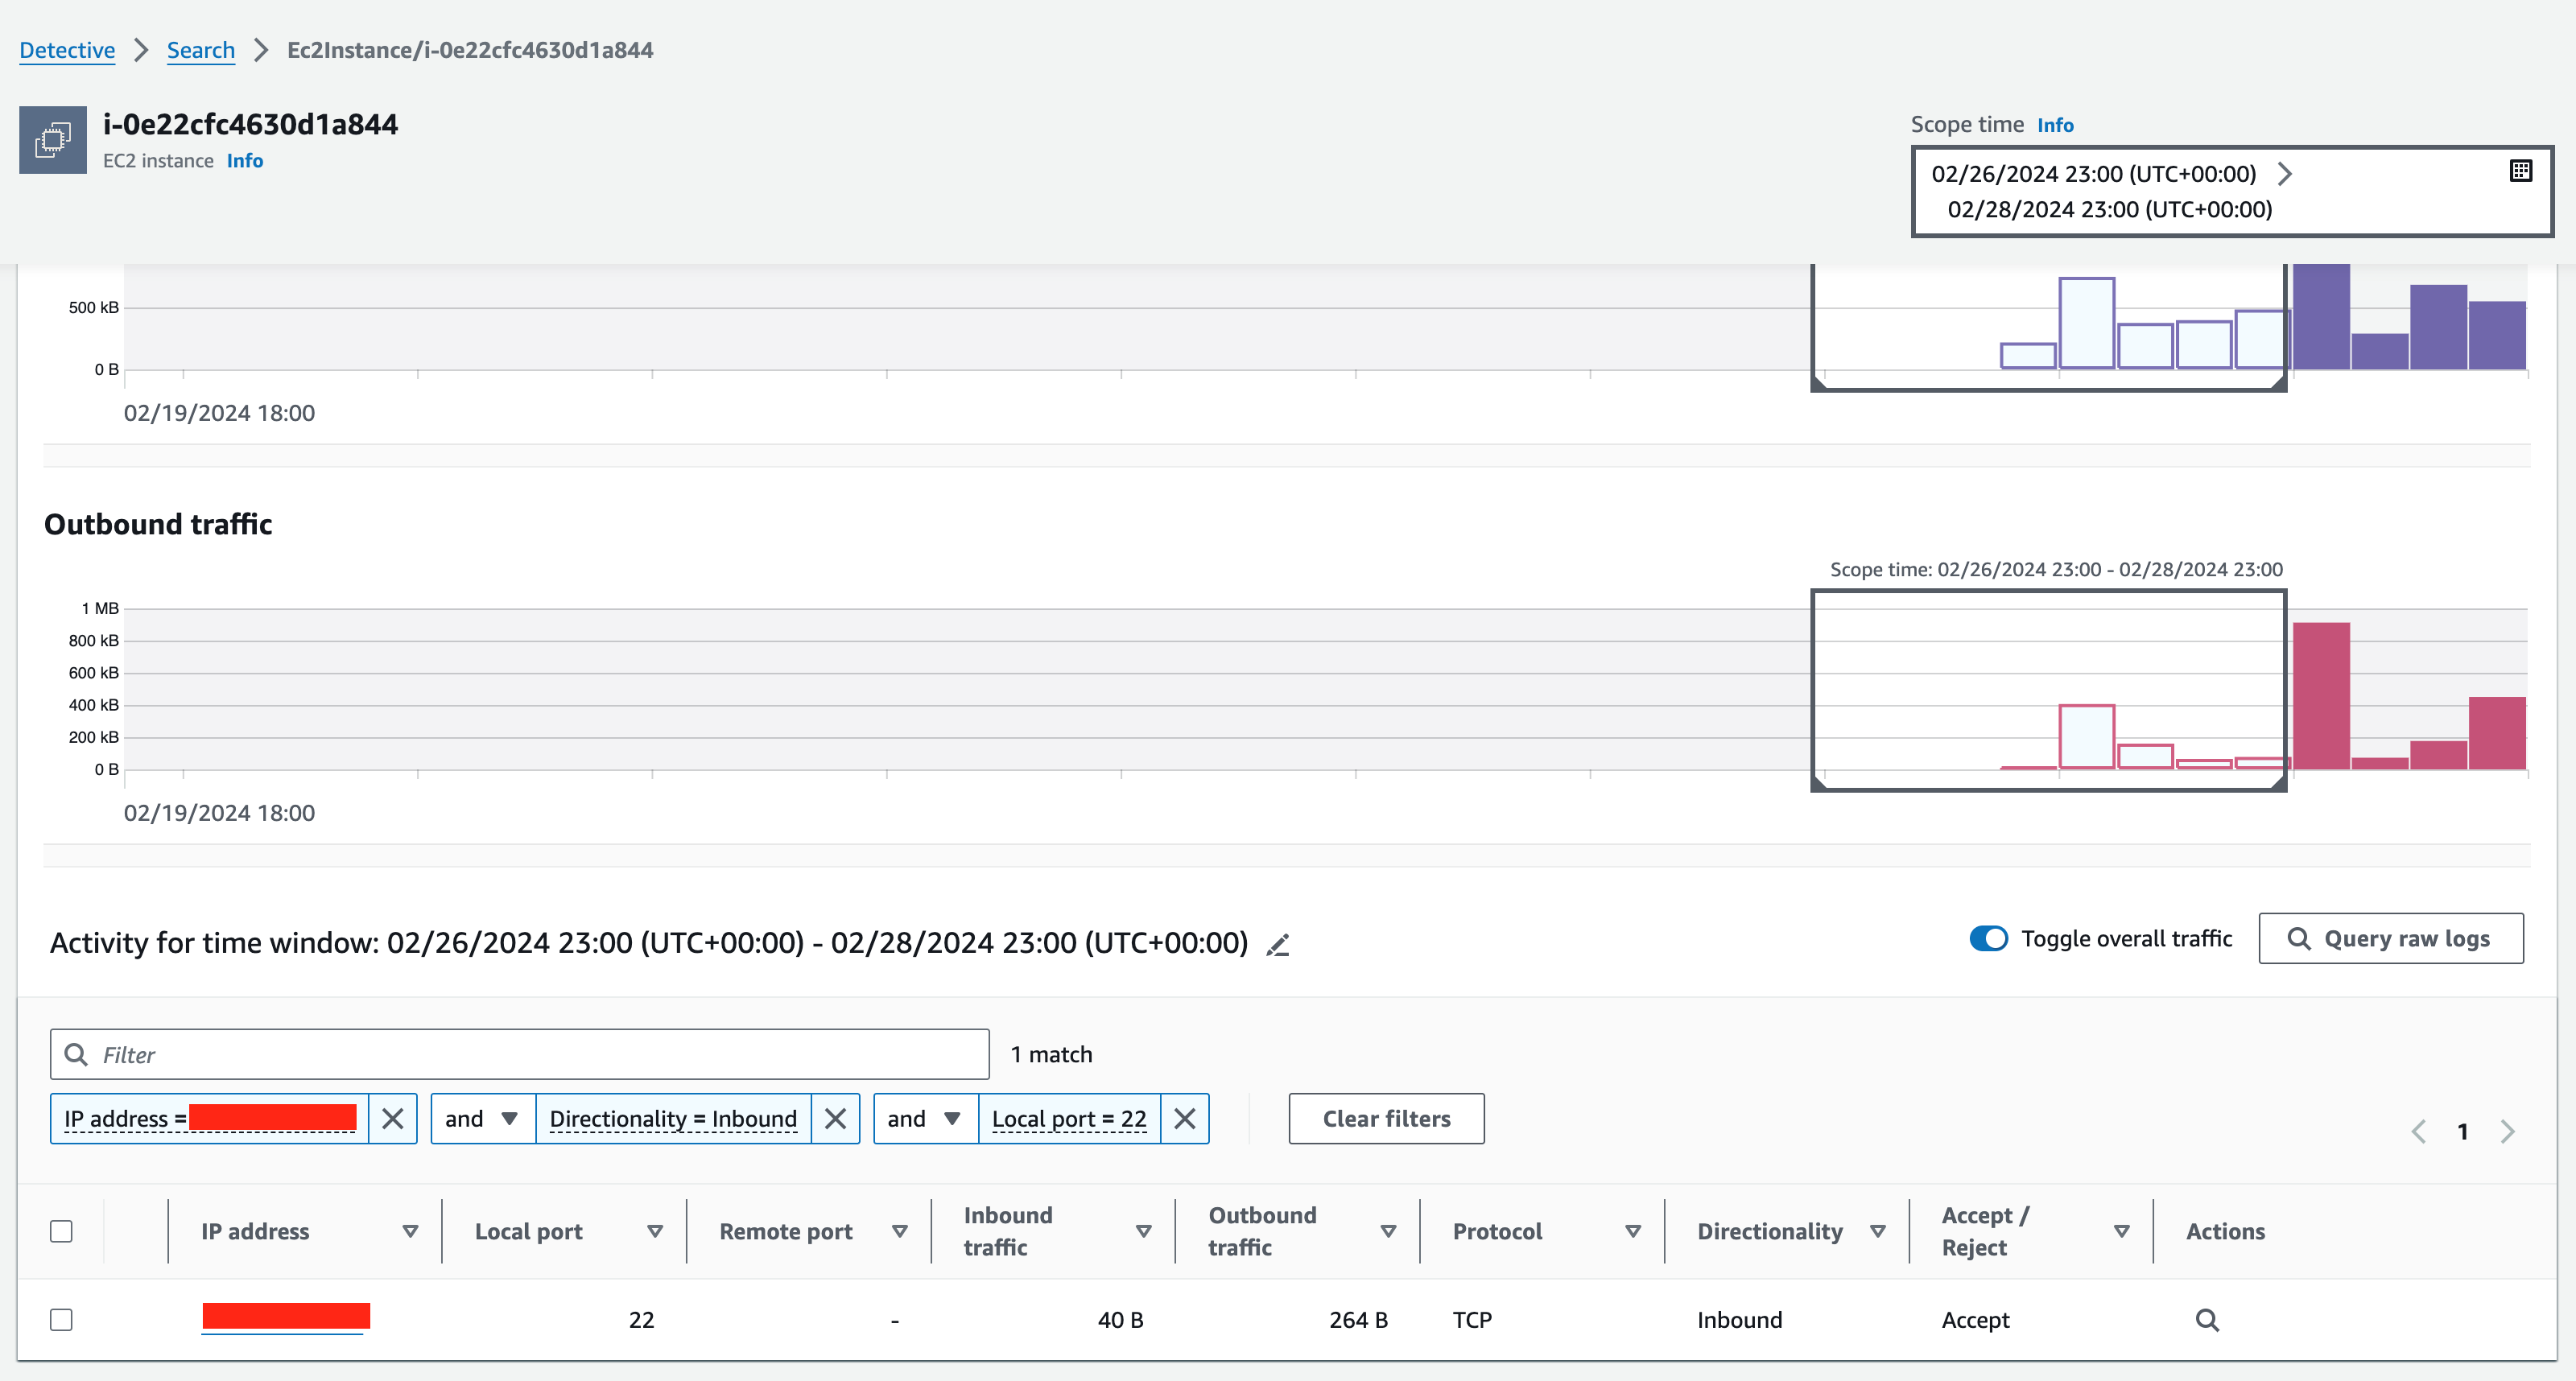
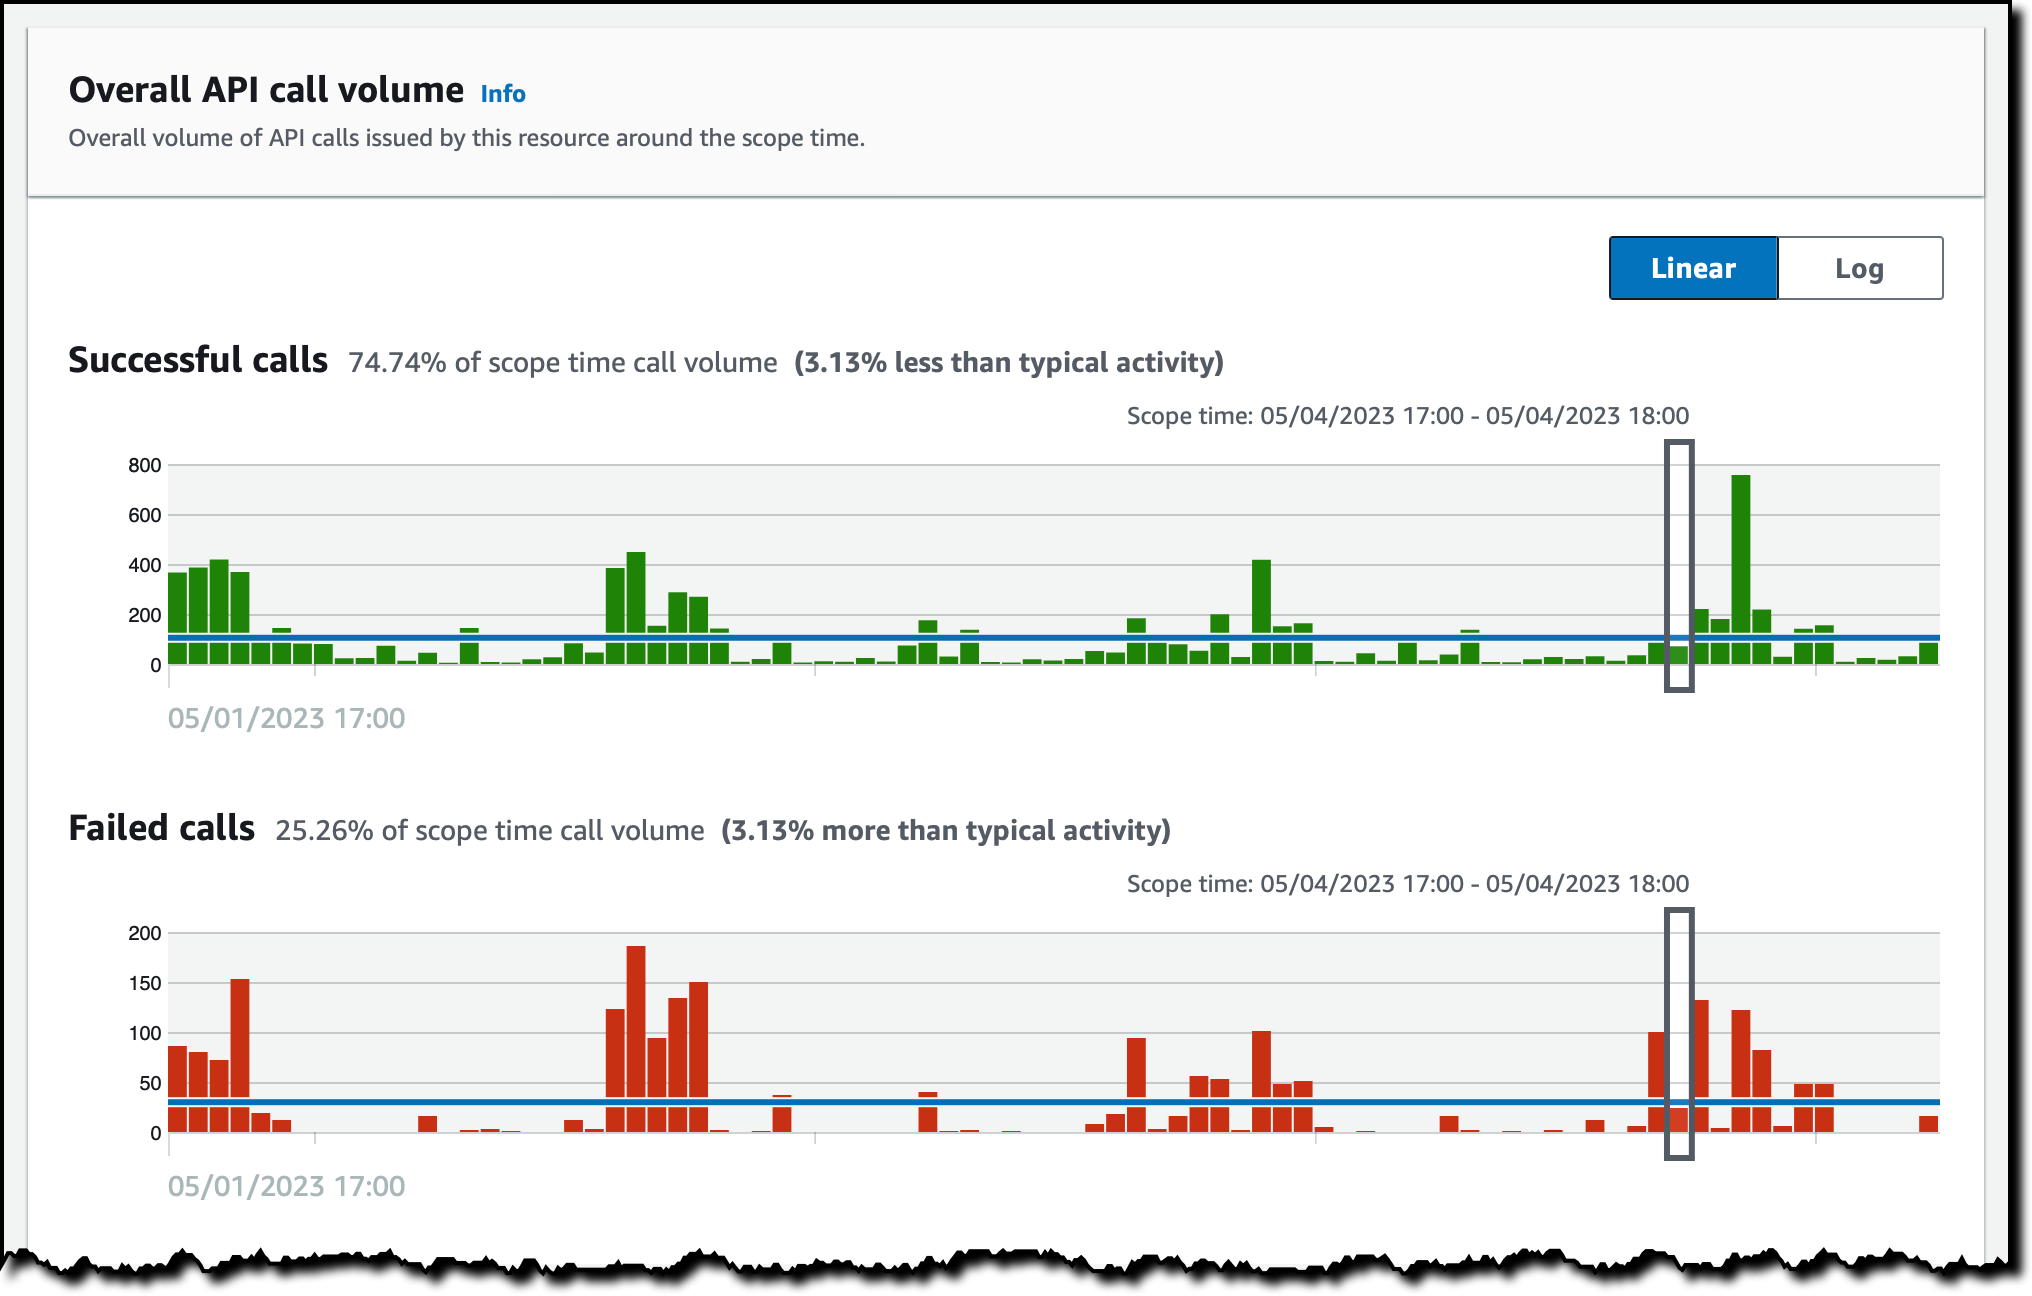
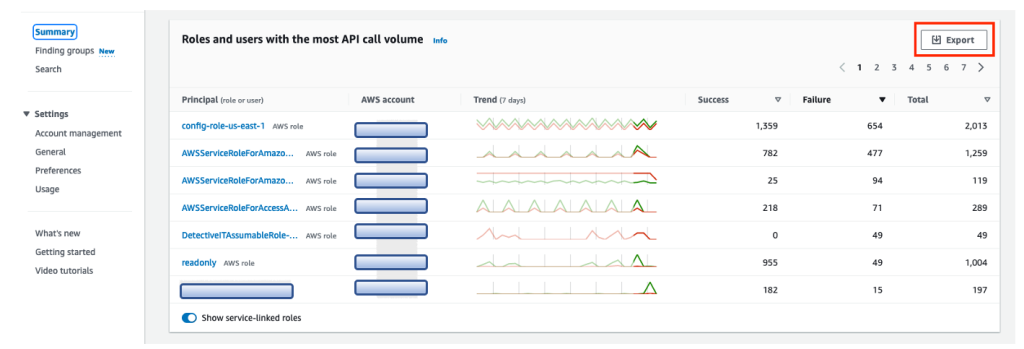
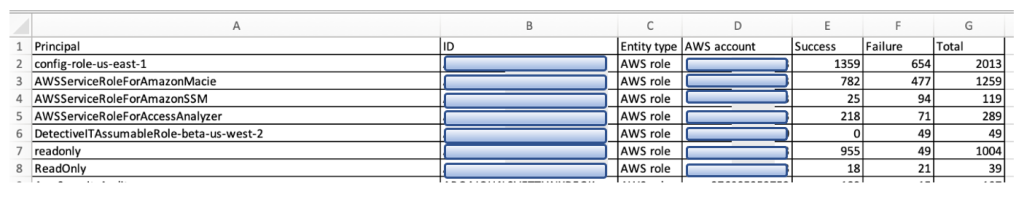
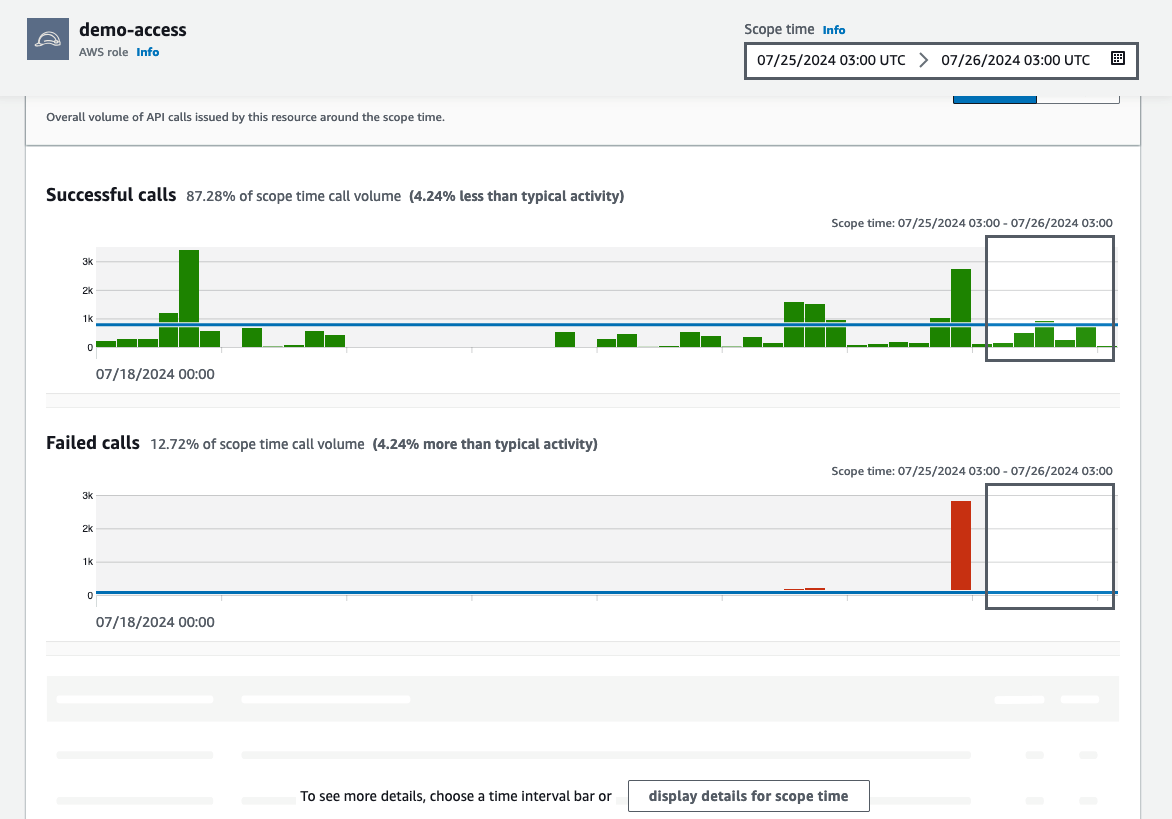 Figure 12: Overall API call volume during the specified scope time


 AWS and Hugging Face collaborate to make generative AI more accessible and cost-efficient – This previous week, we announced an expanded collaboration between AWS and
 AWS Pi Day – Join me on March 14 for the third annual