Every new domain, application, website, or API endpoint increases an organization’s attack surface. For many teams, the speed of innovation and deployment outpaces their ability to catalog and protect these assets, often resulting in a “target-rich, resource-poor” environment where unmanaged infrastructure becomes an easy entry point for attackers.
Replacing manual, point-in-time audits with automated security posture visibility is critical to growing your Internet presence safely. That’s why we are happy to announce a planned integration that will enable the continuous discovery, monitoring and remediation of Internet-facing blind spots directly in the Cloudflare dashboard: Mastercard’s RiskRecon attack surface intelligence capabilities.
Information Security practitioners in pay-as-you-go and Enterprise accounts will be able to preview the integration in the third quarter of 2026.
Attack surface intelligence can spot security gaps before attackers do
Mastercard’s RiskRecon attack surface intelligence identifies and prioritizes external vulnerabilities by mapping an organization’s entire internet footprint using only publicly accessible data. As an outside-in scanner, the solution can be deployed instantly to uncover “shadow IT,” forgotten subdomains, and unauthorized cloud servers that internal, credentialed scans often miss. By seeing what an attacker sees in real time, security teams can proactively close security gaps before they can be exploited.
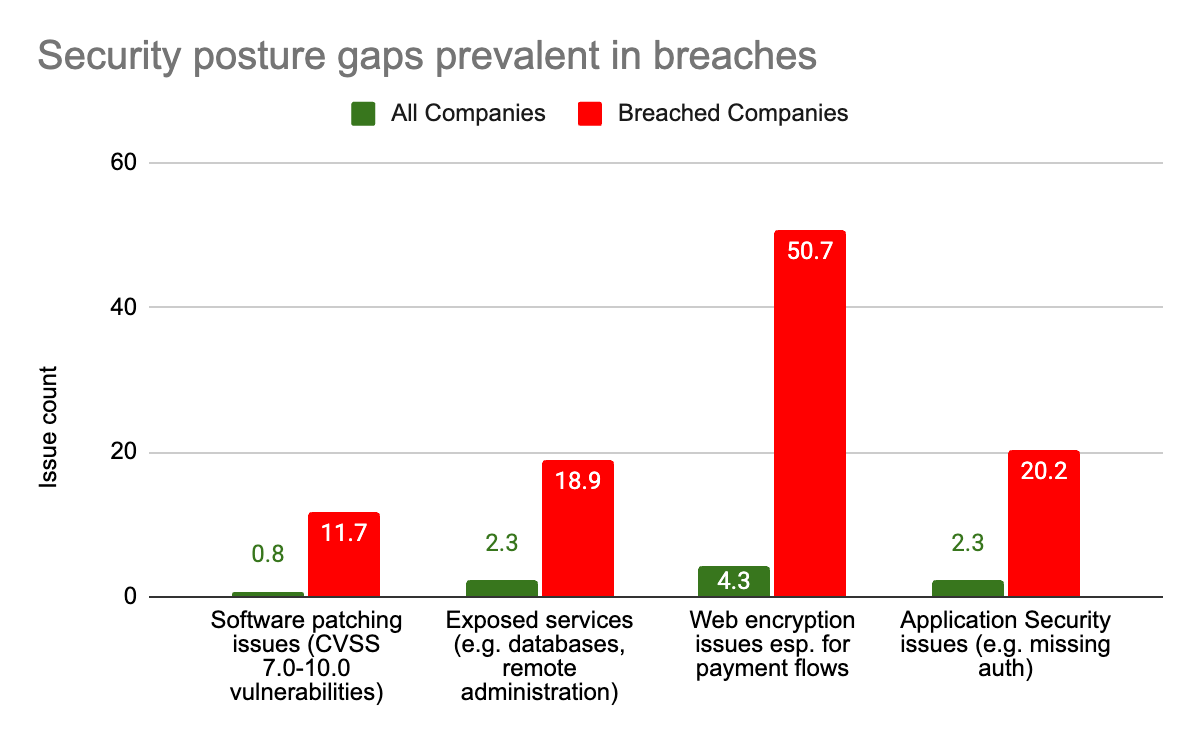
But what security gaps are attackers typically looking to exploit? In a 2025 study of 15,896 organizations that had experienced security breaches, Mastercard found that unpatched software, exposed services (e.g. databases, remote administration), weak application security (e.g. missing authentication) and outdated web encryption were frequent hallmarks, as seen in the graph below.
The same study also found that organizations with significant cybersecurity posture gaps in these areas were 5.3x more likely to be hit by a ransomware attack, and 3.6x more likely to suffer a data breach compared to companies that maintain good cybersecurity hygiene.
Why Cloudflare and Mastercard are partnering
This partnership combines Mastercard’s attack surface intelligence—which identifies security gaps—with Cloudflare’s ability to fix them. Organizations can use Mastercard’s data to find shadow assets, such as forgotten domains or unprotected cloud instances, and secure them by routing traffic through Cloudflare’s proxy. This allows for the immediate deployment of security controls without changing the underlying website or application.
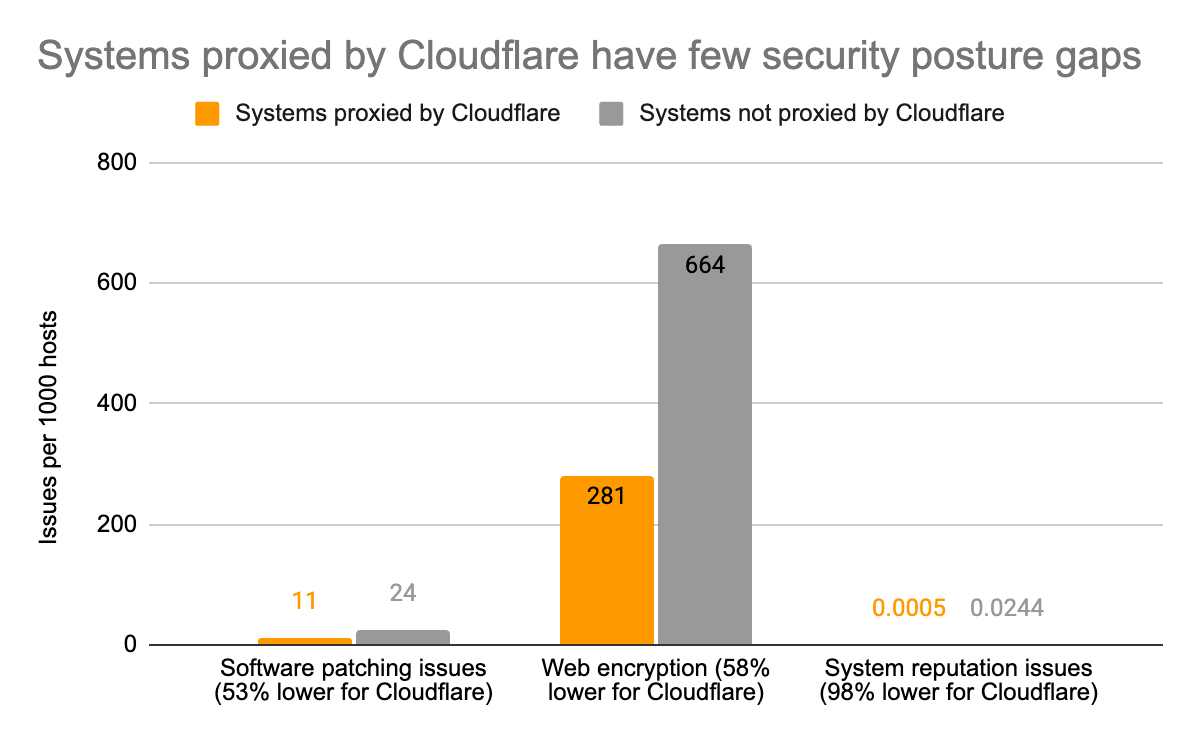
Based on a sample of approximately 388,000 organizations spanning over 18 million systems, Mastercard’s attack surface intelligence shows that systems using Cloudflare as a proxy have significantly better security hygiene than those that do not:
System Reputation: 98% fewer instances of malicious behavior (e.g. communicating with botnet command and control servers, hosting phishing sites).
The table below provides additional details on the security posture insights provided by Mastercard. These insights are generated by passively scanning publicly accessible hosts, web applications, and configurations.
Category
Security Check
Description
Software Patching
Application Servers
Unpatched application server software.
OpenSSL
Unpatched OpenSSL.
CMS Patching
Unpatched content management system software.
Web Servers
Unpatched webserver software.
Application Security
CMS Authentication
Enumeration of content management system administration interfaces publicly exposed to the internet.
High Value System Encryption
Enumeration of systems that collect sensitive data that do not have encryption implemented.
Malicious Code
Enumeration of systems containing malicious code (Magecart).
Web Encryption
Certificate Expiration Date
SSL certificate expired.
Certificate Valid Date
SSL certificate valid date not yet valid.
Encryption Hash Algorithm
Weak SSL encryption hash algorithm.
Encryption Key Length
Weak SSL encryption key length.
Certificate Subject
Invalid SSL certificate subject.
Exposed Services / Network Filtering
Unsafe Network Services
Enumeration of unsafe network services running on the system such as databases (e.g. SQL Server, PostgreSQL) and remote access services (e.g. RDP, VNC).
IoT Devices
Enumeration of IoT devices such as printers, embedded system interfaces, etc.
Comprehensive domain discovery, continuous posture visibility, and remediation
Cloudflare Security Insights in Cloudflare’s Application Security suite currently identifies risks—such as DNS misconfigurations, weak web encryption, or inactive WAF rules—for any domain already proxied by Cloudflare. However, a significant security gap remains: you cannot protect domains you don’t know exist.
The integration with Mastercard will eliminate these blind spots. By continuously profiling the Internet footprint of over 12 million organizations, Mastercard identifies domains, hosts, and software stacks associated with your company, even if they aren’t yet behind a Cloudflare proxy. This will allow Security Insights to surface shadow IT and unprotected hosts, enabling you to secure them with Cloudflare’s WAF and DDoS protection.
Visibility is only the first step; understanding the criticality of discovered assets is what allows security teams to prioritize findings. Each host is assigned a criticality level:
High Criticality: Assigned to hosts that collect sensitive data, require authentication, or run sensitive network services like database listeners or remote access.
Medium Criticality: Assigned to hosts running brochure websites that are adjacent to high-criticality systems, such as those residing on the same class-C network.
Low Criticality: Assigned to hosts running brochure websites that are not adjacent to any critical systems.
Below is a fictitious example of an organization with many domains that they are unaware of. Of these discovered domains, only one is currently proxied by Cloudflare. Within Security Insights, you will be able to visualize this level of detail for shadow domains and hosts.
Example of shadow domains and unprotected hosts associated with an organization
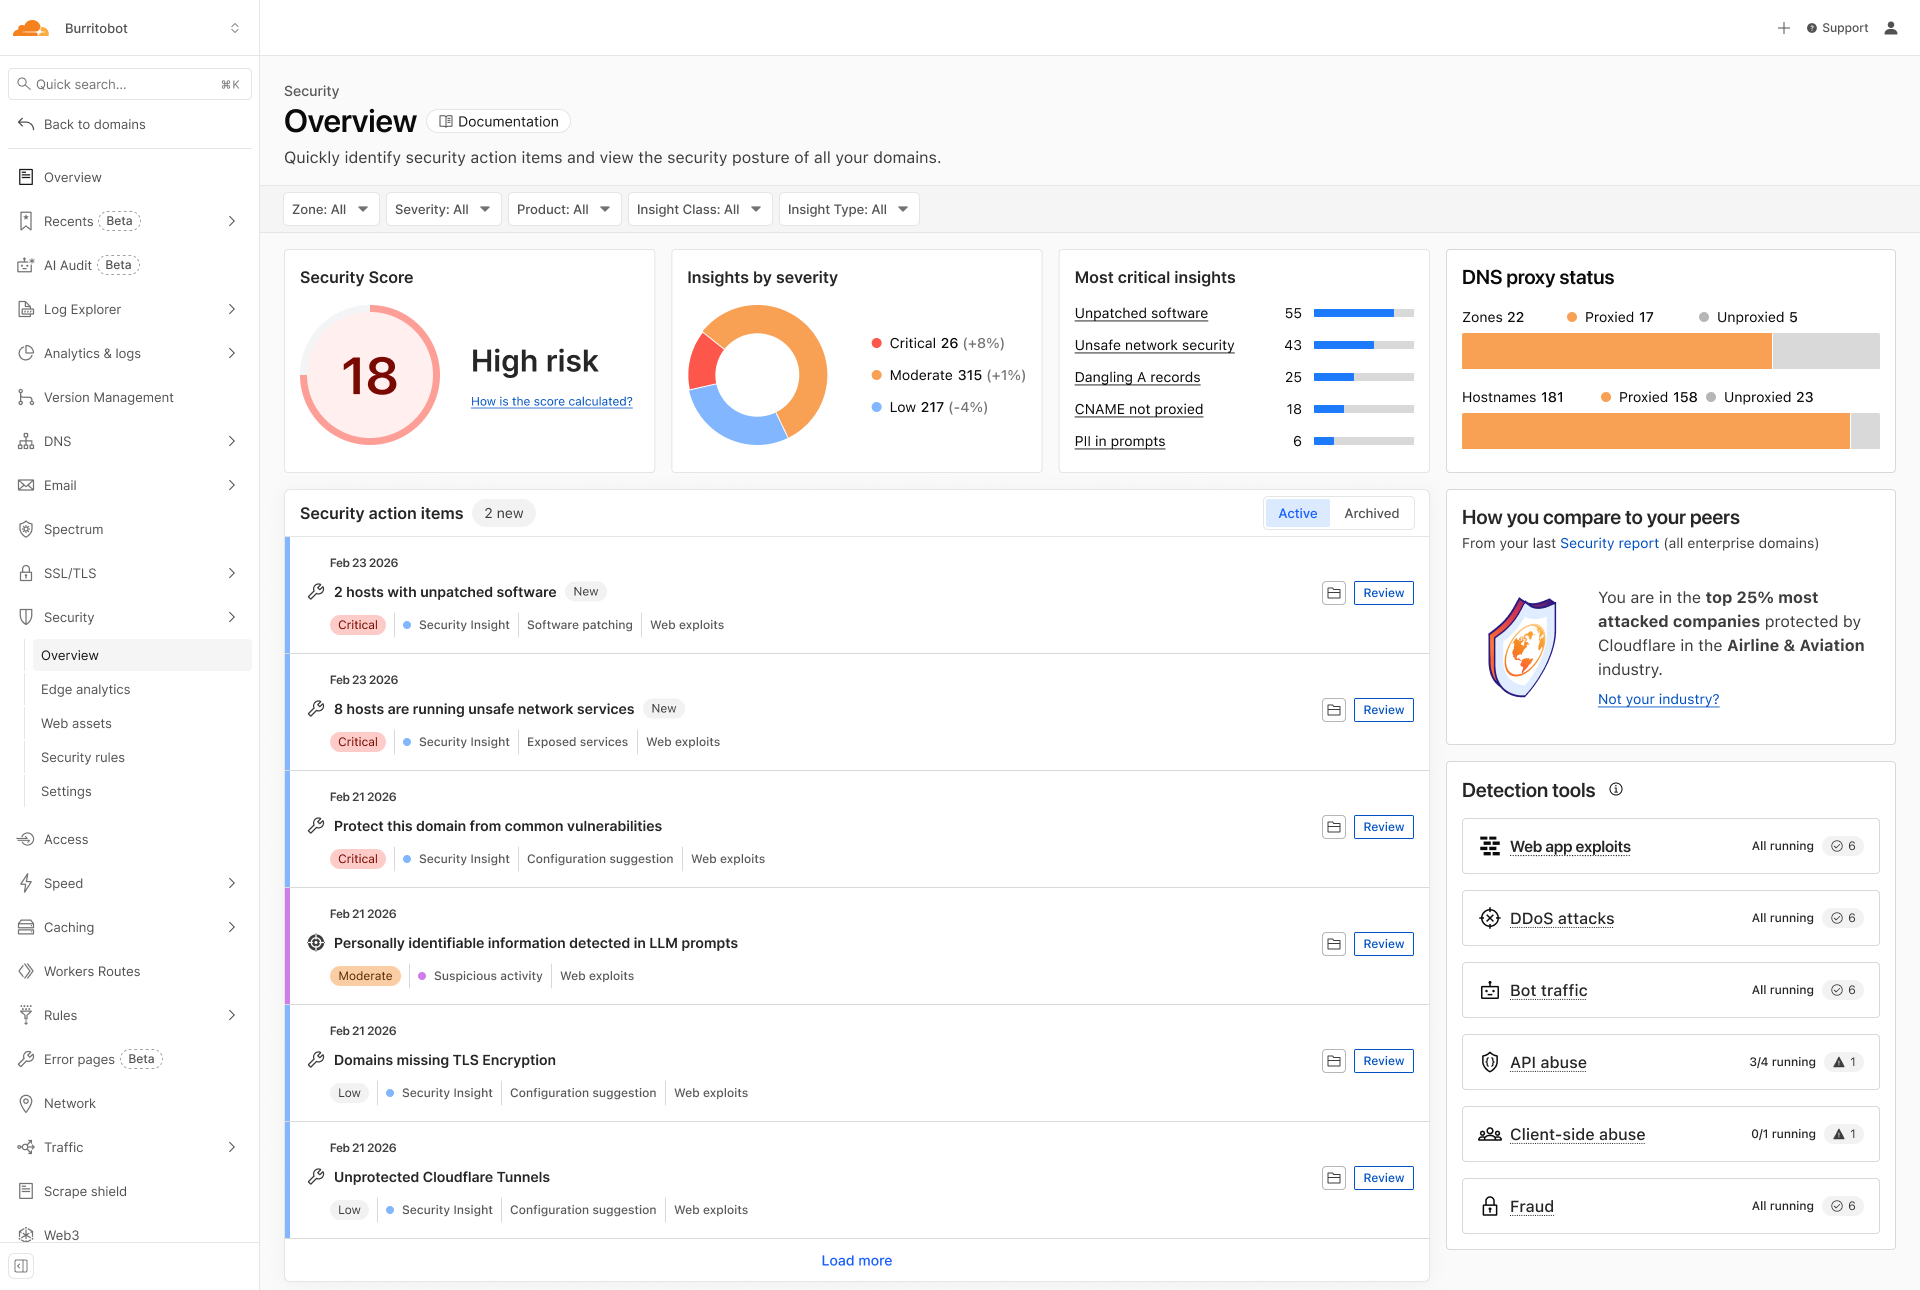
Mastercard will also allow continuous visibility into the security posture of Internet-facing systems including in areas like software patching, exposed network services (e.g., databases, remote access) and application security (e.g., unauthenticated CMSes) — complementing Cloudflare Security Insights, as shown below.
Security Insights dashboard with shadow domains, unproxied hosts, and posture findings
Theseinsights are only useful if they lead to action. Instead of just telling you that a domain or host is at risk, Cloudflare Security Insights will guide you to fixing them. Possible steps include enabling a Cloudflare proxy (and by extension DDoS and bot protection for shadow zones and hosts), enabling security controls (such as turning on the Web Application Firewall, or WAF) and enforcing stricter TLS encryption to mitigate the specific risks identified by the scan.
What’s next: updated security insights dashboard
We are currently working on integrating Mastercard’s RiskRecon attack surface intelligence into the Cloudflare Security Insights dashboard to provide immediate visibility into shadow domains, unprotected hosts and the posture gaps associated with them.
With an increasing volume of insights, our roadmap also includes risk scoring and building AI-assisted diagnosis paths. That will mean a dashboard that doesn’t just show you an insight, but proposes additional relevant correlations (such as traffic to an unpatched host) and suggests the specific WAF rule or API Shield configuration required to neutralize it.
At 3 AM, a single IP requested a login page. Harmless. But then, across several hosts and paths, the same source began appending ?debug=true — the sign of an attacker probing the environment to assess the technology stack and plan a breach.
Minor misconfigurations, overlooked firewall events, or request anomalies feel harmless on their own. But when these small signals converge, they can explode into security incidents known as “toxic combinations.” These are exploits where an attacker discovers and compounds many minor issues — such as a debug flag left on a web application or an unauthenticated application path — to breach systems or exfiltrate data.
Cloudflare’s network observes requests to your stack, and as a result, has the data to identify these toxic combinations as they form. In this post, we’ll show you how we surface these signals from our application security data. We’ll go over the most common types of toxic combinations and the dangerous vulnerabilities they present. We will also provide details on how you can use this intelligence to identify and address weaknesses in your stack.
How we define toxic combinations
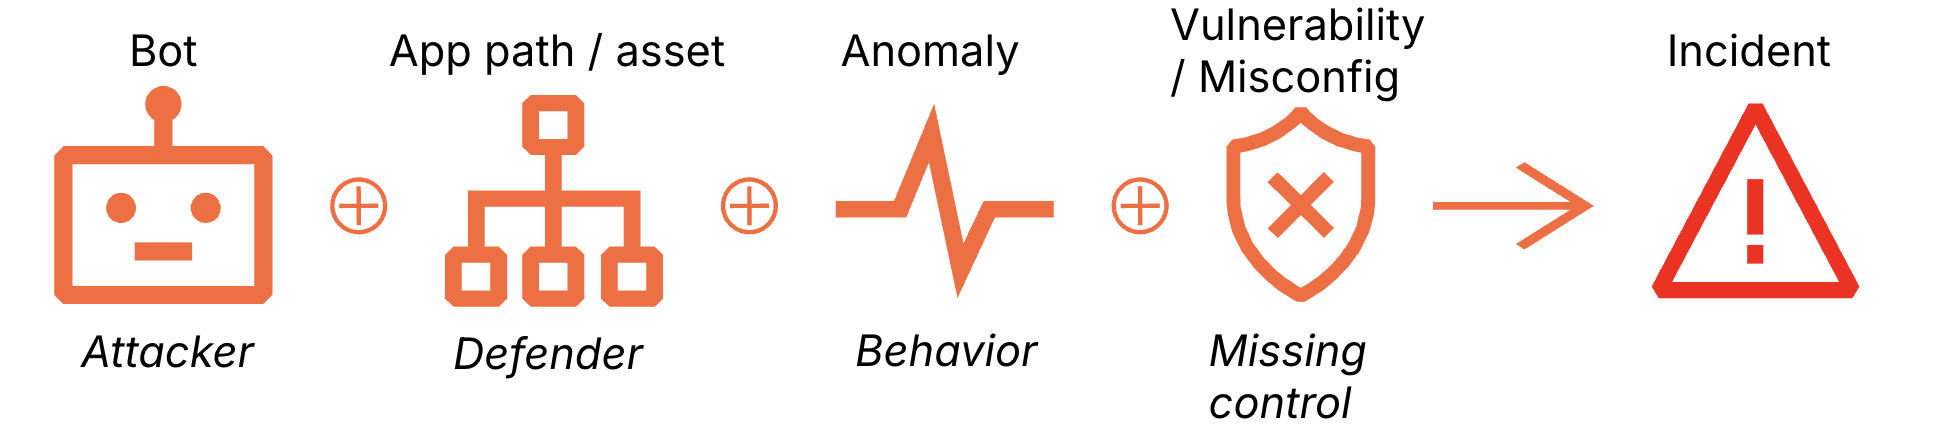
You could define a “toxic combination” in a few different ways, but here is a practical one based on how we look at our own datasets. Most web attacks eventually scale through automation; once an attacker finds a viable exploit, they’ll usually script it into a bot to finish the job. By looking at the intersection of bot traffic, specific application paths, request anomalies and misconfigurations, we can spot a potential breach. We use this framework to reason through millions of requests per second.
While point defenses like Web Application Firewalls (WAF), bot detection, and API protection have evolved to incorporate behavioral patterns and reputation signals, they still primarily focus on evaluating the risk of an individual request. In contrast, Cloudflare’s detections for “toxic combinations” shift the lens toward the broader intent, analyzing the confluence of context surrounding multiple signals to identify a brewing incident.
Toxic combinations as contextualized detections
That shift in perspective matters because many real incidents have no obvious exploit payload, no clean signatures, and no single event that screams “attack.” So, in what follows, we combine the following context to construct several toxic combinations:
Anomalies including: unexpected http codes, geo jumps, identity mismatch, high ID churn, rate-limit evasion (distributed IPs doing the same thing), request or success rate spikes
Vulnerabilities or misconfigurations: missing session cookies or auth headers, predictable identifiers
Examples of toxic combinations on popular application stacks
We looked at a 24-hour window of Cloudflare data to see how often these patterns actually appear in popular application stacks. As shown in the table below, about 11% of the hosts we analyzed were susceptible to these combinations, skewed by vulnerable WordPress websites. Excluding WordPress sites, only 0.25% of hosts show signs of exploitable toxic combinations. While rare, they represent hosts that are vulnerable to compromise.
To make sense of the data, we broke it down into three stages of an attack:
Estimated hosts probed: This is the “wide net.” It counts unique hosts where we saw HTTP requests targeting specific sensitive paths (like /wp-admin).
Estimated hosts filtered by toxic combination: Here, we narrowed the list down to the specific hosts that actually met our criteria for a toxic combination.
Estimated reachable hosts: Unique hosts that responded successfully to an exploit attempt—the “smoking gun” of an attack. A simple 200 OK response (such as one triggered by appending ?debug=true) could be a false positive. We validated paths to filter out noise caused by authenticated paths that require credentials despite the 200 status code, redirects that mask the true exploit path, and origin misconfigurations that serve success codes for unreachable paths.
In the next sections, we’ll dig into the specific findings and the logic behind the combinations that drove them. The detection queries provided are necessary but not sufficient without testing for reachability; it is possible that the findings might be false positives. In some cases, Cloudflare Log Explorer allows these queries to be executed on unsampled Cloudflare logs.
Table 1. Summary of Toxic Combinations
Probing of sensitive administrative endpoints across multiple application hosts
What did we detect?
We observed automated tools scanning common administrative login pages — like WordPress admin panels (/wp-admin), database managers, and server dashboards. A templatized version of the query, executable in Cloudflare Log Explorer, is below:
SELECT
  clientRequestHTTPHost,
  COUNT(*) AS request_count
FROM
  http_requests
WHERE
  timestamp >= '{{START_DATE}}'
  AND timestamp <= '{{END_DATE}}'
  AND edgeResponseStatus = 200
  AND clientRequestPath LIKE '{{PATH_PATTERN}}' //e.g. '%/wp-admin/%'
  AND NOT match( extract(clientRequestHTTPHost, '^[^:/]+'), '^\\d{1,3}(\\.\\d{1,3}){3}(:\\d+)?$') // comment this line for Cloudflare Log Explorer
  AND botScore < {{BOT_THRESHOLD}} // we used botScore < 30
GROUP BY
  clientRequestHTTPHost
ORDER BY
  request_count DESC;
Why is this serious?
Publicly accessible admin panels can enable brute force attacks. If successful, an attacker can further compromise the host by adding it to a botnet that probes additional websites for similar vulnerability. In addition, this toxic combination can lead to:
Exploit scanning: Attackers identify the specific software version you’re running (like Tomcat or WordPress) and launch targeted exploits for known vulnerabilities (CVEs).
User enumeration: Many admin panels accidentally reveal valid usernames, which helps attackers craft more convincing phishing or login attacks.
What evidence supports it?
Toxic combination of bots automation and exposed management interfaces like: /wp-admin/, /admin/, /administrator/, /actuator/*, /_search/, /phpmyadmin/, /manager/html/, and /app/kibana/.
Implement IP allowlist: Use your WAF or server configuration to ensure that administrative paths are only reachable from your corporate VPN or specific office IP addresses.
Cloak admin paths: If your platform allows it, rename default admin URLs (e.g., change /wp-admin to a unique, non-guessable string).
Deploy geo-blocking: If your administrators only operate from specific countries, block all traffic to these sensitive paths coming from outside those regions.
Enforce multi-factor authentication (MFA): Ensure every administrative entry point requires a second factor; a password alone is not enough to stop a dedicated crawler.
Unauthenticated public API endpoints allowing mass data exposure via predictable identifiers
What did we detect?
We found API endpoints that are accessible to anyone on the Internet without a password or login (see OWASP: API2:2023 – Broken Authentication). Even worse, the way it identifies records (using simple, predictable ID numbers,see OWASP: API1:2023- Broken Object Level Authorization) allows anyone to simply “count” through your database — making it much simpler for attackers to enumerate and “scrape” your business records, without even visiting your website directly.
SELECT
  uniqExact(clientRequestHTTPHost) AS unique_host_count
FROM  http_requests
WHERE timestamp >= '2026-02-13'
  AND timestamp <= '2026-02-14'
  AND edgeResponseStatus = 200
  AND bmScore < 30
  AND (
       match(extract(clientRequestQuery, '(?i)(?:^|[&?])uid=([^&]+)'),  '^[0-9]{3,10}$')
    OR match(extract(clientRequestQuery, '(?i)(?:^|[&?])user=([^&]+)'), '^[0-9]{3,10}$')
    OR length(extract(clientRequestQuery, '(?i)(?:^|[&?])uid=([^&]+)'))  BETWEEN 3 AND 8
    OR length(extract(clientRequestQuery, '(?i)(?:^|[&?])user=([^&]+)')) BETWEEN 3 AND 8
  )
Why is this serious?
This is a “zero-exploit” vulnerability, meaning an attacker doesn’t need to be a hacker to steal your data; they just need to change a number in a web link. This leads to:
Mass Data Exposure: Large-scale scraping of your entire customer dataset.
Secondary Attacks: Stolen data is used for targeted phishing or account takeovers.
Regulatory Risk: Severe privacy violations (GDPR/CCPA) due to exposing sensitive PII.
Fraud: Competitors or malicious actors gaining insight into your business volume and customer base.
What evidence supports it?
Toxic combination of missing security controls and automation targeting particular API endpoints.
Ingredient
Signal
Description
Bot activity
Bot Score < 30
High volume of requests from a single client fingerprint iterating through different IDs.
Anomaly
High Cardinality of tid
A single visitor accessing hundreds or thousands of unique resource IDs in a short window.
Anomaly
Stable Response Size
Consistent JSON structures and file sizes, indicating successful data retrieval for each guessed ID.
Vulnerability
Missing Auth Signals
Requests lack session cookies, Bearer tokens, or Authorization headers entirely.
Misconfiguration
Predictable Identifiers
The tid parameter uses low-entropy, predictable integers (e.g., 1001, 1002, 1003).
While the query checked for bot score and predictable identifiers, signals like high cardinality, stable response sizes and missing authentication were tested on a sample of traffic matching the query.
How do I mitigate this finding?
Enforce authentication: Immediately require a valid session or API key for the affected endpoint. Do not allow “Anonymous” access to data containing PII or business secrets.
Implement authorization (IDOR check): Ensure the backend checks that the authenticated user actually has permission to view the specific tid they are requesting.
Use UUIDs: Replace predictable, sequential integer IDs with long, random strings (UUIDs) to make “guessing” identifiers computationally impossible.
Deploy API Shield: Enable Cloudflare API Shield with features like Schema Validation (to block unexpected inputs) and BOLA Detection.
Debug parameter probing revealing system details
What did we detect?
We found evidence of debug=true appended to web paths to reveal system details. A templatized version of the query, executable in Cloudflare Log Explorer, is below:
SELECT
  clientRequestHTTPHost,
  COUNT(rayId) AS request_count
FROM
  http_requests
WHERE
  timestamp >= '{{START_TIMESTAMP}}'
  AND timestamp < '{{END_TIMESTAMP}}'
  AND edgeResponseStatus = 200
  AND clientRequestQuery LIKE '%debug=false%'
  AND botScore < {{BOT_THRESHOLD}}
GROUP BY
  clientRequestHTTPHost
ORDER BY
  request_count DESC;
Why is this serious?
While this doesn’t steal data instantly, it provides an attacker with a high-definition map of your internal infrastructure. This “reconnaissance” makes their next attack much more likely to succeed because they can see:
Hidden data fields: Sensitive internal information that isn’t supposed to be visible to users.
Technology stack details: Specific software versions and server types, allowing them to look up known vulnerabilities for those exact versions.
Logic hints: Error messages or stack traces that explain exactly how your code works, helping them find ways to break it.
What evidence supports it?
Toxic combination of automated probing and misconfigured diagnostic flags targeting the Multiple Hosts and Application Paths.
Ingredient
Signal
Description
Bot activity
Bot Score < 30
Vulnerability scanner activity
Anomaly
Response Size Increase
Significant jumps in data volume when a debug flag is toggled, indicating details or stack traces are being leaked. Add these additional conditions, if needed:
Rapid-fire requests across diverse endpoints (e.g., /api, /login, /search) specifically testing for the same diagnostic triggers. Add these conditions, if needed:
SELECT
APPROX_DISTINCT(clientRequestPath) AS unique_endpoints_tested
HAVING
unique_endpoints_tested > 1
Misconfiguration
Debug Parameter Allowed
The presence of active “debug,” “test,” or “dev” flags in production URLs that change application behavior.
Vulnerability
Schema disclosure
The appearance of internal-only JSON fields or “Firebase-style” .json dumps that reveal the underlying structure.
While the query checked for bot score and paths with debug parameters, signals like repeated probing, response sizes and schema disclosure were tested on a sample of traffic matching the query.
How do I mitigate this finding?
Disable debugging in production: Ensure that all “debug” or “development” environment variables are strictly set to false in your production deployment configurations.
Filter parameters at the edge: Use your WAF or API Gateway to strip out known debug parameters (like ?debug=, ?test=, ?trace=) before they ever reach your application servers.
Sanitize error responses: Configure your web servers (Nginx, Apache, etc.) to show generic error pages instead of detailed stack traces or internal system messages.
Audit firebase/DB rules: If you are using Firebase or similar NoSQL databases, ensure that /.json path access is restricted via strict security rules, so public users cannot dump the entire schema or data.
We discovered “health check” and monitoring dashboards are visible to the entire Internet. Specifically, paths like /actuator/metrics are responding to anyone who asks. A templatized version of the query, executable in Cloudflare Log Explorer, is below::
SELECT
  clientRequestHTTPHost,
  count() AS request_count
FROM http_requests
WHERE timestamp >= toDateTime('{{START_DATE}}')
  AND timestamp <  toDateTime('{{END_DATE}}')
  AND botScore < 30
  AND edgeResponseStatus = 200
  AND clientRequestPath LIKE '%/actuator/metrics%' // an example
GROUP BY
  clientRequestHTTPHost
ORDER BY request_count DESC
Why is this serious?
While these endpoints don’t usually leak customer passwords directly, they provide the “blueprints” for a sophisticated attack. Exposure leads to:
Strategic timing: Attackers can monitor your CPU and memory usage in real-time to launch a Denial of Service (DoS) attack exactly when your systems are already stressed.
Infrastructure mapping: These logs often reveal the names of internal services, dependencies, and version numbers, helping attackers find known vulnerabilities to exploit.
Exploitation chaining: Information about thread counts and environment hints can be used to bypass security layers or escalate privileges within your network.
What evidence supports it?
Toxic combination of misconfigured access controls and automated reconnaissance targeting the Asset/Path: /actuator/metrics, /actuator/prometheus, and /health.
Ingredient
Signal
Description
Bot activity
Bot Score < 30
Automated scanning tools are systematically checking for specific paths
Anomaly
Monitoring Fingerprint
The response body matches known formats (Prometheus, Micrometer, or Spring Boot), confirming the system is leaking live data.
Anomaly
HTTP 200 Status
Successful data retrieval from endpoints that should ideally return a 403 Forbidden or 404 Not Found to the public.
Misconfiguration
Public Monitoring Path
Public accessibility of internal-only endpoints like /actuator/* that are intended for private observability.
Vulnerability
Missing Auth
These endpoints are reachable without a session token, API key, or IP-based restriction.
How do I mitigate this finding?
Restrict access via WAF: Immediately create a firewall rule to block any external traffic requesting paths containing /actuator/ or /prometheus.
Bind to localhost: Reconfigure your application frameworks to only serve these monitoring endpoints on localhost (127.0.0.1) or a private management network.
Enforce basic auth: If these must be accessed over the web, ensure they are protected by strong authentication (at a minimum, complex Basic Auth or mTLS).
Disable unnecessary endpoints: In Spring Boot or similar frameworks, disable any “Actuator” features that are not strictly required for production monitoring.
Unauthenticated search endpoints allowing direct index dumping
What did we detect?
Search endpoints (like Elasticsearch or OpenSearch) that are usually meant for internal use are wide open to the public. The templatized query is:
SELECT
  clientRequestHTTPHost,
  count() AS request_count
FROM http_requests
WHERE timestamp >= toDateTime('{{START_DATE}}')
  AND timestamp <  toDateTime('{{END_DATE}}')
  AND botScore < 30
  AND edgeResponseStatus = 200
AND clientRequestPath like '%/\_search%'
AND NOT match(extract(clientRequestHTTPHost, '^[^:/]+'), '^\\d{1,3}(\\.\\d{1,3}){3}(:\\d+)?$')
GROUP BY
  clientRequestHTTPHost
Why is this serious?
This is a critical vulnerability because it requires zero technical skill to exploit, yet the damage is extensive:
Mass data theft: Attackers can “dump” entire indices, stealing millions of records in minutes.
Internal reconnaissance: By viewing your “indices” (the list of what you store), attackers can identify other high-value targets within your network.
Data sabotage: Depending on the setup, an attacker might not just read data — they could potentially modify or delete your entire search index, causing a massive service outage.
What evidence supports it?
We are seeing a toxic combination of misconfigured exposure and automated traffic and data enumeration targeting /_search, /_cat/indices, and /_cluster/health.
Ingredient
Signal
Description
Bot activity
Bot Score < 30
High-velocity automation signatures attempting to paginate through large datasets and “scrape” the entire index.
Anomaly
Unexpected Response Size
Large JSON response sizes consistent with bulk data retrieval rather than simple status checks.
Anomaly
Repeated Query Patterns
Systematic “enumeration” behavior where the attacker is cycling through every possible index name to find sensitive data.
Vulnerability
/_search or /_cat/ Patterns
Direct exposure of administrative and query-level paths that should never be reachable via a public URL.
Misconfiguration
HTTP 200 Status
The endpoint is actively fulfilling requests from unauthorized external IPs instead of rejecting them at the network or application level.
While the query checked for bot score and paths, signals like repeated query patterns, response sizes, and schema disclosure were tested on a sample of traffic matching the query.
How do I mitigate this finding?
Restrict network access: Immediately update your Firewall/Security Groups to ensure that search ports (e.g., 9200, 9300) and paths are only accessible from specific internal IP addresses.
Enable authentication: Turn on “Security” features for your search cluster (like Shield or Search Guard) to require valid credentials for every API call.
WAF blocking: Deploy a WAF rule to immediately block any request containing /_search, /_cat, or /_cluster coming from the public Internet.
Audit for data loss: Review your database logs for large “Scroll” or “Search” queries from unknown IPs to determine exactly how much data was exfiltrated.
Successful SQL injection attempt on application paths
What did we detect?
We’ve identified attackers who sent a malicious request—specifically a SQL injection designed to trick databases. A templatized version of the query, executable in Cloudflare Log Explorer, is below:
SELECT
  clientRequestHTTPHost,
  count() AS request_count
FROM http_requests
WHERE timestamp >= toDateTime('{{START_DATE}}')
  AND timestamp <  toDateTime('{{END_DATE}}')
  AND botScore < 30
AND wafmlScore<30
  AND edgeResponseStatus = 200
AND LOWER(clientRequestQuery) LIKE '%sleep(%'
GROUP BY
  clientRequestHTTPHost
ORDER BY request_count DESC
Why is this serious?
This is the “quiet path” to a data breach. Because the system returned a successful status code (HTTP 200), these attacks often blend in with legitimate traffic. If left unaddressed, an attacker can:
Refine their methods: Use trial and error to find the exact payload that bypasses your filters.
Exfiltrate data: Slowly drain database contents or leak sensitive secrets (like API keys) passed in URLs.
Stay invisible: Most automated alerts look for “denied” attempts; a “successful” exploit is much harder to spot in a sea of logs.
What evidence supports it?
We are seeing a toxic combination of automated bot signals, anomalies and application-layer vulnerabilities targeting many application paths.
Ingredient
Signal
Description
Bot
Bot Score < 30
High probability of automated traffic; signatures and timing consistent with exploit scripts.
Anomaly
HTTP 200 on sensitive path
Successful responses returning from a login endpoint that should have triggered a WAF block.
Anomaly
Repeated Mutations
High-frequency variations of the same request, indicating an attacker “tuning” their payload.
Vulnerability
Suspicious Query Patterns
Use of SLEEP commands and time-based patterns designed to probe database responsiveness.
How do I mitigate this finding?
Immediate virtual patching: Update your WAF rules to specifically block the SQL patterns identified (e.g., time-based probes).
Sanitize inputs: Review the backend code for this path to ensure it uses prepared statements or parameterized queries.
Remediate secret leakage: Move any sensitive data from URL parameters to the request body or headers. Rotate any keys flagged as leaked.
Audit logs: Check database logs for the timeframe of the “HTTP 200” responses to see if any data was successfully extracted.
Examples of toxic combinations on payment flows
Card testing and card draining are some of the most common fraud tactics. An attacker might buy a large batch of credit cards from the dark web. Then, to verify how many cards are still valid, they might test the card on a website by making small transactions. Once validated, they might use such cards to make purchases, such as gift cards, on popular shopping destinations.
Suspected card testing on payment flows
What did we detect?
On payment flows (/payment, /checkout, /cart), we found certain hours of the day when either the hourly request volume from bots or hourly payment success ratio spiked by more than 3 standard deviations from their hourly baselines over the prior 30 days. This could be related to card testing where an attacker is trying to validate lots of stolen credits. Of course, marketing campaigns might cause request spikes while payment outages might cause sudden drops in success ratios.
Why is this serious?
Payment success ratio drops coinciding with request spikes, in the absence of marketing campaigns or payment outages or other factors, could mean bots are in the middle of a massive card-testing run.
What evidence supports it?
We used a combination of bot signals and anomalies on /payment, /checkout, /cart:
Ingredient
Signal
Description
Bot
Bot Score < 30
High probability of automated traffic rather than humans making mistakes
Anomaly
Volume Z-Score> 3.0, calculated from request volume baseline for a given hour based on the past 30 days and evaluated each hour. This factors daily seasonality as well.
Scaling Event: The attacker is testing a batch of cards
Anomaly
Success ratio Z> 3.0, calculated from success ratio baseline for a given hour based on the past 30 days and evaluated each hour. This factors daily seasonality as well.
Sudden drops in success ratio may mean cards being declined as they are reported lost or stolen
How do I mitigate this?
Use the 30-day payment paths hourly request volume baseline as the hourly rate limit for all requests with bot scores < 30 on payment paths.
Suspected card draining on payment flows
What did we detect?
On payment flows (/payment, /checkout, /cart), we found certain hours of the day when either the hourly request volume from humans (or bots impersonating humans) or hourly payment success ratio spiked by more than 3 standard deviations from their hourly baselines over the prior 30 days. This could be related to card draining where an attacker (either humans or bots impersonating humans) is trying to purchase goods using valid but stolen credits. Of course, marketing campaigns might also cause request and success ratio spikes, so additional context in the form of typical payment requests from a given IP address is essential context, as shown in the figure.
Why is this serious?
Payment success ratio spikes coinciding with request spikes and high density of requests per IP address, in the absence of marketing campaigns or payment outages or other factors, could mean humans (or bots pretending to be humans) are making fraudulent purchases. Every successful transaction here could be a direct revenue loss or a chargeback in the making.
What evidence supports it?
We used a combination of bot signals and anomalies on /payment, /checkout, /cart:
Ingredient
Signal
Description
Bot
Bot Score >= 30
High probability of human traffic which is expected to be allowed
Anomaly
Volume Z-Score > 3.0, calculated from request volume baseline for a given hour based on the past 30 days and evaluated each hour. This factors daily seasonality as well.
The attacker is making purchases at higher rates than normal shoppers
Anomaly
Success ratio Z > 3.0, calculated from success ratio baseline for a given hour based on the past 30 days and evaluated each hour. This factors daily seasonality as well.
Sudden increases in success ratio may mean valid cards being approved for purchase
Anomaly
IP density > 5, calculated from payment requests per IP in any given hour divided by the average payment requests for that hour based on the past 30 days
Humans with 5X more purchases than typical humans in the past 30 days is a red flag
Anomaly
JA4 diversity < 0.1, calculated from JA4s per payment requests in any given hour
JA4s with unusual hourly purchases are likely bots pretending to be humans
How do I mitigate this?
Identity-Based Rate Limiting: Use IP density to implement rate limits for requests with bot score >=30 on payment endpoints.
Monitor success ratio: Alert on any hour when the success ratio for “human” traffic, with bot score >=30 on payment endpoints, deviates by more than 3 standard deviations from its 30-day baseline.
Challenge: If a high bot score request (likely human) hits payment flows more than 3 times in 10 minutes, trigger a challenge to slow them down
What’s next: detections in the dashboard, AI-powered remediation
We are currently working on integrating these “toxic combination” detections directly into the Security Insights dashboard to provide immediate visibility for such risks. Our roadmap includes building AI-assisted remediation paths — where the dashboard doesn’t just show you a toxic combination, but proposes the specific WAF rule or API Shield configuration required to neutralize it.
We would love to have you try our Security Insights featuring toxic combinations. You can join the waitlist here.
In early September 2025, attackers used a phishing email to compromise one or more trusted maintainer accounts on npm. They used this to publish malicious releases of 18 widely used npm packages (for example chalk, debug, ansi-styles) that account for more than 2 billion downloads per week. Websites and applications that used these compromised packages were vulnerable to hackers stealing crypto assets (“crypto stealing” or “wallet draining”) from end users. In addition, compromised packages could also modify other packages owned by the same maintainers (using stolen npm tokens) and included code to steal developer tokens for CI/CD pipelines and cloud accounts.
As it relates to end users of your applications, the good news is that Cloudflare Page Shield, our client-side security offering will detect compromised JavaScript libraries and prevent crypto-stealing. More importantly, given the AI powering Cloudflare’s detection solutions, customers are protected from similar attacks in the future, as we explain below.
Excerpt from the injected malicious payload, along with the rest of the innocuous normal code.Among other things, the payload replaces legitimate crypto addresses with attacker’s addresses (for multiple currencies, including bitcoin, ethereum, solana).
Finding needles in a 3.5 billion script haystack
Everyday, Cloudflare Page Shield assesses 3.5 billion scripts per day or 40,000 scripts per second. Of these, less than 0.3% are malicious, based on our machine learning (ML)-based malicious script detection. As explained in a prior blog post, we preprocess JavaScript code into an Abstract Syntax Tree to train a message-passing graph convolutional network (MPGCN) that classifies a given JavaScript file as either malicious or benign.
The intuition behind using a graph-based model is to use both the structure (e.g. function calling, assertions) and code text to learn hacker patterns. For example, in the npm compromise, the malicious code injected in compromised packages uses code obfuscation and also modifies code entry points for crypto wallet interfaces, such as Ethereum’s window.ethereum, to swap payment destinations to accounts in the attacker’s control. Crucially, rather than engineering such behaviors as features, the model learns to distinguish between good and bad code purely from structure and syntax. As a result, it is resilient to techniques used not just in the npm compromise but also future compromise techniques.
Our ML model outputs the probability that a script is malicious which is then transformed into a score ranging from 1 to 99, with low scores indicating likely malicious and high scores indicating benign scripts. Importantly, like many Cloudflare ML models, inferencing happens in under 0.3 seconds.
Model Evaluation
Since the initial launch, our JavaScript classifiers are constantly being evolved to optimize model evaluation metrics, in this case, F1 measure. Our current metrics are
Metric
Latest: Version 2.7
Improvement over prior version
Precision
98%
5%
Recall
90%
233%
F1
94%
123%
Some of the improvements were accomplished through:
More training examples, curated from a combination of open source datasets, security partners, and labeling of Cloudflare traffic
Better training examples, for instance, by removing samples with pure comments in them or scripts with nearly equal structure
Better training set stratification, so that training, validation and test sets all have similar distribution of classes of interest
Tweaking the evaluation criteria to maximize recall with 99% precision
Given the confusion matrix, we should expect about 2 false positives per second, if we assume ~0.3% of the 40,000 scripts per second are flagged as malicious. We employ multiple LLMs alongside expert human security analysts to review such scripts around the clock. Most False Positives we encounter in this way are rather challenging. For example, scripts that read all form inputs except credit card numbers (e.g. reject input values that test true using the Luhn algorithm), injecting dynamic scripts, heavy user tracking, heavy deobfuscation, etc. User tracking scripts often exhibit a combination of these behaviors, and the only reliable way to distinguish truly malicious payloads is by assessing the trustworthiness of their connected domains. We feed all newly labeled scripts back into our ML training (& testing) pipeline.
Most importantly, we verified that Cloudflare Page Shield would have successfully detected all 18 compromised npm packages as malicious (a novel attack, thus, not in the training data)..
Planned improvements
Static script analysis has proven effective and is sometimes the only viable approach (e.g., for npm packages). To address more challenging cases, we are enhancing our ML signals with contextual data including script URLs, page hosts, and connected domains. Modern Agentic AI approaches can wrap JavaScript runtimes as tools in an overall AI workflow. Then, they can enable a hybrid approach that combines static and dynamic analysis techniques to tackle challenging false positive scenarios, such as user tracking scripts.
In the npm attack, we did not see any activity in the Cloudflare network related to this compromise among Page Shield users, though for other exploits, we catch its traffic within minutes. In this case, patches of the compromised npm packages were released in 2 hours or less, and given that the infected payloads had to be built into end user facing applications for end user impact, we suspect that our customers dodged the proverbial bullet. That said, had traffic gotten through, Page Shield was already equipped to detect and block this threat.
Also make sure to consult our Page Shield Script detection to find malicious packages. Consult the Connections tab within Page Shield to view suspicious connections made by your applications.
Several scripts are marked as malicious.
Several connections are marked as malicious.
And be sure to complete the following steps:
Audit your dependency tree for recently published versions (check package-lock.json / npm ls) and look for versions published around early–mid September 2025 of widely used packages.
Rotate any credentials that may have been exposed to your build environment.
Revoke and reissue CI/CD tokens and service keys that might have been used in build pipelines (GitHub Actions, npm tokens, cloud credentials).
Pin dependencies to known-good versions (or use lockfiles), and consider using a package allowlist / verified publisher features from your registry provider.
Scan build logs and repos for suspicious commits/GitHub Actions changes and remove any unknown webhooks or workflows.
While vigilance is key, automated defenses provide a crucial layer of protection against fast-moving supply chain attacks. Interested in better understanding your client-side supply chain? Sign up for our free, custom Client-Side Risk Assessment.
The collective thoughts of the interwebz
Manage Consent
To provide the best experiences, we use technologies like cookies to store and/or access device information. Consenting to these technologies will allow us to process data such as browsing behavior or unique IDs on this site. Not consenting or withdrawing consent, may adversely affect certain features and functions.
Functional
Always active
The technical storage or access is strictly necessary for the legitimate purpose of enabling the use of a specific service explicitly requested by the subscriber or user, or for the sole purpose of carrying out the transmission of a communication over an electronic communications network.
Preferences
The technical storage or access is necessary for the legitimate purpose of storing preferences that are not requested by the subscriber or user.
Statistics
The technical storage or access that is used exclusively for statistical purposes.The technical storage or access that is used exclusively for anonymous statistical purposes. Without a subpoena, voluntary compliance on the part of your Internet Service Provider, or additional records from a third party, information stored or retrieved for this purpose alone cannot usually be used to identify you.
Marketing
The technical storage or access is required to create user profiles to send advertising, or to track the user on a website or across several websites for similar marketing purposes.