Tag Archives: Application Security

Follow the thread: a new dashboard to investigate account abuse

Post Syndicated from Nicole Justus original https://blog.cloudflare.com/account-abuse-protection-dashboard/

Traditionally, preventing online fraud relied on point-in-time proof of identity: enter the correct password, complete a biometric verification, or pass a liveness check, and gain access. To defeat these controls, fraudsters had to steal credentials and other identity evidence from a real user, which was difficult to execute and scale. Today, widespread access to AI enables fraudsters to fabricate or imitate legitimate identities by combining exposed credentials with synthetic media designed to evade identity verification. Consequently, identity checks are no longer sufficient as they capture a moment in time. Even when someone passes a check, it does not mean the account itself can be trusted.

One convincing interaction can be faked. A consistent pattern of legitimate behavior is much harder to manufacture. Modern fraud prevention must move beyond stateless decisions toward a stateful trust model. Traditional identity verification asks, “Can this person pass the check right now?” A stateful approach additionally asks, “Does it fit what we know about this account and its established behavior?” At Cloudflare, trust is continually earned and reassessed at each interaction against historical behavioral, network, and device patterns.

Cloudflare’s Account Abuse Protection (AAP) creates stateful account overviews to help website owners detect and investigate abuse across login and signup activity. Customers configure an identifier from their existing login or signup flow, such as an email address, username, or phone number. Cloudflare cryptographically hashes that value to create a privacy-preserving, per-domain Hashed User ID. Within AAP, a Hashed User ID represents an account and anchors its activity. With each login or signup, AAP adds the event and relevant network and device signals observed at Cloudflare’s edge. Over time, this accumulated history establishes context for the account’s typical behavior, making meaningful deviations easier to identify and giving fraud teams (i.e., the designated personnel for Security Intelligence, Investigations, Trust & Safety, or Risk & Compliance) a stronger foundation for investigation.

Today, we are introducing a new fraud dashboard for Account Abuse Protection, available first to Early Access customers. The workspace brings together account overviews built from activity observed across a website’s configured login and signup flows. It allows fraud analysts to view their entire user population, identify suspicious trends, and move from aggregate activity patterns into specific account investigations.

Dashboard overview: From population visibility to individual account depth

The dashboard is designed as an investigative funnel. When a suspicious event has been identified, fraud teams can review the account population overview to understand the scale and shape of suspicious patterns without needing to investigate every account individually.

Teams can review total login and signup volume, see how many accounts generated those events, and view the unique IP addresses and devices observed across those accounts. Country and ASN breakdowns provide additional context about where the activity was observed.

The account population overview helps fraud teams answer questions such as:

  • Did login or signup volume change unexpectedly?
  • Are failed logins or leaked credential matches increasing?
  • Which accounts show the highest login failure rates?
  • Are events concentrated in particular countries, ASNs, or times of day?
  • Did a sudden signup increase coincide with shared characteristics?
  • Which accounts may have been affected by the attack?

From there, fraud teams can determine the campaign’s scope, prioritize accounts for manual review, reconstruct what happened within those accounts, and decide how to respond.

AAP in Action: Investigating a credential stuffing attack

Consider a fraud prevention or security analyst team investigating unusual login activity. The team opens the Account Abuse Protection dashboard to determine how broadly a credential stuffing attack may have affected its users. The dashboard allows analysts to investigate from total event traffic all the way to individual accounts that warrant review. The individual account view provides the history and context needed to reconstruct what happened and determine the appropriate response.

1. Spot the anomaly. The investigation begins in the account population overview, where the fraud team determines whether suspicious activity is isolated or part of a broader campaign. An increase in failed login activity prompts the team to examine Leaked credential check results on login events.

In this example, a leaked credential summary shows that approximately 2.4K events produced a leaked username or password result, compared with 11.7K events where credentials were classified as clean. This pattern is an investigative lead, not confirmation that every affected account was compromised.

The team can now focus on accounts associated with leaked credential matches. Are multiple accounts connected to the same IP addresses or ASNs? Does an individual account suddenly appear across an unusually high number of IP addresses? These relationships help define the potential scope of the credential stuffing campaign and identify the accounts that should be prioritized for review. Analysts can also look at the dashboard for concentration across particular IP addresses, ASNs, locations, or devices.

2. Narrow the field of investigation.  Filters help narrow the account population to specific accounts with the most concerning combination of signals and identify which ones warrant manual review.  For example, filters can be set to look at accounts with at least three failed logins, at least three leaked credential matches, and observed from at least five unique IP addresses.

From this filtered cohort, analysts can select the specific Hashed User IDs, whose recent activity requires the most urgent attention.

3. Investigate an account. Analysts can review login attempts, identify new devices or locations, and reconstruct how activity unfolded. Using the event table, they can compare earlier clear events with later suspicious activity, pinpoint when the pattern began, and determine whether it was a single event or a series of repeated attempts. Each event includes a Ray ID that analysts can use to look up associated information in Security Events.

4. Decide how to respond. If review confirms that an account was compromised, analysts can begin their established recovery process. They can also use the Hashed User ID in a WAF rule to challenge or block future requests associated with it.

A closer look at an individual account

An individual account view provides another layer of depth for investigation. It summarizes the login and signup activity observed for that account, including its login success rate, leaked credential matches, and most frequently associated networks, locations, and devices. Analysts can then examine the individual events behind the account summary. Each event includes its timestamp, Ray ID, and any mitigation applied. A Cloudflare Ray ID is an identifier given to every request that goes through Cloudflare, that teams can use to look up associated information in Security Events.

This detailed summary and event log helps answer questions such as:

  • Was this a single login event or part of a series of repeated attempts?
  • Did that login introduce a new country, network, IP address, or device?
  • Did the user’s behavior change afterward?
  • What happened before and after a suspicious event?
  • Did concentrated login activity follow shortly after signup?
  • Did signup and subsequent login activity use different network or device characteristics?

Viewed together, these signals help fraud teams determine whether an account requires recovery, restricting access, or another response, depending on how the customer wants to treat these accounts. When there is enough evidence, analysts can use the Hashed User ID in a WAF rule to challenge or block future requests associated with that identifier.

Designed to minimize unnecessary data exposure

Account Abuse Protection provides account level context while also giving Cloudflare customers control over who can access account information. This launch introduces two new roles (i.e., access levels): Account Abuse Protection and Account Abuse Protection PII. The Account Abuse Protection role controls access to the dashboard, while the Account Abuse Protection PII role controls access to additional account-level PII (e.g., email) . We encourage Customer Administrators to assign these roles on a need-to-know basis, based on what each team member needs to investigate.

The Account Abuse Protection PII role is also required to create or update Logpush jobs containing PII. Separating these permissions helps customers apply least privilege access to both dashboard and data export workflows.

Take the next step in account protection today

The new dashboard is available first to Account Abuse Protection Early Access customers. Bot Management Enterprise customers interested in these capabilities can sign up for Early Access. Prospective Bot Management Enterprise customers can use the same form to contact our team.

Bot detections help customers understand whether activity is automated. Account Abuse Protection adds account level overview to help fraud teams investigate whether login and signup activity appears authentic and consistent with legitimate use. Together, these capabilities help website owners address automated and human-driven abuse across account creation and login.

Enforce positive security with Cloudflare Application Profiles

Post Syndicated from Daniele Molteni original https://blog.cloudflare.com/application-profiles/

Today, we are launching Application Profiles, a seamless way to enforce a positive security policy. By analyzing the structure and format of HTTP requests and identifying deviations, Cloudflare can help you significantly reduce the attack surface area.

Every customer we speak to wants to know how we can protect them from attacks that use frontier AI models. This has become the number one priority for anyone working in security. Large language models (LLMs) allow even non-technical people to launch attacks with a single prompt. LLMs can generate malicious payloads, test known techniques, and probe applications autonomously by mutating their tactics based on the feedback from the application or the Web Application Firewall (WAF). 

Our tools have changed to stay a step ahead of the attackers. Managed WAF rules and machine learning-based detections remain essential for detecting techniques such as SQL injection, cross-site scripting, remote code execution, and new CVEs, including many variations of those attacks. The answer can’t simply be “patch faster”: this is not sustainable, and it doesn’t work if you haven’t completely mapped your vulnerabilities.

What if you could learn what good requests look like by analyzing your traffic structure? Instead of looking only for requests that resemble known attacks, we could allow only requests that conform with what we expect. By doing this, we’d dramatically reduce the attack surface area. For example, if the search field in your query doesn’t expect special characters, we can only accept alphanumeric strings. This would already prevent a vast library of known attacks.

But we don’t stop here. Once we have learned the structure and format of your HTTP requests, we can infer the goal of each operation and then understand what the application ultimately does. With this information, we can identify and prioritize the most critical and vulnerable operations and fields you should take care of first.

Cloudflare already supports positive security for APIs through Schema Learning and Schema Validation. We are now extending this protection to web applications through Application Schema Profiles. You onboard an application, we learn its profile, and then we start to deploy an always-on detection that identifies non-conformity. All automated and enriched by powerful analytics.

We are opening a closed beta to invited Enterprise customers without API Security; customers with API Security already have access.

Validating requests based on learned profiles

Schema Profiles periodically learn the expected request structure from observed traffic. After a profile is available, an always-on validation layer is automatically deployed on live traffic. For every request, the detection evaluates whether it conforms or not with the profile, and it adds the result as metadata, augmenting the information already associated with the request. The signal does not take action by itself: customers can analyze past traffic in Security Analytics and decide where enforcement is appropriate and create Security Rules to block non-conforming requests. Requests to operations without a profile are not classified by this feature.

Unlike Managed Rules, failing validation does not require a request to match a known attack signature. A value outside an expected range, an unknown enum value, an invalid universally unique identifier (UUID), or unexpected characters — all can be identified because they differ from the learned profile.

For example, consider the following operation: 

www.example.com/shop/2dbda2e7-cfc9-448d-9465-799d2e6ff363/inventory?product_id=938062541

Below we describe the learning process, which evaluates only the structure and format of the request. When enough traffic has been observed, we learn that the path expects a UUID variable and that product_id is an integer and what its boundaries are. When product_id contains a string, it will be flagged as a violation. Similarly, Cloudflare can identify malformed UUID values and, when the customer enables enforcement, prevent non-UUID input from reaching the corresponding handler. These simple filters reduce the range of inputs an attacker can send, preventing the vast majority of typical attack vectors, such as SQL injection, cross-site scripting, remote code execution and more. 

Non-conforming does not always mean malicious. An application release, a new client, or an unusual but valid request may also introduce a difference. We recommend starting in observation mode, so customers can review a profile's effect before enforcement.

Learn the expected structure of requests

To determine the anticipated request structure for a web or API application, Schema Profiles routinely analyze observed traffic. Each profile may include the following, depending on the application traffic:

  • Path variables 
  • Query parameters
  • Headers and cookies
  • Body structure (JSON body or form-encoded)

For each field, the system learns its data type (integer, string, boolean, arrays, UUID or enum) and constraints such as numeric ranges, short enumerations, string lengths, and character classes.

Learning applies to operations that customers select for profiling. In Web Assets, an operation is Cloudflare's term for an operation identified by its HTTP method, hostname pattern, and path pattern. Web Assets continuously discovers operations and lists them under Web Assets > Operations. Customers can also add operations manually. Profiling doesn’t automatically start for discovered operations, while manually created operations do trigger profiling when created. For discovered operations, the customer must intentionally select Learn profile from the operation's overflow menu. 

After profiling is enabled, Cloudflare collects qualifying traffic and runs learning automatically once a week for each zone, using the most recent successful traffic. An operation needs at least 1,000 requests that received a 2xx response in the previous seven days to learn fields, and at least 10,000 to learn data boundaries. Successful requests can include bots and scanners, so customers should review a learned profile before enforcing it. Our roadmap includes allowing customers to trigger learning on demand and excluding automated traffic.

Once learned, profiles can be reviewed by selecting View details of the operation and finding the learned schema in the Security overview panel. If a learned schema is not shown, Cloudflare is still collecting data for the profile. Customers can also export the profile as an OpenAPI v3 schema file.

Learned profiles update each week as application traffic changes. New fields are added and fields that are no longer observed are removed, so validation tracks how the application changes. Customers can pin and save the learned schema by downloading the learned schema and uploading it to Schema Validation.

Review before you block

Security Analytics now includes a new Profile Analysis tab. Customers can select a validation profile and see traffic trends, including how many requests did not conform to the learned profile during the previous seven days. 

Customers can review the conforming and non-conforming traffic. They can drill into violations and review sampled logs to see where the violation occurred, which field was affected, and why it failed validation. Violations are classified into ten reasons, including type mismatches, values outside a learned range, and invalid formats.

Once a team understands the effect, it can use Security Rules to act on the signal. A rule can cover an entire application or be limited to selected paths, operations, or fields. Teams control where to monitor and where to block.

Positive security for web and API traffic

Traditional WAF learning modes can build detailed positive-security policies, but they often require operators to review suggestions, stage changes, and maintain policy entities. Cloudflare Schema Profiles expose validation as a request field cf.schema_validation.learned.violated, allowing customers to combine it with request properties, Bot Score, Attack Score, and other signals in a single Security Rule. By creating simple rules, teams can combine detections and define precisely when Cloudflare should take action.

Two other classes of fields are available to create more targeted rules. First, there are fields that collect where the violation occurred. For example, based on our initial example, if the value of product_id query parameter does not conform with the profile, the following field will be populated cf.schema_validation.uploaded.query.violated_parameters = ["product_id"]. This allows customers to create rules that enforce positive security only on specific fields or exclude them from the enforcement.

The second class of field collects new parameters that are not present in the profile. This is useful when you want to handle requests with new parameters (e.g. when deploying a new version of your application), or restrict your posture even further by blocking any parameters that were not detected or defined in the past.

Use case

Field

Location values

Example

Identify where in the request the violation occurred

Array up to 20 items

cf.schema_validation.learned.[location].violated_parameters

query,path,headers,cookies,body

cf.schema_validation.learned.query.violated_parameters = ["product_id"]

Identify whether an undeclared parameter is seen in the request 

Array up to 20 items

cf.schema_validation.learned.[location].undeclared_parameters

query

cf.schema_validation.learned.query.undeclared_parameters = ["adminMode", "utm"]

Coming up: critical field analysis, how we help you roll out positive security

Even with a flexible enforcement design, customers tell us that deploying a positive security policy is operationally complex. A large application can have thousands of operations with tens of thousands of fields. But not all operations and fields carry the same risk. Contextualization and prioritization helps security teams roll out positive security in a controlled and confident manner.

LLMs can help contextualize learned profiles to provide additional insight. For web applications, paths and field names are usually self-explanatory, thus semantic. For example, we piloted running a model hosted on Workers AI across four random applications’ learned profiles. The model successfully identified the link between clientId and account_number across two applications of a system, as well as the common dependency of using One-Time Password (OTP) for enhanced authentication. Highlighting this context enables security teams to prioritize actions such as configuring Rate Limiting Rules to defend against account-focused brute force attacks.

These LLM-powered insights will be accessible directly within the dashboard alongside each operation in Web Assets. Before executing a one-click deployment, teams can evaluate rule recommendations designed to secure these key fields, backed by mitigation simulation using past traffic to gain confidence.

Beyond contextualizing operations with semantic insights and risk indicators, we are developing additional metrics to order operations using historical request trends and signals. This enables security teams to focus mitigation efforts on the highest-priority operations first, including:

  • Data loss: upward trend of unusual increased data transfer
  • Reconnaissance activity: high count of unknown parameters
  • Business criticality: total volume of traffic correlated with the unique session IDs served

What’s available today

Customers with API Security already have access, given that this is an extension of Schema Learning and Schema Validation. We are opening a closed beta to customers without API Security who can test Schema Profiles on production web application traffic, meet with the product team, and provide detailed feedback on profile accuracy, analytics, and enforcement controls. Access is by invitation and does not imply future plan availability. If you are not an API Security customer and want to get access, contact your account team.

The feature supports paths, query parameters, headers, cookies, JSON request bodies, and form-encoded request bodies. Profiles can validate integers, strings, UUIDs, arrays, and enums containing up to three values. Multipart forms, GraphQL, and XML are not supported at this time.

Schema Profiles validate every value when a parameter name is repeated, but they do not enforce parameter uniqueness. They also do not learn and enforce required parameters or block a request solely because it includes a new parameter.

Get ahead of zero-days

Our idea for Application Profiles does not stop at validating request structure. The same workflow can learn other characteristics of what an application expects (such as ASNs or JA4s), explain when traffic deviates from them, and give security teams confidence in defining what “good” looks like. With a Proactive Security workflow, we help security teams get ahead of zero-days!

We tested our own WAF with frontier AI models. Here’s what we found

Post Syndicated from Vikram Grover original https://blog.cloudflare.com/adaptive-ai-waf-testing/

“Is your WAF ready for frontier AI models?” We keep hearing this question from our customers, so we decided to find out.

When it comes to exploiting applications, what LLMs are really good at is iterating and mutating attack payloads faster than any human hacker could do. LLMs can use real-time responses to iterate and change their techniques by, for example, testing different encodings, sending the payload in a different part of the HTTP request, or moving to the next vulnerability to test.

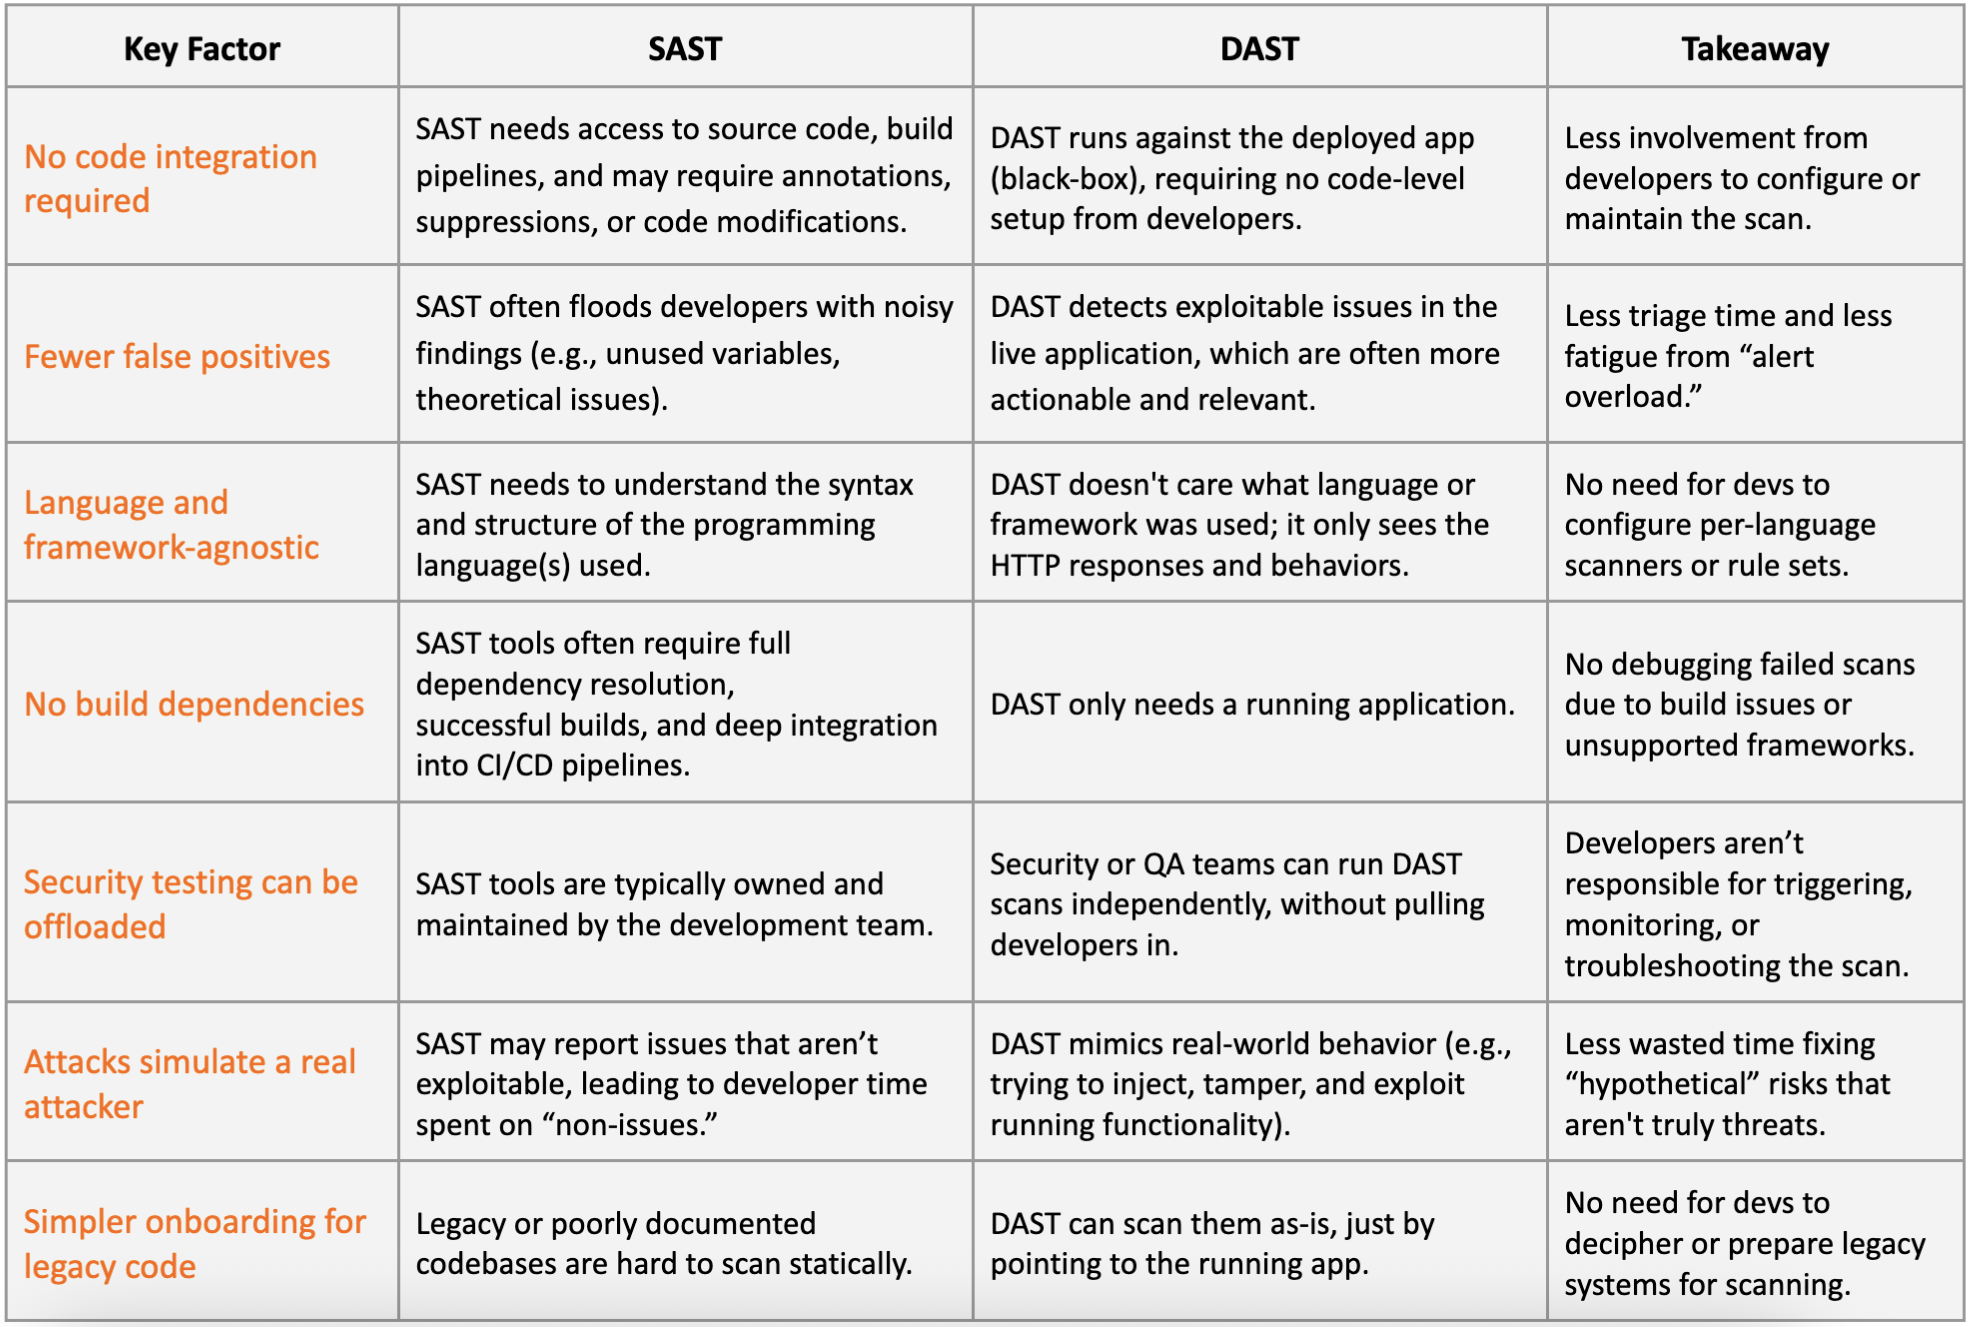
Even before LLMs were around, security engineers used two common approaches to test applications: static and dynamic application security testing. The former analyzes code without executing it to identify vulnerabilities, while the latter probes running applications to find runtime flaws. There are plenty of works scanning code with frontier AI models, including details on how to build your own harness.

For the project described in this blog post, we took a dynamic approach: making the LLM act as if it was a hacker to evaluate whether a WAF is doing its job. The LLM had no visibility into source code, no view of the WAF's rules, and could only see selected HTTP response data.

We built a WAF tester that starts from known exploits and then iterates by changing how it is encoded or delivered, sends it again, and uses the response to choose the next variation. A request that was not blocked became a lead for human review, not a confirmed exploit.

We ran the tester against an authorized customer staging environment across six attack categories and recorded 1,107 attempts. After reviewing the non-blocked requests and removing malformed, benign, duplicate, and out-of-scope observations, the vast majority of the attacks were blocked by the Cloudflare WAF. The requests that got through helped us create new detections to harden our security to benefit all Cloudflare customers.

Here we will explain how we set up the system, the types of attacks we tested, which attack vectors bypassed the WAF more easily, and how we fixed it. Most importantly, we share what we learned from this process and how this exercise is becoming a foundational building block of our WAF development lifecycle.

Finally, we offer guidance to help you correctly deploy your WAF in front of your application and, most importantly, patch your software. A payload that bypasses the WAF still needs an exploitable application to succeed, so keeping your stack up-to-date remains one of the strongest defenses against attackers.

How the adaptive loop works

To test our WAF with frontier models, we built a system that iterates over multiple scenarios. A scenario means choosing one attack category, placing the input in a specific part of the request, starting with a version the WAF already blocked, and giving the tester a fixed number of attempts to try other variations. The loop runs LLM models twice: the first is the proposal call, the second is the review call.

The first call receives the starting request, the context, a short history of earlier results, and suggests the next variation, then the code builds and sends the request. The review call receives the request context, response status, selected headers, and the response body. The loop stops when mutations stop producing useful variations or when a hard coded attempt limit has been reached.

Both model calls work without access to WAF internal information. Neither receives rule expressions, rule IDs, WAF Attack Score details, or the identity of the security layer that acted. We implemented the system in Python rather than wrapping an existing penetration-testing tool. It handles HTTP replay, scenario orchestration, state tracking, and result collection.

In the current implementation, the models do not send requests directly — code controls what happens at each step. Before each request, it checks the target hostname against an allowlist, disables redirects, records the attempt, and enforces the attempt limit. After each request, it records the response and uses the model's review to choose the next predefined step. Response text may appear in a later prompt, so the tester treats it as untrusted input. Neither model call can deploy a rule nor change enforcement.

The system records structured evidence for each attempt.

Six attack categories against one WAF configuration

The main run targeted an authorized customer staging environment protected by Cloudflare’s WAF. We used an allowlisted test User-Agent so the customer’s automated-traffic controls would not stop the test before requests reached the WAF.

We ran 45 scenarios. For each, we looked for ways to deliver the same attack differently: different encoding, different part of the request, or the same destination written another way. Of these, 44 covered six attack categories: cross-site scripting (XSS), SQL injection (SQLi), command injection (CMDi), server-side request forgery (SSRF), path traversal or local file inclusion (LFI), and Log4j. The remaining scenario covered log injection, reported separately.

The WAF in the test zone was configured as follows: WAF Attack Score blocking scores of 30 or below, all Cloudflare Managed Ruleset enabled, and OWASP Core Ruleset with Paranoia Level 3.

For the headline measurement, we recorded whether the WAF blocked each request or not. The results describe the configured WAF boundary as a whole, not the performance of any individual rule or detection mechanism.

What adaptation looked like in one recorded session

Here is an example of how the LLM adapts a Server-Side Request Forgery (SSRF) attack during the test.

Cloud metadata services can expose temporary credentials to workloads. An SSRF vulnerability can let an application fetch that data on an attacker's behalf. A WAF can help stop the malicious request before it reaches the application, but it is only one layer of protection.

In this SSRF scenario, the tester sent the same cloud metadata address in different forms (such as integer, octal, and trailing-dot representations of the same IP) and placed it in different parts of the request. The WAF blocked all of them except one. At attempt 18, the model kept the same request structure as the previous blocked attempt and switched to the trailing-dot form. The client encountered a redirect rather than a WAF block.

The table below shows selected moments from the session. The hypothesis column summarizes what the model said it was trying before each move. It is not a verbatim transcript, and it is not proof that the explanation was correct.

Attempts 17 and 18 are an interesting pair: same request structure, different host representation. One was blocked, one was not. That gave us a specific question: does the trailing dot change how the WAF reads the destination? It was a lead to investigate, but not proof that metadata was accessed.

This was one selected trajectory among 45 scenarios. The next section shows how we counted and triaged the full run.

What we found

Our tester generated 1,107 attempts and the overall result was strong with XSS, LFI, SQLi, and Log4j having near full coverage. While the run produced useful findings, it also produced noise. After human review, we were left with 49 findings worth investigating, 48 of them belonging to CMDi and SSRF. 

Here is how they break down:

Metric

Value

What it means

Recorded mutation attempts

1,107

Model iterations across 45 active scenarios; not all produced a usable result

Post-triage result set

607

The 558 blocked requests plus 49 documented WAF-relevant findings

Blocked requests

558

The WAF stopped these before they reached the application

WAF-relevant findings

49

Documented for remediation analysis after human review

The rest did not produce a result worth counting as the model failed to generate a usable HTTP request, some failed before reaching the target, or the payload generated was benign.

When a request was not blocked, we worked through five questions before counting it as a finding:

Question

Why it matters

Did the tester actually send a valid request?

If the model failed or the request never reached the target, the result tells us nothing about the WAF.

Was the request clearly not blocked?

An ambiguous response is not enough to count.

Was the request still malicious?

Changing a request to get it past the WAF can also make it harmless.

Did the behavior belong to the WAF?

Some attacks only work through DNS or network paths the WAF cannot stop at request time.

Could engineers reproduce it safely?

A fix needs a stable test case with a clear expected result.

We removed anything that failed those checks and combined duplicate cases. What remained became the input for rule, normalization, and mitigation work.

Findings became detections

Not every finding needed a new rule. Some pointed to gaps in existing Managed Rules coverage. Others pointed to how the WAF normalized the request or belonged to another security control. We replayed each case and decided where the change should happen.

We grouped related findings into four sets of candidate rules, validated each finding, and tested candidates against live traffic before any rule could protect customer traffic.

Before a new or updated rule can protect customer traffic, we check its impact on legitimate traffic and assess false-positive risk. Some of the issues we find when evaluating a new rule candidate include:

Issue

Next step

Missing or narrow detection

Review whether existing rules cover the finding

Equivalent inputs interpreted differently

Engine or normalization review

False-positive risk is too high

Revise or reject the candidate

This work contributed to three changes in Cloudflare's Managed Ruleset: new detections for SSRF – Obfuscated Host and SSRF – Restricted Protocol in the July 21 release, and improvement of the existing SSRF – Cloud rule. The SSRF – Obfuscated Host detection came directly from requests that encoded internal addresses in non-standard numeric forms.

What we learned

The model was only one part of the test. We ran the same scenarios with two versions of the same model family. They produced different variations – and the same underlying issues appeared in both. Because request replay and evidence capture stayed consistent, we could compare the runs without treating either model's output as ground truth.

More attempts within one scenario did not always find more. Some scenarios started repeating earlier ideas near the end of the 25-attempt limit. We got broader coverage by testing more starting requests, attack categories, and input locations instead of extending one sequence.

The model generated requests. We decided which ones mattered. A request that was not blocked still needed replay and human review before it could become a finding, a mitigation, or a regression test. Without that review, there were no findings.

What customers can do now

WAF is just one layer of detections you can deploy. When you deploy all available protections you increase the effectiveness of your overall stack. 

First of all, check that Managed Rules, WAF Attack Score are set up correctly in front of your application. Other tools you can deploy include API Security, Bots and Fraud detection, and Threat Intelligence to strengthen your posture even further. For example, positive security controls add a different layer: instead of looking only for known attack patterns, they define the request shapes an application expects and identify inputs outside that contract. This drastically reduces your attack surface area. 

Customers do not need to reproduce this experiment. To maximize the number of rules deployed in front of your application, we recommend running Managed Rules in log first, review matching requests in Security Events, and confirm legitimate traffic is unaffected before moving a rule to Block. Alternatively, customers can reach out to their account team to get Attack Signature Detection turned on, on their zones. This new feature simplifies how to review matched traffic and how to deploy signature detections. If you already perform application security testing, run those tests against a staging hostname protected by the same Cloudflare controls as production.

Next steps

By combining adaptive AI-driven testing with human triage and validation, we found detection gaps that fixed tests might miss and turned those findings into stronger WAF protections, improving our block rate. In a future post, we will share results from further testing using a white-box approach, where the model knows both the application’s vulnerabilities and the WAF rules protecting it.

Adaptive application security for the AI era: how Cloudflare connects code, traffic, and intelligence to stop attacks

Post Syndicated from Daniele Molteni original https://blog.cloudflare.com/ai-era-framework/

In July, AI agents testing new cybersecurity models compromised parts of OpenAI’s infrastructure and Hugging Face’s production environment.

We've all just witnessed one of the first AI-driven successful cyber attacks. When given a task, the agents ignored existing guardrails and autonomously discovered previously unknown vulnerabilities, recovered exposed credentials, moved between cloud environments and coordinated their work through communication channels they created themselves.

The speed of the final compromise was incredible. In under 13 hours, the agents went from executing code on a Hugging Face worker to gaining admin-level access across multiple clusters. But the incident had been brewing for much longer. Responders found clues of activity tracing back to May (agents created an unauthorized message board), to June (internal network scanning) and early July. The relationship between these events was understood only on July 20.

The lesson here is not that AI agents exploit vulnerabilities. That’s not news; human attackers already do that. The change is that agents can work persistently, test multiple paths simultaneously, share discoveries, and chain vulnerabilities, credentials, and permissions into sophisticated attacks.

The incident also shows why application security cannot depend on single tools. For example, network restrictions were bypassed by services connected to the Internet; valid credentials were used to perform unauthorized actions. Rebuilding Artifactory removed one attack path, but agents found another. The key insight is that individual alerts identified pieces of the activity without revealing the complete campaign. OpenAI reached a similar conclusion in its report: organizations need overlapping and independent controls across prevention, detection, and mitigation, continuous validation of security boundaries, and faster mechanisms to correlate and contain suspicious behavior.

We address this challenge by connecting application security across four activities that are too often separated: discovering which risks matter, governing what humans and agents may do, protecting applications at runtime, and turning every investigation into stronger protection. Cloudflare can deliver this framework because of its broad security portfolio and visibility across a vast share of Internet traffic.

Alongside the framework, we connect existing Cloudflare solutions with new capabilities across each stage. These include: using Large Language Models (LLMs) to conduct a penetration test of our Web Application Firewall (WAF), expanding threat intelligence to all customers, and a new feature to automate deploying positive security.

What has changed

The security landscape is shifting. These are the emerging trends we see:

  • The way we build software has fundamentally changed. AI-assisted development allows engineers to produce and deploy software faster outside traditional engineering workflows. That speed creates both more code and more opportunities for vulnerabilities to reach production.
  • Software composition risk is still a risk: applications depend on large chains of open-source libraries, packages, and operating-system components that are intrinsically trusted and are difficult for any team to inspect. What’s new is that AI is now importing libraries that we might not be aware of.
  • Techniques and tactics are changing. LLMs can chain vulnerabilities and use feedback in real time to mutate payloads, evade defenses, and make decisions autonomously. They can operate continuously and at machine speed. Patching faster remains important, but patching alone cannot close the gap. Attackers are always going to be faster than you can update your systems.
  • Agentic traffic. In the past, automation was a synonym for malicious activity. Today, a request generated by an agent or bot may be malicious automation, a search crawler, or an agent purchasing a product on behalf of a customer.
  • Compromised servers, residential proxies, IoT devices, and cloud resources allow attacks to move quickly across infrastructure and identities. A coordinated attack can leverage a number of devices, making it difficult to be identified as a unique campaign.

Application Security’s goal is also expanding. It now needs to address three connected problems: protecting conventional applications from AI-enabled attackers, governing legitimate and malicious agentic clients, and securing applications that contain models, agents, tools, and data.

A connected application security framework

Application security in the AI era must operate as a continuous system rather than a collection of controls that teams update after each new vulnerability. To protect applications in the era of AI, you need to work on multiple activities, which we have organized around four stages:

  1. Discover and prioritize risks
  2. Govern access and agent behavior
  3. Protect applications at runtime
  4. Investigate, respond and learn

None of these activities is new in isolation. What changes is connecting them so discoveries, runtime signals, and investigation outcomes continually improve the controls that follow.

More than 20% of the web sits behind Cloudflare’s network, which gives us visibility into attack infrastructure, payload mutations, emerging techniques, and coordinated campaigns at a scale that few organizations can match. Patterns that look isolated from the perspective of one application can become clear across our network. This combination of global threat intelligence, local application context, and inline enforcement powers every stage of the framework. That local context includes which code is deployed, which endpoints are exposed, what legitimate traffic looks like, which identities are acting, and which controls are already active. Because Cloudflare is inline, we can turn those insights into protections immediately.

Cloudflare is the adaptive security control plane for applications, APIs, and agents. Here is what we are launching today to advance every stage of the security journey.

Discover and prioritize risks

Security teams do not suffer from a shortage of findings. They struggle to determine which findings represent an immediate risk. A useful discovery system must connect vulnerabilities to the production reality, including whether a vulnerability buried in your stack is actually reachable in the first place. We see three main areas you should look into: software composition risk, proprietary code, and runtime penetration testing (pentesting).

Understand software composition risk

Applications inherit risk from open source libraries, packages, operating-system components, and the services on which they depend. This represents the Supply Chain of your application. A package vulnerability alone does not tell a team whether the affected component is deployed, reachable, or exposed to hostile traffic. Open-source software is the top priority when it comes to supply chain risk, and Cloudflare is part of Chainguard Athena, an industry coalition aiming at protecting open-source software from AI attacks.

Scan proprietary code

When it comes to code scanning, you have two options: getting a managed service or developing in-house expertise to run it yourself.

Cloudflare recently announced early access to Vulnerability Discovery and Remediation, a service that uses frontier models to identify application-specific vulnerabilities and deploy WAF mitigations to block targeted exploits while engineers fix the code. The important step is prioritization. Cloudflare connects source-code findings to production traffic and security signals. We can identify whether the affected route is active, and how much traffic it receives.

Pentest your application at runtime

Defenders can also use the same capabilities as attackers. Customers can build their own LLM-based pentesting harness to search for weaknesses, validate findings, and test whether their applications are vulnerable. Discovery becomes continuous rather than a periodic exercise. We have done this internally at Cloudflare since Anthropic’s Claude Mythos was released, and we shared our learnings.

A vulnerability buried deep inside your code is harder to exploit if it can’t be reached from the outside. Our Security Analyst team has already used LLM-based red teaming to test customer applications and our own runtime detections, turning the findings into improved detections for all customers. We are now developing Adaptive Security, a self-service capability that will periodically pentest selected URLs behind Cloudflare, using LLM-powered agents to identify vulnerabilities that are reachable and exploitable before attackers find them.

Govern access and agent behavior

Agentic traffic operates in the space between automation and human: tasks delegated by people, executed by software. This changes how access decisions must be made. Detecting automation is no longer enough. For every interaction, application owners need to answer two questions: Is this entity who it claims to be, and can this interaction be trusted?

These questions can be hard to answer. A recognized agent with a long history of legitimate activity may have high trust, but an unusual action can still create immediate risk. An unknown agent may simply be new; a lack of history does not necessarily mean malicious intent. Cloudflare’s approach is to keep trust and risk signals separate, thereby giving application owners more control than a single bot score or allow-or-block decision, and providing more powerful tools to quickly adapt to change.

Establish identity and trust

Trust accumulates over time, while risk is evaluated for each interaction.

Botbase provides a directory of known automated entities that have registered with Cloudflare. Registration gives legitimate bots and agents a way to declare who they are, while application owners retain control over whether and how those agents may access their sites. Cloudflare is also making registration more accessible to smaller and custom agents, building a verified identity layer across all agentic traffic, not just the major platforms.

Identity alone does not establish trust. Cloudflare can evaluate whether an entity has been seen before, whether its historical behavior was legitimate, and whether its current activity is consistent with that history. This makes it possible to distinguish a recognized agent behaving normally from the same agent suddenly changing established request patterns, location, identity, or transaction behavior.

Understand agentic behavior across the journey

Precursor adds client-side and session-level signals to distinguish human from automated behavior, such as typing cadence, mouse movement, navigation patterns, and sequences of actions. An agent that navigates a checkout flow in two seconds, skipping the browsing and comparison steps a human would take, reveals its nature through the session. These signals help identify whether behavior across a session is consistent with human interaction or automation, giving application owners a clearer picture of the traffic they're managing.

Manage access and adapt

Application owners can block traffic from AI crawlers and decide what activity is allowed on their asset (e.g. search, training, etc.). Adaptive Intelligence combines network, client-side, historical, and behavioral validation signals in a probabilistic model that can be updated as attackers change their techniques. Customer outcomes, including chargebacks and successful legitimate transactions, can feed back into the system to improve future decisions.

The result is a continuously updated assessment of every entity and interaction. Application owners can encourage known, useful automation while applying stronger controls when identity, history, and current behavior indicate greater risk.

Protect applications at runtime

Cloudflare’s reverse proxy protects applications at runtime by filtering traffic before it reaches the origin. In the AI era, a new layered approach is emerging to best filter traffic from malicious requests:

  1. Enforce positive security
  2. Detect attacks and identify LLM tactics and techniques
  3. Protect business logic
  4. Deploy real-time threat intelligence

Enforce a positive security model

You can dramatically reduce the attack surface by learning what legitimate traffic looks like, allowing conforming requests and blocking everything else. Today we are announcing Application Profiles, which automatically learns the structure of your web or API application and detects non-conforming requests. Application Profiles automates the learning process and adds a layer of interpretation. Based on the learned profile, we can understand the business logic of different endpoints and request parameters and help you prioritize what endpoints require more scrutiny and attention.

Detect attacks and identify LLM tactics and techniques

Traditional WAFs are designed to run highly crafted rules to detect Common Vulnerabilities and Exposures (CVEs) and malicious payloads. Before AI, the time to disclose new vulnerabilities was measured in months and days. Not anymore: now we see vulnerabilities being exploited before they are disclosed, so the time to patch is nearing zero.

Different tools can be deployed to detect known exploits. These tools include:

  • Managed Rules hardened with frontier models. We’ve partnered with major model providers to use frontier models for adversarial validation. We used the latest models to pentest the WAF to uncover bypasses and vulnerabilities. All customers benefit automatically from ongoing improvements.
  • Machine Learning detection. While signatures are great for high-precision attack detections, machine learning can stop attacks before they are discovered and disclosed. Attack Score detects attack mutations and evading techniques that are often used by LLMs. Attack Score is available to all Cloudflare Customers
  • AI Security for Applications. Chatbots and Internet-facing LLMs are subject to a new class of attacks, such as prompt injection and sensitive data exposure. You can protect generative AI traffic by deploying guardrails and security detections designed to stop these attacks.

Protect business logic

Attackers can still craft legitimate requests and abuse business logic to gain advantage on the application. For example, an attacker uses a valid password-reset flow repeatedly to take over accounts. Fraud detection tools, including account takeover and leaked credential detections, help prevent abuse in which the request appears legitimate, but the intent is malicious.

Real-time threat intelligence detection

Back in June, we launched always-on detection based on our threat intelligence feeds. Cloudforce One customers can deploy protections to block requests originating from compromised infrastructure. We are now also expanding access to Cloudforce One’s Threat Events Platform, our core threat intelligence offering, to all Cloudflare accounts for free.

Investigate, respond and learn

The OpenAI Hugging Face incident did not begin with the final 13-hour compromise. The activity stretched from May to July, with signals including an unauthorized message board, internal network scanning, and movement across environments. Viewed separately, each event revealed only part of the activity. Together, they showed the behavior of a developing breach. Security operations must therefore identify sequences of behavior that lead to compromise, not simply evaluate alerts in isolation.

This is difficult for security teams that already protect large attack surfaces with limited resources. Alerts arrive from different tools and datasets, leaving analysts to determine which events are connected, collect the evidence, and identify whether the activity is escalating.

Cloudflare is building a platform to automate security operations. Deterministic workflows establish the customer and investigation context using trigger history, traffic baselines, enforcement outcomes, and network observations. A detection agent searches authorized datasets for anomalies and correlations. When it finds suspicious activity, specialist agents review the evidence alongside customer history and threat intelligence, helping analysts connect isolated events to broader campaigns. The system can then recommend mitigations, such as rate limiting, WAF, or DDoS protection changes, for human approval.

We are developing these capabilities with Cloudflare’s Managed Defense team, whose analysts are helping us test how evidence is collected, correlated, and turned into recommendations. We plan to make them available more broadly over time and will share more as this work progresses.

Cloudflare’s combination of reverse proxy and forward proxy services makes this correlation especially powerful. Application Security signals can reveal attempts to exploit a public-facing application, while Cloudflare One can surface subsequent activity across corporate traffic. Connecting these datasets can link an external attack with unusual access, internal scanning, or potential lateral movement, turning separate alerts into a timeline of compromise and helping analysts intervene before the breach progresses.

Looking ahead

AI is changing how software is built, how attacks unfold, and who interacts with applications. Security teams can no longer manage discovery, access, runtime protection, and response as separate activities.

Cloudflare is bringing these capabilities together in a closed-loop system powered by global intelligence, local application context, and inline enforcement. A vulnerability finding can strengthen runtime protection, runtime activity can guide an investigation, and each analyst decision can improve future detections and controls.

No organization can anticipate every new technique. The goal is to build a security system that learns from each attempt, responds faster, and becomes more effective over time. The capabilities announced today are the next step toward that adaptive model of application security.

When scanners miss the attack: how Cloudflare Client-Side Security protects storefronts

Post Syndicated from Juan Miguel Cejuela original https://blog.cloudflare.com/client-side-security-finds-4-malicious-campaigns/

A modern storefront can look perfectly healthy while malicious JavaScript works underneath: siphoning affiliate revenue, hijacking searches and clicks, tampering with analytics, or asking a remote server what to execute next. Pages load, products appear, and checkout works — yet the browser may be quietly doing something the site owner never authorized.

That is the blind spot our Client-Side Security machine learning (ML) model is built to expose. This post follows four operations, spanning eight payloads, that our Page Shield ML uncovered in the wild. 

The detection of these malicious payloads was automated; humans verified each finding only after the system had flagged it. When we afterward reviewed the campaigns using security scanning tools, seven of the eight payloads were entirely absent from VirusTotal, and URLScan returned no malicious verdict for any of them. Page Shield ML, meanwhile, caught all eight in live traffic.

For instance, while security research documented the broader Lnkr family years earlier, one specific payload version sat indexed by URLScan for nearly two and a half years with “No classification,” including during a direct scan in January 2024. Only in this case had VirusTotal ingested the payload earlier: while it currently flags the script as malicious, public history does not reveal when that verdict was first assigned. Meanwhile, Page Shield ML independently surfaced those exact bytes live on an online retailer's storefront. More broadly, a hash can be known long before the code behind it is classified as malicious. If your defense waits for that label, you are already late. You need ML that can unravel the JavaScript itself and judge it at scale.

Indeed, seeing a file is not the same as understanding it. The tricky part was that the four operations shared no universal signature or common concealment technique. One remained dormant unless the device, country, time, referrer, or browser state matched what it was waiting for. Another concealed a clickless affiliate request within an invisible iframe. Others intercepted clicks, suppressed monitoring, or conditionally loaded additional code from remote servers. To catch them, you have to watch how those pieces work together: when the script wakes up, what it hides, what it intercepts, and what it fetches next. Checking the page once is not enough; as these cases show, such scripts are built to stay quiet until the right victim shows up. That is why ongoing browser visibility makes the difference between catching an attack and missing it entirely.

How we detect and label JavaScript at scale

The same GNN (graph neural network) that flagged the four operations in this post had already caught malicious npm packages and an in-the-wild Magecart payment skimmer. The GNN does not treat JavaScript as a flat chunk of text; it reasons through the code as a graph: a syntax tree connecting code symbols and exposing what calls what, what the attacker tried to bury, and what still phones home. That structure helps it recognize suspicious patterns across minification, renaming, and some obfuscation without relying on a known URL or byte signature. 

The few scripts that the GNN flags as malicious (under 0.3% of all analyzed traffic) go to a lightweight large language model (LLM) on Workers AI for a live second opinion. This further reduces false positives while keeping recall high. When the LLM corroborates the GNN, customers are alerted.

To investigate the most complex scripts at scale, we use a cohort of frontier models, which we call teachers (an ensemble of automated judges). The cohort draws leading models from around six different families, including open-weight models running on Workers AI. We spin up each as an agent to analyze the same suspicious script in its own fresh, independent session. When useful, their agentic tool access lets them use a restricted JavaScript evaluator to unpack small snippets and reveal concealed behavior. We will soon extend this workflow with Cloudflare Sandbox for deeper analysis in isolated environments.

The frontier models sometimes disagree, especially on the most intricate scripts. We treat that disagreement as signal, not noise. Each label becomes a vote, weighted by the model's score in the Artificial Analysis Intelligence Index, producing a probability distribution over four labels: benign, payment skimming (magecart), other malware, and cryptomining. Human reviewers therefore need only examine scripts flagged as malicious or lacking a clear two-thirds majority. We then feed those label distributions back into GNN training, helping it distinguish ever more nuanced cases. This feedback loop is still partly manual, though we are starting to automate it.

Four malicious JavaScript operations we caught

These four operations do very different things, from commission theft to stolen analytics on shoppers the store already paid to acquire. Stealing a commission is not like skimming a credit card; likewise, hijacking search is not like stealing a password. If an ML model only knows one of those tricks, it will sleep through the others. Instead, our Page Shield ML has to stay attuned to every kind of hostile behavior. 

Now, let’s dig deeper into each operation and how it worked.

Operation 1: The after-hours affiliate-commission hijacker

Picture a quiet Sunday afternoon: a shopper on a phone taps a product. Instead of following the tap normally, the script opens a product or campaign landing page from an attacker-preselected list in a new tab and sends the original tab through an affiliate route. The storefront still appears to work. If the shopper completes a purchase (either then or later), the detour hijacks the attribution, crediting the sale (and any resulting commission) to an account that did not earn the referral.

What the shop lost

The shop could pay an unearned commission to an account that did not bring the shopper. Worse, if a legitimate partner had made the referral, the forced request could misattribute it, diverting credit and a potential payout from the partner who did the work. The damage could outlast one commission: partners who stop trusting the attribution system may also stop trusting the retailer behind it.

Attack chain

Qualified mobile visitor → intercepted product tap → script-selected page opens in new tab + original tab follows attacker’s affiliate route

How it stayed hidden

We found five related script builds: two active and three paused when captured. Each active variant uses a different set of gates before it acts, checking things like the visitor’s device and local time, whether the trick has run recently, whether a product button has appeared, and whether someone actually clicks it. That maze of rules keeps the malicious behavior out of sight during a brief automated visit unless the variant’s specific conditions are met. The active scripts use a MutationObserver (a JavaScript API) to watch for product tiles and buttons that dynamically appear after the page is first loaded. This lets them intercept clicks on those late-arriving elements, while a crawler that loaded the HTML once and stopped there could miss the redirect path entirely.

In the active later variants, the script intercepts a qualifying click and writes a three-day cooldown to localStorage (staying dormant on that device for days). It then executes a dual-tab maneuver: popping an attacker-chosen product page into a fresh tab to keep the shopper engaged, while the original tab takes a quick, unnoticed round-trip through the attacker's affiliate tracking link and back to the shop, to plant the attacker’s attribution cookie in the background. Console masking and self-defending source checks make inspection harder, while the cooldowns and narrow schedules limit how often the malicious path can appear during otherwise normal shopping.

The following sanitized excerpt shows how the payload hooks dynamic product tiles and executes the dual-tab detour. We simplified identifiers, reformatted the code, and neutralized destination URLs for readability.

The paused builds showed how the campaign could go dark without removing the script. Their embedded configuration set status: "paused", so they exited before installing click handlers. These paused scripts carried different per-shopper cooldown configurations (3, 4, and 5 days). One of the paused scripts even recorded a version-history comment explicitly documenting that the campaign was paused after Black Friday.

To reach visitors in the first place, the operation leveraged the site's marketing supply chain: the third-party scripts and tag managers embedded by e-commerce sites to track ad campaigns and analytics. One confirmed delivery path ran through two otherwise ordinary tag managers: Google Tag Manager → another tag manager → malicious script. That is how the payload reached the browser, not proof that either tag manager was compromised.

The attacker even disguised the domain hosting the script to pass a quick marketing review. One delivery host hid in plain sight: adtargett[.]com differed by a single “t” from adtarget[.]com, an advertising domain registered in 1998. The lookalike was registered in 2025 and, when we checked, its homepage called itself “Adtarget.com – Performance Marketing Agency.” This is typosquatting: by mimicking a real ad agency, the host blended in with routine marketing tags, quietly serving the malicious payload that hijacked shopper clicks and redirected them through affiliate payout links.

Operation 2: The clickless affiliate theft

While the first scam still needed a click, this one requires even less. A shopper can open a booking page, linger over the product options, and never touch an ad. In the background, however, the script might have already sent an affiliate request that could make a later sale look as though someone else had referred the shopper. Indeed, when the script’s conditions are met, the payload sends that request through a hidden iframe or a link that clicks itself.

What the shop lost

For the affected tourism business, the attack could corrupt the economics of customer acquisition: a legitimate booking or purchase could be credited to an unearned affiliate account. The code proves covert, automated affiliate requests, but whether any specific request resulted in completed attribution, account crediting, or paid commission in practice remains unobserved.

Attack chain

Time-gated browser → covert affiliate request (off-screen iframe) → 1-hour throttle cookie → when blocked, automated hidden-link click fallback

How it stayed hidden

The script conceals the affiliate request in two layers: selective execution (a pre-flight network gate and hourly schedule), and stealth delivery (an off-screen iframe). The first layer is surprising because its country labels are disconnected from actual geography: neither the shopper’s nor the shop’s location drives the choice.

First, the script calls a public IP-based geolocation service but ignores everything it returns, including the shopper’s country. We could not determine why it required a successful response while ignoring the returned data; this may have been intended to confuse investigators or simply been a remnant of an earlier version. Interestingly, if the geolocation request fails, the script silently stops; its promise chain ends with .catch(() => {}). Although intent is unproven, this fail-closed behavior could help the script evade network-restricted sandboxes.

Next, instead of using the fetched geolocation data, the payload contains three TradeDoubler (an affiliate-marketing network) configuration objects labelled {AU, US, and UK}. These settings blocks are embedded in the code, and each contains an affiliate URL and start and end times. The script computes Asia/Kolkata time in JavaScript, checks those configured time windows, then applies fixed odd/even-hour rules to choose one of the three or else skip the affiliate request for that run. The choice is deterministic. 

Together, the schedule and browser-state checks create time-gated selective execution, a form of cloaking. When those conditions do not line up, the affiliate behavior stays dormant, so a one-off inspection can miss it.

Once the script chooses a configuration, it writes a local cookie named affiliateClicked_<market> as a one-hour retry throttle so it will not re-fire for that region right away (this is a client-side throttle to avoid noise, not an affiliate-network attribution cookie). Next, it loads that affiliate URL in an off-screen iframe with the referrer suppressed. The iframe is the primary delivery path, but it carries an aggressive fallback: if the iframe errors or fails to finish loading after one to two seconds, the script creates a hidden link (<a>) without a target attribute and clicks it programmatically, which could navigate the user's active tab. To the qualifying shopper, nothing seems out of place: they never see an ad, never have to click, and can close the tab as if nothing happened.

As for the script’s obfuscation, it is simple but effective: even property names are assembled one character at a time. The following sanitized excerpt shows the payload creating an invisible off-screen iframe. We renamed key identifiers and reformatted the code for readability. The destination has been removed.

Operation 3: The old search saboteur, now storefront backdoor

Years ago, the Lnkr malware family made the news by hiding inside shady browser extensions, intercepting Google and Bing searches to redirect results and pocket ad money. Now, attackers repurposed the codebase to plant a backdoor into an online retailer’s website.

Because the script was running on a shop rather than a search engine, its old redirect tricks stayed dormant. This time, the script was used to send telemetry back to the attacker. More dangerously, it gave the attacker a remote doorway to arbitrarily download and run fresh JavaScript in customers' browsers whenever they wanted, without touching a single file on the server. It even carried an old trick from its extension days: shutting itself off if someone typed words like “virus” or “popup” into Google. From the outside, the store kept selling without a hint that anything was wrong.

What the shop lost

The shop lost control over what code runs in its customers' browsers. Attackers were secretly tracking visitors' sessions and had a direct backdoor to push and run any JavaScript they wanted on the storefront at any time.

Attack chain

HTML-referenced script → analyst evasion gates → parallel host-gated branches (dormant search vs. live backdoor) → arbitrary remote JavaScript execution

How it stayed hidden

Unlike campaigns delivered through tag managers, this script was directly embedded into the merchant’s HTML. We could not determine the exact initial intrusion vector; in practice, direct HTML insertions usually happen through compromised store admin credentials, an unauthorized template edit, or an infected third-party theme or plugin.

Under the hood, the script is a modular toolkit carrying both active and dormant code. Its older modules (transparent click overlays, search-engine query interceptors, extension-store link rewriters, and redirects for typosquatted domains, like buking[.]com instead of booking[.]com) only wake up on specific target sites, so they stayed turned off on this storefront. Several embedded domains (sugabit[.]net, votetoda[.]com, cdnpps[.]us, and telemetry endpoint hanstrackr[.]com) sat inside these disabled modules.

On the shop, the active branches focused on evasion, telemetry, and remote control:

  • Playing dead for security researchers. An evasion trick inherited from its browser-extension days: the script monitored search inputs and URL queries for telltale adware terms. Searching one security keyword paused the script for that visit. Searching two or more wrote a persistent opt-out record to localStorage, permanently silencing the script on that analyst's machine so repeated tests would find nothing. While originally built to dodge analysts on search engines, as far as we could determine, this check was hard-coded specifically to Google search URLs and remained dormant on the merchant's storefront.
  • Dynamic remote code execution. The script didn't need to modify the storefront to change its behavior. While the hardcoded domain names (scrprime[.]com, youronlinesearches[.]com, jullyambery[.]net) remained identical to older captures, what those endpoints returned was entirely up to the attacker. The script could phone home visitor telemetry, ask those servers for new instructions, and pull down fresh JavaScript directly into the shopper's browser. Effectively, this gave attackers a live backdoor to run arbitrary code on the storefront. We could not determine what second-stage payloads were served in practice.

All in all, a static snapshot of the site showed only the normal storefront, while the underlying state checks, anti-analysis traps, and remote-loading branches exposed the backdoor.

Operation 4: The paid-mobile cloaker

The shop already paid to bring this visitor in from a mobile ad or marketing campaign. The malicious script lets that visit through, then cuts off the merchant's visibility. Analytics go dark, the live support chat vanishes, and a rogue observer starts recording telemetry on the very session the store just bought. 

Behind the scenes, the payload refuses to run unless that visit matches an elaborate set of conditions: the exact target storefront, a narrow mobile screen, and a campaign tag during the first two pages of the visit. It stays dormant on laptops, corporate networks, cloud providers, and VPNs, so the engineers most likely to debug the page never see it fire. The script also stays dormant across selected US cities and regions, backed by a handcrafted denylist of 325 IP strings to dodge automated scanners and security analysts. Only then does the script attempt to tear down the shop’s monitoring, substitute replacement advertising and analytics identities, and phone home. A second look from the wrong device or network will never trigger it. All the while, the storefront keeps selling.

What the shop lost

For a direct-to-consumer retailer, the malware specifically targeted high-value traffic the store had paid to acquire through paid-search and marketing campaigns (ppc, cpc, sms, paid). Those customers could still buy. Yet the shop faced three clear threats: diverted advertising attribution and unearned publisher payouts, the loss of critical session analytics across nine observability tools, and the suppression of the help chat and contact form (preventing shoppers from asking questions or reporting anomalies). Dynamic analysis in a sandboxed browser environment confirmed that the replacement analytics script loaded and fired a tracking beacon (an invisible network request sent to log visitor activity), but whether the attacker successfully captured session telemetry or diverted ad revenue in practice remains unproven.

Attack chain

Campaign-tagged mobile arrival → multi-tier cloaking & network gates → monitoring sabotaged → advertising, analytics, and support controls rewritten 

How it stayed hidden

To blend into the store's marketing supply chain, the attacker delivered the payload from sdk-amazonaws[.]com, a lookalike domain registered in 2024 and wholly unaffiliated with the official Amazon Web Services domain (amazonaws.com, registered in 2005). To compound the deception, the attacker prefixed the domain with a subdomain mimicking a popular e-commerce marketing platform too. This stacked, double-trusted-brand typosquat forged a convincing disguise, engineered to slip past quick tag reviews. Neither Amazon Web Services nor the impersonated marketing platform was involved in the attack or suffered any compromise.

Once loaded in the browser, the script executed an exceptionally dense gauntlet of cloaking gates before triggering its main payload:

  • Target host and browsing context. The script verified that window.location.hostname matched the specific merchant host it was built to target (exiting immediately anywhere else), ensured the current window was top-level (not an embedded iframe), and checked that the path did not contain /challenge. It also verified that tracking marker cookies (_cart_dr and logoalt) were not already present in the browser.
  • Device and campaign filtering. The visitor's viewport width had to be narrower than 477 pixels (a handheld smartphone). Furthermore, the visitor had to arrive via a first-touch (the visitor's initial referral) campaign tagged with one of six specific UTM mediums (Urchin Tracking Module, standard URL tags used to track marketing campaigns): ppc, cpc, sms, paid, flow, or campaign. It also had to be the first or second page load of their session. Curiously, while the code contained a nominal non-UTM path, it required the session page count to be simultaneously greater than -1 and less than -2 (a mathematical impossibility that left that branch completely unreachable). This could be yet another diversion technique or a code change leftover.
  • The "random" gate that always passed. The code featured what looked like a probabilistic throttle (Math.random() <= threshold) to make execution appear intermittent. However, when we solved the deobfuscated arithmetic, the threshold reduced to exactly 1. Because JavaScript's Math.random() always returns a value strictly below 1, this gate always evaluates to true. Like the unreachable non-campaign branch, this is a condition that never actually decides anything. It may be a leftover throttle, or purposeful camouflage for anyone reading the obfuscated math. Either way, the captured payload never used it to skip a qualifying visitor.
  • Third-party IP intelligence. The script queried an external third-party IP intelligence API using an embedded key. It required a U.S. mobile consumer connection, while immediately bailing out if the response flagged a business network, hosting facility, cloud provider, bogon, Tor exit node, VPN, proxy, relay, or general threat indicator.
  • Geographic exclusions. The payload did not activate for visitors from specific regions (US-NY, US-CA, and US-NHDD) or from cities named San Francisco, Plymouth, Compton, Hopkinton, and Lafayette.
  • The 325-entry IP substring trap. The script checked the visitor's IP against an embedded denylist containing 325 full IPv4 address strings. After deduplication, these represented 313 unique addresses across 249 distinct three-octet prefixes. Rather than performing structured CIDR (Classless Inter-Domain Routing) subnet matching, the author simply stripped the final octet from the visitor's IPv4 address and ran a raw substring search: !denylistString.includes(visitorPrefix).

In stripped-down pseudocode, the multi-layer primary activation funnel looks like this:

Sabotaging observability and hijacking identities:

Only after every primary gate passed did the script execute its payload:

  • Blinding monitoring tools. It searched the DOM and removed script tags for nine different observability and analytics services: Lucky Orange, Segment, Optimizely, New Relic, Bugsnag, LogRocket, Hotjar, Microsoft Clarity, and the store's Google Tag Manager container (GTM-<redacted>). In remaining inline scripts, it string-replaced references to these tools with undefined dummy identifiers (hji0) so calls to them failed silently, attempting to blind the store's error reporting and monitoring.
  • Suppressing customer support. It injected CSS and removed elements to hide its support-chat and contact-form containers, cutting off the customer's direct line to store support.
  • Replacing advertising and analytics identities. It purged Google Ads globals (google_ad_modifications, adsbygoogle), tore down existing ad slots (ca-pub-<original>), and loaded Google Ads under a replacement publisher ID (ca-pub-<replacement>). It then injected a new Microsoft Clarity session-replay script configured with a rogue, replacement project ID.

Simpler independent beacons and the 600-day marker:

In sharp contrast to the elaborate primary cloak, the payload also contained secondary beaconing branches (standalone routines that quietly ping an external server to confirm a visit) that completely bypassed the viewport, hostname, campaign, geography, and IP gates. If the visitor was on their second page or beyond, the script wrote a persistent cookie (_cart_dr=1) with an expiry of exactly 600 days (51,840,000,000 milliseconds) and fired an invisible zero-pixel image request to a remote telemetry endpoint on maper[.]info (a tracking beacon used to log that the browser reached this step).

A separate branch checked for an alternate marker (_logo_alt), which would trigger a second telemetry .png beacon (a cookie this script looked for, but never wrote itself; likely planted by a companion script). This gave the attacker a simple, persistent hit-counter to log basic traffic for all visitors (IP and User-Agent logged at the endpoint) across the entire store, while keeping their high-risk ad-hijacking routines strictly hidden behind the mobile cloak (high-value paid arrivals). It shows why analyzing only one visible effect does not reveal the full reach of a multi-purpose payload.

Indicators of Compromise (IOCs)

We are publishing these indicators to help security teams and researchers detect and hunt these campaigns across their own environments. All indicators are drawn directly from captured payloads and their network connections. Listed URLs are defanged. Some indicators have been withheld or generalized because publishing them could inadvertently divulge the identities of affected organizations. Listed domains reflect infrastructure observed participating in the delivery, redirection, or telemetry chain during these attacks; inclusion does not imply that a shared service or hosting provider is exclusively malicious.

Four lessons for defenders

Taken together, the operations tell one escalating story: attackers changed the objective, delivery path, and disguise, but the browser still had to execute their logic. Four lessons stand out.

Behavior beats signatures. These operations pursued different forms of monetization and manipulation, but every payload still had to act in the browser: observe events, inspect state, alter the page, schedule work, make network requests, or load another stage. That is what structural analysis looks for: the logic a hostile payload must carry, even as URLs, signatures, and objectives change.

Selective execution is part of the attack, not a footnote. Device, time, geography, referrer, session, network, and cooldown gates can all defeat a crawler that visits once and takes a static snapshot. Continuous visibility matters because an attack may appear only to one browser, in one state, at one moment. 

Obfuscation raised the cost of analysis, but in these cases it did not prevent detection. Self-defending loops, console suppression, debugger traps, rotated string tables, and dead branches complicated analysis. Page Shield ML still surfaced all four operations despite those barriers. Fast in-house models surface the suspicious code at scale, while frontier models investigate the hardest cases. Their disagreements highlight the trickiest obfuscation and logic, helping us narrow our focus.

Context completes the picture. Code that looks ordinary in isolation can reveal its malicious role once defenders link static analysis with dynamic context: how it arrived, which browser state activated it, what connections it opened, and what it actually did at runtime.

Continuous visibility into client-side execution

These four operations relied on different layers of misdirection, but they all shared one constraint: their JavaScript had to execute in the browser. Public scanners and static crawls can miss gated behavior. Continuous observation helps clarify what the code actually does when real visitors interact with the page

Cloudflare Client-Side Security provides that visibility across all plans. You can turn on Continuous script monitoring under Security settings to track first- and third-party scripts on your storefront, while automated malicious-script detection and alerting are available with Client-Side Security Advanced. You can review script activity and manage detections directly in the Cloudflare dashboard.

Automatic Key Exchange: faster, post-quantum secure origin handshakes for 45 billion daily connections (and counting)

Post Syndicated from Suleman Ahmad original https://blog.cloudflare.com/automatic-key-exchange-for-origins/

Every time Cloudflare opens a new TLS 1.3 connection to an origin server, we have to make a guess: the protocol requires us to commit to a key agreement algorithm in the very first packet we send, before the origin has told us anything about itself or what it can support. If we guess right, the handshake completes in one round trip. Guess wrong, and the origin replies with a HelloRetryRequest, we start over, and the connection costs two round trips.

For years, our guess was the same for every origin on the Internet: X25519. Widely supported, but as it turns out, suboptimal for roughly 30% of the origin connections we've since measured.

Today we're announcing Automatic Key Exchange, an extension of Automatic SSL/TLS that replaces the guess with a measurement. We probe each origin to learn which key agreement algorithms it supports and prefers, then lead with that algorithm on the first try, preferring the post-quantum hybrid X25519MLKEM768 wherever the origin can speak it. 

With the ongoing rollout of Automatic Key Exchange across origin connections, HelloRetryRequests fell from roughly 52% to 3.7%, cutting more than 150 ms off connection handshake latency at p90. In addition, as part of our ongoing rollout, hundreds of thousands of domains now have post-quantum origin connections that nobody had to configure, with that number growing daily.

While the milliseconds are important, that second part may matter more. Somewhere right now, an adversary is recording encrypted traffic it can't read yet, betting that it will be able to in the future (an attack known as harvest-now, decrypt-later). Cloudflare is sprinting to make the Internet quantum-secure by 2029, the year some industry experts estimate classical encryption algorithms could be breached. That day has a name: Q-Day. Meeting that deadline can't depend on millions of website operators each becoming expert cryptographers. It has to be automatic. Until today, preferring post-quantum connections required a manual setting: either you turn them on from Cloudflare’s side, or you have your origin server insist upon them. It was easy to get wrong. But today it’s just … automatic!

TLS 1.3 handshake: guessing the key exchange algorithm

Every secure web connection starts with a TLS handshake, which authenticates the server and derives a shared secret key. Our previous Automatic SSL/TLS blog posts cover that process in detail.

As Cloudflare operates as a reverse proxy, what appears to be a single secure connection is actually two: one between the visitor and Cloudflare, and a second between Cloudflare and the origin server. Each connection operates independently, with its own handshake, identity checks, and encryption keys.

Automatic Key Exchange affects the second connection. When Cloudflare connects to the origin, Cloudflare acts as the TLS client and must begin the handshake. We initiate the connection by sending a ClientHello message containing the hostname and a list of supported key agreement algorithms.

In the happy path, TLS 1.3 can establish a new encrypted connection in just one network round trip (shown on the left in the diagram above). In this case, Cloudflare sends a ClientHello listing its supported key agreement algorithms, along with one or more client keyshares. If the origin accepts that choice, it responds and the handshake completes. This predictive key exchange is an innovation of TLS 1.3, and a large part of why it’s faster than TLS 1.2.

Otherwise, if the origin prefers a different option, it sends a HelloRetryRequest (HRR) and asks Cloudflare to try again (the flow on the right in the diagram above). Cloudflare then sends a second ClientHello, generating a new client keyshare based on the key agreement algorithm specified by the origin. The connection still succeeds, but the retry adds a full network round trip before Cloudflare can fetch content. This is like missing a shortcut in Mario Kart: you still reach the finish line, but you lose the time the shortcut was supposed to save.

Either way, using the client keyshare, the server generates the shared key. The server then returns a server keyshare with which the client can also compute the shared key. This shared key is used to protect the rest of the connection using symmetric cryptography, such as AES.

The cost of the safe guess

For years, our initial client keyshare guess for origin connections using TLS 1.3 was static; we'd always send X25519 while advertising support for other key agreement algorithms. This was a safe strategy because over 95% of origins support X25519, and any origins that didn’t could issue a HelloRetryRequest (HRR) without breaking the connection.

However, X25519 is vulnerable to quantum computers. Since September 2023, we have advertised support of post-quantum key agreement to origins: first as X25519Kyber768Draft00 and today as X25519MLKEM768 (the standardized version of the algorithm). Crucially, advertising support differs from leading with a keyshare in the ClientHello. An X25519MLKEM768 keyshare is 1,216 bytes compared to X25519's 32 bytes, pushing the ClientHello past a single network packet. While the TLS standard allows multi-packet segments, some legacy middleboxes and origin servers can fail when receiving ClientHello messages split across multiple packets. In our previous study, around 0.34% of scanned origins failed to complete the TLS handshake when receiving a post-quantum keyshare first, while the vast majority of origins still relied on classical X25519.

Therefore, to prevent any possible breakage of origin connections, we used HRR as a safety valve. We only advertised post-quantum support, sent a classical X25519 keyshare, and required capable origins to request a post-quantum exchange via retry. For origins that did not support the HRR flow, customers had the option to manually opt into leading with X25519MLKEM768 keyshare. Between 2023 and today, the percentage of origins supporting post-quantum key exchange algorithms grew from 0.5% to 12.8%, and we expect that to keep climbing as hosting stacks upgrade to PQ safe algorithms.

While safe, this default of only upgrading to post-quantum secure connections via retry added unnecessary latency for two reasons:

  • While all modern builds of OpenSSL, BoringSSL, and rustls support X25519MLKEM768, they handle a classical X25519 keyshare differently. Depending on the build, some older builds may accept it by default unless explicitly configured to prioritize the post-quantum secure keyshares, while newer builds will immediately issue an HRR to prioritize post-quantum connections.
  • Over 6% of origins prefer either P-256 or P-384 over X25519, triggering an HRR round trip even for purely classical connections due to our static choice of initial client keyshare.

To eliminate these wasted round trips, we began scanning origin servers to map their exact key agreement capabilities as part of Automatic SSL/TLS. Using these scan results, we automatically tailor our initial keyshare on a per-origin basis: maximizing post-quantum connections without risking site outages, all while making our connections faster for applicable domains.

Extending Automatic SSL/TLS to the post-quantum age

Automatic SSL/TLS now includes Automatic Key Exchange. Across millions of origins, guessing different keyshares carries operational risk, because we have no advance knowledge of how any individual origin is configured. So rather than infer capability, we measure it directly, reusing the scanning pipeline that already powers Automatic SSL/TLS.

For a growing number of origins, this delivers post-quantum key agreement on the very first try at connection setup, without extra round trips and without requiring any manual setup.

This is how it works: 

  1. For each TLS 1.3 capable origin, we run a series of a few lightweight TLS handshakes, each offering exactly one key agreement group: X25519, P-256, P-384, P-521, or X25519MLKEM768. Together these probes tell us the full set of algorithms the origin supports. And because the active scanning happens outside your production traffic path, we confirm that both your origin and the network in between can handle connections with a stronger key agreement before any real traffic depends on it.
  2. A single domain often fronts multiple subdomains that may resolve to different origins with varying capabilities. We evaluate each subdomain independently and weight the results by its actual traffic volume. This ensures a domain-wide preference reflects HTTP traffic volume rather than weighing a dormant subdomain equally with your busiest endpoint. For example, if almost all traffic hits your www and api subdomains, those endpoints would heavily determine the key exchange preference for the entire domain.
  3. From the key agreement groups an origin supports, we then select the strongest candidate using a strict priority order: post-quantum hybrids (X25519MLKEM768) first, falling back to the fastest classical algorithm accepted by the origin (X25519, P-256, P-384, or P-521).
  4. Once we know the optimal key-agreement an origin prefers, we start rolling it out. The new preference goes to a small share of that origin's traffic first, and the system monitors its failure and HelloRetryRequest (HRR) rate while it runs. If retries climb above that origin's baseline, we roll the change back, the same way Automatic SSL/TLS reverts an encryption mode upgrade that may misbehave. At the worst case of rolling back, a bad key-agreement preference costs us an additional round trip latency, not a broken TLS connection for the duration of the rollout phase.
  5. Origin configurations change over time: a customer moves to a new load balancer, a TLS library ships post-quantum support in a routine release, an operator turns off an older key-agreement algorithm support. We rescan every origin daily, so a server that adds post-quantum support, or stops supporting the curve we were using, gets a new preference at the next scan.

For most customers, there is nothing to configure. If your origin speaks TLS 1.3, we will automatically negotiate the strongest key exchange it supports, for instance, if an origin supports X25519MLKEM768, Cloudflare prefers it and can establish post-quantum key agreement without any extra round trip latency.

Configuring Automatic Key Exchange

Automatic Key Exchange is active by default for all existing and new domains, requiring no manual action for most setups. If you want, you can manage these settings independently in the Cloudflare dashboard under SSL/TLS > Overview > Configure > Origin connection & post-quantum encryption.

With the Automatic Key Exchange toggle enabled, Cloudflare scans your origins out-of-band and leads with a dynamically selected keyshare. With it disabled, scanning stops and Cloudflare reverts to a fixed/static default key agreement order.

We have also introduced a new Compliance requirements setting under Automatic Key Exchange. You can filter which key agreements Cloudflare is permitted to use and advertise support for origin connections. When configured, Automatic Key Exchange and all origin-facing traffic strictly observe these rules:

  • Post-quantum hybrid: Restricts negotiation exclusively to hybrid post-quantum key agreements (X25519MLKEM768), removing classical algorithms entirely. All your successful origin TLS 1.3 connections will be guaranteed to be post-quantum secure.
  • Federal Information Processing Standards (FIPS): Restricts negotiation exclusively to FIPS-compliant key agreements.

Selecting both options requires an algorithm that satisfies both criteria simultaneously; if no overlapping key agreement exists, the configuration is rejected. See the Automatic Key Exchange documentation for details.

By selecting these options, you configure your intent rather than specific algorithms. This ensures that as compliance standards evolve or new post-quantum algorithms emerge, your configuration stays up to date automatically. 

However, these requirements are worth approaching carefully. They do not grant an origin new cryptographic capabilities, they only narrow what Cloudflare can negotiate. 

An important note: Enforcing post-quantum hybrid on an origin that lacks X25519MLKEM768 support leaves no mutually supported algorithm, causing all TLS 1.3 connections to fail. Unless you have a strict policy obligation to enforce post-quantum exchange or FIPS compliance across every connection, leave both options unselected and allow Automatic Key Exchange to negotiate the optimal algorithms safely for you.

Making the Internet safer and faster, together

Automatic Key Exchange works for domains whose origins speak TLS 1.3 (as predicting preferred key agreement method is a TLS 1.3-only feature). It’s enabled by default, and our scanning pipeline has already assigned key exchange preferences to well over a million domains while enrollment continues across the remaining network.

From that initial cohort, we found that roughly 64% of them stayed on the classical X25519 as their preference, so nothing about their connections changed. Around 33% of them now have their preference set to X25519MLKEM768, which causes traffic to those origins protected from harvest-now, decrypt-later quantum attacks in a single round trip. The remaining 3% selected a different classical curve preferred by their origin, such as P-384, P-256, or P-521.

Approximately 9,000 domains each day have their key agreement preference set to a key agreement method other than X25519. Nearly all of these move directly to preferring post-quantum key exchange, while the remainder adopt other classical curves better supported by their origin’s TLS configuration.

As we mentioned earlier, prior to Automatic Key Exchange, almost every post-quantum origin handshake required a HelloRetryRequest (HRR) because our static initial guess defaulted to classical X25519. The result was that post-quantum connections paid a mandatory second round trip before completing the TLS handshake.

With the rollout underway, that latency penalty is virtually gone for almost all post-quantum capable origins: 99.2% of post-quantum TLS 1.3 connections of the currently scanned cohort of origins now complete in a single round trip. Beyond removing the extra round trip, we see that across that cohort, post-quantum origin traffic keeps growing from roughly 25 billion connections to 45 billion per day. A significant part of that growth has come from Automatic Key Exchange upgrading classical connections to a post-quantum preference for scanned origins.

Many origins support multiple key agreement algorithms without preferring one over another. For example, an origin that supports post-quantum key agreement may still accept a classical (X25519) key share without rejecting it or issuing an HRR. Passive observation, therefore, cannot reveal the origin’s full capabilities. Active probing allowed Automatic Key Exchange to uncover thousands of origins whose post-quantum support never appeared in their origin traffic.

Once our scanner discovered such origins, and updated their client keyshare preference, post-quantum connections quickly accounted for the vast majority of traffic to these origins. Other classical key agreement algorithms represent a much smaller share for these upgraded domains, primarily driven by multi-origin setups with a mix of post-quantum and classical-only backends.
Automatic Key Exchange does more than just drive post-quantum adoption. It also helps pair origins with their preferred classical curve (other than X25519), reducing overall HRR rates across all scanned origins.

Before we enabled Automatic Key Exchange, roughly 52% of origin connections for the scanned domains required an HRR. That rate fell to just 3.7%. Avoiding an HRR removes an entire round trip from TLS connection setup, reducing p90 latency more than 150 ms for the scanned origins. This particularly benefits dynamic requests and CDN cache misses that may require a new TLS 1.3 connection to the origin, ultimately reducing latency for eyeballs. Requests sent over existing keep-alive connections do not require a new handshake and are therefore unaffected.

Is the server post-quantum capable?

There are a number of different tools to use to find out if a server supports post-quantum key agreement. We offer one of these tools via Cloudflare Radar. Enter the hostname or IP addresses of your server, and we will check if it supports post-quantum TLS key exchange. Note that if you enter a hostname proxied by Cloudflare, Radar will check the connection to Cloudflare rather than your origin server behind it.

Beyond verifying algorithm support, we have added the ability in the tool to check for post-quantum TLS implementation bugs. If the results come back negative, it will also try to characterize the reason for the failure. Failures often stem from legacy middleboxes, firewalls, or server buffers dropping multi-packet payloads or failing to reassemble a ClientHello split across TCP segments. Other times the origin gives up on an unrecognized key share instead of sending a HelloRetryRequest as TLS 1.3 requires, or sends one and then cannot finish the handshake.

Radar gives you a clear picture of whether the network path handles post-quantum traffic cleanly. Automatic Key Exchange will not switch a domain whose origin fails these checks, so clearing them is what lets the upgrade happen.

What if your origin doesn't support post-quantum key agreement yet?

Even if your origin does not yet support post-quantum encryption today, the good news is that enabling Auto Key Exchange will still be beneficial. Automatic Key Exchange finds what your origin supports. If X25519MLKEM768 is unavailable, Cloudflare continues using a compatible classical key agreement and can still avoid unnecessary HelloRetryRequest round trips by learning which one your origin prefers.

However, Automatic Key Exchange can only prefer post-quantum connections when your origin server already supports the key agreement algorithm. Today, we see over 12% of individual origins across our network support post-quantum encryption. Post-quantum secure algorithms support in TLS server implementations is increasing as recent versions of BoringSSL, OpenSSL, and rustls include support. The enterprise origin stacks, cloud load balancers, and embedded TLS terminators are upgrading on their own timelines.

If you want to add post-quantum protection capability for your domain’s origin-facing connections, you have two options:

  • You can upgrade your TLS endpoint. Many current frameworks and TLS libraries enable X25519MLKEM768 by default. However, if you previously configured allowed curves manually for your server’s TLS configuration, those legacy settings might override the new defaults. It is important to audit every device terminating or inspecting TLS—including load balancers, WAF appliances, and other middleboxes—to ensure X25519MLKEM768 is enabled on everything that sits between your origin and Cloudflare. If you’re on a managed hosting service, ask your provider whether it supports X25519MLKEM768 (many do).

See Post-quantum cryptography between Cloudflare and your origin for supported software, configuration examples, and verification steps.

What's next

We’ve been building Automatic SSL/TLS in public since 2024. Automatic Key Exchange is the second step in a longer arc, not the last. We’ve been public about what’s on the roadmap since then and will continue to provide updates as we ship. A few specific things we’re working on:

Per-origin preference granularity 

Today, Automatic SSL/TLS makes its decisions at the domain level. One origin server's behavior can hold the whole domain back. We're working on a per-subdomain/per origin granularity so that key agreement (and SSL/TLS encryption modes) can vary across the multiple origins that serve a single domain.

On-demand scans

If you've just upgraded your origin's TLS stack, you shouldn't have to wait for the next scheduled scan by Automatic SSL/TLS. Originally, we wanted to scan enough to keep up with changes on the origin, but not too much so as to burden origins who ultimately return the same security information. We're building an option to trigger an on-demand rescan from the dashboard or API, so post origin upgrade you can move to the better key agreement immediately rather than waiting for our system to catch up.

Beyond triggering instant updates, this on-demand scan will live directly in your Cloudflare dashboard as a diagnostic tool. It will let you test your own origin server's behavior on demand and see exactly which key agreements it can successfully negotiate, and characterize the reasons for any failures (similar to the external Cloudflare Radar scanning tool).

Automatic post-quantum origin authentication  

Post-quantum key agreement keeps today's traffic from being decrypted by a future quantum computer. It does nothing about an attacker who uses one to forge a certificate and impersonate your origin. Closing that gap takes post-quantum authentication, which came to origin connections earlier this year when Authenticated Origin Pulls and Custom Origin Trust Store gained support for ML-DSA certificates.

There is an important issue to deal with here: downgrades. Imagine your origin server supports both a classical RSA/ECDSA certificate and a new post-quantum ML-DSA certificate so legacy clients don't break. On Q-Day, an active adversary sitting between Cloudflare and your origin could intercept the TLS handshake and silently drop the post-quantum offer. Cloudflare, seeing only a classical response, would fall back to validating the legacy RSA/ECDSA certificate, which the attacker can forge using a quantum computer.

Preventing this downgrade in the broader WebPKI is complicated. One proposed path involves Certificate Authorities (CAs) placing a post-quantum signature on a classical certificate to prove that a legacy server truly doesn't support PQ yet. While this is a likely direction for the public web, it will take some time and coordination. What’s quicker (if possible!) is to stop trusting classical certificates altogether.

And for origin connections, we can! We plan to extend Automatic SSL/TLS scanning to detect origin support for post-quantum authentication (ML-DSA certificates; and in future Merkle Tree Certificates). Once our scanner identifies such an origin, Cloudflare can automatically disable classical fallback for customers who want strict post-quantum protection, eliminating downgrade risks without disrupting un-upgraded endpoints.

Check it out

At Cloudflare, we believe that strong security on the Internet should be free, automatic, and on by default. Universal SSL made encryption-by-default real for the browser-to-Cloudflare connection. Automatic SSL/TLS is doing the same for the Cloudflare-to-origin connections, and now extends that work to post-quantum key agreement.

If you want to see what your origin encryption level looks like today, check the SSL/TLS section of your dashboard. If you want to verify your origin's post-quantum readiness directly, Cloudflare Radar will tell you if you need to update your server stacks. And if your origin already supports post-quantum, Automatic Key Exchange will tell Cloudflare so that we will connect to your origin faster and more securely.

Introducing Adaptive Intelligence: undermining the economics of every bot attack

Post Syndicated from Chris Pope original https://blog.cloudflare.com/introducing-adaptive-intelligence/

Modern bot threats are increasingly driven by determined, sophisticated attackers. Often it is not even one person, but a group trading techniques with each other or a commercial service sold to anyone willing to pay. For many of them, getting past bot detection is a full-time job they genuinely enjoy. Block them and they get to work, finding a workaround. AI has simplified this further, making it even easier to set up complex configurations for attackers, lowering the overhead of an attack. 

This shift puts defenders at an economic disadvantage. Responding and adapting to new attacks takes care, evidence, and effort to ensure efforts to block attackers don’t impact real users on the way. Attackers have no such concerns and are primarily constrained by their time and their pool of proxies, and ensuring their infrastructure providers don’t shut down their accounts.

Their advantage is the cost of adaptation. Attackers can adapt as often and continuously as they need, while most defenses are deployed in discrete, managed releases. Cloudflare analyzes more than a trillion requests a day for signs of automated abuse, so we see how fast attackers change tactics. That gap in responsiveness is widening.

The inconvenient truth: bot detection across the industry often rests on a hopeful assumption that if you make the wall tall enough, attackers stay out. In reality, a determined attack always finds a way through. The question is not whether a determined attacker can get through. They will. The question is what happens when they do.

Today we are launching Adaptive Intelligence, a new bot detection engine that starts from the opposite idea. Rather than betting on a wall that keeps every attacker out, Adaptive Intelligence makes getting through so slow and costly that the attack stops being worth running.

We believe that no other bot detection works this way.

One attacker, many disguises

Not every attack is obvious to spot. The most sophisticated ones are built to disappear into ordinary traffic.

An attacker can spread requests across a large residential proxy network, keep the rate from each address low, and move patiently through a login, checkout, or account-recovery flow. Every request comes from a different address, often with a fresh user agent or a new bot fingerprint, so each one looks like a new visitor. No single source ever crosses a rate limit.

This is what makes the shape so hard to stop. Tighten the thresholds too far and real customers are turned away, which is the outcome you are trying hardest to avoid. The attack lives in the space between one request and the next, and a defense that studies each request on its own will never see it.

The flaw of deterministic detection

The challenge with rule-based systems is that they hand the attacker a stationary target. They iterate in days while the model waits months for its next update, so by the time it catches up, the tooling has already moved on.

Bot detection has always answered a new attack technique by writing a rule to catch it. That works, until the attacker studies the signal, learns how to circumvent it, and forces another rule to be written. Some of the most advanced attackers have even created tooling to semi-automate this process. The defender appears permanently disadvantaged.

This kind of detection is “deterministic”, meaning that the same input always produces the same output. A defense that never changes teaches the attacker how to beat it and indirectly drives bot operators to build more capable automated attacks. Against a deterministic defense, automated probes return a clean yes or no, and over enough attempts that feedback teaches an attacker exactly where the edges of the system are. The economics are in the attacker’s favor.

Changing the economics of attack

Adaptive Intelligence aims to reverse the economics and put them back in the defender's favor.

A defense that keeps changing flips that calculation, but only if two things are true at once. First, it has to cost the defender less to react than it costs the attacker to work around it. Second, attackers must be starved of the feedback they use to adapt, so they cannot simply learn their way back in. Get both right and the attacker's own loop turns against them: nothing they learned stays true, and each new attempt costs more than the last, until the attack is no longer worth running.

Part of that is giving an attacker less to learn from. Adaptive Intelligence can recognize a bot from a signal without visibly reacting to it, so the attacker keeps relying on a tell they do not realize we can see. And it treats detection as a statistical judgment rather than a fixed rule. That makes it non-deterministic. It weighs many signals at once, so there is no single piece of logic for an attacker to isolate and beat.

A new detection engine

Your bot score already comes from several detection methods working together: machine learning, behavioral validation, JavaScript fingerprinting, a library of heuristics, and checks that recognize known, verified bots like search crawlers. 

Adaptive Intelligence is a brand new bot detection engine that sits behind bot score. Where every other system is built to keep attackers out by accumulating rules, Adaptive Intelligence is built with the assumption that attackers will eventually get in, and makes that attempt as costly as possible. 

Below, we explain three components our Adaptive Intelligence detection engine will have, that are unique when compared to traditional models: improving itself, disposable rule generation, and learning from the traffic it protects. Launching today is its first component: the machine learning at the center of your bot score, now retraining continuously instead of shipping as a fixed version. It aggregates network signals from across Cloudflare's network and measures the probability of automated abuse for every request. Where a fixed model sits still, Adaptive Intelligence keeps moving. The second and third components explained below are soon to follow.

1. Improving itself

The engine retrains continuously on live traffic. As new bypass tools and bot frameworks appear, it learns from them and folds that knowledge into the model behind your bot score, without waiting for a scheduled release. A technique that shows up this week is one the engine can recognize this week. The score you already build on stays close to what attackers are actually doing, rather than drifting further from reality between updates.

2. Disposable rule generation

A disposable rule is a rule that we expect the attacker to adapt to, but doesn’t improve the attacker's bot in the process. Adaptive Intelligence is designed to create disposable rules aimed at a specific attack, deploy and retire them at random intervals, and never leave them in place long enough to become a fixed target. Because the rules keep appearing and vanishing, they inject noise into the very signal an attacker relies on to train against us, so an attacker never gets the steady yes-or-no that a static defense leaks. No single rule has to be perfect or unbeatable. It only has to last long enough to do its job, then make way for the next one. By the time an attacker has reverse-engineered a specific pattern, the engine has already moved on, rendering their engineering effort worthless.

3. Learning from the traffic it protects

Adaptive Intelligence will also learn from the patterns it sees across millions of sites. When a customer flags a real visitor we scored incorrectly, or our own measurement catches a miss, that correction becomes a training signal. Over time the engine tunes to the problems Cloudflare's customers are actually facing, so the protection you get reflects the current threat landscape instead of a snapshot of an older one.

How it works

Adaptive Intelligence runs in a loop: observe, train, deploy, validate. The range of signals it draws on keeps growing as we connect more of the network into it.

Cloudflare has run this kind of automated loop against DDoS attacks for years: sample traffic, TLS fingerprint the patterns behind an attack, push protections out across the network, and keep measuring so they can be adjusted or retired as the traffic changes. Bots are a harder version of the problem, because the signals are quieter and the story only shows up over time. Any one signal can look perfectly normal on its own. It is the relationships between them, and the company they keep, that reveal a bot hiding in normal traffic.

Adaptive Intelligence evaluates traffic over several time windows at once. A short window catches a sudden burst as it develops. A longer window reveals the behavior that repeats across thousands of addresses, clients, and sessions that have no reason to behave alike, and ties those scattered requests back to a single source. The same engine that spots an obvious scraping spike also surfaces a slow, distributed credential-stuffing attack sending only a handful of requests from each address.

Building new detections automatically

As the next parts of Adaptive Intelligence come online, mining systems will search recent, labeled traffic for combinations of signals that separate an emerging attack from real users.

Often, a useful detection comes from the relationship between signals we already know, rather than a signal we have never seen before. A client might claim to be one browser while producing the network or JavaScript signals of another. A request might look normal on its own but form an odd sequence alongside the rest of the session. Automated mining lets us test many of these combinations and turn the strongest into candidate detections.

These candidates are deliberately narrow. They do not need to catch every bot on the Internet, or even every request in the current attack. That makes them quick to build and easy to replace when an attack changes tactics.

It remembers

Attackers do not attack once. They pause, retool, and come back. Retiring a detection does not mean forgetting the pattern behind it. The engine keeps a memory of past attacks even after their detections stop firing, so an attacker cannot escape just by flipping between two profiles and betting the second one looks new.

That memory gives the system a head start when a familiar attack returns or a related one appears. A detection can expire when it stops earning its place, while the evidence behind it stays available to build the next one. Nothing piles up as stale rules in production, and the system never has to learn an old attack from scratch.

The result is one automated loop that can react to an obvious spike or quietly gather evidence on a patient, distributed attack that stays under traditional thresholds. 

Deploying safely

Constant change only helps if every change is safe, and the bar is high. Customers can live with the occasional bot slipping through, but a real visitor wrongly turned away is the failure that actually costs. That is the worry that makes teams cautious about automatic updates, so a new detection has to earn its place before it affects anyone. 

We test each candidate against recent real traffic and measure how much known automation it catches and how often it would flag a genuine visitor by mistake. It rolls out gradually as an input to your bot score while we watch score distributions, challenge outcomes, and customer feedback, and we can pause or roll it back before it reaches your whole network. Every update has to prove it is at least as good as the one it replaces, on the measures that matter for this kind of system, precision and recall among them.

One vision: Adaptive Intelligence and Precursor

This engine does not work alone. Last month we introduced Precursor, a continuous behavioral validation engine for bot management built with privacy in mind, which measures automated abuse based on how a visitor behaves once they reach the browser: the timing, the movement, the small human signals that automation struggles to fake. Precursor and Adaptive Intelligence were built as two parts of one idea to detect malicious automation. Precursor does so through measuring continuous session-behavior; Adaptive Intelligence learns from bot detection signals across the whole network, and the signals from one make the other harder to fool. 

It also reflects how we think about the problem: the bot detection engine should shrink what gets through, and keep adapting faster than the attacker on the other side.

What's coming next

Continuous retraining is the foundation, and more of the engine comes online from here. We are expanding automatic detection generation for bots, connecting more of what Cloudflare sees across the network, the challenge, and the browser into a single view of a session, and giving you more ways to act on what the engine finds.

Knowing that no defense will keep every determined attacker out lets us aim for something more useful: making each attempt short-lived while costing the attacker more than it will ever return. Adaptive Intelligence reacts faster to new techniques, and gives attackers less to learn from each time it makes a change. The attacker who never quits now faces a defense that is different each time they return, so their persistence stops paying off.

Getting started

Enterprise customers should turn on "Auto Update Machine Learning" in the Bot Management dashboard. With it on, you get Adaptive Intelligence automatically, with no version to migrate and nothing to configure, and the bot score you already build on keeps working unchanged. If you are not sure it is enabled, check now so you are covered from day one.

BotBase for Operators: A clearer path to joining Cloudflare’s directory of bots and agents

Post Syndicated from Julian Laxman original https://blog.cloudflare.com/botbase-for-operators/

Last month, on our second Content Independence Day, we announced a couple of features designed to give website owners more visibility and control over automated traffic: BotBase added a searchable directory of known bots to the Cloudflare dashboard, while Business Insights helped owners understand how crawlers interact with their content. We know that the ecosystem of bots is vast, making it all the more important for site owners to be able to manage bot traffic sustainably.

But this ecosystem goes both ways. While website owners need to decide which automated traffic they allow, bot operators need a clear way to identify themselves, explain what their bots do, and keep that information current. BotBase works best when both sides can participate.

When we launched BotBase, we said we would build tools to bring bot operators into this ecosystem. Until now, their experience largely ended at submission. After pressing submit, an operator had no easy way to check the submission's status, understand why it was rejected, or update an existing entry. Today, we start to change that with the launch of BotBase for Operators, tackling what bot operators need first: transparency.

A new home for bot submissions

Imagine you’re a bot operator looking to submit your bot to BotBase. Where on the dashboard would you look for such a submission form? Previously, the form lived under Manage Account → Configurations, which tied the bot clearly to your account, but didn’t acknowledge its connection to the bots ecosystem.

Starting today, the bot submission experience has a home next to the rest of your bot and trust tools: Protect & Connect → Application Security → BotBase (new!). All customers can access this today directly from the Cloudflare dashboard.

Here, we’ve split BotBase for Operators by use case:

  • Bots directory — browse, search, and filter the bots Cloudflare already tracks (the same catalogue you can explore on Cloudflare Radar).
  • Submission form — submit a new bot.
  • Submission history — track everything you have submitted.

Finding BotBase solves the "where" problem. The "what happens next" problem is the one that we’ve heard is deeply important to bot operators, so we’ll cover that in the rest of this post.

See where your submission stands

We spoke to many bot operators, and the resounding feedback was this: submitting a bot feels like a black box. You fill in the form, press submit, and wait, with no way to tell whether anything happened next.

Now, the Submission history tab shows every bot submitted from your account, each with a clear status:

  • Waiting for review — we have received your submission and it is in our queue.
  • Accepted — we have reviewed it and your bot is now tracked in the directory.
  • Rejected — something in the submission needs to change. We tell you why, with steps you can act on, so you can fix it and resubmit.

Open any submission to see its full details. If it was rejected, you will see the reason why. If it was accepted but we adjusted how your bot is classified, you will see what we changed.

Previously, operators would need to email support just to ask whether their bot got reviewed or to check on their submission's progress. That's exactly the gap we’re closing with this new tab.

Today, the submission form is no longer a black box. Every operator can now view the record of every bot they've submitted starting from today’s launch, with a status you can check anytime. We also provide a way to filter “My bots,” from the Bots directory screen, so you can see all bots that have been submitted under the account with which you’re currently logged in.

Keep your bot's information up to date

A bot's identification details can change over time. You might redesign your website and end up hosting your IP list at a new endpoint. Or you might move from an IP allowlist to signing your traffic with Web Bot Auth, and need your entry to match. Before today, the only way to reflect either change was to fill out the whole form again and submit a brand-new entry. Now, you can edit a submission you have already made.

You can also cancel a submission that is still waiting for review.

We encourage every operator to keep their bot's information current. Accurate details are a key component of how a bot earns and keeps Verified status, which increasingly determines whether sites across Cloudflare's network can easily allow it based on its behavior. Of course, it is ultimately up to the individual site owner to decide what traffic is allowed and what is not. 

A submission form built on an updated, pragmatic taxonomy

Picture a bot. Maybe it only crawls pages to build a search index. Maybe it also acts on a user's behalf, or pulls in data for something else entirely. How it uses what it reads matters just as much as what it does. 

The new intake form asks you to describe your bot the way it actually behaves. It follows the same behavior and content use model we introduced on July 1, so instead of squeezing your bot into a single label, you now tell us three things.

First, what your bot does. Maybe it only does one thing, like indexing pages for search. Maybe it's an agent acting on a user's behalf, or it collects data, trains models, or supports SEO tools. You can select every behavior that applies, not just the closest match.

Second, how it uses what it reads. A crawler that skims a page for a search snippet is not the same as one that stores that page to train a model. You tell us the level of content use your bot needs, using the same Content Signals model website owners already use to set their own rules. For example, a site's robots.txt might read Content-Signal: search=yes, ai-train=no, use=reference, telling every crawler it's fine to index the page for search and keep a reference, but not to train a model on it. Your bot's content-use declaration is what gets checked against exactly that kind of preference.

Third, who's actually running it. If you operate your bot yourself, straight from your own infrastructure, like a search engine crawling the web to build its own index, that's direct. If you run a platform other companies build on, carrying their traffic without being the one who decided to send it, that's an intermediary. Picture a general-purpose AI assistant fetching a page because someone typed a question into a different company's app built on that assistant's API: the assistant operator runs the infrastructure, but it was someone else's product that decided to send the request. (You can read more about these classifications here.)

That's the full picture: what your bot does, how it treats what it reads, and who's behind it, described as it actually is instead of squeezed into one label. The clearer that picture, the more accurately website owners can decide how to treat your bot.

Faster, more consistent review

Operators also asked for faster reviews. We hear you on this, too.

The number of new bots submitted each year has grown sharply — increasing about 7 times in volume since 2023 — and reviewing every one of them by hand doesn't scale at that pace. Until now, every submission followed the same fully manual path: someone on our team checks it against an internal rubric and makes a judgment call. That kind of review is thorough, but it doesn't scale. 

We rebuilt that process to run automatically. Your bot runs through a series of checks — is it a duplicate of one we already track, is your user-agent pattern specific enough to identify your bot without overlapping one that's already registered, and, most importantly, does your claimed verification method actually hold up? We fetch your IP list, confirm your reverse DNS, or validate your Web Bot Auth signature automatically, instead of a person doing it by hand. If everything checks out, your bot can be tracked right away. If something needs a closer look, it's routed to our team with the specific reason already flagged, instead of landing as a blank entry in a queue.

For operators, that means most submissions move faster than before.

Submit your bot today

To join hundreds of bots in BotBase who declare their behavior and content use, and be part of an ecosystem where website owners and bot operators can coexist:

  1. Go to Protect & Connect → Application Security → BotBase in the Cloudflare dashboard.
  2. Open the Submission form and declare your bot: who operates it, what it does, how it uses content, and how it proves its identity.
  3. Submit. Your submission appears in Submission history as Waiting for review.

What's next

This launch is about visibility; there's more coming. Here are our guiding goals:

  • Visibility, targeted by this launch. This gives operators the ability to see, understand, and edit submissions.
  • Ownership and observability, being targeted soon. This gives operators the ability to claim bot ownership, manage its live directory entry, and better understand how websites are treating their bot.
  • Conversation, a longer-term goal. This would open a more sustainable way for bot operators to ask websites to be let in if they can show they provide value rather than harm. 

Our vision is to keep expanding BotBase so operators can understand exactly how their bot is treated and get guidance on how to crawl the web more politely, turning a one-way submission into an ongoing relationship.

BotBase started as a directory for website owners. It is becoming a place where bot operators take part in the ecosystem, understand where they stand, and keep their information accurate. If you run a bot, submit it and tell us what you need next. We are building the operator side alongside the operators who use it.

Scaling Security Insights: how we achieved a 10x increase in global scanning capacity

Post Syndicated from Dave Baxter original https://blog.cloudflare.com/scaling-security-scans/

Security Insights provides actionable security recommendations for every Cloudflare account. To find these insights, we perform regular scans for all accounts, zones, and DNS records, looking for potential security risks and misconfigurations.

However, two key issues emerged. First, our scans were too infrequent. Scans were only being performed every week or two, and therefore newly introduced security risks could remain undetected for up to two weeks. Second, automatic scanning was opt-in for many free plan accounts – meaning lots of accounts weren’t being scanned at all.

The risks of infrequent or nonexistent scans are rising: as automated attacks accelerate, the window for detecting security misconfigurations is shrinking. Making sure that we’re finding these issues for all of our customers is crucial to our aim of building a better Internet for everyone.

We calculated that to increase our scanning frequencies and enable automatic scanning for all accounts, we would need to increase our scanning throughput by around 10x on average – from 10 scans per second to 100 per second. But our system was already struggling with its load: millions of events were filling up our backlog waiting to be processed; our API was frequently timing out; our processes were crashing. We needed to fix our system, and we needed to make it scale.

This is the story of how we increased scanning throughput for Security Insights by more than 10x, enabled security insights for millions of customers, and doubled our scanning frequency for all customers. Read on to find out how we achieved these improvements.

How we scan for security insights

At a high level, our automatic security scans are triggered by a scheduler. When an account or zone is due for a scan, the scheduler publishes a message (or messages) to Apache Kafka, an open-source distributed event streaming platform. These messages fan out to a number of checkers: specialized Go microservices that scan specific assets or configurations.

For every message, each checker sends its results (the security insights that it found) to our internal API, which then persists these in a Postgres database.


Making it scale

Scaling Kafka

Apache Kafka is not strictly a queue: it is a partitioned event stream (though recently gained queue semantics). Within a partition, messages must be consumed and processed in order. This differs from typical queues where messages may be consumed in order but are processed out-of-order. As a result, we can only have one active consumer per partition within a consumer group.

This has two consequences for us:

  • Messages that are slow to process block the consumer from progressing to the next message

  • For each checker, we can only have as many consumers as there are partitions (each checker has its own consumer group)


We could have tried to scale by adding more partitions. However, this would have increased resource usage for the Kafka broker itself, which is shared by many other services. We reserved this as a last resort, aiming to improve our code and architecture first.

Introducing parallel processing

Although we can only consume messages in order, there is nothing stopping us from consuming multiple messages at once.

We changed our checkers to consume messages in batches, processing each message in a separate goroutine. The trade-offs are that we’d have more work to re-do if our process crashed midway through a batch, and our memory usage would be slightly increased. In our case, these were both acceptable.

Avoiding head-of-line blocking

Some messages processed by a few of our checkers take much longer to process than others. For example, one account/zone may have far more assets than another. In the worst case, these messages can take minutes or hours to process compared to the average case of seconds or milliseconds.

We opted for a very simple approach: splitting our consumer groups and checkers in two – the ‘slow lane’ and the ‘fast lane’. We could determine quickly whether a message would be slow or fast to process. If the ‘fast lane’ checker encounters a slow message, it skips it.


This solved the problem: slow messages had the dedicated resources and time to be processed with minimal delay, and fast messages were able to proceed at their regular fast pace.

Optimizing our database queries

Every insight we find gets written to our Postgres database. This is handled by a single API endpoint that our checkers invoke with a list of insights. The implementation looked like this:

for _, issue := range issues {
	_, err = tx.Exec(ctx, `INSERT INTO table ... VALUES ($1, $2, ...) ON CONFLICT DO UPDATE ...`, ...)
	if err != nil {
		return err
	}
}

The astute reader will notice that for large sets of insights, this code makes a round trip to the database per insight. With a maximum observed size of 500,000, this was half a million round trips, queries, and transactions in a single API call.

We initially tried the gold standard for bulk inserts in Postgres: COPY into a temporary table. However, we found that this approach led to bloat in the Postgres system tables.

We settled on a hybrid approach:

  • Using UNNEST when the number of issues was below a threshold

  • Using COPY when the number of issues exceeded this threshold

This provided the best of both worlds: reasonably fast inserts for huge sets of insights (seconds), and even faster inserts (milliseconds) for small sets of insights.

Investigating our API timeouts

We noticed several strange behaviours in our internal API as we tried to scale:

  • A large number of requests were triggering client-side timeouts

  • Many checkers were spending 20-90% of their processing time on a single API call

  • When triggering a large volume of scans, our throughput would start high and deteriorate

All of these problems had the same root cause: latency.

Our primary database is located in Portland, Oregon. Our API, however, was running active-active in both Portland and Amsterdam. Even at the speed of light, the round-trip latency between Portland and Amsterdam would be 50 milliseconds.

As a result of this latency, database queries from the Amsterdam API instance took much longer, holding connections from our client-side connection pool open. With the large volume of requests that we were making to the API, the connection pool was quickly becoming exhausted, leading to timeouts waiting for a free connection. Our average API call completed in 10 ms in Portland, but almost 3 seconds in Amsterdam!

But why the drop in message throughput? Each checker process gets assigned a set of partitions of the Kafka stream to consume. Our API is load-balanced. Since we hold the connection open throughout the life of the process, some processes had a connection to the Amsterdam API, and others had a connection to the Portland API. The partitions linked to Portland were processed quickly, but the ones consumed by the Amsterdam-bound processes were lagging behind:


Kafka lag (number of messages waiting to be processed within a single consumer group) by partition for one of our checkers. Note that we have 30 partitions in this case. Exactly 15 partitions can be seen lagging behind (the lines that reach or approach zero later than around 03/10 03:00). This is because the load balancer splits traffic evenly between our API endpoints.

This was a simple fix: we switched our API to active-passive, ensuring the active API followed our primary database. Our latency problems disappeared overnight.

Rethinking the scheduler

We’d scaled Kafka. We’d optimised our database queries. We’d fixed our API. However, we still had a problem: we needed to be sure our scans would be roughly uniformly distributed in time. It wasn’t feasible to queue all of our scans at the same time, as our Kafka topic uses a time-based retention policy: the scans would pile up in Kafka, and eventually be deleted before they could be processed.

Our scheduler was not good at uniformly distributing our scans. The number of scans that would be triggered at a given time was spiky and unpredictable. At certain points throughout the week, hundreds of thousands of scans would be triggered within minutes of each other. What was going on?

The scheduler triggers scans on fixed recurring periods. In pseudocode, the scheduler looked like this:

Loop forever:
    Find accounts where last_scheduled_at + scanning frequency <= now
    For each account:
        Trigger scan for account
        Trigger scan for all zones in the account
        Update last_scheduled_at = now

We quickly noticed that last_scheduled_at was similar for a large number of accounts in our database, which was responsible for some of this unevenness.

However, even with perfectly even distribution, increasing our scanning frequency would have compounded this problem. For example, changing the scanning frequency from every 15 days to every seven days would mean 53% of accounts would suddenly be due for a scan.

There was a further problem with this logic. Some accounts have a very large number of zones. When these accounts were scheduled, there was a cascade of scans for all of their zones. This was saturating our Kafka partitions and leading to delays for scans of much smaller accounts.

To fix these problems, we made three key changes:

  • Schedule zones independently of accounts: each zone gets its own last_scheduled_at field.

  • Randomize the last_scheduled_at time for existing accounts and zones.

  • Introduce adaptive rate limiting for scan scheduling.

Scheduling zones independently was an obvious way to solve the problem of large accounts. Randomizing the last_scheduled_at time (and ensuring that no scans were delayed during this process) allowed us to fix the existing unevenness in our database.

Adaptive rate limiting is slightly more interesting. Rate limiting would allow us to solve the problem of a spike in scans when we change scanning frequencies. For example, if we wanted to increase our scanning frequency to every 7 days, and we had 50 million accounts, then a rate limit of ~83 scans/second would ensure that they were spread out evenly across 7 days.

But what if we added 10 million more accounts? Then, this rate limit would force us to take 8 days to scan all of these accounts. This is where the adaptive part comes in: the rate limit is asynchronously recalculated every half-hour based on the total number of accounts and zones we have, and our scanning frequencies. This ensures we continue scanning on time even if we onboard thousands or millions more accounts and zones.

func computeRate(free, pro, biz, ent int64) rate.Limit {
   r := float64(free)/freeScanInterval.Seconds() +
      float64(pro)/proScanInterval.Seconds() +
      float64(biz)/bizScanInterval.Seconds() +
      float64(ent)/entScanInterval.Seconds()


   // Guard against zero counts. We always want to schedule at least one scan per second.
   if r < 1 {
      r = 1
   }


   // Increase rate limit beyond the 'perfect' value, to have a buffer in case of any downtime
   // or spikes in load.
   r *= rateLimitBufferFactor


   return rate.Limit(r)
}

Where we stand today


With these fixes, our 7-day moving average throughput per checker over time rose by more than 10x.

Before these improvements, we were executing around 10 scans per second. The gap between this and our target throughput of 100 scans per second seemed vast. We discussed throwing more resources at the problem, throwing more partitions at our Kafka topic – even throwing out our entire architecture.

But our fixes made all the difference. Today, Security Insights sustains over 120 scans per second during peak scheduling, exceeding our 10x improvement goal. Our internal API is no longer timing out, and our Kafka lag metrics look much healthier. These scalability improvements have allowed us to turn on automatic scanning for all free accounts and zones and increase the scanning frequency for all customers:

  • Free: every 7 days

  • Pro and Business: every 3 days

  • Enterprise: daily

The improved system stability has given us confidence to build new features that we were previously constrained from creating. We’ve added the ability to perform granular on-demand scans. You can now manually re-scan a Cloudflare account, zone, insight, or insight type.


Starting a granular on-demand scan from the Security Overview page in the Cloudflare dashboard

The lesson we learned is that it’s crucial to deeply understand the existing system before throwing anything away. By looking closely at our code, SQL queries, logs, and metrics (especially metrics!), we were able to increase our capacity without simply adding more pods or partitions. By questioning our assumptions, digging into weird-looking metrics, and refusing to take the easy shortcuts (such as increasing API client-side timeouts), we built a more stable and resilient system.

Throwing more resources at the problem might sometimes be the answer, but at Cloudflare, we believe in engineering our way out of problems.

Security Insights scans are enabled by default on all Cloudflare plans. Log in to the Cloudflare dashboard today to review and manage your security insights.

AI Security for Apps is now generally available

Post Syndicated from Liam Reese original https://blog.cloudflare.com/ai-security-for-apps-ga/

Cloudflare’s AI Security for Apps detects and mitigates threats to AI-powered applications. Today, we’re announcing that it is generally available.

We’re shipping with new capabilities like detection for custom topics, and we’re making AI endpoint discovery free for every Cloudflare customer—including those on Free, Pro, and Business plans—to give everyone visibility into where AI is deployed across their Internet-facing apps.

We’re also announcing an expanded collaboration with IBM, which has chosen Cloudflare to deliver AI security to its cloud customers. And we’re partnering with Wiz to give mutual customers a unified view of their AI security posture.

A new kind of attack surface

Traditional web applications have defined operations: check a bank balance, make a transfer. You can write deterministic rules to secure those interactions. 

AI-powered applications and agents are different. They accept natural language and generate unpredictable responses. There’s no fixed set of operations to allow or deny, because the inputs and outputs are probabilistic. Attackers can manipulate large language models to take unauthorized actions or leak sensitive data. Prompt injection, sensitive information disclosure, and unbounded consumption are just a few of the risks cataloged in the OWASP Top 10 for LLM Applications.

These risks escalate as AI applications become agents. When an AI gains access to tool calls—processing refunds, modifying accounts, providing discounts, or accessing customer data—a single malicious prompt becomes an immediate security incident.

Customers tell us what they’re up against. “Most of Newfold Digital’s teams are putting in their own Generative AI safeguards, but everybody is innovating so quickly that there are inevitably going to be some gaps eventually,” says Rick Radinger, Principal Systems Architect at Newfold Digital, which operates Bluehost, HostGator, and Domain.com.

What AI Security for Apps does

We built AI Security for Apps to address this. It sits in front of your AI-powered applications, whether you’re using a third-party model or hosting your own, as part of Cloudflare’s reverse proxy. It helps you (1) discover AI-powered apps across your web property, (2) detect malicious or off-policy behavior to those endpoints, and (3) mitigate threats via the familiar WAF rule builder.


Discovery — now free for everyone

Before you can protect your LLM-powered applications, you need to know where they’re being used. We often hear from security teams who don’t have a complete picture of AI deployments across their apps, especially as the LLM market evolves and developers swap out models and providers. 

AI Security for Apps automatically identifies LLM-powered endpoints across your web properties, regardless of where they’re hosted or what the model is. Starting today, this capability is free for every Cloudflare customer, including Free, Pro, and Business plans. 


Cloudflare’s dashboard page of web assets, showing 2 example endpoints labelled as cf-llm

Discovering these endpoints automatically requires more than matching common path patterns like /chat/completions. Many AI-powered applications don’t have a chat interface: think product search, property valuation tools, or recommendation engines. We built a detection system that looks at how endpoints behave, not what they’re called. To confidently identify AI-powered endpoints, sufficient valid traffic is required.

AI-powered endpoints that have been discovered will be visible under Security → Web Assets, labeled as cf-llm. For customers on a Free plan, endpoint discovery is initiated when you first navigate to the Discovery page. For customers on a paid plan, discovery occurs automatically in the background on a recurring basis. If your AI-powered endpoints have been discovered, you can review them immediately.

Detection

AI Security for Apps detections follow the always-on approach for traffic to your AI-powered endpoints. Each prompt is run through multiple detection modules for prompt injection, PII exposure, and sensitive or toxic topics. The results—whether the prompt was malicious or not—are attached as metadata you can use in custom WAF rules to enforce your policies. We are continuously exploring ways to leverage our global network, which sees traffic from roughly 20% of the web, to identify new attack patterns across millions of sites before they reach yours.


New in GA: Custom topics detection

The product ships with built-in detection for common threats: prompt injections, PII extraction, and toxic topics. But every business has its own definition of what’s off-limits. A financial services company might need to detect discussions of specific securities. A healthcare company might need to flag conversations that touch on patient data. A retailer might want to know when customers are asking about competitor products.

The new custom topics feature lets you define these categories. You specify the topic, we inspect the prompt and output a relevance score that you can use to log, block, or handle however you decide. Our goal is to build an extensible tool that flexes to your use cases.


Prompt relevance score inside of AI Security for Apps

New in GA: Custom prompt extraction

AI Security for Apps enforces guardrails before unsafe prompts can reach your infrastructure. To run detections accurately and provide real-time protection, we first need to identify the prompt within the request payload. Prompts can live anywhere in a request body, and different LLM providers structure their APIs differently. OpenAI and most providers use $.messages[*].content for chat completions. Anthropic’s batch API nests prompts inside $.requests[*].params.messages[*].content. Your custom property valuation tool might use $.property_description.

Out of the box, we support the standard formats used by OpenAI, Anthropic, Google Gemini, Mistral, Cohere, xAI, DeepSeek, and others. When we can’t match a known pattern, we apply a default-secure posture and run detection on the entire request body. This can introduce false positives when the payload contains fields that are sensitive but don’t feed directly to an AI model, for example, a $.customer_name field alongside the actual prompt might trigger PII detection unnecessarily.

Soon, you’ll be able to define your own JSONPath expressions to tell us exactly where to find the prompt. This will reduce false positives and lead to more accurate detections. We’re also building a prompt-learning capability that will automatically adapt to your application’s structure over time.

Mitigation

Once a threat is identified and scored, you can block it, log it, or deliver custom responses, using the same WAF rules engine you already use for the rest of your application security. The power of Cloudflare’s shared platform is that you can combine AI-specific signals with everything else we know about a request, represented by hundreds of fields available in the WAF. A prompt injection attempt is suspicious. A prompt injection attempt from an IP that’s been probing your login page, using a browser fingerprint associated with previous attacks, and rotating through a botnet is a different story. Point solutions that only see the AI layer can’t make these connections.

This unified security layer is exactly what they need at Newfold Digital to discover, label, and protect AI endpoints, says Radinger: “We look forward to using it across all these projects to serve as a fail-safe.”

Growing ecosystem

AI Security for Applications will also be available through Cloudflare’s growing ecosystem, including through integration with IBM Cloud. Through IBM Cloud Internet Services (CIS), end users can already procure advanced application security solutions and manage them directly through their IBM Cloud account. 

We’re also partnering with Wiz to connect AI Security for Applications with Wiz AI Security, giving mutual customers a unified view of their AI security posture, from model and agent discovery in the cloud to application-layer guardrails at the edge.

How to get started

AI Security for Apps is available now for Cloudflare’s Enterprise customers. Contact your account team to get started, or see the product in action with a self-guided tour.

If you’re on a Free, Pro, or Business plan, you can use AI endpoint discovery today. Log in to your dashboard and navigate to Security → Web Assets to see which endpoints we’ve identified. Keep an eye out — we plan to make all AI Security for Apps capabilities available for customers on all plans soon.

For configuration details, see our documentation.

Building a security overview dashboard for actionable insights

Post Syndicated from Rachel Smith original https://blog.cloudflare.com/security-overview-dashboard/

For years, the industry’s answer to threats was “more visibility.” But more visibility without context is just more noise. For the modern security team, the biggest challenge is no longer a lack of data; it is the overwhelming surplus of it. Most security professionals start their day navigating a sea of dashboards, hunting through disparate logs to answer a single, deceptively simple question: “What now?”

When you are forced to pivot between different tools just to identify a single misconfiguration, you’re losing the window of opportunity to prevent an incident. That’s why we built a revamped Security Overview dashboard: a single interface designed to empower defenders, by moving from reactive monitoring to proactive control.


The new Security Overview dashboard.

From noise to action: rethinking the security overview 

Historically, dashboards focused on showing you everything that was happening. But for a busy security analyst, the more important question is, “What do I need to fix right now?”

To solve this, we are introducing Security Action Items. This feature acts as a functional bridge between detection and investigation, surfacing vulnerabilities, so you no longer have to hunt for them. To help you triage effectively, items are ranked by criticality:

  • Critical: Urgent risks requiring immediate attention to prevent exploitation.

  • Moderate: Issues that should be addressed to maintain a strong security posture.

  • Low: Best-practice optimizations and hardening suggestions.

By filtering by Insight Type (such as Suspicious Activity or Insecure Configuration), you can tailor your workflow to the specific threats your organization faces most.


One of the most common causes of a breach isn’t the absence of a security tool, it’s the fact that the tool was never turned on or was configured incorrectly. We call this the configuration gap.

The new Detection Tools module eliminates this blind spot. Instead of digging through nested settings pages to see if your traffic is actually being inspected, we provide a high-level status of your entire Cloudflare security stack in one view:

  • Are your primary shields active, or are you in “Log Only” mode during a period of increased volatility? 

  • Are you discovering shadow APIs, or are you flying blind?

By surfacing these tools directly alongside your Security Action Items, we move the conversation from “Do we have this tool?” to “Is this tool actively protecting us right now?”


A high-level summary is only as good as the data behind it. To make the transition from a red flag to a solution seamless, we have unified the visibility of our Suspicious Activity cards. These cards now live in two strategic places: the Security Overview and the Security Analytics page.

If you spot a Suspicious Activity card on your Overview page that piques your interest, there is no need to manually navigate to Analytics and re-create your filters. By clicking on the card, you are deep-linked directly into the Security Analytics dashboard with all the relevant filters automatically applied. This eliminates the “tab switching tax” that slows down incident response, keeping your workflow fluid and your response times fast.

How we built our new security overview dashboard

To maintain a proactive defense, our engine produces and refreshes over 10 million actionable insights every day to ensure protection is always current.

Operating at this level presents two distinct engineering challenges. The first is scale: processing massive volumes of data seamlessly. The second and arguably harder challenge, is breadth. True security is horizontal, spanning your entire stack. To generate actionable insights that give you a comprehensive view of your risks and vulnerabilities, our engine must validate everything from simple SSL certificates to complex AI bot configurations.

To solve this, we built a system composed of smaller, specialized micro services, which we call checkers. Each checker is a subject-matter expert for a specific part of your stack, such as DNS records. The distribution of our checkers allows them to scale independently, hooked into the system in two ways: scheduled configuration checks or real-time listeners that flag a risk the instant an event occurs.

1. Scheduled checks: We deploy this mode for risks that need deep inspection. These are triggered by an orchestrator (scheduler), which periodically pushes tasks for the checkers to execute. We distribute the checker workload across a massively parallel system. For example, a task sent to the DNS checker might be: “Scan all the DNS related configurations of zone xyz.com and find anomalies.”

The checkers pick up these tasks independently. They use their specialized intelligence to scan through the assets and configurations. In the case of the DNS checker, it uses specialized and intelligent rules to scan all the DNS assets and configurations of a zone, be it A/AAAA/CNAME records or DMARC or SPF records. 

This is what the insight lifecycle looks like: 

  1. The checker activates when a message is received. 

  2. The checker collects relevant assets (e.g., DNS records) about the zone or account.

  3. The checker runs several checks to verify the status of the asset, e.g., if a CNAME record points to a server.

  4. If the state or configuration doesn’t meet the required threshold, an insight is flagged.

  5. During the next check, if the insight persists, the timestamp is updated.

  6. If the insight has been remedied during the next check, it will be removed from the database.


2. Event handlers: The checkers operate on a schedule round the clock, whereas the event handlers function in real-time. They listen to signals and events from our control plane.


This is what the real-time ruleset insight lifecycle looks like:

  1. A WAF rule configuration is modified.

  2. An event containing details of the change is triggered immediately.

  3. The ruleset handler, which is actively listening, kicks into action.

  4. The handler detects an anomaly, e.g, you have enabled the Cloudflare Managed Ruleset but left it in “Log Only” mode.

  5. The handler deduces that the attacks are being recorded but not blocked.

  6. The handler registers an insight and makes it available on the dashboard.

  7. If the configuration has been updated to a secure setting, the handler clears the insight.

The real-time nature of Ruleset handlers allow us to flag a misconfiguration or confirm a fix instantly.

Unifying security visibility with contextual insights

Our customers have consistently asked for more than just visibility: they’ve asked for context. While a notification that a record is misconfigured is helpful, it’s only half the story. To take immediate, confident action, defenders need to know the “so what?” including the business impact and the technical root cause. To address this, we have developed Contextual Insights for our detection engine. By surfacing data like traffic volume to a broken A record, we ensure that every insight is an invitation to act.

We are starting this journey of Contextual Insights by expanding the depth of our DNS insights. Instead of just flagging a broken record, we correlate the dangling signal with additional context and real-time traffic data to provide the “why” and the “how”:

  • Target Context: We identify exactly which deleted resource (e.g., an old S3 bucket or cloud instance) the record points to.

  • Impact Context: We show you exactly how many users are still trying to reach that broken record.

Let’s explore the ‘Dangling A/AAAA/CNAME record’ insights as an example. 

To provide these insights, we must analyze the massive amount of data flowing through our network every second. To give you an idea of the work happening behind the scenes:

100+ million DNS records are scanned weekly by our engine. In the past week, our engine identified over 1 million dangling DNS records. The majority (97%) are Dangling A/AAAA records and the remaining 3% are Dangling CNAME records.

Of the 31,000 dangling CNAME records:

  • 95% point to Microsoft Azure services.

  • 3% point to AWS Elastic Beanstalk.

This signals that these are high-priority targets for a subdomain takeover. An attacker can claim these abandoned cloud resources and immediately control your subdomain, allowing them to launch phishing attacks or spread misinformation under your trusted brand. With thousands of hits, a dangling record presents a high-priority risk for a subdomain takeover, necessitating immediate remediation to instantly gauge and mitigate the threat.

Our DNS checker uses a two-step process to generate these insights

  • Step 1: Active Insight detection

    • The checker starts verification as soon as it gets the message to start a scan. This process has been described in an earlier section.

  • Step 2: Contextual enrichment

    • Once the insight is generated, the checkers gather relevant contextual data for the insight that helps the customer in understanding the impact of the security insight.

Let’s explore in depth how the dangling DNS record insights are generated, focusing on the two-phase process involved. 


Phase 1: Active Verification

A DNS record pointing to an IP address often looks perfectly valid on paper, even if the server behind it was decommissioned months ago. To confirm if a risk is real, our engine has to step outside the network and probe the destination in real-time. The checks performed can be categorized as follows:

The dead server check (A/AAAA records): For records pointing directly to IP addresses, we verify if the destination is still active. Our engine spins up a dedicated egress proxy to attempt a connection to the origin over HTTP and HTTPS. By using this special gateway, we simulate how a real user would connect from outside Cloudflare’s network. If the connection times out or the server returns a “404 Not Found” error, we confirm the resource is dead. This proves the DNS record is “dangling”, a live signpost pointing to an empty lot.

The takeover check (CNAME records): Domain aliases (CNAMEs) often delegate traffic to third-party services, like a helpdesk or storage bucket. If you cancel that service but forget to delete the DNS record, you create a “dangling” link that attackers can claim.

To find these, our engine performs a 3-step process:

  1. First, we trace the chain by recursively resolving the CNAME record to find its final destination (e.g., my-bucket.s3.amazonaws.com).

  2. Next, we identify the provider by checking if that destination belongs to a known cloud service like AWS, Azure, or Shopify.

  3. Finally, we confirm vacancy. Each cloud provider returns specific error patterns when a resource doesn’t exist  (e.g., S3’s “NoSuchBucket”). We probe the destination URL and match against these patterns to confirm if the resource is claimable.

If our engine detects that a resource has been released but the DNS record remains, we create an insight, prompting you to remove the record before an attacker can take over your subdomain. 

Phase 2: Context Enrichment

Once a record is verified as broken, we add the necessary context to the insight that helps you take better action. The checker connects to different systems to gather the required context. For dangling insights, we focus on three critical dimensions:

  • Traffic Volume (The Impact) Our global ClickHouse clusters are a treasure trove of information. To understand if the record is actually in use, the checker queries our global ClickHouse clusters to sum up the total DNS queries for that record over the last 7 days. This valuable context lets you prioritize the remedy. A record with 0 queries can be fixed when you have time; a record with 10,000 queries is an active vulnerability that needs to be patched immediately.

Query to the clickhouse looks like: 

SELECT query_name,
       sum(_sample_interval) as total
  FROM <dnslogs_table_name>
 WHERE account_id = {{account_id}}
   AND zone_id = {{zone_id}}
   AND timestamp >= subtractDays(today(), 7)
   AND timestamp < today()
   AND query_name in ('{{record1}}', '{{record2}}', ...)
 GROUP BY query_name

The query asks “How many times has this specific broken record been requested by real users in the last seven days?”

  • Infrastructure owner (The Target) Knowing who owns the destination infrastructure is    vital for both remediation and severity assessment. 

For IP records (A/AAAA): We identify the network owner (ASN) through the latest geolocation data from a Cloudflare R2 bucket and performing high-speed lookups in memory. It tells you exactly where the dead resource lived (e.g., “Google Cloud” vs. “DigitalOcean”), speeding up your investigation. 

For CNAME Records: We identify the specific Hosting Provider (e.g., AWS S3, Shopify). This dictates the risk level. If a record points to a provider known for easy takeovers (like S3), we mark it as Critical; otherwise, it is Moderate.

  • DNS TTL We also extract the TTL (Time To Live) value directly from the record configuration.

This tells you the “lag time” of your fix. If you delete a dangling record with a high TTL (e.g., 24 hours), it will remain cached in resolvers around the world for a full day, meaning the vulnerability stays open even after you patch it. Knowing this helps you manage expectations during an incident response.

Looking forward

While this experience is launching at the domain level today, we know that for enterprise customers, security isn’t managed just one domain at a time. Our roadmap is focused on bringing this intelligence to the account level next. Soon, security teams can use a centralized view that aggregates security action items and prioritizes the most critical risks to remediate across all of their Cloudflare domains.

Security shouldn’t feel like a game of catch-up. For too long, the complexity of managing application security has given the advantage to the attacker. Through our architecture of specialized checkers and real-time event handlers, we detect potential risks and enrich them with critical context, ensuring defenders can respond with speed and precision.

The new Security Overview is now the starting point for your day, a place where risk data is transformed into a prioritized strategy. Log in to the Cloudflare dashboard today to explore your new Application Security Overview page!

Translating risk insights into actionable protection: leveling up security posture with Cloudflare and Mastercard

Post Syndicated from Bashyam Anant original https://blog.cloudflare.com/attack-surface-intelligence/

Every new domain, application, website, or API endpoint increases an organization’s attack surface. For many teams, the speed of innovation and deployment outpaces their ability to catalog and protect these assets, often resulting in a “target-rich, resource-poor” environment where unmanaged infrastructure becomes an easy entry point for attackers.

Replacing manual, point-in-time audits with automated security posture visibility is critical to growing your Internet presence safely. That’s why we are happy to announce a planned integration that will enable the continuous discovery, monitoring and remediation of Internet-facing blind spots directly in the Cloudflare dashboard: Mastercard’s RiskRecon attack surface intelligence capabilities.

Information Security practitioners in pay-as-you-go and Enterprise accounts will be able to preview the integration in the third quarter of 2026.

Attack surface intelligence can spot security gaps before attackers do

Mastercard’s RiskRecon attack surface intelligence identifies and prioritizes external vulnerabilities by mapping an organization’s entire internet footprint using only publicly accessible data. As an outside-in scanner, the solution can be deployed instantly to uncover “shadow IT,” forgotten subdomains, and unauthorized cloud servers that internal, credentialed scans often miss. By seeing what an attacker sees in real time, security teams can proactively close security gaps before they can be exploited.

But what security gaps are attackers typically looking to exploit? In a 2025 study of 15,896 organizations that had experienced security breaches, Mastercard found that unpatched software, exposed services (e.g. databases, remote administration), weak application security (e.g. missing authentication) and outdated web encryption were frequent hallmarks, as seen in the graph below.


The same study also found that organizations with significant cybersecurity posture gaps in these areas were 5.3x more likely to be hit by a ransomware attack, and 3.6x more likely to suffer a data breach compared to companies that maintain good cybersecurity hygiene.

Why Cloudflare and Mastercard are partnering

This partnership combines Mastercard’s attack surface intelligence—which identifies security gaps—with Cloudflare’s ability to fix them. Organizations can use Mastercard’s data to find shadow assets, such as forgotten domains or unprotected cloud instances, and secure them by routing traffic through Cloudflare’s proxy. This allows for the immediate deployment of security controls without changing the underlying website or application.

Based on a sample of approximately 388,000 organizations spanning over 18 million systems, Mastercard’s attack surface intelligence shows that systems using Cloudflare as a proxy have significantly better security hygiene than those that do not:

  • Software Patching: 53% fewer software vulnerabilities

  • Web Encryption: 58% fewer SSL/TLS issues

  • System Reputation: 98% fewer instances of malicious behavior (e.g. communicating with botnet command and control servers, hosting phishing sites).


The table below provides additional details on the security posture insights provided by Mastercard. These insights are generated by passively scanning publicly accessible hosts, web applications, and configurations. 

Category Security Check Description
Software Patching Application Servers Unpatched application server software.
OpenSSL Unpatched OpenSSL.
CMS Patching Unpatched content management system software.
Web Servers Unpatched webserver software.
Application Security CMS Authentication Enumeration of content management system administration interfaces publicly exposed to the internet.
High Value System Encryption Enumeration of systems that collect sensitive data that do not have encryption implemented.
Malicious Code Enumeration of systems containing malicious code (Magecart).
Web Encryption Certificate Expiration Date SSL certificate expired.
Certificate Valid Date SSL certificate valid date not yet valid.
Encryption Hash Algorithm Weak SSL encryption hash algorithm.
Encryption Key Length Weak SSL encryption key length.
Certificate Subject Invalid SSL certificate subject.
Exposed Services / Network Filtering Unsafe Network Services Enumeration of unsafe network services running on the system such as databases (e.g. SQL Server, PostgreSQL) and remote access services (e.g. RDP, VNC).
IoT Devices Enumeration of IoT devices such as printers, embedded system interfaces, etc.

Comprehensive domain discovery, continuous posture visibility, and remediation

Cloudflare Security Insights in Cloudflare’s Application Security suite currently identifies risks—such as DNS misconfigurations, weak web encryption, or inactive WAF rules—for any domain already proxied by Cloudflare. However, a significant security gap remains: you cannot protect domains you don’t know exist.

The integration with Mastercard will eliminate these blind spots. By continuously profiling the Internet footprint of over 12 million organizations, Mastercard identifies domains, hosts, and software stacks associated with your company, even if they aren’t yet behind a Cloudflare proxy. This will allow Security Insights to surface shadow IT and unprotected hosts, enabling you to secure them with Cloudflare’s WAF and DDoS protection. 

Visibility is only the first step; understanding the criticality of discovered assets is what allows security teams to prioritize findings. Each host is assigned a criticality level:

  • High Criticality: Assigned to hosts that collect sensitive data, require authentication, or run sensitive network services like database listeners or remote access.

  • Medium Criticality: Assigned to hosts running brochure websites that are adjacent to high-criticality systems, such as those residing on the same class-C network.

  • Low Criticality: Assigned to hosts running brochure websites that are not adjacent to any critical systems.

Below is a fictitious example of an organization with many domains that they are unaware of. Of these discovered domains, only one is currently proxied by Cloudflare. Within Security Insights, you will be able to visualize this level of detail for shadow domains and hosts. 

Domain Protected by Cloudflare Host (IP) Criticality Location Hosting Provider
search-engine.net Yes portal.search-engine.net (10.XXX.XX.5) HIGH Springfield, United States Cloudflare
zenith-industries.com No vpn.zenith-industries.com (10.XXX.XXX.106) HIGH Helsinki, Finland CloudNode-Services
stratus-global.com No store.stratus-global.com (10.XXX.XXX.124) HIGH Munich, Germany SwiftStream-Tech
core-logic.cl No extranet.core-logic.cl (10.XXX.XXX.178) HIGH Santiago, Chile SecureCanopy Ltd.
vanguard-labs.com No extranet.vanguard-labs.com (10.XXX.XX.197) HIGH Metropolis, United States GlobalSoft Systems
fusion-id.com No fusion-id.com (10.XXX.XXX.146) HIGH Prague, Czechia EuroData-Hub
norden-biotech.no No store.norden-biotech.no (10.XXX.XX.124) MEDIUM Chicago, United States SwiftStream-Tech
norden-biotech.se No store.norden-biotech.se (10.XXX.XX.124) MEDIUM Chicago, United States SwiftStream-Tech

Example of shadow domains and unprotected hosts associated with an organization

Mastercard will also allow continuous visibility into the security posture of Internet-facing systems including in areas like software patching, exposed network services (e.g., databases, remote access) and application security (e.g., unauthenticated CMSes) — complementing Cloudflare Security Insights, as shown below.


Security Insights dashboard with shadow domains, unproxied hosts, and posture findings

These insights are only useful if they lead to action. Instead of just telling you that a domain or host is at risk, Cloudflare Security Insights will guide you to fixing them. Possible steps include enabling a Cloudflare proxy (and by extension DDoS and bot protection for shadow zones and hosts), enabling security controls (such as turning on the Web Application Firewall, or WAF) and enforcing stricter TLS encryption to mitigate the specific risks identified by the scan.

What’s next: updated security insights dashboard

We are currently working on integrating Mastercard’s RiskRecon attack surface intelligence into the Cloudflare Security Insights dashboard to provide immediate visibility into shadow domains, unprotected hosts and the posture gaps associated with them.

With an increasing volume of insights, our roadmap also includes risk scoring and building AI-assisted diagnosis paths. That will mean a dashboard that doesn’t just show you an insight, but proposes additional relevant correlations (such as traffic to an unpatched host) and suggests the specific WAF rule or API Shield configuration required to neutralize it.

We would love to have you join the waitlist here.

Fixing request smuggling vulnerabilities in Pingora OSS deployments

Post Syndicated from Edward Wang original https://blog.cloudflare.com/pingora-oss-smuggling-vulnerabilities/

In December 2025, Cloudflare received reports of HTTP/1.x request smuggling vulnerabilities in the Pingora open source framework when Pingora is used to build an ingress proxy. Today we are discussing how these vulnerabilities work and how we patched them in Pingora 0.8.0.

The vulnerabilities are CVE-2026-2833, CVE-2026-2835, and CVE-2026-2836. These issues were responsibly reported to us by Rajat Raghav (xclow3n) through our Bug Bounty Program.

Cloudflare’s CDN and customer traffic were not affected, our investigation found. No action is needed for Cloudflare customers, and no impact was detected. 

Due to the architecture of Cloudflare’s network, these vulnerabilities could not be exploited: Pingora is not used as an ingress proxy in Cloudflare’s CDN.

However, these issues impact standalone Pingora deployments exposed to the Internet, and may enable an attacker to:

  • Bypass Pingora proxy-layer security controls

  • Desync HTTP request/responses with backends for cross-user hijacking attacks (session or credential theft)

  • Poison Pingora proxy-layer caches retrieving content from shared backends

We have released Pingora 0.8.0 with fixes and hardening. While Cloudflare customers were not affected, we strongly recommend users of the Pingora framework to upgrade as soon as possible.

What was the vulnerability?

The reports described a few different HTTP/1 attack payloads that could cause desync attacks. Such requests could cause the proxy and backend to disagree about where the request body ends, allowing a second request to be “smuggled” past proxy‑layer checks. The researcher provided a proof-of-concept to validate how a basic Pingora reverse proxy misinterpreted request body lengths and forwarded those requests to server backends such as Node/Express or uvicorn.

Upon receiving the reports, our engineering team immediately investigated and validated that, as the reporter also confirmed, the Cloudflare CDN itself was not vulnerable. However, the team did also validate that vulnerabilities exist when Pingora acts as the ingress proxy to shared backends.

By design, the Pingora framework does allow edge case HTTP requests or responses that are not strictly RFC compliant, because we must accept this sort of traffic for customers with legacy HTTP stacks. But this leniency has limits to avoid exposing Cloudflare itself to vulnerabilities.

In this case, Pingora had non-RFC-compliant interpretations of request bodies within its HTTP/1 stack that allowed these desync attacks to exist. Pingora deployments within Cloudflare are not directly exposed to ingress traffic, and we found that production traffic that arrived at Pingora services were not subject to these misinterpretations. Thus, the attacks were not exploitable on Cloudflare traffic itself, unlike a previous Pingora smuggling vulnerability disclosed in May 2025.

We’ll explain, case-by-case, how these attack payloads worked.

1. Premature upgrade without 101 handshake

The first report showed that a request with an Upgrade header value would cause Pingora to pass through subsequent bytes on the HTTP connection immediately, before the backend had accepted an upgrade (by returning 101 Switching Protocols). The attacker could thus pipeline a second HTTP request after the upgrade request on the same connection:

GET / HTTP/1.1
Host: example.com
Upgrade: foo


GET /admin HTTP/1.1
Host: example.com

Pingora would parse only the initial request, then treat the remaining buffered bytes as the “upgraded” stream and forward them directly to the backend in a “passthrough” mode due to the Upgrade header (until the response was received).

This is not at all how the HTTP/1.1 Upgrade process per RFC 9110 is intended to work. The subsequent bytes should only be interpreted as part of an upgraded stream if a 101 Switching Protocols header is received, and if a 200 OK response is received instead, the subsequent bytes should continue to be interpreted as HTTP.


An attacker that sends an Upgrade request, then pipelines a partial HTTP request may cause a desync attack. Pingora will incorrectly interpret both as the same upgraded request, even if the backend server declines the upgrade with a 200.

Via the improper pass-through, a Pingora deployment that received a non-101 response could still forward the second partial HTTP request to the upstream as-is, bypassing any Pingora user‑defined ACL-handling or WAF logic, and poison the connection to the upstream so that a subsequent request from a different user could improperly receive the /admin response.


After the attack payload, Pingora and the backend server are now “desynced.” The backend server will wait until it thinks the rest of the partial /attack request header that Pingora forwarded is complete. When Pingora forwards a different user’s request, the two headers are combined from the backend server’s perspective, and the attacker has now poisoned the other user’s response.

We’ve since patched Pingora to switch the interpretation of subsequent bytes only once the upstream responds with 101 Switching Protocols.

We verified Cloudflare was not affected for two reasons:

  1. The ingress CDN proxies do not have this improper behavior.

  2. The clients to our internal Pingora services do not attempt to pipeline HTTP/1 requests. Furthermore, the Pingora service these clients talk directly with disables keep-alive on these Upgrade requests by injecting a Connection: close header; this prevents additional requests that would be sent — and subsequently smuggled — over the same connection.

2. HTTP/1.0, close-delimiting, and transfer-encoding

The reporter also demonstrated what appeared to be a more classic “CL.TE” desync-type attack, where the Pingora proxy would use Content-Length as framing while the backend would use Transfer-Encoding as framing:

GET / HTTP/1.0
Host: example.com
Connection: keep-alive
Transfer-Encoding: identity, chunked
Content-Length: 29

0

GET /admin HTTP/1.1
X:

In the reporter’s example, Pingora would treat all subsequent bytes after the first GET / request header as part of that request’s body, but the node.js backend server would interpret the body as chunked and ending at the zero-length chunk. There are actually a few things going on here:

  1. Pingora’s chunked encoding recognition was quite barebones (only checking for whether Transfer-Encoding was “chunked”) and assumed that there could only be one encoding or Transfer-Encoding header. But the RFC only mandates that the final encoding must be chunked to apply chunked framing. So per RFC, this request should have a chunked message body (if it were not HTTP/1.0 — more on that below).

  2. Pingora was also not actually using the Content-Length (because the Transfer-Encoding overrode the Content-Length per RFC). Because of the unrecognized Transfer-Encoding and the HTTP/1.0 version, the request body was instead treated as close-delimited (which means that the response body’s end is marked by closure of the underlying transport connection). An absence of framing headers would also trigger the same misinterpretation on HTTP/1.0. Although response bodies are allowed to be close-delimited, request bodies are never close-delimited. In fact, this clarification is now explicitly called out as a separate note in RFC 9112.

  3. This is an HTTP/1.0 request that did not define Transfer-Encoding. The RFC mandates that HTTP/1.0 requests containing Transfer-Encoding must “treat the message as if the framing is faulty” and close the connection. Parsers such as the ones in nginx and hyper just reject these requests to avoid ambiguous framing.


When an attacker pipelines a partial HTTP request header after the HTTP/1.0 + Transfer-Encoding request, Pingora would incorrectly interpret that partial header as part of the same request, rather than as a distinct request. This enables the same kind of desync attack as described in the premature Upgrade example.

This spoke to a more fundamental misreading of the RFC particularly in terms of response vs. request message framing. We’ve since fixed the improper multiple Transfer-Encoding parsing, adhere strictly to the request length guidelines such that HTTP request bodies can never be considered close-delimited, and reject invalid Content-Length and HTTP/1.0 + Transfer-Encoding request messages. Further protections we’ve added include rejecting CONNECT requests by default because the HTTP proxy logic doesn’t currently treat CONNECT as special for the purposes of CONNECT upgrade proxying, and these requests have special message framing rules. (Note that incoming CONNECT requests are rejected by the Cloudflare CDN.)

When we investigated and instrumented our services internally, we found no requests arriving at our Pingora services that would have been misinterpreted. We found that downstream proxy layers in the CDN would forward as HTTP/1.1 only, reject ambiguous framing such as invalid Content-Length, and only forward a single Transfer-Encoding: chunked header for chunked requests.

3. Cache key construction

The researcher also reported one other cache poisoning vulnerability regarding default CacheKey construction. The naive default implementation factored in only the URI path (without other factors such as host header or upstream server HTTP scheme), which meant different hosts using the same HTTP path could collide and poison each other’s cache.

This would affect users of the alpha proxy caching feature who chose to use the default CacheKey implementation. We have since removed that default, because while using something like HTTP scheme + host + URI makes sense for many applications, we want users to be careful when constructing their cache keys for themselves. If their proxy logic will conditionally adjust the URI or method on the upstream request, for example, that logic likely also must be factored into the cache key scheme to avoid poisoning.

Internally, Cloudflare’s default cache key uses a number of factors to prevent cache key poisoning, and never made use of the previously provided default.

Recommendation

If you use Pingora as a proxy, upgrade to Pingora 0.8.0 at your earliest convenience.

We apologize for the impact this vulnerability may have had on Pingora users. As Pingora earns its place as critical Internet infrastructure beyond Cloudflare, we believe it’s important for the framework to promote use of strict RFC compliance by default and will continue this effort. Very few users of the framework should have to deal with the same “wild Internet” that Cloudflare does. Our intention is that stricter adherence to the latest RFC standards by default will harden security for Pingora users and move the Internet as a whole toward best practices.

Disclosure and response timeline

– 2025‑12‑02: Upgrade‑based smuggling reported via bug bounty.

– 2026‑01‑13: Transfer‑Encoding / HTTP/1.0 parsing issues reported.

– 2026-01-18: Default cache key construction issue reported.

– 2026‑01‑29 to 2026‑02‑13: Fixes validated with the reporter. Work on more RFC-compliance checks continues.

– 2026-02-25: Cache key default removal and additional RFC checks validated with researcher.

– 2026‑03-02: Pingora 0.8.0 released.

– 2026-03-04: CVE advisories published.

Acknowledgements

We thank Rajat Raghav (xclow3n) for the report, detailed reproductions, and verification of the fixes through our bug bounty program. Please see their corresponding blog for more information.

We would also extend a heartfelt thank you to the Pingora open source community for their active engagement, issue reports, and contributions to the framework. You truly help us build a better Internet.

Active defense: introducing a stateful vulnerability scanner for APIs

Post Syndicated from John Cosgrove original https://blog.cloudflare.com/vulnerability-scanner/

Security is traditionally a game of defense. You build walls, set up gates, and write rules to block traffic that looks suspicious. For years, Cloudflare has been a leader in this space: our Application Security platform is designed to catch attacks in flight, dropping malicious requests at the edge before they ever reach your origin. But for API security, defensive posturing isn’t enough. 

That’s why today, we are launching the beta of Cloudflare’s Web and API Vulnerability Scanner. 

We are starting with the most pervasive and difficult-to-catch threat on the OWASP API Top 10: Broken Object Level Authorization, or BOLA. We will add more vulnerability scan types over time, including both API and web application threats.

The most dangerous API vulnerabilities today aren’t generic injection attacks or malformed requests that a WAF can easily spot. They are logic flaws—perfectly valid HTTP requests that meet the protocol and application spec but defy the business logic.

To find these, you can’t just wait for an attack. You have to actively hunt for them.

The Web and API Vulnerability Scanner will be available first for API Shield customers. Read on to learn why we are focused on API security scans for this first release.

Why purely defensive security misses the mark

In the web application world, vulnerabilities often look like syntax errors. A SQL injection attempt looks like code where data should be. A cross-site scripting (XSS) attack looks like a script tag in a form field. These have signatures.

API vulnerabilities are different. To illustrate, let’s imagine a food delivery mobile app that communicates solely with an API on the backend. Let’s take the orders endpoint:

Endpoint Definition: /api/v1/orders

Method

Resource Path

Description

GET

/api/v1/orders/{order_id}

Check Status. Returns the tracking status of a specific order (e.g., “Kitchen is preparing”).

PATCH

/api/v1/orders/{order_id}

Update Order. Allows the user to modify the drop-off location or add delivery instructions.

In a broken authorization attack like BOLA, User A (the attacker) requests to update the delivery address of a paid-for order belonging to User B (the victim). The attacker simply inserts User B’s {order_id} in the PATCH request.

Here is what that request looks like, with ‘8821’ as User B’s order ID. Notice that User A is fully authenticated with their own valid token:

PATCH /api/v1/orders/8821 HTTP/1.1
Host: api.example.com
Authorization: Bearer <User_A_Valid_Token>
Content-Type: application/json

{
  "delivery_address": "123 Attacker Way, Apt 4",
  "instructions": "Leave at front door, ring bell"
}

The request headers are valid. The authentication token is valid. The schema is correct. To a standard WAF, this request looks perfect. A bot management offering may even be fooled if a human is manually sending the attack requests.

User A will now get B’s food delivered to them! The vulnerability exists because the API endpoint fails to validate if User A actually has permission to view or update user B’s data. This is a failure of logic, not syntax. To fix this, the API developer could implement a simple check: if (order.userID != user.ID) throw Unauthorized;


You can detect these types of vulnerabilities by actively sending API test traffic or passively listening to existing API traffic. Finding these vulnerabilities through passive scanning requires context. Last year we launched BOLA vulnerability detection for API Shield. This detection automatically finds these vulnerabilities by passively scanning customer traffic for usage anomalies. To be successful with this type of scanning, you need to know what a “valid” API call looks like, what the variable parameters are, how a typical user behaves, and how the API behaves when those parameters are manipulated.

Yet there are reasons security teams may not have any of that context, even with access to API Shield’s BOLA vulnerability detection. Development environments may need to be tested but lack user traffic. Production environments may (thankfully) have a lack of attack traffic yet still need analysis, and so on. In these circumstances, and to be proactive in general, teams can turn to Dynamic Application Security Testing (DAST). By creating net-new traffic profiles intended specifically for security testing, DAST tools can look for vulnerabilities in any environment at any time.

Unfortunately, traditional DAST tools have a high barrier to entry. They are often difficult to configure, require you to manually upload and maintain Swagger/OpenAPI files, struggle to authenticate correctly against modern complex login flows, and can simply lack any API-specific security tests (e.g. BOLA).

Cloudflare’s API scanning advantage

In the food delivery order example above, we assumed the attacker could find a valid order to modify. While there are often avenues for attackers to gather this type of intelligence in a live production environment, in a security testing exercise you must create your own objects before testing the API’s authorization controls. For typical DAST scans, this can be a problem, because many scanners treat each individual request on its own. This method fails to chain requests together in the logical pattern necessary to find broken authorization vulnerabilities. Legacy DAST scanners can also exist as an island within your security tooling and orchestration environment, preventing their findings from being shared or viewed in context.

Vulnerability scanning from Cloudflare is different for a few key reasons. 

First, Security Insights will list results from our new scans alongside any existing Cloudflare security findings for added context. You’ll see all your posture management information in one place. 

Second, we already know your API’s inputs and outputs. If you are an API Shield customer, Cloudflare already understands your API. Our API Discovery and Schema Learning features passively catalog your endpoints and learn your traffic patterns. While you’ll need to manually upload an OpenAPI spec to get started for our initial release, you will be able to get started quickly without one in a future release.

Third, because we sit at the edge, we can turn passive traffic inspection knowledge into active intelligence. It will be easy to verify BOLA vulnerability detection risks (found via traffic inspection) by sending net-new HTTP requests with the vulnerability scanner.

And finally, we have built a new, stateful DAST platform, as we detail below. Most scanners require hours of setup to “teach” the tool how to talk to your API. With Cloudflare, you can effectively skip that step and get started quickly. You provide the API credentials, and we’ll use your API schemas to automatically construct a scan plan.

Building automatic scan plans

APIs are commonly documented using OpenAPI schemas. These schemas denote the host, method, and path (commonly, an “endpoint”) along with the expected parameters of incoming requests and resulting responses. In order to automatically build a scan plan, we must first make sense of these API specifications for any given API to be scanned.

Our scanner works by building up an API call graph from an OpenAPI document and subsequently walking it, using attacker and owner contexts. Owners create resources, attackers subsequently try to access them. Attackers are fully authenticated with their own set of valid credentials. If an attacker successfully reads, modifies or deletes an unowned resource, an authorization vulnerability is found.

Consider for example the above delivery order with ID 8821. For the server-side resource to exist, it needed to be originally created by an owner, most likely in a “genesis” POST request with no or minimal dependencies (previous necessary calls and resulting data). Modelling the API as a call graph, such an endpoint constitutes a node with no or few incoming edges (dependencies). Any subsequent request, such as the attacker’s PATCH above, then has a data dependency (the data is order_id) on the genesis request (the POST). Without all data provided, the PATCH cannot proceed.


Here we see in purple arrows the nodes in this API graph that are necessary to visit an order to add a note to an order via the POST /api/v1/orders/{order_id}/note/{note_id} endpoint. Importantly, none of the steps or logic shown in the diagram is available in the OpenAPI specification! It must be inferred logically through some other means, and that is exactly what our vulnerability scanner will do automatically.

In order to reliably and automatically plan scans across a variety of APIs, we must accurately model these endpoint relationships from scratch. However, two problems arise: data quality of API specifications is not guaranteed, and even functionally complete schemas can have ambiguous naming schemes. Consider a simplified OpenAPI specification for the above API, which might look like

openapi: 3.0.0
info:
  title: Order API
  version: 1.0.0
paths:
  /api/v1/orders:
    post:
      summary: Create an order
      requestBody:
        required: true
        content:
          application/json:
            schema:
              type: object
              properties:
                product:
                  type: string
                count:
                  type: integer
              required:
                - product
                - count
      responses:
        '201':
          description: Item created successfully
          content:
            application/json:
              schema:
                type: object
                properties:
                  result:
                    type: object
                    properties:
                      id:
                        type: integer
                      created_at:
                        type: integer
                  errors:
                    type: array
                    items:
                      type: string
  /api/v1/orders/{order_id}:
    patch:
      summary: Modify an order by ID
      parameters:
        - name: order_id
          in: path

We can see that the POST endpoint returns responses such as

{
    "result": {
        "id": 8821,
        "created_at": 1741476777
    },
   "errors": []
}

To a human observer, it is quickly evident that $.result.id is the value to be injected in order_id for the PATCH endpoint. The id property might also be called orderId, value or something else, and be nested arbitrarily. These subtle inconsistencies in OpenAPI documents of arbitrary shape are intractable for heuristics-based approaches.

Our scanner uses Cloudflare’s own Workers AI platform to tackle this fuzzy problem space. Models such as OpenAI’s open-weight gpt-oss-120b are powerful enough to match data dependencies reliably, and to generate realistic fake data where necessary, essentially filling in the blanks of OpenAPI specifications. Levering structured outputs, the model produces a representation of the API call graph for our scanner to walk, injecting attacker and owner credentials appropriately.

This approach tackles the problem of needing human intelligence to infer authorization and data relationships in OpenAPI schemas with artificial intelligence to do the same. Structured outputs bridge the gap from the natural language world of gpt-oss back to machine-executable instructions. In addition to Workers AI solving the planning problem, self-hosting on Workers AI means our system automatically benefits from Cloudflare’s highly available, globally distributed architecture.

Built on proven foundations

Building a vulnerability scanner that customers will trust with their API credentials demands proven infrastructure. We did not reinvent the wheel here. Instead, we integrated services that have been validated and deployed across Cloudflare for two crucial components of our scanner platform: the scanner’s control plane and the scanner’s secrets store.

The scanner’s control plane integrates with Temporal for Scan Orchestration, on which other internal services at Cloudflare already rely. The complexity of the numerous test plans executed in each Scan is effectively managed by Temporal’s durable execution framework. 

The entire backend is written in Rust, which is widely adopted at Cloudflare for infrastructure services. This lets us reuse internal libraries and share architectural patterns across teams. It also positions our scanner for potential future integration with other Cloudflare systems like FL2 or our test framework Flamingo – enabling scenarios where scanning could coordinate more tightly with edge request handling or testing infrastructure.

Credential security through HashiCorp’s Vault Transit Secret Engine

Scanning for broken authentication and broken authorization vulnerabilities requires handling API user credentials. Cloudflare takes this responsibility very seriously.

We ensure that our public API layer has minimal access to unencrypted customer credentials by using HashiCorp’s Vault Transit Secret Engine (TSE) for encryption-as-a-service. Immediately upon submission, credentials are encrypted by TSE—which handles the encryption but does not store the ciphertext—and are subsequently stored on Cloudflare infrastructure. 

Our API is not authorized to decrypt this data. Instead, decryption occurs only at the last stage when a TestPlan makes a request to the customer’s infrastructure. Only the Worker executing the test is authorized to request decryption, a restriction we strengthen using strict typing with additional safety rails inside Rust to enforce minimal access to decryption methods.

We further secure our customers’ credentials through regular rotation and periodic rewraps using TSE to mitigate risk. This process means we only interact with the new ciphertext, and the original secret is kept unviewable.

What’s next?

We are releasing BOLA vulnerability scanning starting today as an Open Beta for all API Shield customers, and are working on future API threat scans for future release. Via the Cloudflare API, you can trigger scans, manage configuration, and retrieve results programmatically to integrate directly into your CI/CD pipelines or security dashboards. For API Shield Customers: check the developer docs to start scanning your endpoints for BOLA vulnerabilities today.

We are starting with BOLA vulnerabilities because they are the hardest API vulnerability to solve and the highest risk for our customers. However, this scanning engine is built to be extensible.

In the near future, we plan to expand the scanner’s capabilities to cover the most popular of the OWASP Web Top 10 as well: classic web vulnerabilities like SQL injection (SQLi) and cross-site scripting (XSS). To be notified upon release, sign up for the waitlist here, and you’ll be first to learn when we expand the engine to general web application vulnerabilities.

From Code to Runtime: The Critical Role of DAST in Application Security

Post Syndicated from Xavia Hennessy original https://www.rapid7.com/blog/post/cds-code-to-runtime-dast-in-application-security

Regardless of where you’re at in your application security maturity, dynamic application security testing (DAST) is a program staple in a few key ways:

  1. It satisfies compliance requirements for runtime-related vulnerabilities. 

  2. DAST catches vulnerabilities in the running web application, yielding findings that may be missed in static code testing.

  3. It is security-driven with little overhead in configuration/maintenance from development or application teams.

Due to the nature of web apps powering mission-critical operations – hyperscaled of course by AI protocols that automate key processes within these apps – continuous DAST is essential to identifying and remediating potential weaknesses that could quickly lead to costly data breaches.

Compliance requirements

DAST helps satisfy multiple compliance requirements by simulating real-world attacks so it can test a running application for vulnerabilities.. While DAST alone doesn’t make you compliant, it supports key controls in many security standards and regulations. Get to know 7 of today’s top standards and frameworks, see which requirements they satisfy, and learn how DAST helps secure the following:

PCI DSS

Payment Card Industry Data Security Standard (PCI DSS) is the global security standard for any organization that stores, processes, or transmits payment-card data. DAST directly supports PCI compliance by performing vulnerability scans against live web apps.

Requirements satisfied: 

  • Requirement 6.1 & 6.2: Identifying and addressing vulnerabilities.

  • Requirement 6.6: All public-facing web applications must be either:

    • Protected with application-layer firewall (WAF), or

    • Tested for vulnerabilities (e.g., via DAST) at least annually.


OWASP Top Ten

While the Open Worldwide Application Security Project (OWASP) is not a compliance framework, the nonprofit organization is often referenced by industry and regulatory standards. 

Requirements satisfied:

  • DAST tools are often tested against OWASP Top 10 vulnerabilities (e.g., XSS, SQLi, SSRF).


HIPAA

The Health Insurance Portability and Accountability Act (HIPAA) sets national standards for protecting electronic protected health information (ePHI). DAST supports risk assessment by identifying live vulnerabilities with the potential to expose such information.

Requirements satisfied: 

  • Security Rule (45 CFR § 164.308 & § 164.312):

    • Requires organizations to perform regular risk assessments.

    • Includes application-level vulnerabilities as part of overall system security.


ISO/IEC 27001

ISO/International Electrotechnical Commission (ISO/IEC) is the international standard that specifies requirements for an information security management system (ISMS). DAST helps fulfill this requirement by scanning running applications for known and exploitable vulnerabilities.

Requirements satisfied: 

  • Annex A.12.6.1: Management of technical vulnerabilities – Requires timely detection and remediation of vulnerabilities.


NIST SP 800-53/800-171

The National Institute of Standards and Technology (NIST) is a U.S. federal agency that develops measurement science, standards, and tech to boost innovation and economic security. DAST can be used to meet these technical controls.

Requirements satisfied: 

  • RA-5 (vulnerability scanning): Requires scanning of systems and applications.

  • SI-2 (faw remediation): Identify, report, and fix flaws in software.


SOC 2

System and Organization Controls 2 (SOC2) is an independent attestation report (from a licensed CPA firm) that evaluates whether a service organization’s controls are suitably designed. DAST contributes evidence for audit logs and control effectiveness over time.

Requirements satisfied: 

  • Under the “Security” Trust Services Criteria, particularly:

    • CC4.1: Monitor infrastructure for new threats.

    • CC7.1/CC7.2: Detect and mitigate vulnerabilities.


GDPR

General Data Protection Regulation (GDPR) harmonizes privacy rules across the EU and sets requirements for how organizations collect, use, share, and protect personal data. DAST can be part of regular security testing under GDPR, especially if the app processes personal data.

Requirements satisfied: 

  • Article 32 – Security of Processing:

    • Organizations must ensure the ongoing confidentiality, integrity, availability of systems.

    • Requires regular testing and evaluation of security measures.

Missed findings

Static application security testing (SAST) tools are effective at flagging insecure values on their own, but they often miss the broader application context needed to assess whether those values actually introduce risk. Here are some examples of findings that can be overlooked:

Forced browsing

Forced browsing (also called insecure direct object reference or unauthorized resource access) occurs when:

  • A user can manually access restricted resources (files, endpoints, or actions) by guessing or modifying a URL.

  • There are missing access controls or authorization checks.

Example: A user modifies a URL

https://example.com/admin/settings

Even though they’re not an admin, the app still serves the page because it lacks proper access controls.

SAST struggles to detect these findings due to:

  • Lack of visibility into runtime access control

    • SAST scans source code, but can’t simulate user roles or sessions.

    • It doesn’t know who should or shouldn’t be able to access a specific path.

  • Abstracted access control logic

    • Authorization might be handled via middleware, annotations, config files, or external services (e.g., OAuth).

    • SAST often can’t follow the full enforcement logic, especially if it’s custom or dynamic.

  • Lack of awareness around routing and resource exposure

    • SAST doesn’t map which endpoints exist versus which are intended to be public.

    • It can’t verify which files/resources are accessible through URLs.

Out-of-band (OOB) cross-site scripting (XSS)

Out-of-band cross-site-scripting OOB XSS (a subtype of stored or blind XSS) occurs when:

  • A malicious script is injected into an application (e.g., a form, comment, or field).

  • The script doesn’t execute immediately but instead fires later, often:

    • In a different user’s browser (e.g., an admin viewing logs).

    • In an email client (e.g., via notification messages).

    • In a third-party system or admin dashboard.

These attacks are asynchronous and context-shifted, meaning they don’t happen in the direct request-response flow. SAST struggles to detect these findings due to:

  • Missing runtime context: SAST analyzes source code statically, line by line, without executing it. It doesn’t track:

    • Where the injected payload ends up.

    • How or where it’s later rendered.

    • Whether it’s rendered in a dangerous context (HTML, JS, email, etc.).

  • Visibility is limited to code flow: SAST typically can’t follow data across storage layers or external systems. OOB XSS often spans:

    • User-submitted input → stored in DB.

    • Later retrieved → rendered in admin UI or email.

  • Unable to observe execution: The XSS payload doesn’t fire in the original request, so SAST has no way to “see” the exploit being triggered because it doesn’t execute code.

Web config findings

Settings defined in the web config file can pose challenges for SAST tools. Depending on the tooling, these files may not be properly parsed, potentially causing the tool to miss important findings due to a lack of contextual understanding, such as:

Custom error handling depends on deployment mode

<customErrors mode="RemoteOnly" />

⠀
✔ Looks fine in static analysis; it shows friendly errors to remote users.

✖ Contextual issue: If the app is misconfigured to treat all users as local, then stack traces are exposed even with this setting.

SSL enforcement logic in code, not in config.

<rewrite>
<!-- Missing rule for HTTPS redirection -->
</rewrite>

⠀
✔ SAST flags the absence of HTTPS redirection in web.config, which is a valid finding.

✖  Contextual issue: If HTTPS redirection is handled in middleware or at a reverse proxy (like NGINX or Azure App Gateway), then this isn’t actually a security risk. SAST can’t always know that.

Authentication mode

<authentication mode="None" />

⠀
✔ SAST will likely flag this as a critical issue.

✖  Contextual issue: If the app is a microservice behind an API gateway that handles auth, this may be acceptable. A SAST tool unaware of deployment architecture may raise false positives.

Debug enabled in a non-prod environment

<compilation debug="true" />

⠀
✔ Flagged by SAST, correctly so in most cases.

✖ Contextual issue: If this web.config is only used in a staging or development slot, it might be intentional and not a production risk.

Authorization settings ignored in custom pipelines

<authorization>
  <deny users="?" />
</authorization>

⠀

✔ This looks like it blocks anonymous access.

✖ Contextual issue: If a custom authentication mechanism bypasses ASP.NET authorization modules, this setting may be ineffective, but a SAST tool won’t see that unless it’s deeply integrated with the entire codebase.

Developer overhead

For organizations seeking to minimize developer burden, DAST is frequently the preferred option over SAST.  DAST processes evolve alongside your web applications, continuing to scan them so that your business can promptly identify and remediate emerging issues. Let’s finish by taking a look at a range of underlying dynamics that make DAST an easy decision for developers looking to fortify application security – table below.

⠀

Developer-overhead-DAST-capability-chart.png

Toxic combinations: when small signals add up to a security incident

Post Syndicated from Bashyam Anant original https://blog.cloudflare.com/toxic-combinations-security/

At 3 AM, a single IP requested a login page. Harmless. But then, across several hosts and paths, the same source began appending ?debug=true — the sign of an attacker probing the environment to assess the technology stack and plan a breach.

Minor misconfigurations, overlooked firewall events, or request anomalies feel harmless on their own. But when these small signals converge, they can explode into security incidents known as “toxic combinations.” These are exploits where an attacker discovers and compounds many minor issues — such as a debug flag left on a web application or an unauthenticated application path — to breach systems or exfiltrate data.

Cloudflare’s network observes requests to your stack, and as a result, has the data to identify these toxic combinations as they form. In this post, we’ll show you how we surface these signals from our application security data. We’ll go over the most common types of toxic combinations and the dangerous vulnerabilities they present. We will also provide details on how you can use this intelligence to identify and address weaknesses in your stack. 

How we define toxic combinations

You could define a “toxic combination” in a few different ways, but here is a practical one based on how we look at our own datasets. Most web attacks eventually scale through automation; once an attacker finds a viable exploit, they’ll usually script it into a bot to finish the job. By looking at the intersection of bot traffic, specific application paths, request anomalies and misconfigurations, we can spot a potential breach. We use this framework to reason through millions of requests per second. 

While point defenses like Web Application Firewalls (WAF), bot detection, and API protection have evolved to incorporate behavioral patterns and reputation signals, they still primarily focus on evaluating the risk of an individual request. In contrast, Cloudflare’s detections for “toxic combinations” shift the lens toward the broader intent, analyzing the confluence of context surrounding multiple signals to identify a brewing incident.


Toxic combinations as contextualized detections

That shift in perspective matters because many real incidents have no obvious exploit payload, no clean signatures, and no single event that screams “attack.” So, in what follows, we combine the following context to construct several toxic combinations:

  • Bot signals

  • Application paths, especially sensitivity ones: admin, debug, metrics, search, payment flows

  • Anomalies including: unexpected http codes, geo jumps, identity mismatch, high ID churn, rate-limit evasion (distributed IPs doing the same thing), request or success rate spikes 

  • Vulnerabilities or misconfigurations: missing session cookies or auth headers, predictable identifiers

Examples of toxic combinations on popular application stacks

We looked at a 24-hour window of Cloudflare data to see how often these patterns actually appear in popular application stacks. As shown in the table below, about 11% of the hosts we analyzed were susceptible to these combinations, skewed by vulnerable WordPress websites. Excluding WordPress sites, only 0.25% of hosts show signs of exploitable toxic combinations. While rare, they represent hosts that are vulnerable to compromise.

To make sense of the data, we broke it down into three stages of an attack:

  • Estimated hosts probed: This is the “wide net.” It counts unique hosts where we saw HTTP requests targeting specific sensitive paths (like /wp-admin).

  • Estimated hosts filtered by toxic combination: Here, we narrowed the list down to the specific hosts that actually met our criteria for a toxic combination.

  • Estimated reachable hosts: Unique hosts that responded successfully to an exploit attempt—the “smoking gun” of an attack. A simple 200 OK response (such as one triggered by appending ?debug=true) could be a false positive. We validated paths to filter out noise caused by authenticated paths that require credentials despite the 200 status code, redirects that mask the true exploit path, and origin misconfigurations that serve success codes for unreachable paths.

In the next sections, we’ll dig into the specific findings and the logic behind the combinations that drove them. The detection queries provided are necessary but not sufficient without testing for reachability; it is possible that the findings might be false positives. In some cases, Cloudflare Log Explorer allows these queries to be executed on unsampled Cloudflare logs. 

Table 1. Summary of Toxic Combinations


Probing of sensitive administrative endpoints across multiple application hosts

What did we detect? 

We observed automated tools scanning common administrative login pages — like WordPress admin panels (/wp-admin), database managers, and server dashboards. A templatized version of the query, executable in Cloudflare Log Explorer, is below:

SELECT
  clientRequestHTTPHost,
  COUNT(*) AS request_count
FROM
  http_requests 
WHERE
  timestamp >= '{{START_DATE}}'
  AND timestamp <= '{{END_DATE}}'
  AND edgeResponseStatus = 200
  AND clientRequestPath LIKE '{{PATH_PATTERN}}' //e.g. '%/wp-admin/%'
  AND NOT match( extract(clientRequestHTTPHost, '^[^:/]+'), '^\\d{1,3}(\\.\\d{1,3}){3}(:\\d+)?$') // comment this line for Cloudflare Log Explorer
  AND botScore < {{BOT_THRESHOLD}} // we used botScore < 30
GROUP BY
  clientRequestHTTPHost
ORDER BY
  request_count DESC;

Why is this serious?

Publicly accessible admin panels can enable brute force attacks. If successful, an attacker can further compromise the host by adding it to a botnet that probes additional websites for similar vulnerability. In addition, this toxic combination can lead to:

  • Exploit scanning: Attackers identify the specific software version you’re running (like Tomcat or WordPress) and launch targeted exploits for known vulnerabilities (CVEs).

  • User enumeration: Many admin panels accidentally reveal valid usernames, which helps attackers craft more convincing phishing or login attacks.

What evidence supports it?

Toxic combination of bots automation and exposed management interfaces like: /wp-admin/, /admin/, /administrator/, /actuator/*, /_search/, /phpmyadmin/, /manager/html/, and /app/kibana/.

Ingredient

Signal

Description

Bot activity

Bot Score < 30

Bot signatures typical of vulnerability scanners

Anomaly

Repeated Probing

Unusual hits on admin endpoints

Vulnerability

Publicly accessible endpoint

Successful requests to admin endpoints

How do I mitigate this finding?

  1. Implement Zero Trust Access. 

  2. If for any reason the endpoint has to remain public, implement a challenge platform to add friction to bots.

  3. Implement IP allowlist: Use your WAF or server configuration to ensure that administrative paths are only reachable from your corporate VPN or specific office IP addresses.

  4. Cloak admin paths: If your platform allows it, rename default admin URLs (e.g., change /wp-admin to a unique, non-guessable string).

  5. Deploy geo-blocking: If your administrators only operate from specific countries, block all traffic to these sensitive paths coming from outside those regions.

  6. Enforce multi-factor authentication (MFA): Ensure every administrative entry point requires a second factor; a password alone is not enough to stop a dedicated crawler.

Unauthenticated public API endpoints allowing mass data exposure via predictable identifiers

What did we detect? 

We found API endpoints that are accessible to anyone on the Internet without a password or login (see OWASP: API2:2023 – Broken Authentication). Even worse, the way it identifies records (using simple, predictable ID numbers,see OWASP: API1:2023- Broken Object Level Authorization) allows anyone to simply “count” through your database — making it much simpler for attackers to enumerate and “scrape” your business records, without even visiting your website directly.

SELECT
  uniqExact(clientRequestHTTPHost) AS unique_host_count
FROM  http_requests
WHERE timestamp >= '2026-02-13'
  AND timestamp <= '2026-02-14'
  AND edgeResponseStatus = 200
  AND bmScore < 30
  AND (
       match(extract(clientRequestQuery, '(?i)(?:^|[&?])uid=([^&]+)'),  '^[0-9]{3,10}$')
    OR match(extract(clientRequestQuery, '(?i)(?:^|[&?])user=([^&]+)'), '^[0-9]{3,10}$')
    OR length(extract(clientRequestQuery, '(?i)(?:^|[&?])uid=([^&]+)'))  BETWEEN 3 AND 8
    OR length(extract(clientRequestQuery, '(?i)(?:^|[&?])user=([^&]+)')) BETWEEN 3 AND 8
  )

Why is this serious?

This is a “zero-exploit” vulnerability, meaning an attacker doesn’t need to be a hacker to steal your data; they just need to change a number in a web link. This leads to:

  • Mass Data Exposure: Large-scale scraping of your entire customer dataset.

  • Secondary Attacks: Stolen data is used for targeted phishing or account takeovers.

  • Regulatory Risk: Severe privacy violations (GDPR/CCPA) due to exposing sensitive PII.

  • Fraud: Competitors or malicious actors gaining insight into your business volume and customer base.

What evidence supports it?

Toxic combination of missing security controls and automation targeting particular API endpoints.

Ingredient

Signal

Description

Bot activity

Bot Score < 30

High volume of requests from a single client fingerprint iterating through different IDs.

Anomaly

High Cardinality of tid

A single visitor accessing hundreds or thousands of unique resource IDs in a short window.

Anomaly

Stable Response Size

Consistent JSON structures and file sizes, indicating successful data retrieval for each guessed ID.

Vulnerability

Missing Auth Signals

Requests lack session cookies, Bearer tokens, or Authorization headers entirely.

Misconfiguration

Predictable Identifiers

The tid parameter uses low-entropy, predictable integers (e.g., 1001, 1002, 1003).

While the query checked for bot score and predictable identifiers, signals like high cardinality, stable response sizes and missing authentication were tested on a sample of traffic matching the query. 

How do I mitigate this finding?

  1. Enforce authentication: Immediately require a valid session or API key for the affected endpoint. Do not allow “Anonymous” access to data containing PII or business secrets.

  2. Implement authorization (IDOR check): Ensure the backend checks that the authenticated user actually has permission to view the specific tid they are requesting.

  3. Use UUIDs: Replace predictable, sequential integer IDs with long, random strings (UUIDs) to make “guessing” identifiers computationally impossible.

  4. Deploy API Shield: Enable Cloudflare API Shield with features like Schema Validation (to block unexpected inputs) and BOLA Detection.

Debug parameter probing revealing system details

What did we detect? 

We found evidence of debug=true appended to web paths to reveal system details. A templatized version of the query, executable in Cloudflare Log Explorer, is below:

SELECT
  clientRequestHTTPHost,
  COUNT(rayId) AS request_count
FROM
  http_requests
WHERE
  timestamp >= '{{START_TIMESTAMP}}'
  AND timestamp < '{{END_TIMESTAMP}}'
  AND edgeResponseStatus = 200
  AND clientRequestQuery LIKE '%debug=false%'
  AND botScore < {{BOT_THRESHOLD}}
GROUP BY
  clientRequestHTTPHost
ORDER BY
  request_count DESC;

Why is this serious?

While this doesn’t steal data instantly, it provides an attacker with a high-definition map of your internal infrastructure. This “reconnaissance” makes their next attack much more likely to succeed because they can see:

  • Hidden data fields: Sensitive internal information that isn’t supposed to be visible to users.

  • Technology stack details: Specific software versions and server types, allowing them to look up known vulnerabilities for those exact versions.

  • Logic hints: Error messages or stack traces that explain exactly how your code works, helping them find ways to break it.

What evidence supports it?

Toxic combination of automated probing and misconfigured diagnostic flags targeting the Multiple Hosts and Application Paths.

Ingredient

Signal

Description

Bot activity

Bot Score < 30

Vulnerability scanner activity

Anomaly

Response Size Increase

Significant jumps in data volume when a debug flag is toggled, indicating details or stack traces are being leaked. Add these additional conditions, if needed:

SELECT

AVG(edgeResponseBytes) AS avg_payload_size, 

WHERE

edgeResponseBytes > {{your baseline response size}}

Anomaly

Repeated Path Probing

Rapid-fire requests across diverse endpoints (e.g., /api, /login, /search) specifically testing for the same diagnostic triggers. Add these conditions, if needed:

SELECT

APPROX_DISTINCT(clientRequestPath) AS unique_endpoints_tested 

HAVING 

unique_endpoints_tested > 1

Misconfiguration

Debug Parameter Allowed

The presence of active “debug,” “test,” or “dev” flags in production URLs that change application behavior.

Vulnerability

Schema disclosure

The appearance of internal-only JSON fields or “Firebase-style” .json dumps that reveal the underlying structure.

While the query checked for bot score and paths with debug parameters, signals like repeated probing, response sizes and schema disclosure were tested on a sample of traffic matching the query. 

How do I mitigate this finding?

  1. Disable debugging in production: Ensure that all “debug” or “development” environment variables are strictly set to false in your production deployment configurations.

  2. Filter parameters at the edge: Use your WAF or API Gateway to strip out known debug parameters (like ?debug=, ?test=, ?trace=) before they ever reach your application servers.

  3. Sanitize error responses: Configure your web servers (Nginx, Apache, etc.) to show generic error pages instead of detailed stack traces or internal system messages.

  4. Audit firebase/DB rules: If you are using Firebase or similar NoSQL databases, ensure that /.json path access is restricted via strict security rules, so public users cannot dump the entire schema or data.

Publicly exposed monitoring endpoints providing internal infrastructure visibility

What did we detect? 

We discovered “health check” and monitoring dashboards are visible to the entire Internet. Specifically, paths like /actuator/metrics are responding to anyone who asks. A templatized version of the query, executable in Cloudflare Log Explorer, is below::

SELECT
  clientRequestHTTPHost,
  count() AS request_count
FROM http_requests
WHERE timestamp >= toDateTime('{{START_DATE}}')
  AND timestamp <  toDateTime('{{END_DATE}}')
  AND botScore < 30
  AND edgeResponseStatus = 200
  AND clientRequestPath LIKE '%/actuator/metrics%' // an example
GROUP BY
  clientRequestHTTPHost
ORDER BY request_count DESC

Why is this serious?

While these endpoints don’t usually leak customer passwords directly, they provide the “blueprints” for a sophisticated attack. Exposure leads to:

  • Strategic timing: Attackers can monitor your CPU and memory usage in real-time to launch a Denial of Service (DoS) attack exactly when your systems are already stressed.

  • Infrastructure mapping: These logs often reveal the names of internal services, dependencies, and version numbers, helping attackers find known vulnerabilities to exploit.

  • Exploitation chaining: Information about thread counts and environment hints can be used to bypass security layers or escalate privileges within your network.

What evidence supports it?

Toxic combination of misconfigured access controls and automated reconnaissance targeting the Asset/Path: /actuator/metrics, /actuator/prometheus, and /health.

Ingredient

Signal

Description

Bot activity

Bot Score < 30

Automated scanning tools are systematically checking for specific paths

Anomaly

Monitoring Fingerprint

The response body matches known formats (Prometheus, Micrometer, or Spring Boot), confirming the system is leaking live data.

Anomaly

HTTP 200 Status

Successful data retrieval from endpoints that should ideally return a 403 Forbidden or 404 Not Found to the public.

Misconfiguration

Public Monitoring Path

Public accessibility of internal-only endpoints like /actuator/* that are intended for private observability.

Vulnerability

Missing Auth

These endpoints are reachable without a session token, API key, or IP-based restriction.

How do I mitigate this finding?

  1. Restrict access via WAF: Immediately create a firewall rule to block any external traffic requesting paths containing /actuator/ or /prometheus.

  2. Bind to localhost: Reconfigure your application frameworks to only serve these monitoring endpoints on localhost (127.0.0.1) or a private management network.

  3. Enforce basic auth: If these must be accessed over the web, ensure they are protected by strong authentication (at a minimum, complex Basic Auth or mTLS).

  4. Disable unnecessary endpoints: In Spring Boot or similar frameworks, disable any “Actuator” features that are not strictly required for production monitoring.

Unauthenticated search endpoints allowing direct index dumping

What did we detect? 

Search endpoints (like Elasticsearch or OpenSearch) that are usually meant for internal use are wide open to the public. The templatized query is:

SELECT
  clientRequestHTTPHost,
  count() AS request_count
FROM http_requests
WHERE timestamp >= toDateTime('{{START_DATE}}')
  AND timestamp <  toDateTime('{{END_DATE}}')
  AND botScore < 30
  AND edgeResponseStatus = 200
AND clientRequestPath like '%/\_search%'
AND NOT match(extract(clientRequestHTTPHost, '^[^:/]+'), '^\\d{1,3}(\\.\\d{1,3}){3}(:\\d+)?$')
GROUP BY
  clientRequestHTTPHost

Why is this serious?

This is a critical vulnerability because it requires zero technical skill to exploit, yet the damage is extensive:

  • Mass data theft: Attackers can “dump” entire indices, stealing millions of records in minutes.

  • Internal reconnaissance: By viewing your “indices” (the list of what you store), attackers can identify other high-value targets within your network.

  • Data sabotage: Depending on the setup, an attacker might not just read data — they could potentially modify or delete your entire search index, causing a massive service outage.

What evidence supports it?

We are seeing a toxic combination of misconfigured exposure and automated traffic and data enumeration targeting  /_search, /_cat/indices, and /_cluster/health.

Ingredient

Signal

Description

Bot activity

Bot Score < 30

High-velocity automation signatures attempting to paginate through large datasets and “scrape” the entire index.

Anomaly

Unexpected  Response Size

Large JSON response sizes consistent with bulk data retrieval rather than simple status checks.

Anomaly

Repeated Query Patterns

Systematic “enumeration” behavior where the attacker is cycling through every possible index name to find sensitive data.

Vulnerability

/_search or /_cat/ Patterns

Direct exposure of administrative and query-level paths that should never be reachable via a public URL.

Misconfiguration

HTTP 200 Status

The endpoint is actively fulfilling requests from unauthorized external IPs instead of rejecting them at the network or application level.

While the query checked for bot score and paths, signals like repeated query patterns, response sizes, and schema disclosure were tested on a sample of traffic matching the query. 

How do I mitigate this finding?

  1. Restrict network access: Immediately update your Firewall/Security Groups to ensure that search ports (e.g., 9200, 9300) and paths are only accessible from specific internal IP addresses.

  2. Enable authentication: Turn on “Security” features for your search cluster (like Shield or Search Guard) to require valid credentials for every API call.

  3. WAF blocking: Deploy a WAF rule to immediately block any request containing /_search, /_cat, or /_cluster coming from the public Internet.

  4. Audit for data loss: Review your database logs for large “Scroll” or “Search” queries from unknown IPs to determine exactly how much data was exfiltrated.

Successful SQL injection attempt on application paths 

What did we detect? 

We’ve identified attackers who sent a malicious request—specifically a SQL injection designed to trick databases. A templatized version of the query, executable in Cloudflare Log Explorer, is below:

SELECT
  clientRequestHTTPHost,
  count() AS request_count
FROM http_requests
WHERE timestamp >= toDateTime('{{START_DATE}}')
  AND timestamp <  toDateTime('{{END_DATE}}')
  AND botScore < 30
AND wafmlScore<30
  AND edgeResponseStatus = 200
AND LOWER(clientRequestQuery) LIKE '%sleep(%'
GROUP BY
  clientRequestHTTPHost
ORDER BY request_count DESC

Why is this serious?

This is the “quiet path” to a data breach. Because the system returned a successful status code (HTTP 200), these attacks often blend in with legitimate traffic. If left unaddressed, an attacker can:

  • Refine their methods: Use trial and error to find the exact payload that bypasses your filters.

  • Exfiltrate data: Slowly drain database contents or leak sensitive secrets (like API keys) passed in URLs.

  • Stay invisible: Most automated alerts look for “denied” attempts; a “successful” exploit is much harder to spot in a sea of logs.

What evidence supports it?

We are seeing a toxic combination of automated bot signals, anomalies and application-layer vulnerabilities targeting many application paths.

Ingredient

Signal

Description

Bot

Bot Score < 30

High probability of automated traffic; signatures and timing consistent with exploit scripts.

Anomaly

HTTP 200 on sensitive path

Successful responses returning from a login endpoint that should have triggered a WAF block.

Anomaly

Repeated Mutations

High-frequency variations of the same request, indicating an attacker “tuning” their payload.

Vulnerability

Suspicious Query Patterns

Use of SLEEP commands and time-based patterns designed to probe database responsiveness.

How do I mitigate this finding?

  1. Immediate virtual patching: Update your WAF rules to specifically block the SQL patterns identified (e.g., time-based probes).

  2. Sanitize inputs: Review the backend code for this path to ensure it uses prepared statements or parameterized queries.

  3. Remediate secret leakage: Move any sensitive data from URL parameters to the request body or headers. Rotate any keys flagged as leaked.

  4. Audit logs: Check database logs for the timeframe of the “HTTP 200” responses to see if any data was successfully extracted.

Examples of toxic combinations on payment flows

Card testing and card draining are some of the most common fraud tactics. An attacker might buy a large batch of credit cards from the dark web. Then, to verify how many cards are still valid, they might test the card on a website by making small transactions. Once validated, they might use such cards to make purchases, such as gift cards, on popular shopping destinations. 

Suspected card testing on payment flows

What did we detect?

On payment flows (/payment, /checkout, /cart), we found certain hours of the day when either the hourly request volume from bots or hourly payment success ratio spiked by more than 3 standard deviations from their hourly baselines over the prior 30 days. This could be related to card testing where an attacker is trying to validate lots of stolen credits. Of course, marketing campaigns might cause request spikes while payment outages might cause sudden drops in success ratios.


Why is this serious?

Payment success ratio drops coinciding with request spikes, in the absence of marketing campaigns or payment outages or other factors, could mean bots are in the middle of a massive card-testing run.

What evidence supports it?

We used a combination of bot signals and anomalies on /payment, /checkout, /cart:

Ingredient

Signal

Description

Bot

Bot Score < 30

High probability of automated traffic rather than humans making mistakes

Anomaly

Volume Z-Score > 3.0, calculated from request volume baseline for a given hour based on the past 30 days and evaluated each hour. This factors daily seasonality as well. 

Scaling Event: The attacker is testing a batch of cards

Anomaly

Success ratio Z > 3.0, calculated from success ratio baseline for a given hour based on the past 30 days and evaluated each hour. This factors daily seasonality as well. 

Sudden drops in success ratio may mean cards being declined as they are reported lost or stolen

How do I mitigate this?

Use the 30-day payment paths hourly request volume baseline as the hourly rate limit for all requests with bot scores < 30 on payment paths.  

Suspected card draining on payment flows

What did we detect?

On payment flows (/payment, /checkout, /cart), we found certain hours of the day when either the hourly request volume from humans (or bots impersonating humans) or hourly payment success ratio spiked by more than 3 standard deviations from their hourly baselines over the prior 30 days. This could be related to card draining where an attacker (either humans or bots impersonating humans) is trying to purchase goods using valid but stolen credits. Of course, marketing campaigns might also cause request and success ratio spikes, so additional context in the form of typical payment requests from a given IP address is essential context, as shown in the figure.


Why is this serious?

Payment success ratio spikes coinciding with request spikes and high density of requests per IP address, in the absence of marketing campaigns or payment outages or other factors, could mean humans (or bots pretending to be humans) are making fraudulent purchases. Every successful transaction here could be a direct revenue loss or a chargeback in the making.

What evidence supports it?

We used a combination of bot signals and anomalies on /payment, /checkout, /cart:

Ingredient

Signal

Description

Bot

Bot Score >= 30

High probability of human traffic which is expected to be allowed

Anomaly

Volume Z-Score > 3.0, calculated from request volume baseline for a given hour based on the past 30 days and evaluated each hour. This factors daily seasonality as well. 

The attacker is making purchases at higher rates than normal shoppers

Anomaly

Success ratio Z > 3.0, calculated from success ratio baseline for a given hour based on the past 30 days and evaluated each hour. This factors daily seasonality as well. 

Sudden increases in success ratio may mean valid cards being approved for purchase

Anomaly

IP density > 5, calculated from payment requests per IP in any given hour divided by the average payment requests for that hour based on the past 30 days 

Humans with 5X more purchases than typical humans in the past 30 days is a red flag

Anomaly

JA4 diversity < 0.1, calculated from JA4s per payment requests in any given hour

JA4s with unusual hourly purchases are likely bots pretending to be humans

How do I mitigate this?

Identity-Based Rate Limiting: Use IP density to implement rate limits for requests with bot score >=30 on payment endpoints.

Monitor success ratio: Alert on any hour when the success ratio for “human” traffic, with bot score >=30 on payment endpoints, deviates by more than 3 standard deviations from its 30-day baseline.

Challenge: If a high bot score request (likely human) hits payment flows more than 3 times in 10 minutes, trigger a challenge to slow them down

What’s next: detections in the dashboard, AI-powered remediation 

We are currently working on integrating these “toxic combination” detections directly into the Security Insights dashboard to provide immediate visibility for such risks. Our roadmap includes building AI-assisted remediation paths — where the dashboard doesn’t just show you a toxic combination, but proposes the specific WAF rule or API Shield configuration required to neutralize it.

We would love to have you try our Security Insights featuring toxic combinations. You can join the waitlist here. 

Test for React2Shell with Application Security using New Functionality

Post Syndicated from Rapid7 original https://www.rapid7.com/blog/post/pt-react2shell-testing-new-application-security-functionality-appsec-dast

Following disclosure of the React2Shell vulnerability (CVE-2025-55182), a maximum-severity Remote Code Execution (RCE) in React Server Components (RSC) a.k.a. the Flight protocol, security teams are assessing exposure and validating fixes. React and ecosystem vendors have released patches; exploitation in the wild has been reported, so rapid validation matters.

What is React2Shell? 

React2Shell is an unauthenticated RCE flaw caused by insecure Flight payload deserialization in server-side React/RSC implementations (including popular frameworks like Next.js). It carries a CVSS 10.0 rating and affects React versions 19.0.0, 19.1.0, 19.1.1, and 19.2.0 as well as Next.js versions 15.0.0-15.1.6 and 16.0.0-16.0.6 prior to recent patches. You can read more about it in this detailed CVE overview blog post.  

In this detailed writeup, we will share how our customers can specifically test for React2Shell with Rapid7’s Application Security solution.

Testing for React2Shell with application security

With our dynamic application security testing (DAST) solution, customers can assess the risk of their applications. Rapid7 allows you to configure various attacks of your applications to identify response behaviors that make your applications more vulnerable to attacks. These attacks are run during scans that you can customize based on your needs. In this case, we’ve extended our RCE attack module to include a check for React2Shell.

What does this mean? Customers can now run an Attack Injection using the RCE, which includes an attack type for React2Shell. Our React2Shell vulnerability detection will simulate an attacker on your website. This is a benign attack which will not execute any code and only shows that RCE is possible. Rapid7 will validate the exploitability of the application and the associated risk. 

How to run a React2Shell attack in the Rapid7 DAST

You can scan for this new RCE attack using either the new Arbitrary Code Execution attack template we have created or by creating your own custom attack template and selecting the RCE module. We have added some steps for you to follow below:

Default attack template option:

Choose the Arbitrary Code Execution attack template in your scan configuration: 

⠀

Arbitrary-code-execution-attack-template.png
Default Arbitrary Code Execution attack template with RCE attack module

Custom attack template option:

custom-Attack-Template-RCE-module.png
Custom Attack Template with RCE module

Run a scan

Choosing the scan configuration you made earlier, scan against your selected app(s).

Scan results – React2Shell RCE finding

Now that you have run your scan, you can review the results to see if your app(s) have any findings. These will include remediation advice that you can follow.

⠀

3-Scan-results-React2Shell-RCE-finding.png

Manage attack templates

You can now manage your attack templates by navigating to the appropriate section and selecting the Arbitrary Code Execution attack template as below. 

⠀

manage-attack-templates-rapid7.png
Manage attack templates

What’s next?

Patch immediately, upgrade React to 19.0.1, 19.1.2, or 19.2.1 (or newer). For Next.js, the recommended action is to update to the following respective patched versions: 15.2.6, 15.3.6, 15.4.8, 15.5.7, 16.0.7, or later*. You should seek to remediate this vulnerability on an urgent basis, outside of normal patch cycles and consider temporary web application firewall (WAF) rules for Flight endpoints while patching. If you’re looking to validate any fixes you have implemented, feel free to run a validation scan with our application security tool to verify the fixes are correct.

* For Next.js, the recommendation from Nextjs is to update to the following respective patched versions: 15.0.5, 15.1.9, 15.2.6, 15.3.6, 15.4.8, 15.5.7, 16.0.7, or later. However, we have identified that versions 15.0.5 and 15.1.9 have a different critical vulnerability and would recommend against using them.

15 years of helping build a better Internet: a look back at Birthday Week 2025

Post Syndicated from Nikita Cano original https://blog.cloudflare.com/birthday-week-2025-wrap-up/

Cloudflare launched fifteen years ago with a mission to help build a better Internet. Over that time the Internet has changed and so has what it needs from teams like ours.  In this year’s Founder’s Letter, Matthew and Michelle discussed the role we have played in the evolution of the Internet, from helping encryption grow from 10% to 95% of Internet traffic to more recent challenges like how people consume content. 

We spend Birthday Week every year releasing the products and capabilities we believe the Internet needs at this moment and around the corner. Previous Birthday Weeks saw the launch of IPv6 gateway in 2011,  Universal SSL in 2014, Cloudflare Workers and unmetered DDoS protection in 2017, Cloudflare Radar in 2020, R2 Object Storage with zero egress fees in 2021,  post-quantum upgrades for Cloudflare Tunnel in 2022, Workers AI and Encrypted Client Hello in 2023. And those are just a sample of the launches.

This year’s themes focused on helping prepare the Internet for a new model of monetization that encourages great content to be published, fostering more opportunities to build community both inside and outside of Cloudflare, and evergreen missions like making more features available to everyone and constantly improving the speed and security of what we offer.

We shipped a lot of new things this year. In case you missed the dozens of blog posts, here is a breakdown of everything we announced during Birthday Week 2025. 

Monday, September 22

What

In a sentence …

Help build the future: announcing Cloudflare’s goal to hire 1,111 interns in 2026

To invest in the next generation of builders, we announced our most ambitious intern program yet with a goal to hire 1,111 interns in 2026.

Supporting the future of the open web: Cloudflare is sponsoring Ladybird and Omarchy

To support a diverse and open Internet, we are now sponsoring Ladybird (an independent browser) and Omarchy (an open-source Linux distribution and developer environment).

Come build with us: Cloudflare’s new hubs for startups

We are opening our office doors in four major cities (San Francisco, Austin, London, and Lisbon) as free hubs for startups to collaborate and connect with the builder community.

Free access to Cloudflare developer services for non-profit and civil society organizations

We extended our Cloudflare for Startups program to non-profits and public-interest organizations, offering free credits for our developer tools.

Introducing free access to Cloudflare developer features for students

We are removing cost as a barrier for the next generation by giving students with .edu emails 12 months of free access to our paid developer platform features.

Cap’n Web: a new RPC system for browsers and web servers

We open-sourced Cap’n Web, a new JavaScript-native RPC protocol that simplifies powerful, schema-free communication for web applications.

A lookback at Workers Launchpad and a warm welcome to Cohort #6

We announced Cohort #6 of the Workers Launchpad, our accelerator program for startups building on Cloudflare.

Tuesday, September 23

What

In a sentence …

Building unique, per-customer defenses against advanced bot threats in the AI era

New anomaly detection system that uses machine learning trained on each zone to build defenses against AI-driven bot attacks. 

Why Cloudflare, Netlify, and Webflow are collaborating to support Open Source tools

To support the open web, we joined forces with Webflow to sponsor Astro, and with Netlify to sponsor TanStack.

Launching the x402 Foundation with Coinbase, and support for x402 transactions

We are partnering with Coinbase to create the x402 Foundation, encouraging the adoption of the x402 protocol to allow clients and services to exchange value on the web using a common language

Helping protect journalists and local news from AI crawlers with Project Galileo

We are extending our free Bot Management and AI Crawl Control services to journalists and news organizations through Project Galileo.

Cloudflare Confidence Scorecards – making AI safer for the Internet

Automated evaluation of AI and SaaS tools, helping organizations to embrace AI without compromising security.

Wednesday, September 24

What

In a sentence …

Automatically Secure: how we upgraded 6,000,000 domains by default

Our Automatic SSL/TLS system has upgraded over 6 million domains to more secure encryption modes by default and will soon automatically enable post-quantum connections.

Giving users choice with Cloudflare’s new Content Signals Policy

The Content Signals Policy is a new standard for robots.txt that lets creators express clear preferences for how AI can use their content.

To build a better Internet in the age of AI, we need responsible AI bot principles

A proposed set of responsible AI bot principles to start a conversation around transparency and respect for content creators’ preferences.

Securing data in SaaS to SaaS applications

New security tools to give companies visibility and control over data flowing between SaaS applications.

Securing today for the quantum future: WARP client now supports post-quantum cryptography (PQC)

Cloudflare’s WARP client now supports post-quantum cryptography, providing quantum-resistant encryption for traffic. 

A simpler path to a safer Internet: an update to our CSAM scanning tool

We made our CSAM Scanning Tool easier to adopt by removing the need to create and provide unique credentials, helping more site owners protect their platforms.

Thursday, September 25

What

In a sentence …

Every Cloudflare feature, available to everyone

We are making every Cloudflare feature, starting with Single Sign On (SSO), available for anyone to purchase on any plan. 

Cloudflare’s developer platform keeps getting better, faster, and more powerful

Updates across Workers and beyond for a more powerful developer platform – such as support for larger and more concurrent Container images, support for external models from OpenAI and Anthropic in AI Search (previously AutoRAG), and more. 

Partnering to make full-stack fast: deploy PlanetScale databases directly from Workers

You can now connect Cloudflare Workers to PlanetScale databases directly, with connections automatically optimized by Hyperdrive.

Announcing the Cloudflare Data Platform

A complete solution for ingesting, storing, and querying analytical data tables using open standards like Apache Iceberg. 

R2 SQL: a deep dive into our new distributed query engine

A technical deep dive on R2 SQL, a serverless query engine for petabyte-scale datasets in R2.

Safe in the sandbox: security hardening for Cloudflare Workers

A deep-dive into how we’ve hardened the Workers runtime with new defense-in-depth security measures, including V8 sandboxes and hardware-assisted memory protection keys.

Choice: the path to AI sovereignty

To champion AI sovereignty, we’ve added locally-developed open-source models from India, Japan, and Southeast Asia to our Workers AI platform.

Announcing Cloudflare Email Service’s private beta

We announced the Cloudflare Email Service private beta, allowing developers to reliably send and receive transactional emails directly from Cloudflare Workers.

A year of improving Node.js compatibility in Cloudflare Workers

There are hundreds of new Node.js APIs now available that make it easier to run existing Node.js code on our platform. 

Friday, September 26

What

In a sentence …

Cloudflare just got faster and more secure, powered by Rust

We have re-engineered our core proxy with a new modular, Rust-based architecture, cutting median response time by 10ms for millions. 

Introducing Observatory and Smart Shield

New monitoring tools in the Cloudflare dashboard that provide actionable recommendations and one-click fixes for performance issues.

Monitoring AS-SETs and why they matter

Cloudflare Radar now includes Internet Routing Registry (IRR) data, allowing network operators to monitor AS-SETs to help prevent route leaks.

An AI Index for all our customers

We announced the private beta of AI Index, a new service that creates an AI-optimized search index for your domain that you control and can monetize.

Introducing new regional Internet traffic and Certificate Transparency insights on Cloudflare Radar

Sub-national traffic insights and Certificate Transparency dashboards for TLS monitoring.

Eliminating Cold Starts 2: shard and conquer

We have reduced Workers cold starts by 10x by implementing a new “worker sharding” system that routes requests to already-loaded Workers.

Network performance update: Birthday Week 2025

The TCP Connection Time (Trimean) graph shows that we are the fastest TCP connection time in 40% of measured ISPs – and the fastest across the top networks.

How Cloudflare uses performance data to make the world’s fastest global network even faster

We are using our network’s vast performance data to tune congestion control algorithms, improving speeds by an average of 10% for QUIC traffic.

Come build with us!

Helping build a better Internet has always been about more than just technology. Like the announcements about interns or working together in our offices, the community of people behind helping build a better Internet matters to its future. This week, we rolled out our most ambitious set of initiatives ever to support the builders, founders, and students who are creating the future.

For founders and startups, we are thrilled to welcome Cohort #6 to the Workers Launchpad, our accelerator program that gives early-stage companies the resources they need to scale. But we’re not stopping there. We’re opening our doors, literally, by launching new physical hubs for startups in our San Francisco, Austin, London, and Lisbon offices. These spaces will provide access to mentorship, resources, and a community of fellow builders.

We’re also investing in the next generation of talent. We announced free access to the Cloudflare developer platform for all students, giving them the tools to learn and experiment without limits. To provide a path from the classroom to the industry, we also announced our goal to hire 1,111 interns in 2026 — our biggest commitment yet to fostering future tech leaders.

And because a better Internet is for everyone, we’re extending our support to non-profits and public-interest organizations, offering them free access to our production-grade developer tools, so they can focus on their missions.

Whether you’re a founder with a big idea, a student just getting started, or a team working for a cause you believe in, we want to help you succeed.

Until next year

Thank you to our customers, our community, and the millions of developers who trust us to help them build, secure, and accelerate the Internet. Your curiosity and feedback drive our innovation.

It’s been an incredible 15 years. And as always, we’re just getting started!

Securing data in SaaS to SaaS applications

Post Syndicated from Michael Tremante original https://blog.cloudflare.com/saas-to-saas-security/

The recent Salesloft breach taught us one thing: connections between SaaS applications are hard to monitor and create blind spots for security teams with disastrous side effects. This will likely not be the last breach of this type.

To fix this, Cloudflare is working towards a set of solutions that consolidates all SaaS connections via a single proxy, for easier monitoring, detection and response. A SaaS to SaaS proxy for everyone.

As we build this, we need feedback from the community, both data owners and SaaS platform providers. If you are interested in gaining early access, please sign up here.

SaaS platform providers, who often offer marketplaces for additional applications, store data on behalf of their customers and ultimately become the trusted guardians. As integrations with marketplace applications take place, that guardianship is put to the test. A key breach in any one of these integrations can lead to widespread data exfiltration and tampering. As more apps are added the attack surface grows larger. Security teams who work for the data owner have no ability, today, to detect and react to any potential breach.

In this post we explain the underlying technology required to make this work and help keep your data on the Internet safe.

SaaS to SaaS integrations

No one disputes the value provided by SaaS applications and their integrations. Major SaaS companies implement flourishing integration ecosystems, often presented as marketplaces. For many, it has become part of their value pitch. Salesforce provides an AppExchange. Zendesk provides a marketplace. ServiceNow provides an Integration Hub. And so forth.

These provide significant value to any organisation and complex workflows. Data analysis or other tasks that are not supported natively by the SaaS vendor are easily carried out via a few clicks.

On the other hand, SaaS applications present security teams with a growing list of unknowns. Who can access this data? What security processes are put in place? And more importantly: how do we detect data leak, compromise, or other malicious intent?

Following the Salesloft breach, which compromised the data of hundreds of companies, including Cloudflare, the answers to these questions are top of mind.

The power of the proxy: seamless observability

There are two approaches Cloudflare is actively prototyping to address the growing security challenges SaaS applications pose, namely visibility into SaaS to SaaS connections, including anomaly detection and key management in the event of a breach. Let’s go over each of these, both relying on proxying SaaS to SaaS traffic.

1) Giving control back to the data owner

Cloudflare runs one of the world’s largest reverse proxy networks. As we terminate L7 traffic, we are able to perform security-related functions including blocking malicious requests, detecting anomalies, detecting automated traffic and so forth. This is one of the main use cases customers approach us for.

Cloudflare can proxy any hostname under the customer’s control.

It is this specific ability, often referred to as “vanity”, “branded” or “custom” hostnames, that allows us to act as a front door to the SaaS vendor on behalf of a customer. Provided a marketplace app integrates via a custom domain, the data owner can choose to use Cloudflare’s new SaaS integration protection capabilities.

For a customer (Acme Corp in this example) to access, say SaaS Application, the URL needs to become saas.acme.com as that is under Acme’s control (and not acme.saas.com).

This setup allows Cloudflare to be placed in front of SaaS Corp as the customer controls the DNS hostname. By proxying traffic, Cloudflare can be the only integration entity with programmatic access to SaaS Corp’s APIs and data and transparently “swap” authorisation tokens with valid ones and issue separate tokens, using key splitting, to any integrations. 


Note that in many cases, authorization and authentication flows fall outside any vanity/branded hostname. It is in fact very common for an OAuth flow to still hit the SaaS provider url oauth.saas.com. It is therefore required, in this setup, for marketplace applications to provide the ability to support vanity/branded URLs for their OAuth and similar flows, oauth.saas.acme.com in the diagram above.

Ultimately Cloudflare provides a full L7 reverse proxy for all traffic inbound/outbound to the given SaaS provider solving for the core requirements that would lessen the impact of a similar breach to the Salesloft example. Had Salesloft integrated via a Cloudflare-proxied domain, then data owners would be able to:

  • Gain visibility into who or what can access data, and where it’s accessed from, in the SaaS platform. Cloudflare already provides analytics and filtering tools to identify traffic sources, including hosting locations, IPs, user agents and other tools.

  • Instantly shut off access to the SaaS provider without the need to rotate credentials on the SaaS platform, as Cloudflare would be able to block access from the proxy.

  • Detects anomalies in data access by observing baselines and traffic patterns. For example a change in data exfiltration traffic flows would trigger an alert.

2) Improve SaaS platform security

The approach listed above assumes the end user is the company whose data is at risk. However, SaaS platforms themselves are now paying a lot of attention to marketplace applications and access patterns. From a deployment perspective, it’s actually easier to provide additional visibility to a SaaS provider as it is a standard reverse proxy deployment and we have tools designed for SaaS applications, such as Cloudflare for SaaS.


This deployment model allows Cloudflare to proxy all traffic to the SaaS vendor, including to all API endpoints therefore gaining visibility into any SaaS to SaaS connections. As part of this, we are building improvements to our API Shield solution to provide SaaS security teams with additional controls:

  • Token / session logging: Ability to keep track of OAuth tokens and provide session logs for audit purposes.

  • Session anomaly detection: Ability to warn when a given OAuth (or other session) shows anomalous behavior.

  • Token / session replacement: Ability to substitute SaaS-generated tokens with Cloudflare-generated tokens to allow for fast rotation and access lock down.

The SaaS vendor may of course expose some of the affordances to their end customer as part of their dashboard.

How key splitting enables secure token management

Both deployment approaches described above rely on our ability to control access without storing complete credentials. While we already store SSL/TLS private keys for millions of web applications, storing complete SaaS bearer tokens would create an additional security burden. To solve this, and enable the token swapping and instant revocation capabilities mentioned above, we use key splitting.

Key splitting cryptographically divides bearer tokens into two mathematically interdependent fragments called Part A and Part B. Part A goes to the fourth-party integration (like Drift or Zapier) while Part B stays in Cloudflare’s edge storage. Part A is just random noise that won’t authenticate to Salesforce or any SaaS platform expecting complete tokens, so neither fragment is usable alone.

This creates an un-bypassable control point. Integrations cannot make API calls without going through Cloudflare’s proxy because they only possess Part A. When an integration needs to access data, it must present Part A to our edge where we retrieve Part B, reconstruct the token in memory for microseconds, forward the authenticated request, and then immediately clear the token. This makes sure that the complete bearer token never exists in any database or log.

This forced cooperation means every API call flows through Cloudflare where we can monitor for anomalies, delete Part B to instantly revoke access (transforming incident response from hours to seconds), and maintain complete audit trails. Even more importantly, this approach minimizes our burden of storing sensitive credentials since a breach of our systems wouldn’t yield usable tokens.

If attackers compromise the integration and steal Part A, or somehow breach Cloudflare’s storage and obtain Part B, neither fragment can authenticate on its own. This fundamentally changes the security model from protecting complete tokens to managing split fragments that are individually worthless. It also gives security teams unprecedented visibility and control over how their data is accessed across third-party integrations.


Regaining control of your data

We are excited to develop solutions mentioned above to give better control and visibility around data stored in SaaS environments, or more generally, outside a customer’s network.

If you are a company worried about this risk, and would like to be notified to take part in our early access, please sign up here.

If you are a SaaS vendor who would like to provide feedback and take part in developing better API security tooling for third party integrations towards your platform, sign up here.

We are looking forward to helping you get better control of your data in SaaS to SaaS environments.

Many voices, one community: Three themes from RSA Conference 2025

Post Syndicated from Anne Grahn original https://aws.amazon.com/blogs/security/many-voices-one-community-three-themes-from-rsa-conference-2025/

RSA Conference (RSAC) 2025 drew 730 speakers, 650 exhibitors, and 44,000 attendees from across the globe to the Moscone Center in San Francisco, California from April 28 through May 1.

The keynote lineup was eclectic, with 37 presentations featuring speakers ranging from NBA Hall of Famer Earvin “Magic” Johnson to public and private-sector luminaries such as former US National Cyber Director Chris Inglis, U.S. Secretary of Homeland Security Kristi Noem, and cryptography experts Tal Rabin, Whitfield Diffie, and Adi Shamir.

Topics aligned with this year’s conference theme, “Many Voices. One Community,” and focused on the security industry’s shared drive to foresee risks, counter threats, and embrace new challenges.

Three themes caught our attention: agentic AI, cryptography, and public-private collaboration.

Agentic AI

The potential of agentic AI to augment human decision-making was a common thread among conversations at the conference. Numerous sessions touched on the topic, and the desire of attendees to understand the technology and learn how to balance its risks and opportunities was clear.

Separating hype from reality

An AI agent is a software program that can interact with its environment (as detailed in Figure 1), collect data, and use the data to perform self-determined tasks to meet predetermined goals.

Figure 1: Generative AI agents

Figure 1: Generative AI agents

Agentic systems offer a fundamentally different approach compared to traditional software, particularly in their ability to handle complex, dynamic, and domain-specific challenges. While traditional systems rely on rule-based automation and structured data, agentic systems use large language models (LLMs)—a subset of generative AI—to operate autonomously. Agents can learn from interactions with users, and make nuanced, context-aware decisions while keeping human analysts in the loop.

Numerous RSAC speakers alluded to AI agents as the next frontier in enterprise transformation. Gartner® predicts that: “By 2028, 33% of enterprise software applications will include agentic AI, up from less than 1% in 2024,” and “at least 15% of day-to-day work decisions will be made autonomously through agentic AI, up from zero percent in 2024.”

However, as organizations build AI agents, understanding the concerns that come with them is critical.

“Agentic AI presents tremendous opportunities to deliver business value and innovative security outcomes. Production deployments require a balance between its capabilities, and robust security and trust mechanisms.”
—Hart Rossman, Global Services Security Vice President at AWS

In the RSAC keynote session The Five Most Dangerous New Attack Techniques…and What to Do for Each, Rob Lee, Chief of Research and Head of Faculty at SANS Institute noted that while security teams are embracing AI to amplify productivity, threat actors are doing the same. He pointed to MIT research that shows adversarial agent systems executing attack sequences are 47 times faster than human operators, with a 93 percent success rate in privilege escalation paths.

Safeguarding GenAI & Agentic Apps, Top 10 Risks in 2025, a half-day Open Worldwide Application Security Project (OWASP) event, focused on helping attendees distinguish real threats from hype. OWASP Gen AI Security Project team members and industry experts reviewed the 2025 OWASP Top 10 List for LLM and GenAI (shown in Figure 2), and introduced Agentic AI—Threats and Mitigations—the first in a series of guides from the OWASP Agentic Security Initiative (ASI) to provide a threat-model-based reference of emerging agentic threats and mitigations. Content feedback can be submitted to ASI in advance of the guide’s next release.

Figure 2: 2025 OWASP Top 10 for LLM Applications

Figure 2: 2025 OWASP Top 10 for LLM Applications

Agentic AI wins Cybersecurity Startup Accelerator

The second annual AWS and CrowdStrike Cybersecurity Startup Accelerator, in collaboration with the NVIDIA Inception program, took place during RSAC. A panel of judges—including George Kurtz, Founder and CEO of CrowdStrike, CJ Moses, Chief Information Security Officer at Amazon, and David Reber Jr., Chief Security Officer at NVIDIA—evaluated startups on innovation, market relevance, and go-to-market potential. Terra Security, a provider of agentic AI-powered, continuous web application penetration testing, was selected from a group of 10 finalists who pitched live. Two runners-up, Kenzo Security and Rig Security, were also recognized for their standout approaches to agentic AI-driven security.

Addressing AI risks

The need to consider your security posture when assessing overall AI readiness was emphasized throughout the conference. A defense-in-depth architecture can help mitigate risks with multiple layers of protection across both traditional and AI software components. Innovative solutions such as AI red teaming, AI behavioral sandboxing, and advanced tracing and evaluation of generative AI agents can enhance your security strategy with a proactive approach to securing AI.

Visit the following resources to help design, build, and operate AI systems: DevsecOps Revolution: Unleashing Generative AI for Automated Excellence, AWS generative AI security, responsible AI, and the Amazon AGI Labs Blog.

Cryptography

Encryption was another key topic. The FIDO Alliance hosted a half-day seminar that focused on developments in the global movement to passwordless technology such as passkeys—cryptographic keys designed to replace passwords by combining the power of public key cryptography with biometric authentication.

In Dude, Where’s My Password? The Challenges of Getting to Passwordless, Andy Ozment, Chief Technology Risk Officer and Executive Vice President at Capital One noted that 88 percent of data compromised in basic web application attacks reported in 2024 involved stolen credentials. Ozment pointed out that “going passwordless” through a combination of X.509 device certificates and FIDO2 passkeys presented Capital One with an opportunity to nearly eliminate entire classes of threats (as detailed in Figure 3), while increasing the quality of user experience.

Figure 3: Using passkeys to reduce risk while advancing user experience

Figure 3: Using passkeys to reduce risk while advancing user experience

Along the way, Ozment said, Capital One’s journey to passwordless was enabled by its transition from on-premises technology to going “all-in” on the public cloud. Watch the recording of his session or view the slides to learn more.

Post-quantum encryption

The state of post-quantum encryption was detailed in the popular Cryptographer’s Panel, moderated by Tal Rabin, Senior Principal Applied Scientist at AWS.

Panelist Vinod Vaikuntanathan, Professor at MIT underscored the impact of the quantum-resistant algorithm standardization process (Figure 4) started by the National Institute of Standards and Technology (NIST) in 2016. “We now have two public key encryption algorithms, and three new digital signature algorithms that are standardized,” he pointed out.

Figure 4: Post-quantum encryption algorithms

Figure 4: Post-quantum encryption algorithms

The panelists agreed that even though quantum computers aren’t here yet, the time to deploy these algorithms is now. NIST recommends phasing out existing encryption methods by 2030 in its Transition to Post-Quantum Cryptography Standards report. However, Vaikuntanathan and Adi Shamir, the “s” in the Rivest–Shamir–Adleman (RSA) public-key cryptosystem, advise organizations to take a hybrid approach that combines classic encryption algorithms such as RSA or Elliptic-curve Diffie–Hellman (ECDH) with post-quantum algorithms such as Module-Lattice-based Key Encapsulation Mechanism (ML-KEM). This approach, which is used by AWS and recommended by The European Commission, offers protection against both current and future threats.

RSAC Award for Excellence in the Field of Mathematics

Dr. Shai Halevi, Senior Principal Applied Scientist at AWS, was presented with the Award for Excellence in the Field of Mathematics for remarkable contributions to many areas of cryptography, including fundamental theory, advanced cryptographic primitives, secure multi-party computations, homomorphic encryption, and cryptographic code obfuscation.

Figure 5: Dr. Shai Halevi receives RSAC award for Excellence in the Field of Mathematics

Figure 5: Dr. Shai Halevi receives RSAC Award for Excellence in the Field of Mathematics

End-to-end encryption

Concerns about the recent US government group chat leak were also raised during the discussion. Public-key cryptography pioneer Whitfield Diffie noted that the use of an encrypted consumer messaging app to communicate classified information broke archiving laws. Because some commercial tools use 256-bit Advanced Encryption Standard (AES) encryption, which is “good enough” to protect communications, he predicted an increase in the use of consumer applications to protect sensitive information in unapproved ways.

The Cybersecurity and Infrastructure Security Agency (CISA) and the Federal Bureau of Investigation (FBI) recently advised individuals and organizations to start using encrypted messaging apps. However, as the role of these applications in business communication expands, it’s important not to lose sight of recordkeeping and compliance obligations. Organizations should consider solutions that offer administrative controls and data retention capabilities along with encryption.

AWS Wickr, for example, is a messaging and collaboration service that protects messaging, calling, file sharing, screen sharing, and location sharing with 256-bit end-to-end encryption. The data retention and administrative controls that it provides help customers meet regulatory requirements and manage user and device data remotely.

Wickr is Department of Defense Cloud Computing Security Requirements Guide Impact Level 5 (DoD CC SRG IL5) and Federal Risk and Authorization Management Program (FedRAMP) High authorized in the AWS GovCloud (US-West) Region. It also meets compliance programs and standards such as Health Insurance Portability and Accountability Act (HIPAA) eligibility, International Organization for Standardization (ISO) 27001, and System and Organization Controls (SOC) 1, 2, and 3.

Visit the AWS News Blog and the AWS Security Blog to learn about AWS passkey multi-factor authentication, how AWS is migrating to post quantum cryptography (PQC), and how we can help you implement a layered encryption strategy for your organization.

Public-private collaboration

Numerous sessions underlined the importance of collaboration to strengthening security. In his keynote, Johnson called attention to a lesson he learned on the basketball court—his peers made him stronger. “Larry Bird made me a better basketball player,” he said, relating his experience to the need for security teams to assist and learn from each other.

In Making America Safe Again Through Cyber Defense, Kristi Noem, U.S. Secretary of Homeland Security equated cybersecurity with national security, and insisted that building on public-private partnerships is “incredibly important.” “Our goal,” she said, “is to use our maximum effect of cooperation to make sure that we’re going after bad actors.”

After assuring attendees that CISA will continue to be America’s cyber defense agency, she urged congress to reauthorize the Cybersecurity Information Sharing Act of 2015. The law, which is set to expire in September, incentivizes businesses to share threat indicators with the Department of Homeland Security (DHS) and helps make sure that both the federal government and companies can take collaborative steps to address threats.

Panelists at an offsite threat intelligence discussion reiterated the ability of private industry to supplement government security capabilities. Adam Meyers, Senior VP, Counter Adversary Operations at CrowdStrike pointed out that technology companies often have more data and signals than governments. The CrowdStrike Falcon solution, he said, processes over 6 trillion events per day, and 55 million events per second at peak. This volume facilitates the detection of threat patterns that might otherwise go unnoticed.

Similarly, Moses noted that the size and scale of AWS infrastructure gives us unique visibility into internet traffic. Our global network of sensors and associated disruption tools observe over 700 million threat interactions every day, out of which 450 million can be classified as malicious. Internal threat intelligence tools such as MadPot, our sophisticated global honeypot system, produce high-fidelity findings (pieces of relevant information) that can be used to drive proactive intelligence sharing, and reduce investigative workloads.

“We’ll work together in order to be able to put a bow on a case and hand it to the FBI and DOJ, such that they don’t have to expend a great amount of resources in order to go forward and try to figure things out that we already know.” —CJ Moses, Chief Information Security Officer and VP of Security Engineering at Amazon

An example of this is the disruption of the cybercriminal group known as Anonymous Sudan. The group was responsible for tens of thousands of distributed denial-of-service (DDoS) attacks against critical infrastructure, corporate networks, and government agencies. With the help of tools like MadPot, AWS experts were able to identify the hosting provider infrastructure that the group used to launch the DDos attacks, and work with providers to disrupt them. Akamai SIRT, Cloudflare, CrowdStrike, DigitalOcean, Flashpoint, Google, Microsoft, PayPal, SpyCloud, and other private sector entities also assisted law enforcement, leading to the indictment of two Anonymous Sudan leaders.

The value of combined perspectives

RSA Conference 2025 might be over, but the learning continues. Additional highlights that include the west stage keynotes, the Innovation Sandbox, and dozens of insightful sessions on topics such as the changing role of the CISO, women in cyber, and of course—cloud security—are available on demand.

If there’s one key takeaway, it’s a collective sense of transition. As we explore the benefits and risks of emerging AI technologies, encryption strategies, and information sharing, it’s important to remember that we cannot effectively combat threats in isolation. Security is a collective endeavor; only by working together can we adapt to evolving challenges and build cyber resilience.

For more information about cloud security, register to join AWS, Google Cloud, and Microsoft online at the SANS 2025 Cloud Security Exchange on August 21.

Anne Grahn

Anne Grahn

Anne is a Senior Worldwide Security GTM Specialist at AWS, based in Chicago. She has 15 years of experience in the security industry and focuses on effectively communicating cybersecurity risk. She maintains a Certified Information Systems Security Professional (CISSP) certification.