Post Syndicated from Bastien Dhiver original https://blog.cloudflare.com/a-debugging-story-corrupt-packets-in-af_xdp-kernel-bug-or-user-error/

panic: Invalid TCP packet: Truncated

A few months ago we started getting a handful of crash reports for flowtrackd, our Advanced TCP Protection system that runs on our global network. The provided stack traces indicated that the panics occurred while parsing a TCP packet that was truncated.
What was most interesting wasn’t that we failed to parse the packet. It isn’t rare that we receive malformed packets from the Internet that are (deliberately or not) truncated. Those packets will be caught the first time we parse them and won’t make it to the latter processing stages. However, in our case, the panic occurred the second time we parsed the packet, indicating it had been truncated after we received it and successfully parsed it the first time. Both parse calls were made from a single green thread and referenced the same packet buffer in memory, and we made no attempts to mutate the packet in between.
It can be easy to dread discovering a bug like this. Is there a race condition? Is there memory corruption? Is this a kernel bug? A compiler bug? Our plan to get to the root cause of this potentially complex issue was to identify symptom(s) related to the bug, create theories on what may be occurring and create a way to test our theories or gather more information.
Before we get into the details we first need some background information about AF_XDP and our setup.
AF_XDP overview
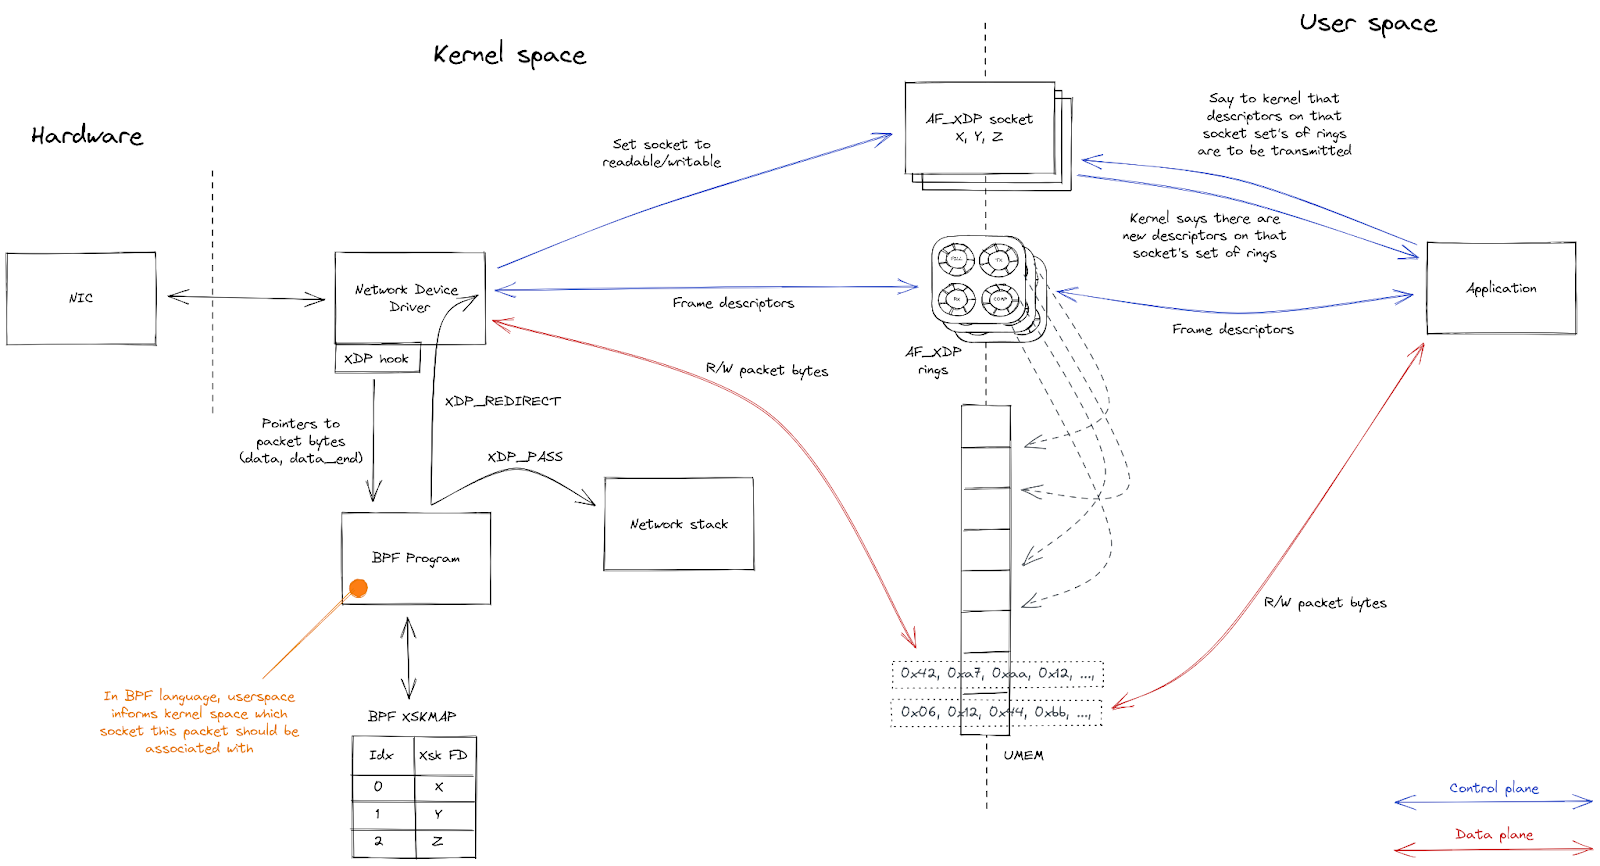
AF_XDP is the high performance asynchronous user-space networking API in the Linux kernel. For network devices that support it, AF_XDP provides a way to perform extremely fast, zero-copy packet forwarding using a memory buffer that’s shared between the kernel and a user-space application.
A number of components need to be set up by the user-space application to start interacting with the packets entering a network device using AF_XDP.
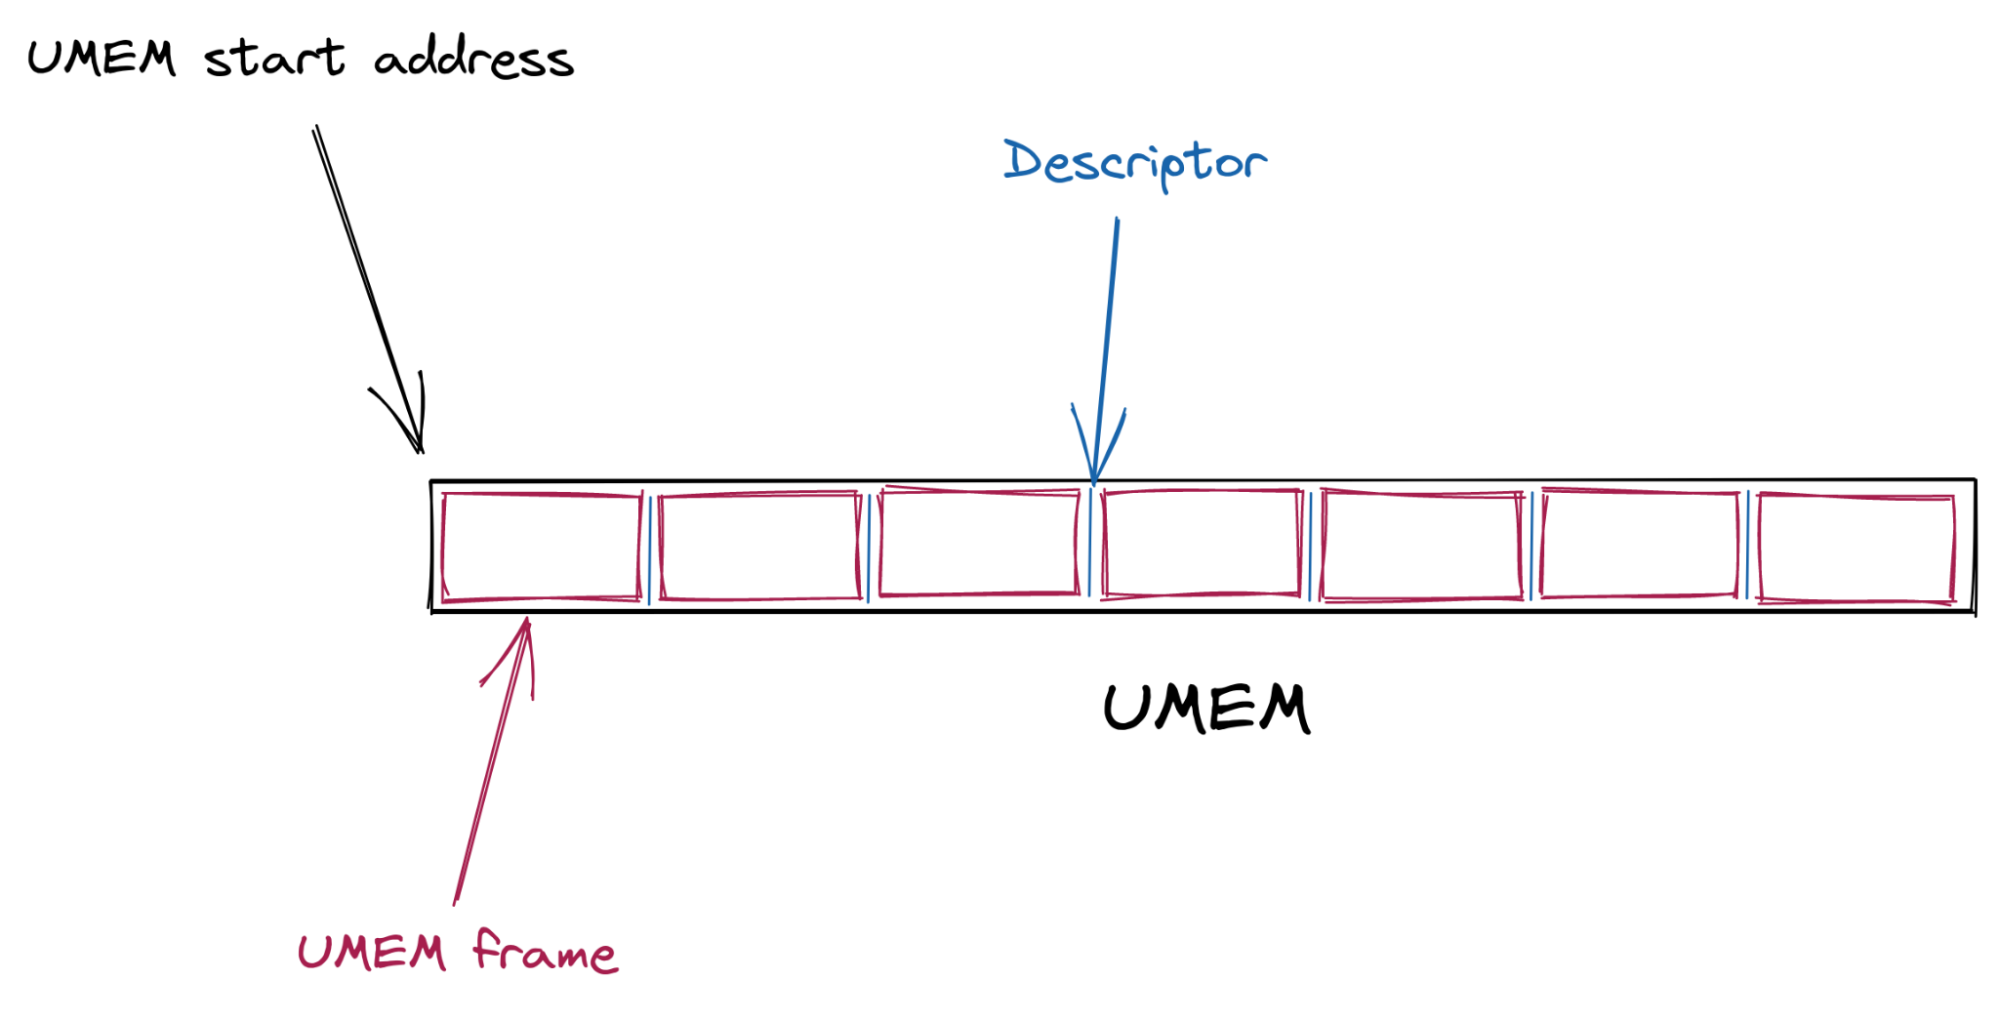
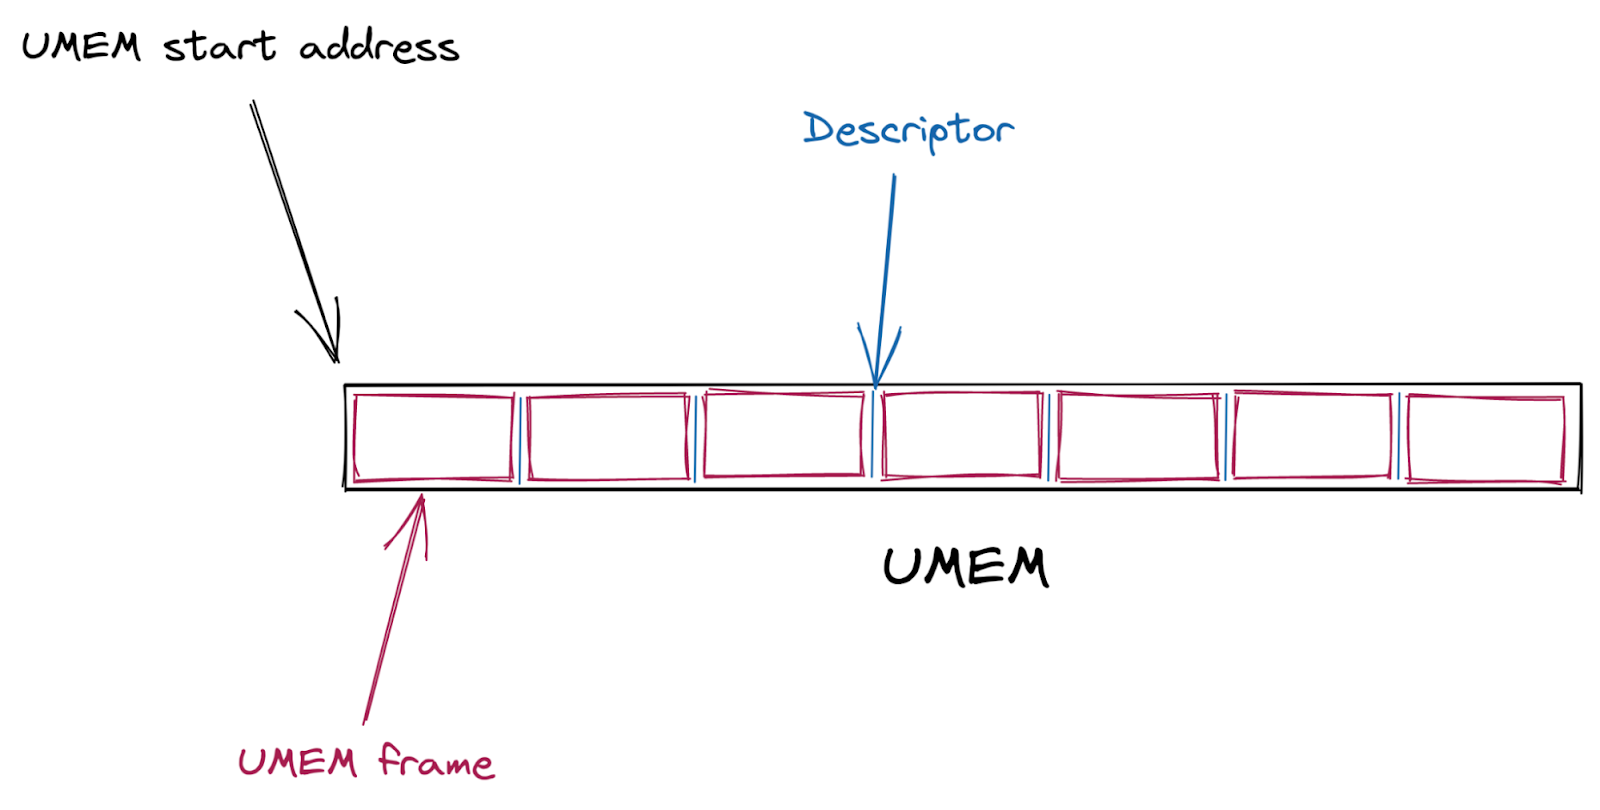
First, a shared packet buffer (UMEM) is created. This UMEM is divided into equal-sized “frames” that are referenced by a “descriptor address,” which is just the offset from the start of the UMEM.
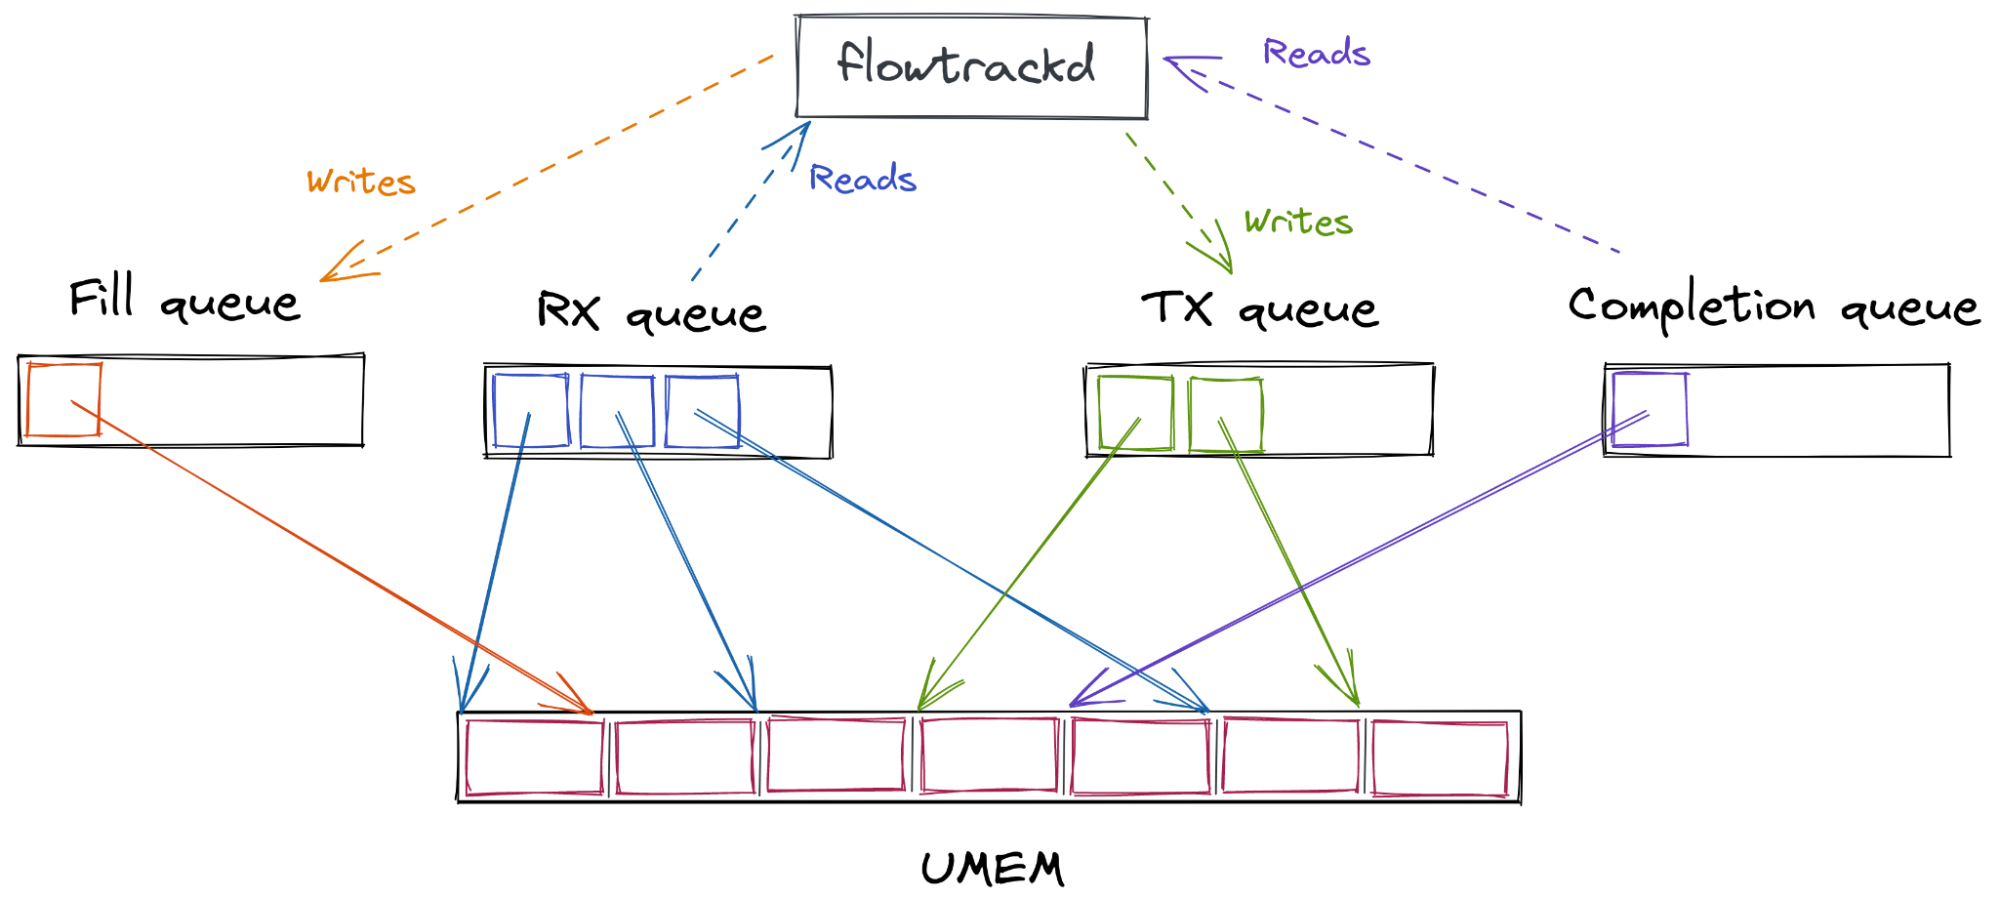
Next, multiple AF_XDP sockets (XSKs) are created – one for each hardware queue on the network device – and bound to the UMEM. Each of these sockets provides four ring buffers (or “queues”) which are used to send descriptors back and forth between the kernel and user-space.
User-space sends packets by taking an unused descriptor and copying the packet into that descriptor (or rather, into the UMEM frame that the descriptor points to). It gives the descriptor to the kernel by enqueueing it on the TX queue. Some time later, the kernel dequeues the descriptor from the TX queue and transmits the packet that it points to out of the network device. Finally, the kernel gives the descriptor back to user-space by enqueueing it on the COMPLETION queue, so that user-space can reuse it later to send another packet.
To receive packets, user-space provides the kernel with unused descriptors by enqueueing them on the FILL queue. The kernel copies packets it receives into these unused descriptors, and then gives them to user-space by enqueueing them on the RX queue. Once user-space processes the packets it dequeues from the RX queue, it either transmits them back out of the network device by enqueueing them on the TX queue, or it gives them back to the kernel for later reuse by enqueueing them on the FILL queue.
| Queue | User space | Kernel space | Content description |
|---|---|---|---|
| COMPLETION | Consumes | Produces | Descriptors containing a packet that was successfully transmitted by the kernel |
| FILL | Produces | Consumes | Descriptors that are empty and ready to be used by the kernel to receive packets |
| RX | Consumes | Produces | Descriptors containing a packet that was recently received by the kernel |
| TX | Produces | Consumes | Descriptors containing a packet that is ready to be transmitted by the kernel |
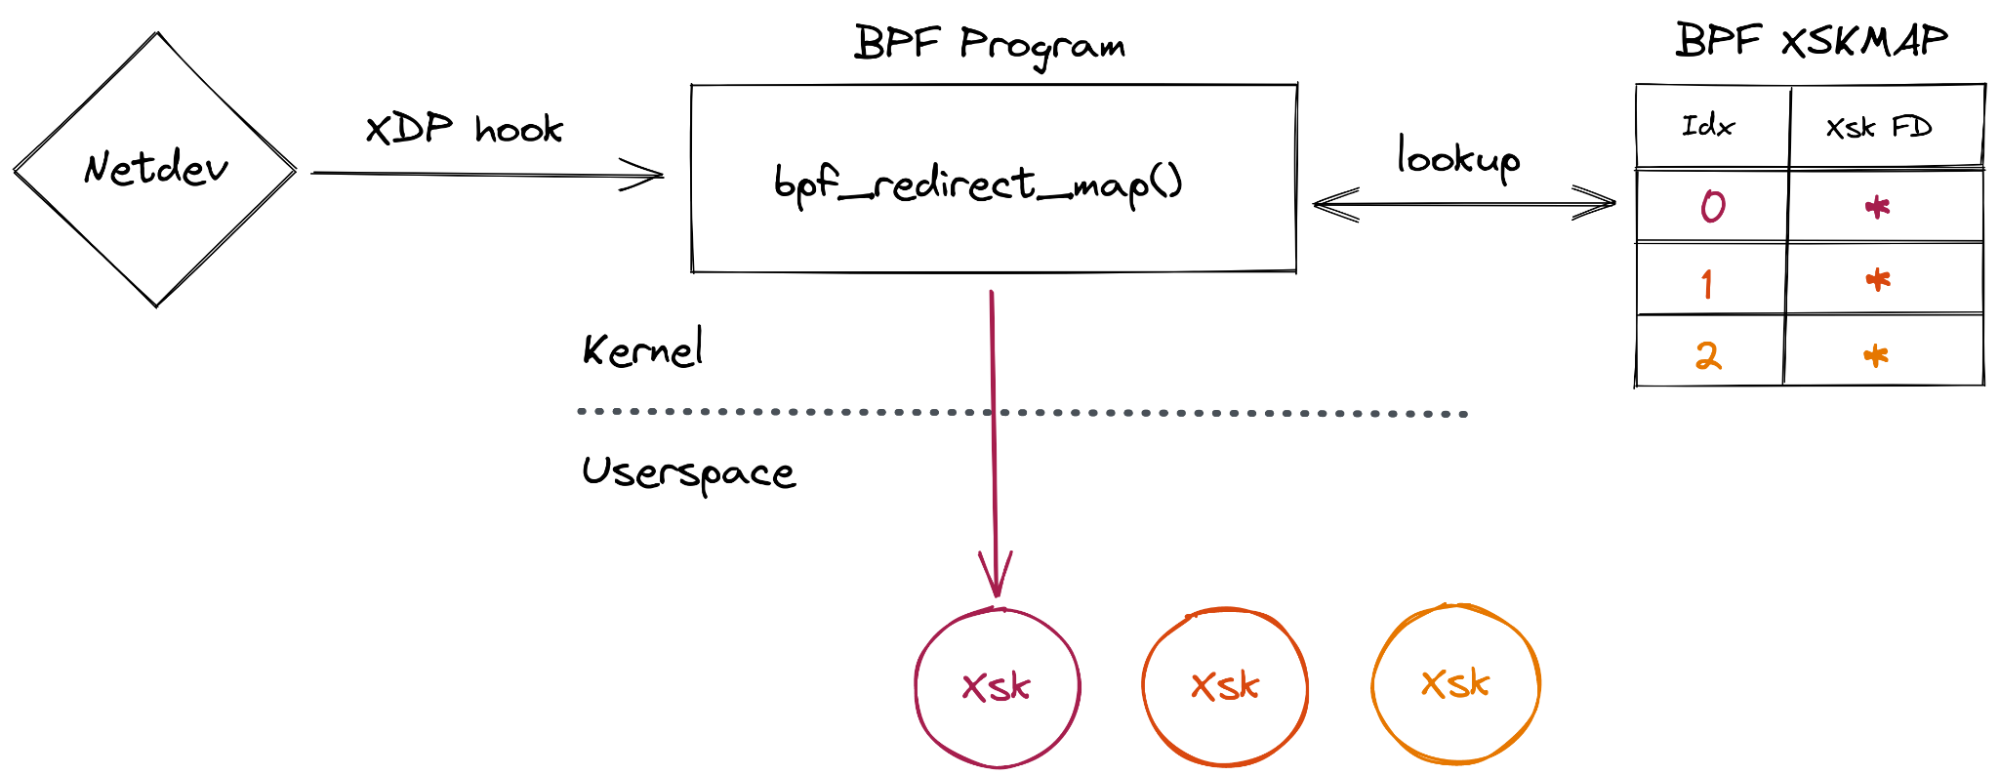
Finally, a BPF program is attached to the network device. Its job is to direct incoming packets to whichever XSK is associated with the specific hardware queue that the packet was received on.
Here is an overview of the interactions between the kernel and user-space:
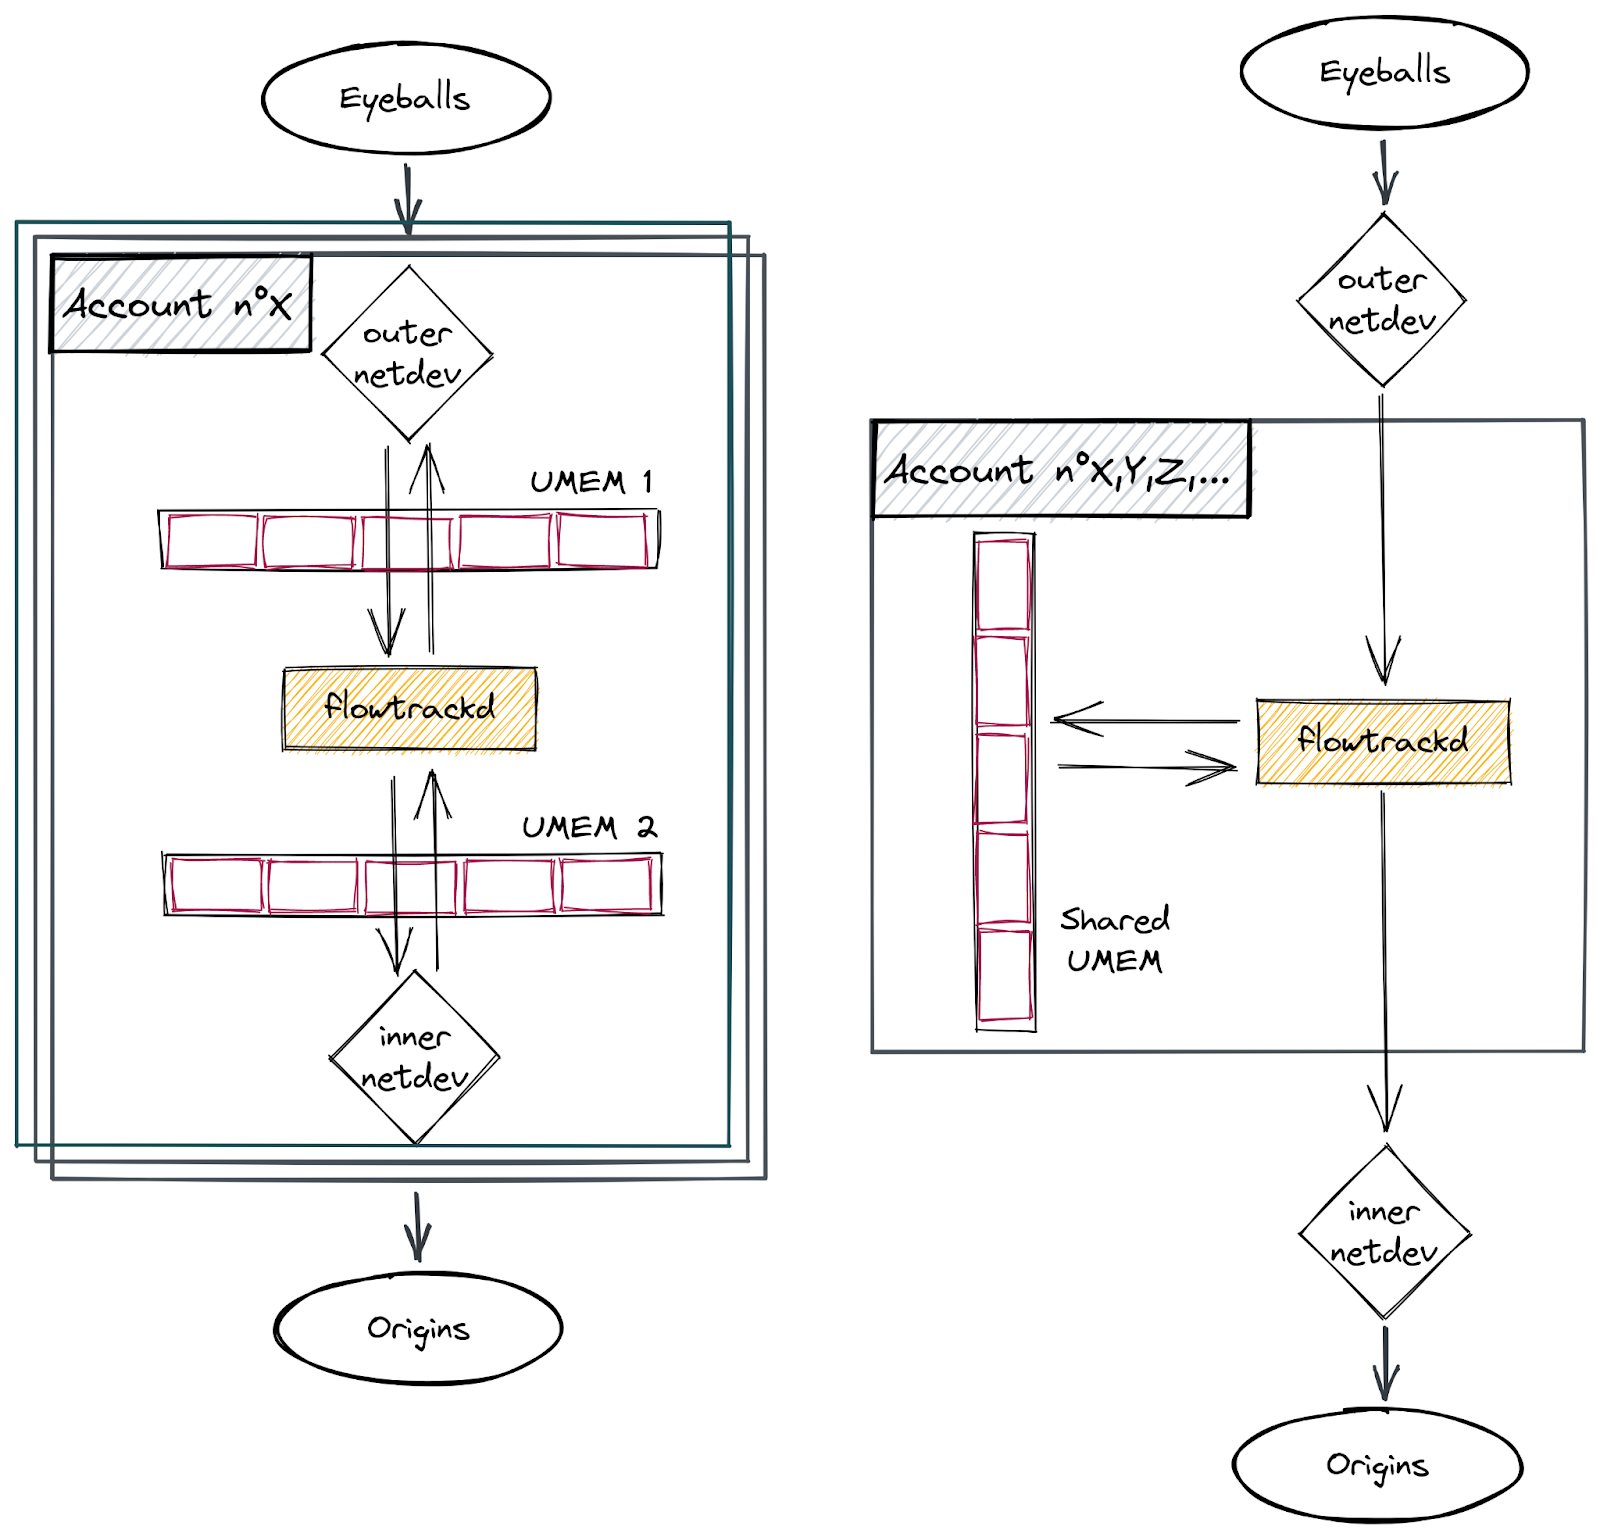
Our setup
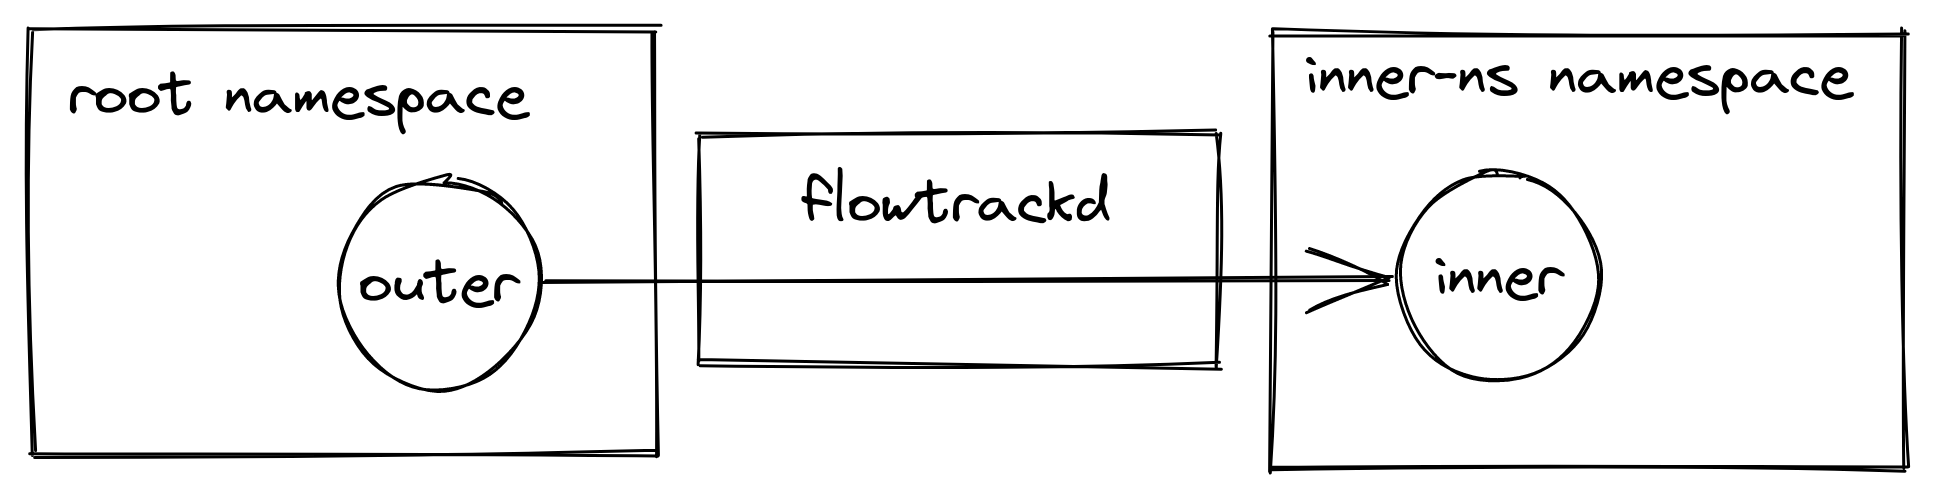
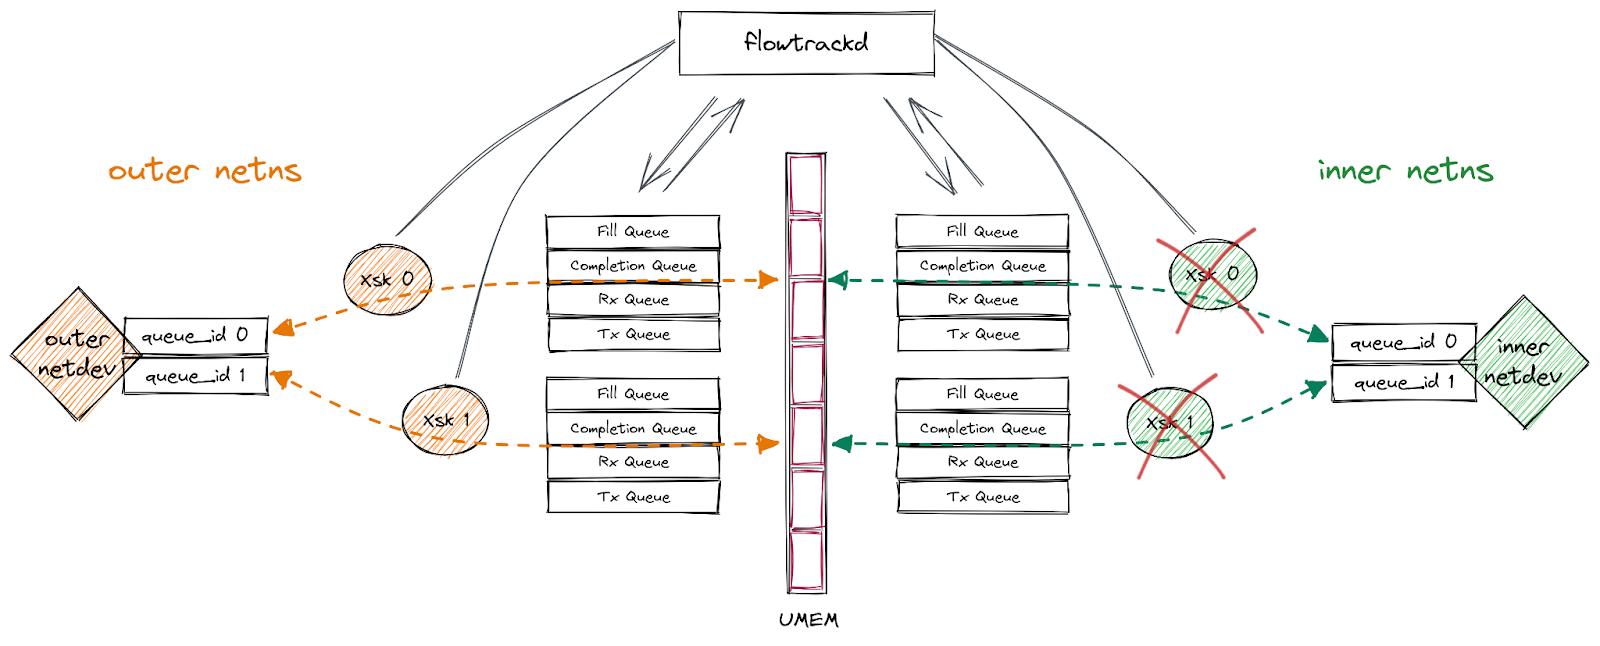
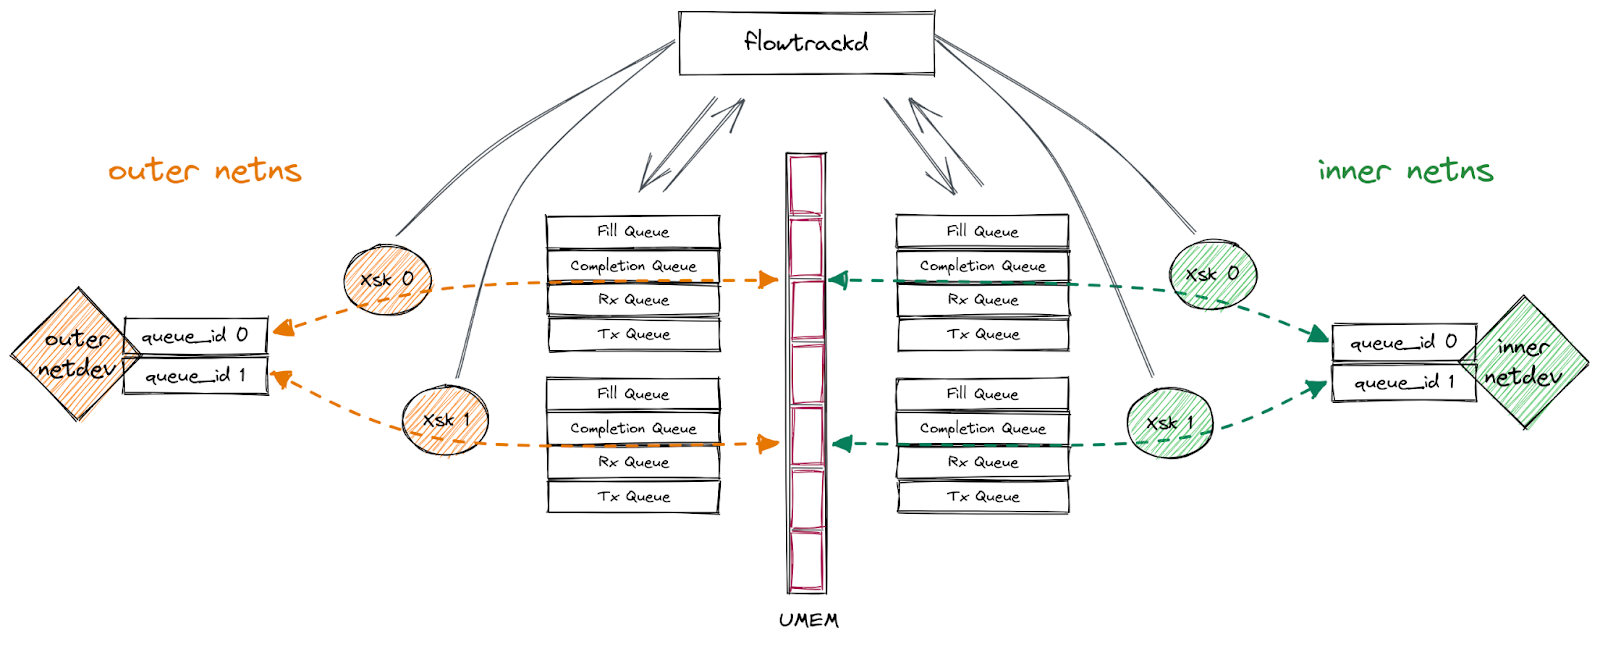
Our application uses AF_XDP on a pair of multi-queue veth interfaces (“outer” and “inner”) that are each in different network namespaces. We follow the process outlined above to bind an XSK to each of the interfaces’ queues, forward packets from one interface to the other, send packets back out of the interface they were received on, or drop them. This functionality enables us to implement bidirectional traffic inspection to perform DDoS mitigation logic.
This setup is depicted in the following diagram:
Information gathering
All we knew to start with was that our program was occasionally seeing corruption that seemed to be impossible. We didn’t know what these corrupt packets actually looked like. It was possible that their contents would reveal more details about the bug and how to reproduce it, so our first step was to log the packet bytes and discard the packet instead of panicking. We could then take the logs with packet bytes in them and create a PCAP file to analyze with Wireshark. This showed us that the packets looked mostly normal, except for Wireshark’s TCP analyzer complaining that their “IPv4 total length exceeds packet length”. In other words, the “total length” IPv4 header field said the packet should be (for example) 60 bytes long, but the packet itself was only 56 bytes long.
Lengths mismatch
Could it be possible that the number of bytes we read from the RX ring was incorrect? Let’s check.
An XDP descriptor has the following C struct:
struct xdp_desc {
	__u64 addr;
	__u32 len;
	__u32 options;
};
Here the len member tells us the total size of the packet pointed to by addr in the UMEM frame.
Our first interaction with the packet content happens in the BPF code attached to the network interfaces.
There our entrypoint function gets a pointer to a xdp_md C struct with the following definition:
struct xdp_md {
	__u32 data;
	__u32 data_end;
	__u32 data_meta;
	/* Below access go through struct xdp_rxq_info */
	__u32 ingress_ifindex; /* rxq->dev->ifindex */
	__u32 rx_queue_index;  /* rxq->queue_index  */

	__u32 egress_ifindex;  /* txq->dev->ifindex */
};
This context structure contains two pointers (as __u32) referring to start and the end of the packet. Getting the packet length can be done by subtracting data from data_end.
If we compare that value with the one we get from the descriptors, we would surely find they are the same right?
We can use the BPF helper function bpf_xdp_adjust_meta() (since the veth driver supports it) to declare a metadata space that will hold the packet buffer length that we computed. We use it the same way this kernel sample code does.
After deploying the new code in production, we saw the following lines in our logs:
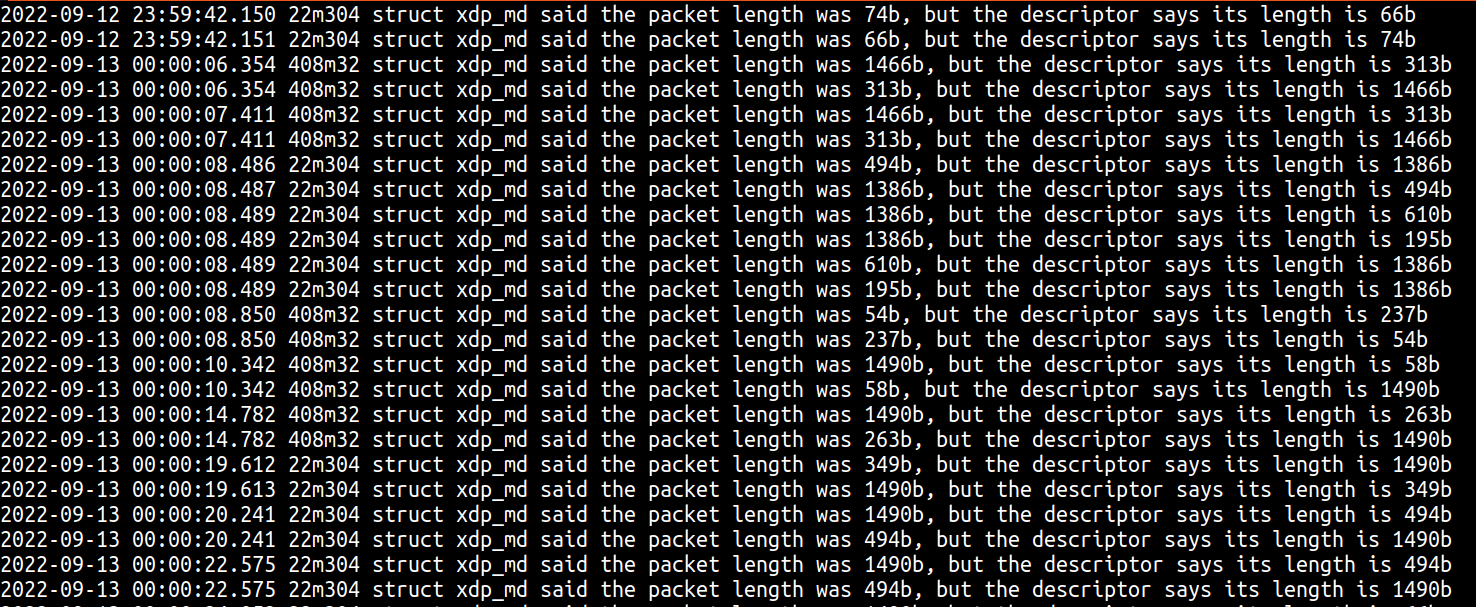
Here you can see three interesting things:
- As we theorized, the length of the packet when first seen in XDP doesn’t match the length present in the descriptor.
- We had already observed from our truncated packet panics that sometimes the descriptor length is shorter than the actual packet length, however the prints show that sometimes the descriptor length might be larger than the real packet bytes.
- These often appeared to happen in “pairs” where the XDP length and descriptor length would swap between packets.
Two packets and one buffer?
Seeing the XDP and descriptor lengths swap in “pairs” was perhaps the first lightbulb moment. Are these two different packets being written to the same buffer? This also revealed a key piece of information that we failed to add to our debug prints, the descriptor address! We took this opportunity to print additional information like the packet bytes, and to print at multiple locations in the path to see if anything changed over time.
The real key piece of information that these debug prints revealed was that not only were each swapped “pair” sharing a descriptor address, but nearly every corrupt packet on a single server was always using the same descriptor address. Here you can see 49750 corrupt packets that all used descriptor address 69837056:
$ cat flowtrackd.service-2022-11-03.log | grep 87m237 | grep -o -E 'desc_addr: [[:digit:]]+' | sort | uniq -c
  49750 desc_addr: 69837056
This was the second lightbulb moment. Not only are we trying to copy two packets to the same buffer, but it is always the same buffer. Perhaps the problem is that this descriptor has been inserted into the AF_XDP rings twice? We tested this theory by updating our consumer code to test if a batch of descriptors read from the RX ring ever contained the same descriptor twice. This wouldn’t guarantee that the descriptor isn’t in the ring twice since there is no guarantee that the two descriptors will be in the same read batch, but we were lucky enough that it did catch the same descriptor twice in a single read proving this was our issue. In hindsight the linux kernel AF_XDP documentation points out this very issue:
Q: My packets are sometimes corrupted. What is wrong?
A: Care has to be taken not to feed the same buffer in the UMEM into more than one ring at the same time. If you for example feed the same buffer into the FILL ring and the TX ring at the same time, the NIC might receive data into the buffer at the same time it is sending it. This will cause some packets to become corrupted. Same thing goes for feeding the same buffer into the FILL rings belonging to different queue ids or netdevs bound with the XDP_SHARED_UMEM flag.
We now understand why we have corrupt packets, but we still don’t understand how a descriptor ever ends up in the AF_XDP rings twice. I would love to blame this on a kernel bug, but as the documentation points out this is more likely that we’ve placed the descriptor in the ring twice in our application. Additionally, since this is listed as a FAQ for AF_XDP we will need sufficient evidence proving that this is caused by a kernel bug and not user error before reporting to the kernel mailing list(s).
Tracking descriptor transitions
Auditing our application code did not show any obvious location where we might be inserting the same descriptor address into either the FILL or TX ring twice. We do however know that descriptors transition through a set of known states, and we could track those transitions with a state machine. The below diagram shows all the possible valid transitions:
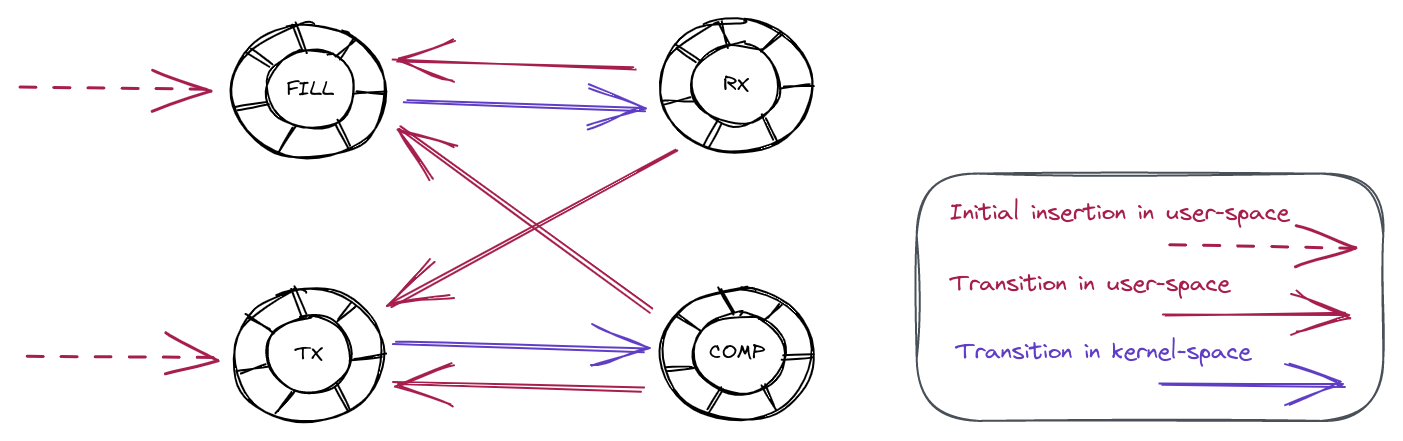
For example, a descriptor going from the RX ring to either the FILL or the TX ring is a perfectly valid transition. On the other hand, a descriptor going from the FILL ring to the COMP ring is an invalid transition.
To test the validity of the descriptor transitions, we added code to track their membership across the rings. This produced some of the following log messages:
Nov 16 23:49:01 fuzzer4 flowtrackd[45807]: thread 'flowtrackd-ZrBh' panicked at 'descriptor 26476800 transitioned from Fill to Tx'
Nov 17 02:09:01 fuzzer4 flowtrackd[45926]: thread 'flowtrackd-Ay0i' panicked at 'descriptor 18422016 transitioned from Comp to Rx'
Nov 29 10:52:08 fuzzer4 flowtrackd[83849]: thread 'flowtrackd-5UYF' panicked at 'descriptor 3154176 transitioned from Tx to Rx'
The first print shows a descriptor was put on the FILL ring and transitioned directly to the TX ring without being read from the RX ring first. This appears to hint at a bug in our application, perhaps indicating that our application duplicates the descriptor putting one copy in the FILL ring and the other copy in the TX ring.
The second invalid transition happened for a descriptor moving from the COMP ring to the RX ring without being put first on the FILL ring. This appears to hint at a kernel bug, perhaps indicating that the kernel duplicated a descriptor and put it both in the COMP ring and the RX ring.
The third invalid transition was from the TX to the RX ring without going through the FILL or COMP ring first. This seems like an extended case of the previous COMP to RX transition and again hints at a possible kernel bug.
Confused by the results we double-checked our tracking code and attempted to find any possible way our application could duplicate a descriptor putting it both in the FILL and TX rings. With no bugs found we felt we needed to gather more information.
Using ftrace as a “flight recorder”
While using a state machine to catch invalid descriptor transitions was able to catch these cases, it still lacked a number of important details which might help track down the ultimate cause of the bug. We still didn’t know if the bug was a kernel issue or an application issue. Confusingly the transition states seemed to indicate it was both.
To gather some more information we ideally wanted to be able to track the history of a descriptor. Since we were using a shared UMEM a descriptor could in theory transition between interfaces, and receive queues. Additionally, our application uses a single green thread to handle each XSK, so it might be interesting to track those descriptor transitions by XSK, CPU, and thread. A simple but unscalable way to achieve this would be to simply print this information at every transition point. This of course is not really an option for a production environment that needs to be able to process millions of packets per second. Both the amount of data produced and the overhead of printing that information will not work.
Up to this point we had been carefully debugging this issue in production systems. The issue was rare enough that even with our large production deployment it might take a day for some production machines to start to display the issue. If we did want to explore more resource intensive debugging techniques we needed to see if we could reproduce this in a test environment. For this we created 10 virtual machines that were continuously load testing our application with iperf. Fortunately with this setup we were able to reproduce the issue about once a day, giving us some more freedom to try some more resource intensive debugging techniques.
Even using a virtual machine it still doesn’t scale to print logs at every descriptor transition, but do you really need to see every transition? In theory the most interesting events are the events right before the bug occurs. We could build something that internally keeps a log of the last N events and only dump that log when the bug occurs. Something like a black box flight recorder used in airplanes to track the events leading up to a crash. Fortunately for us, we don’t really need to build this, and instead can use the Linux kernel’s ftrace feature, which has some additional features that might help us ultimately track down the cause of this bug.
ftrace is a kernel feature that operates by internally keeping a set of per-CPU ring buffers of trace events. Each event stored in the ring buffer is time-stamped and contains some additional information about the context where the event occurred, the CPU, and what process or thread was running at the time of the event. Since these events are stored in per-CPU ring buffers, once the ring is full, new events will overwrite the oldest events leaving a log of the most recent events on that CPU. Effectively we have our flight recorder that we desired, all we need to do is add our events to the ftrace ring buffers and disable tracing when the bug occurs.
ftrace is controlled using virtual files in the debugfs filesystem. Tracing can be enabled and disabled by writing either a 1 or a 0 to:
/sys/kernel/debug/tracing/tracing_on
We can update our application to insert our own events into the tracing ring buffer by writing our messages into the trace_marker file:
/sys/kernel/debug/tracing/trace_marker
And finally after we’ve reproduced the bug and our application has disabled tracing we can extract the contents of all the ring buffers into a single trace file by reading the trace file:
/sys/kernel/debug/tracing/trace
It is worth noting that writing messages to the trace_marker virtual file still involves making a system call and copying your message into the ring buffers. This can still add overhead and in our case where we are logging several prints per packet that overhead might be significant. Additionally, ftrace is a systemwide kernel tracing feature, so you may need to either adjust the permissions of virtual files, or run your application with the appropriate permissions.
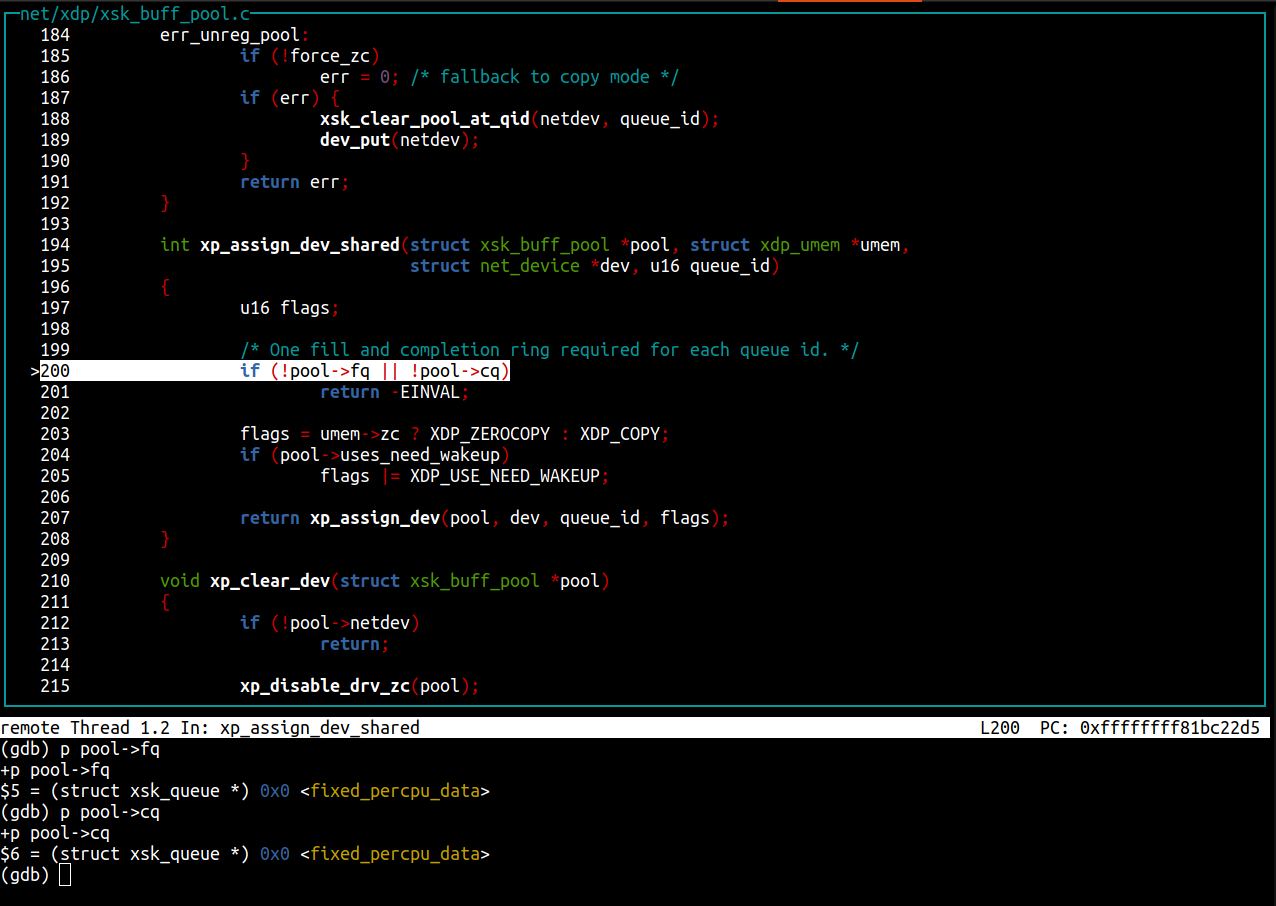
There is of course one more big advantage of using ftrace to assist in debugging this issue. As shown above we can log or own application messages to ftrace using the trace_marker file, but at its core ftrace is a kernel tracing feature. This means that we can additionally use ftrace to log events from the kernel side of the AF_XDP packet processing. There are several ways to do this, but for our purposes we used kprobes so that we could target very specific lines of code and print some variables. kprobes can be created directly in ftrace, but I find it easier to create them using the “perf probe” command of perf tool in Linux. Using the “-L” and “-V” arguments you can find which lines of a function can be probed and which variables can be viewed at those probe points. Finally, you can add the probe with the “-a” argument. For example after examining the kernel code we insert the following probe in the receive path of a XSK:
perf probe -a '__xsk_rcv_zc:7 addr len xs xs->pool->fq xs->dev'
This will probe line 7 of __xsk_rcv_zc() and print the descriptor address, the packet length, the XSK address, the fill queue address and the net device address. For context here is what __xsk_rcv_zc() looks like from the perf probe command:
$ perf probe -L __xsk_rcv_zc
      0  static int __xsk_rcv_zc(struct xdp_sock *xs, struct xdp_buff *xdp, u32 len)
         {
                struct xdp_buff_xsk *xskb = container_of(xdp, struct xdp_buff_xsk, xdp);
                u64 addr;
                int err;

                addr = xp_get_handle(xskb);
      7         err = xskq_prod_reserve_desc(xs->rx, addr, len);
      8         if (err) {
                        xs->rx_queue_full++;
                        return err;
                }
In our case line 7 is the call to xskq_prod_reserve_desc(). At this point in the code the kernel has already removed a descriptor from the FILL queue and copied a packet into that descriptor. The call to xsk_prod_reserve_desc() will ensure that there is space in the RX queue, and if there is space will add that descriptor to the RX queue. It is important to note that while xskq_prod_reserve_desc() will put the descriptor in the RX queue it does not update the producer pointer of the RX ring or notify the XSK that packets are ready to be read because the kernel tries to batch these operations.
Similarly, we wanted to place a probe in the transmit path on the kernel side and ultimately placed the following probe:
perf probe -a 'xp_raw_get_data:0 addr'
There isn’t much interesting to show here in the code, but this probe is placed at a location where descriptors have been removed from the TX queue but have not yet been put in the COMPLETION queue.
In both of these probes it would have been nice to put the probes at the earliest location where descriptors were added or removed from the XSK queues, and to print as much information as possible at these locations. However, in practice the locations where kprobes can be placed and the variables available at those locations limits what can be seen.
With the probes created we still need to enable them to be seen in ftrace. This can be done with:
echo 1 > /sys/kernel/debug/tracing/events/probe/__xsk_rcv_zc_L7/enableecho 1 > /sys/kernel/debug/tracing/events/probe/xp_raw_get_data/enable
With our application updated to trace the transition of every descriptor and stop tracing when an invalid transition occurred we were ready to test again.
Tracking descriptor state is not enough
Unfortunately our initial test of our “flight recorder” didn’t immediately tell us anything new. Instead, it mostly confirmed what we already knew, which was that somehow we would end up in a state with the same descriptor twice. It also highlighted the fact that catching an invalid descriptor transition doesn’t mean you have caught the earliest point where the duplicate descriptor appeared. For example assume we have our descriptor A and our duplicate A’. If these are already both present in the FILL queue it is perfectly valid to:
RX A -> FILL ARX A’ -> FILL A’
This can occur for many cycles, before an invalid transition eventually occurs when both descriptors are seen either in the same batch or between queues.
Instead, we needed to rethink our approach. We knew that the kernel removes descriptors from the FILL queue, fills them, and places them in the RX queue. This means that for any given XSK the order that descriptors are inserted into the FILL queue should match the order that they come out of the RX queue. If a descriptor was ever duplicated in this kernel RX path we should see the duplicate descriptor appear out-of-order. With this in mind we updated our application to independently track the order of the FILL queue using a double ended queue. As our application puts descriptors into the FILL queue we also push the descriptor address into the tail of our tracking queue and when we receive packets we pop the descriptor address from the head of our tracking queue and ensure the address matches. If it ever doesn’t match we again can log to trace_marker and stop ftrace.
Below is the end of the first trace we captured with the updated code tracking the order of the FILL to RX queues. The color has been added to improve readability:
# tracer: nop
#
# entries-in-buffer/entries-written: 918959/953688441 #P:4
#
# _—–=> irqs-off
# / _—-=> need-resched
# | / _—=> hardirq/softirq
# || / _–=> preempt-depth
# ||| / _-=> migrate-disable
# |||| / delay
# TASK-PID CPU# ||||| TIMESTAMP FUNCTION
# | | | ||||| | |
iperf2-127018 [002] d.Z1. 542812.657026: __xsk_rcv_zc_L7: (__xsk_rcv_zc+0x9b/0x250) addr=0x16ce900 len=0x4e xs=0xffffa0c6e26ab400 fq=0xffffa0c72db94c40
flowtrackd-p9zw-209120 [001] ….. 542812.657037: tracing_mark_write: ingress q:1 0x16ce900 FILL -> RX
flowtrackd-p9zw-209120 [001] ….. 542812.657039: tracing_mark_write: 0x16ce900 egress_tx_queue forward
flowtrackd-p9zw-209120 [001] ….. 542812.657040: tracing_mark_write: egress q:1 0x16ce900 RX -> TX
flowtrackd-p9zw-209120 [001] ….. 542812.657043: xp_raw_get_data: (xp_raw_get_data+0x0/0x60) addr=0x16ce900
flowtrackd-p9zw-209120 [001] d.Z1. 542812.657054: __xsk_rcv_zc_L7: (__xsk_rcv_zc+0x9b/0x250) addr=0x160a100 len=0x4e xs=0xffffa0c6e26ab400 fq=0xffffa0c72db94c40
iperf2-127018 [002] d.Z1. 542812.657090: __xsk_rcv_zc_L7: (__xsk_rcv_zc+0x9b/0x250) addr=0x13d3900 len=0x4e xs=0xffffa0c6e26ab400 fq=0xffffa0c72db94c40
flowtrackd-p9zw-209120 [001] ….. 542812.657100: tracing_mark_write: egress q:1 0x16ce900 TX -> COMP
flowtrackd-p9zw-209120 [001] ….. 542812.657102: tracing_mark_write: ingress q:1 0x16ce900 COMP -> FILL
flowtrackd-p9zw-209120 [001] ….. 542812.657104: tracing_mark_write: ingress q:1 0x160a100 FILL -> RX
iperf2-127018 [002] d.Z1. 542812.657117: __xsk_rcv_zc_L7: (__xsk_rcv_zc+0x9b/0x250) addr=0x1dba100 len=0x4e xs=0xffffa0c6e26ab400 fq=0xffffa0c72db94c40
iperf2-127018 [002] d.Z1. 542812.657145: __xsk_rcv_zc_L7: (__xsk_rcv_zc+0x9b/0x250) addr=0x1627100 len=0x4e xs=0xffffa0c6e26ab400 fq=0xffffa0c72db94c40
flowtrackd-p9zw-209120 [001] ….. 542812.657145: tracing_mark_write: ingress q:1 0x1229100 FILL -> RX: expected 0x13d3900 remaining: [1dba100, 1627100, 1272900, 1612100, 1100100, 161e100, 110a100, 12e4900, 165b900, 1d20100, 1672100, 1257900, 1237900, 12da900, 1203900, 13fc100, 1e10900, 12e6900, 1d69900, 13b9900, 12c1100, 1e7a900, 133b100, 11a8900, 1156900, 12fb900, 1d22900, 1ded900, 11eb900, 1b2b100, 167d900, 1621100, 10e3900, 128a900, 1de5900, 1db7900, 1b57900, 12fa900, 1b0e900, 13a3100, 16b2100, 1318900, 1da2100, 1373900, 1da7900, 1e23100, 1da2900, 1363900, 16c2900, 16ab900, 1b66900, 1124100, 1d9e900, 1dfc900, 11d4900, 1654100, 1e0c900, 1353900, 16ab100, 11f7100, 129a900, 13c5100, 1615100, 135b100, 1237100, 117e100, 1e73900, 1b19100, 1e45100, 13f1900, 1e5a100, 13a1100, 1154900, 1e6c100, 11a3100, 1351900, 11de900, 168c900, 111d100, 12b8900, 11fd100, 16b6100, 1175100, 1309900, 1b1a100, 1348900, 1d60900, 1d1f100, 16c3100, 1229100, 16d8100, 12ea900, 1b78900, 16bc100, 1382100, 1e6d100, 1d44100, 1df2100, …, ]
Here you can see the power of our ftrace flight recorder. For example, we can follow the full cycle of descriptor 0x16ce900 as it is first received in the kernel, received by our application which forwards the packet by adding to the TX queue, the kernel transmitting, and finally our application receiving the completion and placing the descriptor back in the FILL queue.
The trace starts to get interesting on the next two packets received by the kernel. We can see 0x160a100 received first in the kernel and then by our application. However things go wrong when the kernel receives 0x13d3900 but our application receives 0x1229100. The last print of the trace shows the result of our descriptor order tracking. We can see that the kernel side appears to match our next expected descriptor and the next two descriptors, yet unexpectedly we see 0x1229100 arrive out of nowhere. We do think that the descriptor is present in the FILL queue, but it is much further down the line in the queue. Another potentially interesting detail is that between 0x160a100 and 0x13d3900 the kernel’s softirq switches from CPU 1 to CPU 2.
If you recall, our __xsk_rcv_zc_L7 kprobe was placed on the call to xskq_prod_reserve_desc() which adds the descriptor to the RX queue. Below we can examine that function to see if there are any clues on how the descriptor address received by our application could be different from what we think should have been inserted by the kernel.
static inline int xskq_prod_reserve_desc(struct xsk_queue *q,
                                     	u64 addr, u32 len)
{
    	struct xdp_rxtx_ring *ring = (struct xdp_rxtx_ring *)q->ring;
    	u32 idx;

    	if (xskq_prod_is_full(q))
            	return -ENOBUFS;

    	/* A, matches D */
    	idx = q->cached_prod++ & q->ring_mask;
    	ring->desc[idx].addr = addr;
    	ring->desc[idx].len = len;

    	return 0;
}
Here you can see that the queue’s cached_prod pointer is incremented first before we update the descriptor address and length. As the name implies the cached_prod pointer isn’t the actual producer pointer which means that at some point xsk_flush() must be called to sync the cached_prod pointer and the prod pointer to actually expose the newly received descriptors to user-mode. Perhaps there is a race where xsk_flush() is called after updating the cached_prod pointer, but before the actual descriptor address has been updated in the ring? If this were to occur our application would see the old descriptor address from that slot in the RX queue and would cause us to “duplicate” that descriptor.
We can test our theory by making two more changes. First we can update our application to write back a known “poisoned” descriptor address to each RX queue slot after we have received a packet. In this case we chose 0xdeadbeefdeadbeef as our known invalid address and if we ever receive this value back out of the RX queue we know a race has occurred and exposed an uninitialized descriptor. The second change we can make is to add a kprobe on xsk_flush() to see if we can actually capture the race in the trace.
perf probe -a 'xsk_flush:0 xs'
flowtrackd-9chS-142014 [000] d.Z1. 609766.698512: __xsk_rcv_zc_L7: (__xsk_rcv_zc+0x9b/0x250) addr=0xff0900 len=0x42 xs=0xffff90fd32693c00 fq=0xffff90fd03d66380
iperf2-1217 [002] d.Z1. 609766.698523: __xsk_rcv_zc_L7: (__xsk_rcv_zc+0x9b/0x250) addr=0x1000900 len=0x42 xs=0xffff90fd32693c00 fq=0xffff90fd03d66380
flowtrackd-9chS-142014 [000] d.Z1. 609766.698528: xsk_flush: (__xsk_map_flush+0x4e/0x180) xs=0xffff90fd32693c00
flowtrackd-9chS-142014 [000] ….. 609766.698540: tracing_mark_write: ingress q:1 0xff0900 FILL -> RX
Iperf2-1217 [002] d.Z1. 609766.698545: xsk_flush: (__xsk_map_flush+0x4e/0x180) xs=0xffff90fd32693c00
flowtrackd-9chS-142014 [000] ….. 609766.698617: tracing_mark_write: ingress q:1 0xdeadbeefdeadbeef FILL -> RX: expected 0x1000900remaining: [fe4100, f9c100, f8a100, 10ff900, ff0100, 1097900, fec100, 1892900, 104d900, 1f64100, 101c900, f95900, 1773900, 1f7b900, 1f77100, 10f7100, 10fe900, 1f0a100, f5f900, 18a8900, 18d5900, 10e0900, 1f50900, 1068900, 10a3100, 1002900, 1f6e900, fcc100, 18a6100, 18e1100, 1028900, f7b100, 1f4e900, fcb900, 1008100, ffd100, 1059900, f4d900, 1f16900, …,]
Here we appear to have our smoking gun. As we predicted we can see that xsk_flush() is called on CPU 0 while a softirq is currently in progress on CPU 2. After the flush our application sees the expected 0xff0900 filled in from the softirq on CPU 0, and then 0xdeadbeefdeadbeef which is our poisoned uninitialized descriptor address.
We now have evidence that the following order of operations is happening:
CPU 2                                                   CPU 0
-----------------------------------                     --------------------------------
__xsk_rcv_zc(struct xdp_sock *xs):                      xsk_flush(struct xdp_sock *xs):

idx = xs->rx->cached_prod++ & xs->rx->ring_mask;
                                                        // Flush the cached pointer as the new head pointer of
                                                        // the RX ring.
                                                        smp_store_release(&xs->rx->ring->producer, xs->rx->cached_prod);

                                                        // Notify user-side that new descriptors have been produced to
                                                        // the RX ring.
                                                        sock_def_readable(&xs->sk);

                                                        // flowtrackd reads a descriptor "too soon" where the addr
                                                        // and/or len fields have not yet been updated.
xs->rx->ring->desc[idx].addr = addr;
xs->rx->ring->desc[idx].len = len;
The AF_XDP documentation states that: “All rings are single-producer/single-consumer, so the user-space application needs explicit synchronization of multiple processes/threads are reading/writing to them.” The explicit synchronization requirement must also apply on the kernel side. How can two operations on the RX ring of a socket run at the same time?
On Linux, a mechanism called NAPI prevents CPU interrupts from occurring every time a packet is received by the network interface. It instructs the network driver to process a certain amount of packets at a frequent interval. For the veth driver that polling function is called veth_poll, and it is registered as the function handler for each queue of the XDP enabled network device. A NAPI-compliant network driver provides the guarantee that the processing of the packets tied to a NAPI context (struct napi_struct *napi) will not be happening at the same time on multiple processors. In our case, a NAPI context exists for each queue of the device which means per AF_XDP socket and their associated set of ring buffers (RX, TX, FILL, COMPLETION).
static int veth_poll(struct napi_struct *napi, int budget)
{
	struct veth_rq *rq =
		container_of(napi, struct veth_rq, xdp_napi);
	struct veth_stats stats = {};
	struct veth_xdp_tx_bq bq;
	int done;

	bq.count = 0;

	xdp_set_return_frame_no_direct();
	done = veth_xdp_rcv(rq, budget, &bq, &stats);

	if (done < budget && napi_complete_done(napi, done)) {
		/* Write rx_notify_masked before reading ptr_ring */
		smp_store_mb(rq->rx_notify_masked, false);
		if (unlikely(!__ptr_ring_empty(&rq->xdp_ring))) {
			if (napi_schedule_prep(&rq->xdp_napi)) {
				WRITE_ONCE(rq->rx_notify_masked, true);
				__napi_schedule(&rq->xdp_napi);
			}
		}
	}

	if (stats.xdp_tx > 0)
		veth_xdp_flush(rq, &bq);
	if (stats.xdp_redirect > 0)
		xdp_do_flush();
	xdp_clear_return_frame_no_direct();

	return done;
}
veth_xdp_rcv() processes as many packets as the budget variable is set to, marks the NAPI processing as complete, potentially reschedules a NAPI polling, and then, calls xdp_do_flush(), breaking the NAPI guarantee cited above. After the call to napi_complete_done(), any CPU is free to execute the veth_poll() function before all the flush operations of the previous call are complete, allowing the race on the RX ring.
The race condition can be fixed by completing all the packet processing before signaling the NAPI poll as complete. The patch as well as the discussion on the kernel mailing list that lead to the fix are available here: [PATCH] veth: Fix race with AF_XDP exposing old or uninitialized descriptors. The patch was recently merged upstream.
Conclusion
We’ve found and fixed a race condition in the Linux virtual ethernet (veth) driver that was corrupting packets for AF_XDP enabled devices!
This issue was a tough one to find (and to reproduce) but logical iterations lead us all the way down to the internals of the Linux kernel where we saw that a few lines of code were not executed in the correct order.
A rigorous methodology and the knowledge of the right debugging tools are essential to go about tracking down the root cause of potentially complex bugs.
This was important for us to fix because while TCP was designed to recover from occasional packet drops, randomly dropping legitimate packets slightly increased the latency of connection establishments and data transfers across our network.
Interested about other deep dive kernel debugging journeys? Read more of them on our blog!