All posts by Cloudflare

Introducing Rollbacks for Workers Deployments

Post Syndicated from Cloudflare original https://blog.cloudflare.com/introducing-rollbacks-for-workers-deployments/

Introducing Rollbacks for Workers Deployments

Introducing Rollbacks for Workers Deployments

In November, 2022, we introduced deployments for Workers. Deployments are created as you make changes to a Worker. Each one is unique. These let you track changes to your Workers over time, seeing who made the changes, and where they came from.

Introducing Rollbacks for Workers Deployments

When we made the announcement, we also said our intention was to build more functionality on top of deployments.

Today, we’re proud to release rollbacks for deployments.

Rollbacks

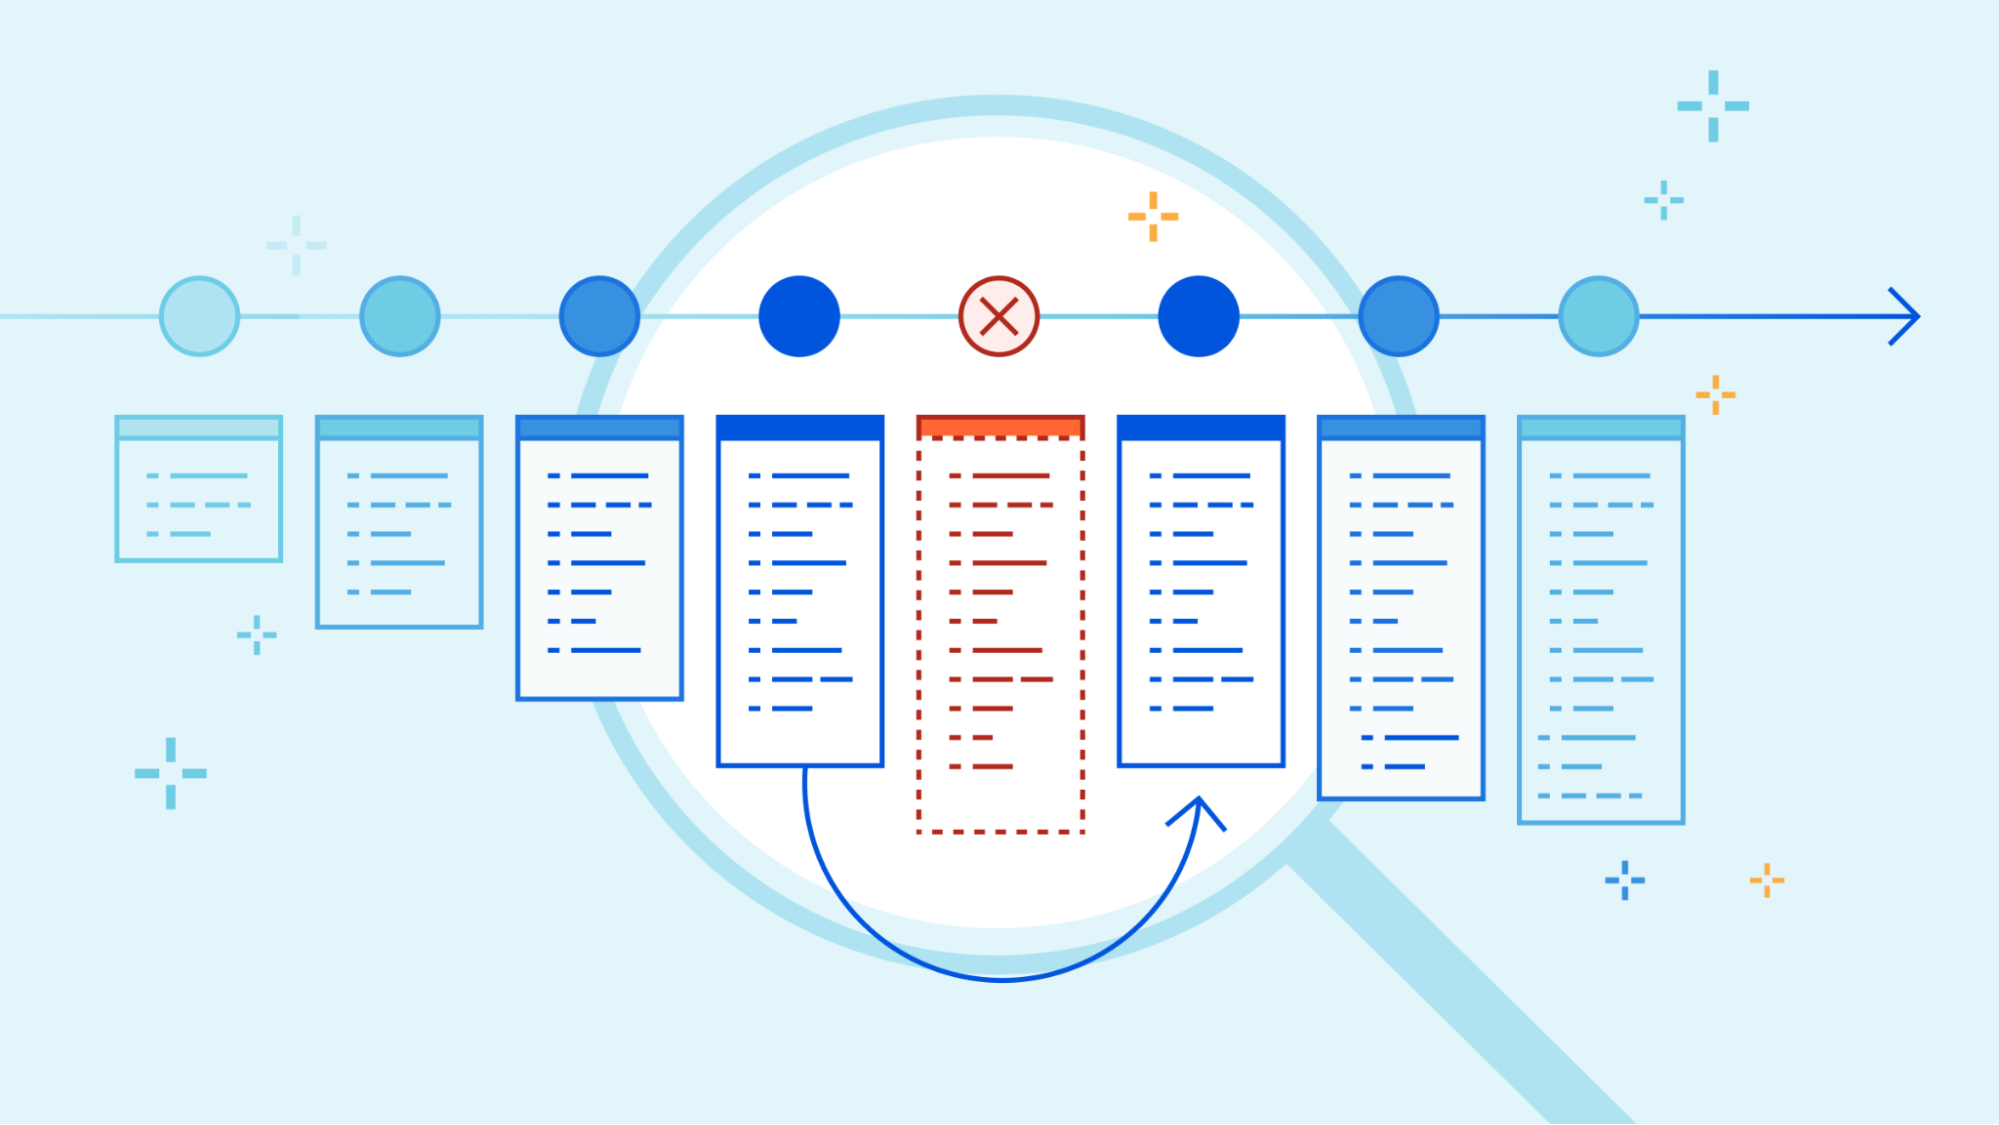
As nice as it would be to know that every deployment is perfect, it’s not always possible – for various reasons. Rollbacks provide a quick way to deploy past versions of a Worker – providing another layer of confidence when developing and deploying with Workers.

Via the dashboard

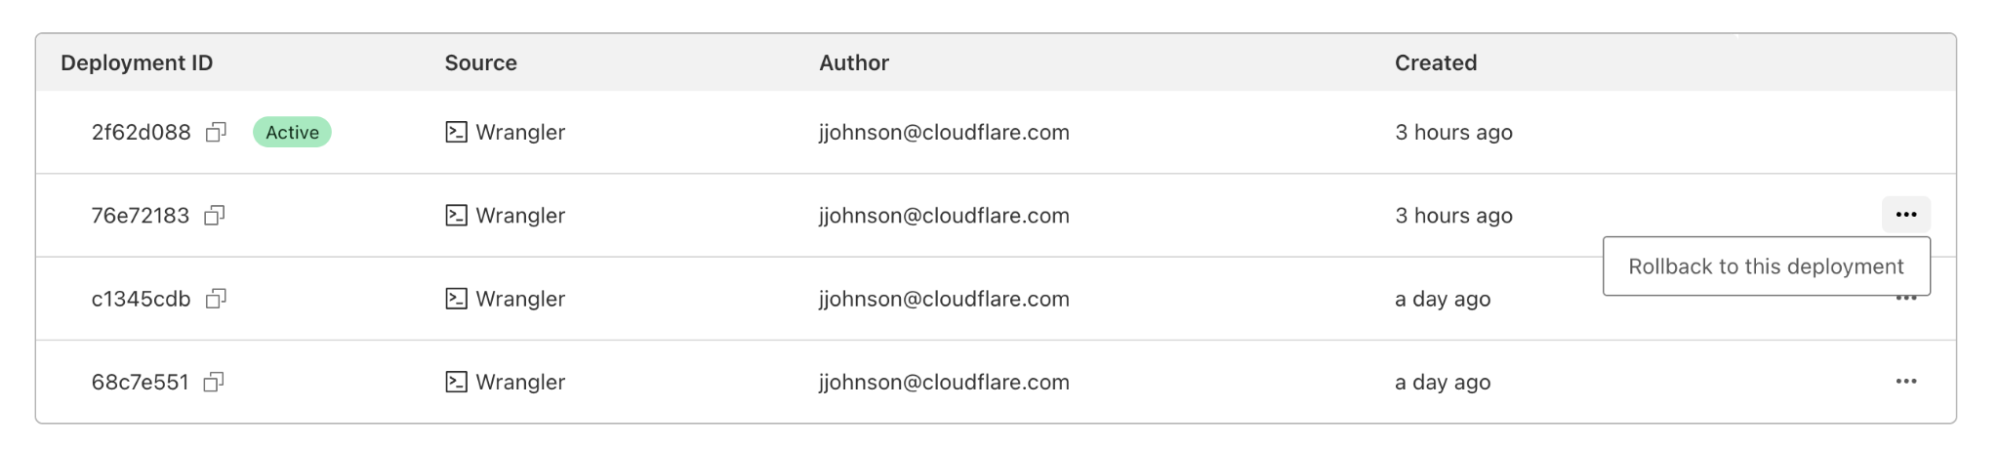
In the dashboard, you can navigate to the Deployments tab. For each deployment that’s not the most recent, you should see a new icon on the far right of the deployment. Hovering over that icon will display the option to rollback to the specified deployment.

Introducing Rollbacks for Workers Deployments

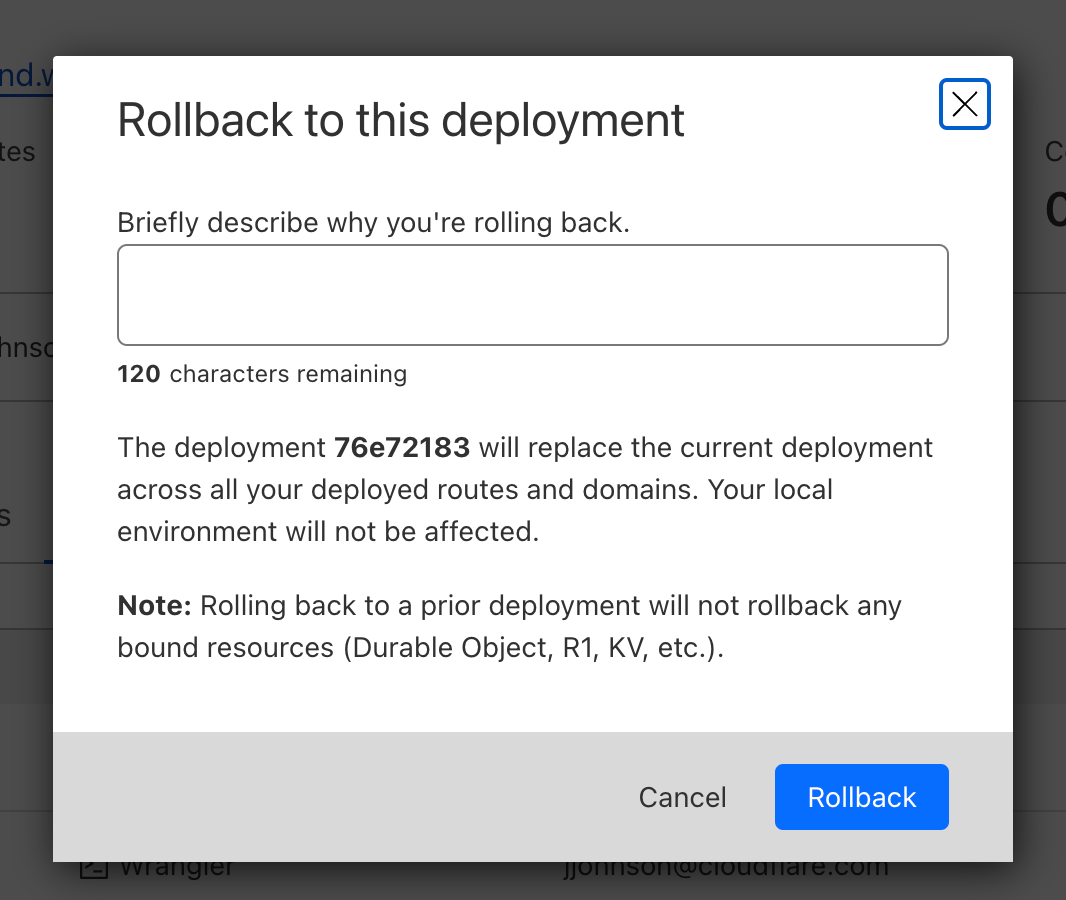
Clicking on that will bring up a confirmation dialog, where you can enter a reason for rollback. This provides another mechanism of record-keeping and helps give more context for why the rollback was necessary.

Introducing Rollbacks for Workers Deployments

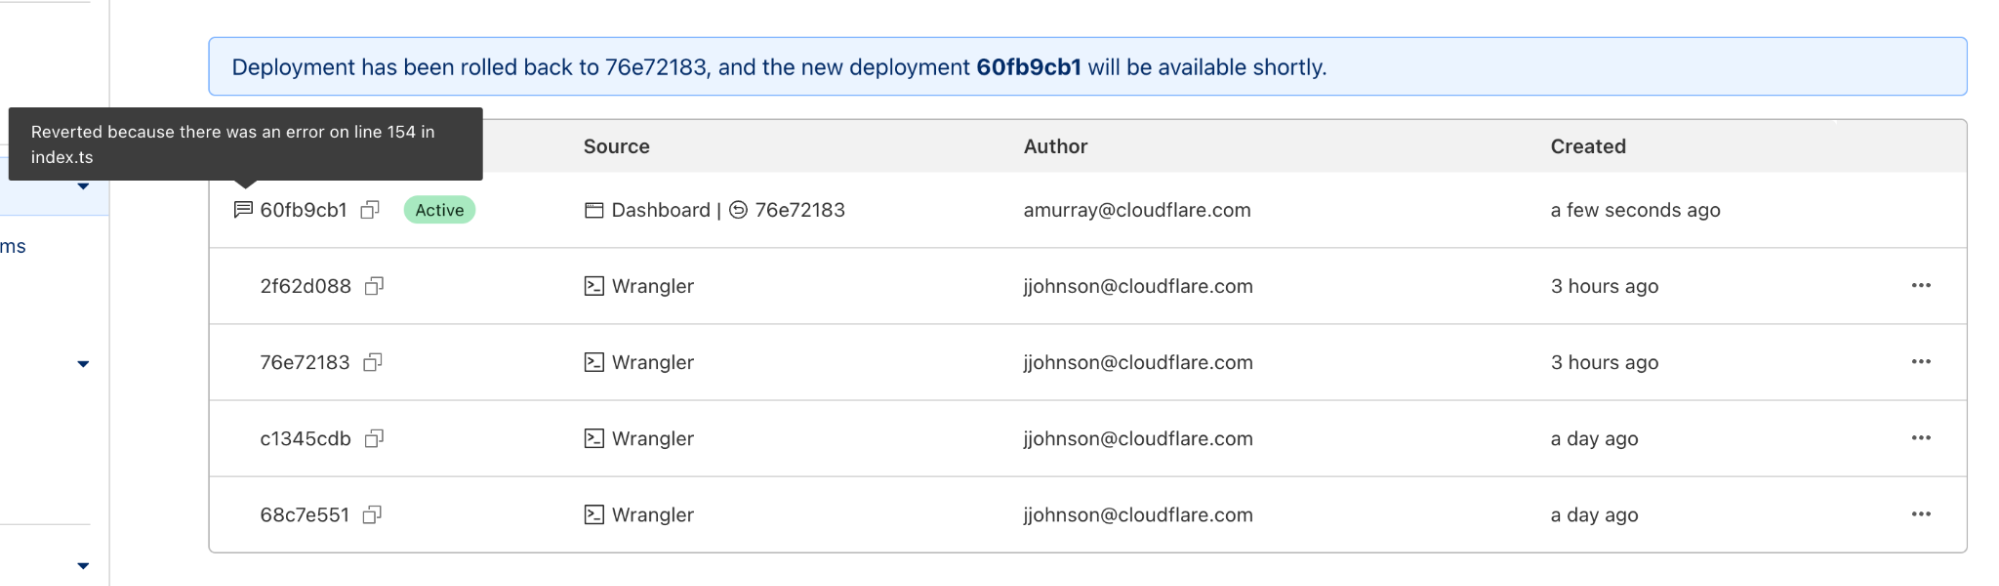
Once you enter a reason and confirm, a new rollback deployment will be created. This deployment has its own ID, but is a duplicate of the one you rolled back to. A message appears with the new deployment ID, as well as an icon showing the rollback message you entered above.

Introducing Rollbacks for Workers Deployments

Via Wrangler

With Wrangler version 2.13, rolling back deployments via Wrangler can be done via a new command – wrangler rollback. This command takes an optional ID to rollback to a specific deployment, but can also be run without an ID to rollback to the previous deployment. This provides an even faster way to rollback in a situation where you know that the previous deployment is the one that you want.

Introducing Rollbacks for Workers Deployments

Just like the dashboard, when you initiate a rollback you will be prompted to add a rollback reason and to confirm the action.

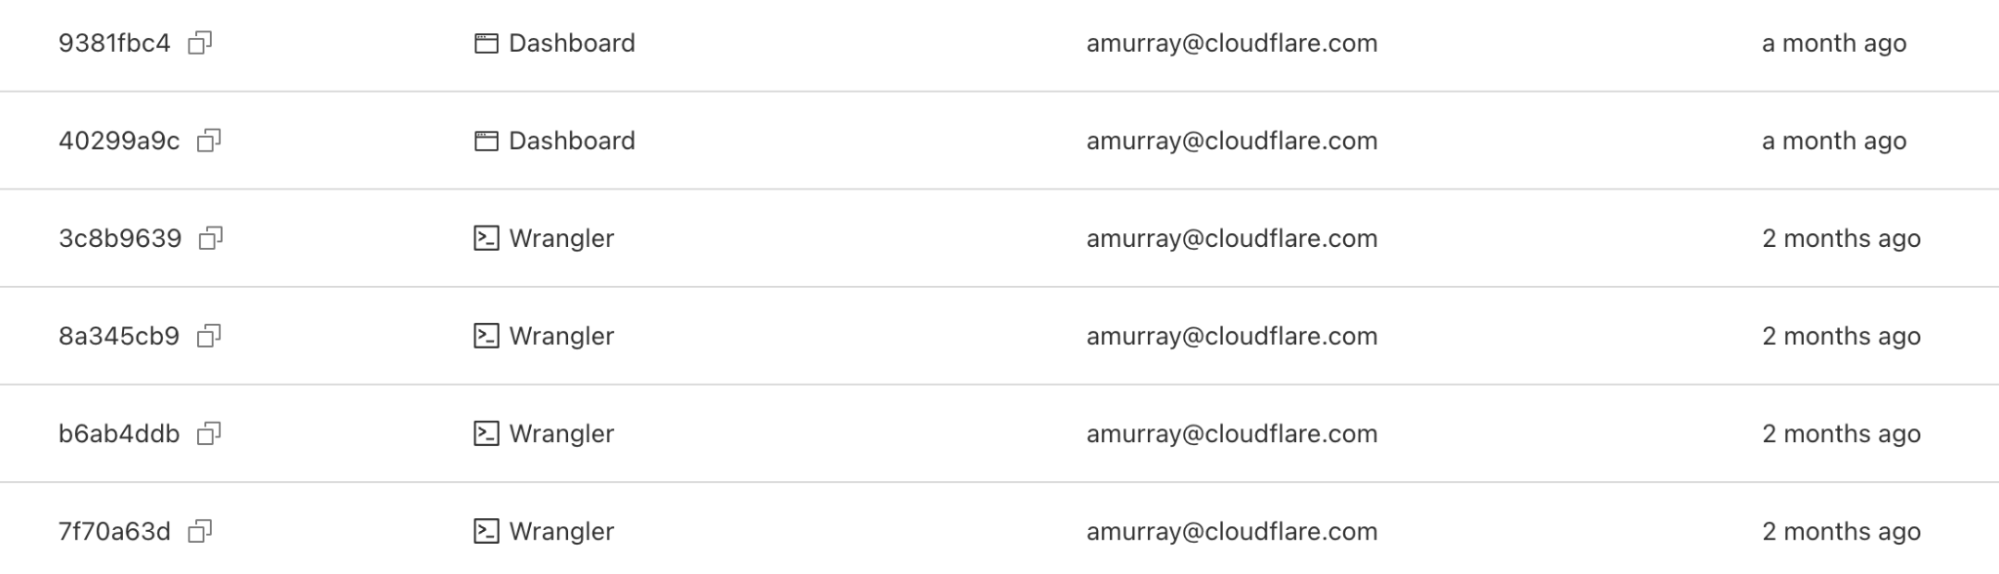
In addition to wrangler rollback we’ve done some refactoring to the wrangler deployments command. Now you can run wrangler deployments list to view up to the last 10 deployments.

Introducing Rollbacks for Workers Deployments

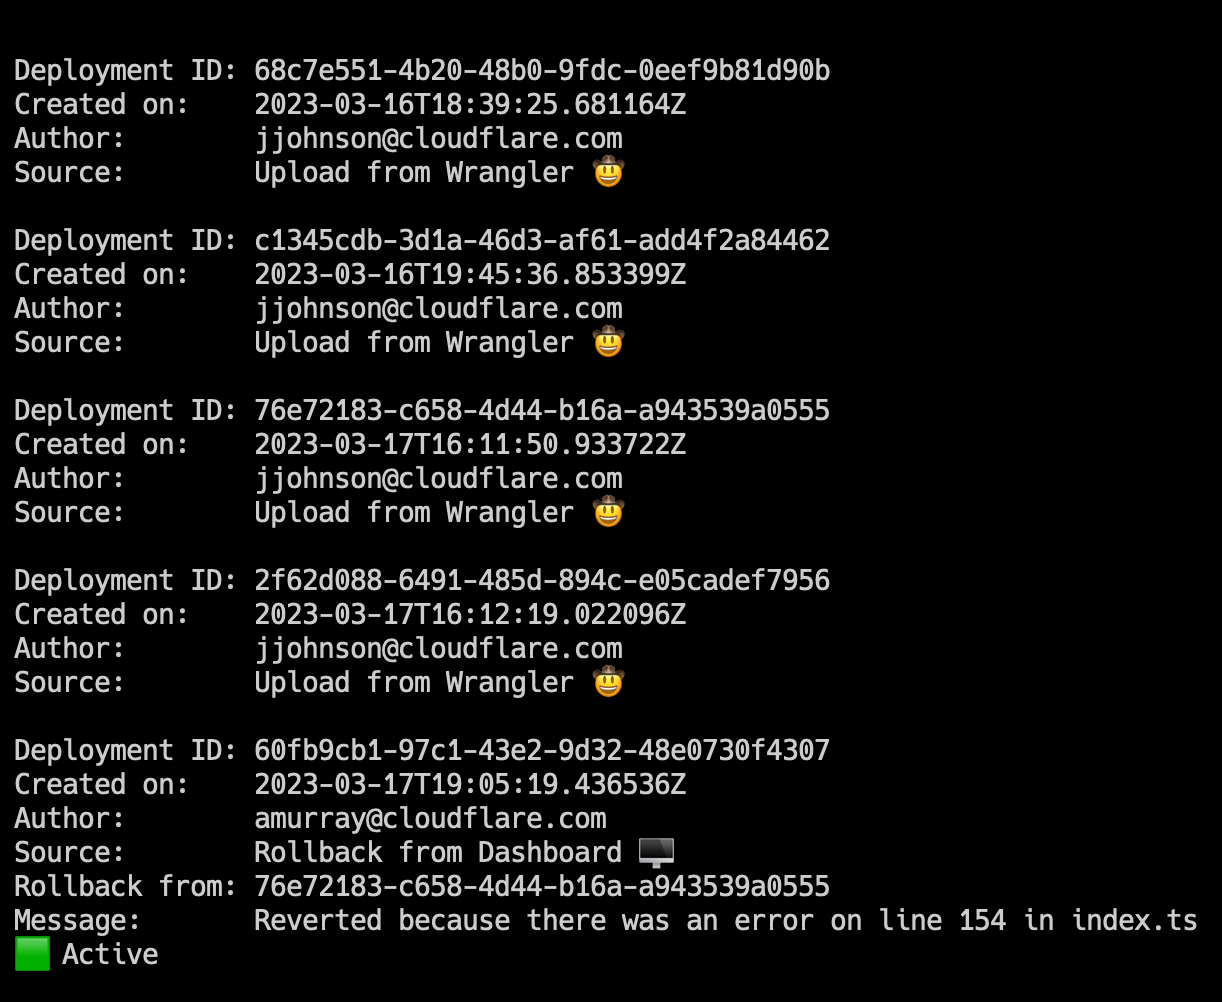
Here, you can see two new annotations: rollback from and message. These match the dashboard experience, and provide more visibility into your deployment history.

To view an individual deployment, you can run wrangler deployments view. This will display the last deployment made, which is the active deployment. If you would like to see a specific deployment, you can run wrangler deployments view [ID].

Introducing Rollbacks for Workers Deployments

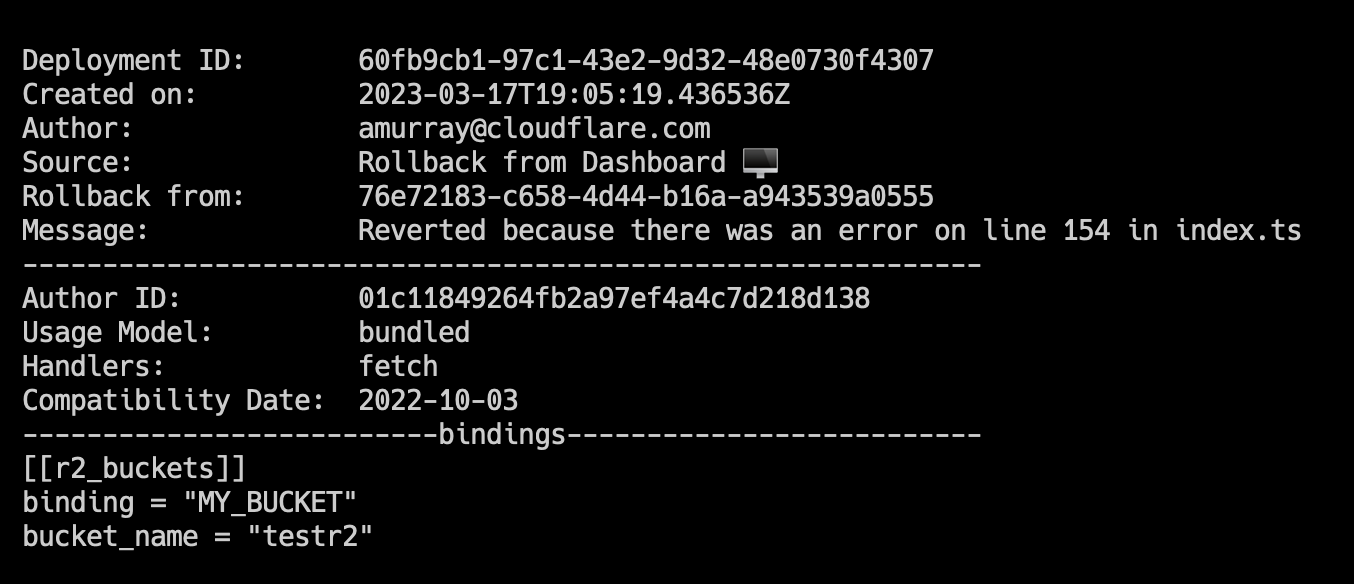
We’ve updated this command to display more data like: compatibility date, usage model, and bindings. This additional data will help you to quickly visualize changes to Worker or to see more about a specific Worker deployment without having to open your editor and go through source code.

Keep deploying!

We hope this feature provides even more confidence in deploying Workers, and encourages you to try it out! If you leverage the Cloudflare dashboard to manage deployments, you should have access immediately. Wrangler users will need to update to version 2.13 to see the new functionality.

Make sure to check out our updated deployments docs for more information, as well as information on limitations to rollbacks. If you have any feedback, please let us know via this form.

Don’t roll your own high cardinality analytics, use Workers Analytics Engine

Post Syndicated from Cloudflare original https://blog.cloudflare.com/analytics-engine-open-beta/

Don't roll your own high cardinality analytics, use Workers Analytics Engine

Don't roll your own high cardinality analytics, use Workers Analytics Engine

Workers Analytics Engine (or for short, Analytics Engine) is a new way for developers to store and analyze time series analytics about anything using Cloudflare Workers, and it’s now in open beta! Analytics Engine is really good at gathering time-series data for really high cardinality and high-volume data sets from Cloudflare Workers. At Cloudflare, we use Analytics Engine to provide insight into how our customers use Cloudflare products.

Log, log, logging!

As an example, Analytics Engine is used to observe the backend that powers Instant Logs. Instant Logs allows Cloudflare customers to stream a live session of the HTTP logs for their domain to the Cloudflare dashboard. The backend for Instant Logs is built on Cloudflare Workers.

Briefly, the Instant Logs backend works by receiving requests from each Cloudflare server that processes a customer’s HTTP traffic. These requests contain the HTTP logs for the customer’s HTTP traffic. The Instant Logs backend then forwards these HTTP logs to the customer’s browser via a WebSocket.

In order to ensure that the HTTP logs are being delivered smoothly to a customer’s browser, we need to track the request rates across all active Instant Logs sessions. We also need to track the request rates across all Cloudflare data centers, since Instant Logs is built on Cloudflare Workers, and Cloudflare Workers is built on Cloudflare’s massive network. As a result, the data set for the Instant Logs backend has really massive cardinality!

“Traditional” metrics systems like Prometheus are poorly suited to serving high cardinality data. Fortunately, this is exactly the problem that Analytics Engine is designed to solve. So, we sent all the Instant Logs backend request logs to Analytics Engine. Log, log, logging!

Using the Analytics Engine API (which has a SQL interface), we can visualize the Instant Logs backend request rates for the top sessions and top data centers over the previous month. “Zooming in” to an interesting period is also really fast. We’ve designed Analytics Engine so that queries always respond within the window of interactivity (more on this later). This makes it well-suited for interactive debugging with a dashboard tool (in this case we’re using Grafana).

What we learned in closed beta

We received a lot of great feedback during the closed beta. Developers were excited about the SQL API, ease of integration with Workers, the ability to query data in Grafana (with more integrations in future), and our simple pricing model (free!). However, there were a number of things that we needed to fix before moving on to the open beta phase.

Developers were supportive of our choice to use SQL (the world’s language for data) as the interface for the Analytics Engine API. However, when developers used the Analytics Engine API, they found that the error messages were opaque and difficult to debug. For the open beta, we have rewritten the API from the ground-up to provide much improved error messaging.

Before:
> SELECT column_that_does_not_exist FROM your_dataset FORMAT JSON
Sorry, we were unable to evaluate your query

After:
> SELECT column_that_does_not_exist FROM your_dataset FORMAT JSON
cannot select unknown column: "column_that_does_not_exist"

In addition to understanding what went wrong, developers also wanted to understand what the API is capable of doing. For the open beta, we’ve written a comprehensive SQL reference for Analytics Engine. We also have a few “How To” guides, including information on how to hook up the API to Grafana.

ABR and Analytics Engine

Analytics Engine uses Cloudflare’s ABR technology to make queries fast. This means that every query is satisfied by a resolution of the data that matches the query. For example, if we are looking at data for the last month, we might use a lower resolution version of the Analytics Engine data than if we are looking at the last hour. The lower resolution data will provide the correct answer, but will respond within the window of interactivity. By using multiple, different resolutions of the same data, ABR provides consistent response times.

To account for the different resolutions of data, each event carries with it information about the resolution of data that the event comes from. This information is encoded in the _sample_interval column. For example, if an event comes from a resolution of the data which is 1% of the original data, its _sample_interval will be set to 100. To reconstruct the number of events in the original data, we can use the query:

SELECT sum(_sample_interval) AS count FROM dataset

For the open beta, we are exposing _sample_interval directly to developers. In the future, we’ll make it easier to work with this field by providing convenience functions which automatically take into account varying resolutions of the data. We also want to provide the ability to understand the confidence level of the estimates that these functions return.

Coming soon

This is just the beginning for Workers Analytics Engine. Internally, there has been high demand for the ability to define alerts based on the data captured by Analytics Engine. This is also something that we want developers to be able to do.

As in the closed beta, fields are accessed via names that have 1-based indexing (blob1, blob2, double1, double2, etc.). In the future, we will allow developers to attach names to fields, and these names will be available to use to retrieve data via the SQL API.

Something we want to provide is a rich UX in the Cloudflare dashboard (imagine something like Grafana in the Cloudflare dashboard). Ultimately, we don’t want developers to have to set up their own infrastructure for exploring data captured with Analytics Engine.

Conclusion

Try Workers Analytics Engine today! Please let us know if you have any ideas or more advanced use cases that aren’t supported. We’re discussing everything about the Analytics Engine in our discord channel too – join the conversation!

Identifying content gaps in our documentation

Post Syndicated from Cloudflare original https://blog.cloudflare.com/identifying-content-gaps/

Identifying content gaps in our documentation

Identifying content gaps in our documentation

If you’ve tuned into this blog for long enough, you’ll notice that we’re pretty big on using and stress-testing our own products (“dogfooding”) at Cloudflare.

That applies to our security team, product teams, and – as my colleague Kristian just blogged about – even our documentation team. We’re incredibly excited to be on the Pages platform, both because of the performance and workflow improvements and the opportunity to help the platform develop.

What you probably haven’t heard about is how our docs team uses dogfooding – and data – to improve our documentation.

Dogfooding for docs

As a technical writer, it’s pretty common to do the thing you’re documenting. After all, it’s really hard to write step-by-step instructions if you haven’t been through those steps. It’s also a great opportunity to provide feedback to our product teams.

What’s not as common for a writer, however, is actually using the thing you’re documenting. And it’s totally understandable why. You’re already accountable to your deadlines and product managers, so you might not have the time. You might not have the technical background. And then there’s the whole problem of a real-world use case. If you’re really dedicated, you can set up a personal project… but it’s hard to replicate real-world situations and even harder to simulate real-world motivation.

And that brings me to one of the coolest parts of our docs team. We actually manage the Cloudflare settings for our docs website, developers.cloudflare.com. There’s technical oversight from other teams as needed, but that means we’ve directly been involved in:

When we use our own products, it makes us part of the user journey. We know quite viscerally what it’s like when you accidentally break an internal tool with Bot management… because we’ve done it (and profusely apologized!). We know what it’s like to spend a few hours crafting a Transform Rule and realize that – for a specific use case involving search engine crawlers – we needed a Forwarding Page Rule instead.

Identifying content gaps in our documentation

Using our own products gives us a chance to dogfood our docs as well. We realized that we needed to add a page to the 1.1.1.1 docs because several of us set it up on our home devices and didn’t know whether it was working or not. Same thing with the Cloudflare Tunnel docs. When we use the thing, it’s easier for us to help others use it too.

Data for docs

Beyond our own experience – and even beyond the feedback we get through our open-source content strategy – we also look at quantitative data to identify gaps and potential improvements in our docs.

One of the easiest ways to identify gaps is to look at internal search data. When folks are searching from within our docs, are they leaving to view pages within other Cloudflare content sources (Community, Learning Center, etc.)? And does that page conceptually belong in our docs? We’ve used those two questions to identify and correct several gaps in our documentation, such as new pages on creating subdomain records, Cloudflare Ray IDs, and more.

External search data also informs our content strategy. When folks are coming into Cloudflare content domains, where are they going? And what keywords are they using? Using that data, we noticed some confusion between our newer Bulk Redirects feature and Forwarding Page Rules. Even though both features let you forward URLs – and Bulk Redirects is easier and more flexible – very few searches using “url forwarding” reached the Bulk Redirects page. To address that, we tweaked our keywords and added a section to our Forwarding Page Rules article breaking down the differences between the features.

Though internal and external searches tend to provide the most actionable data, we also look at broader trends in other metrics (pageviews, documentation maintenance cost, support tickets, and more). We can’t use these metrics to exactly “measure success”, because it’s hard to attribute any changes to the quality of our docs. For example, if there’s suddenly a spike in traffic to our DNS docs, does that mean that our docs are doing well? Or maybe we just blogged about a new feature? Or more customers might be onboarding their domains within a specific timeframe?

We can, however, use these metrics to broadly look at our relative effort across different products and adjust priorities accordingly. To use DNS as an example, it’s towards the top in terms of support tickets, but we actually have a comparatively small percentage of our content dedicated towards it. That means that, if we see more opportunities to improve those docs, those opportunities will likely get a higher priority.

Identifying content gaps in our documentation

Conclusion

When we take all these inputs together – the qualitative experience of dogfooding our documentation and our products, the broad outlines of our user-focused content journey, the community feedback from our open-source ecosystem, and the quantitative data points from our analytics – they help us treat our content as a product.

It’s part of what makes this team so fun to be a part of! Speaking of, we’re hiring!