Post Syndicated from Daria Vilkova original https://blog.zabbix.com/setting-up-zabbix-agent-2-for-postgresql-monitoring-and-revealing-how-it-works/13208/
This article will recall the most important theses about the plugin for PostgreSQL monitoring for Zabbix Agent 2. Here you’ll find the explanation of how the plugin works under the hood illustrated with a simple example. You will also get familiar with a new mechanism of custom queries that let you collect metrics from separate SQL files on PC.
Contents
II. Custom metrics (14:05)
III. Conclusion (17:58)
IV. Questions & Answers (19:20)
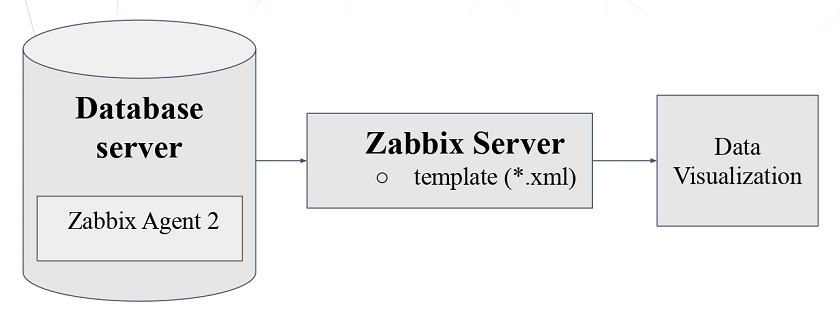
Zabbix Agent plugin
As a rule, Zabbix Agent is installed on the Zabbix Server machine. It gathers data, which is lately collected by the Zabbix Server. The user can have full access to it via the web interface.
Implementation
- The plugin uses github.com/jackc/pgx — PG driver and toolkit for Go to connect to Postgres. The plugin supports the database/sql interface, which is a universal interface in Golang for SQL-like databases. Connections in the upcoming version of these databases are made via this database/sql interface.
- The handler is the basic unit of the plugin, and all queries are executed in separate handlers and then sent to the Zabbix Server. We have made an effort to create an efficient connection to, and to optimize operations of the database.
- Some metrics are generated in JSON and grouped as dependency items and discovery rules.
Basic features
- Zabbix Agent 2 allows for keeping a permanent connection to the PostgreSQL database. In earlier versions, to connect to PostgreSQL, we had to make psql calls affecting the server load.
- Zabbix Agent 2 provides for flexible polling intervals, which can be customized in templates.
- The plugin is compatible with PostgreSQL 10+ and Zabbix Server version 4.4+ and Zabbix Agent.
- In the latest plugin release, a new feature is introduced to allow for monitoring several PostgreSQL instances by one Agent using sessions.
Plugin connection parameters
There are three levels of the plugin connection parameters:
- Global (global for all Zabbix Agent plugins).
- Macros.
- Sessions.
Macros and Sessions parameters are used to define a connection to the database.
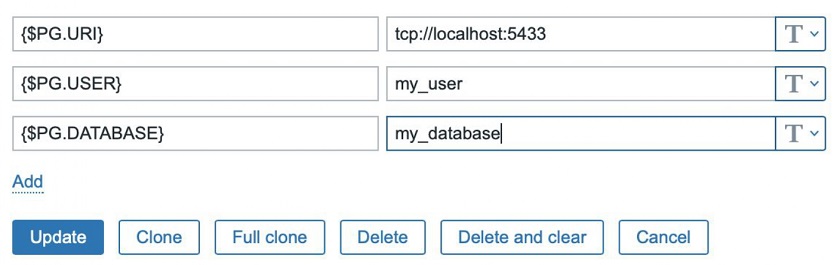
Macros level
Macros should be familiar to all users of the first Zabbix Agent. In the template, we can define macros for the user, database, etc.
Filling in the template
Then we need to fill in the Key definition as a parameter.
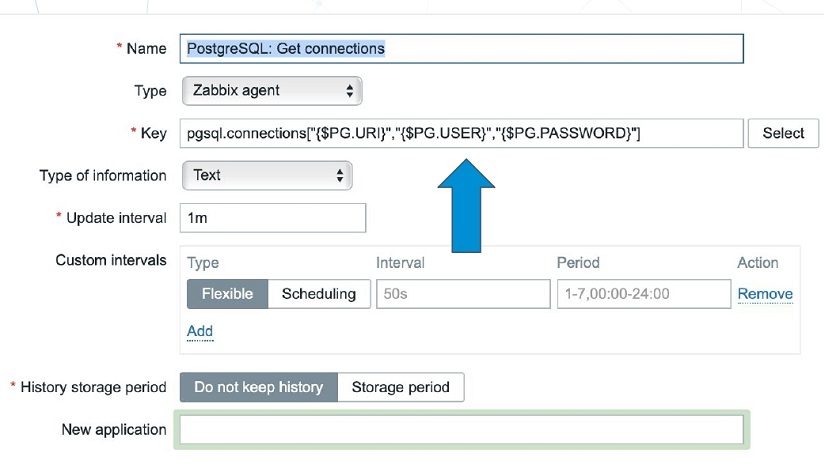
Key definition as a parameter
Here, the sequence is important — URI, USER, and PASSWORD. The first two parameters are mandatory. If no password is given, an empty string is used as a password. If there is no database name, the default database name is used — ‘Postgres‘
NOTE. There may be parameters No. 5, 6, 7, etc., which can be used as parameters for dynamic queries in the handler.
This way to connect to the database is considered as default. In the official template for PostgreSQL monitoring on the Zabbix website, macros and keys are already specified, so the setup can be done in no time.
Sessions level
Each session has its own connection parameters. So, by creating multiple sessions, we can create multiple connections to several databases.
Sessions are defined in the Zabbix Agent configuration file — zabbix_agent2.conf.
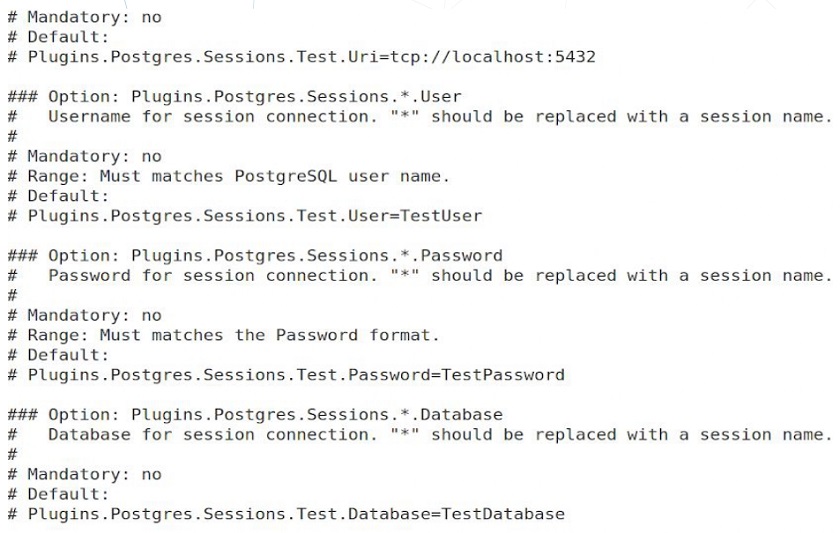
Defining four parameters for session ‘Test’
- To define the session ‘Test’, in the configuration file, you need to go to:
# Plugins.Postgres.Sessions.
- Then, you fill in the name of the session:
# Plugins.Postgres.Sessions.Test.Uri=tcp://localhost:5432
- Then, you do the same for the other three parameters and define macros for the session in the template:
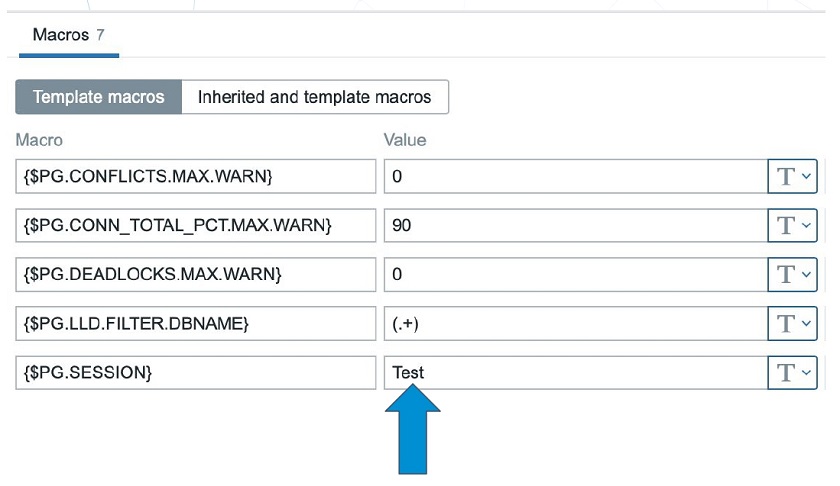
Defining connection parameters and the name of the session in {$PG.SESSION}.
- You need to fill in the session Name as the only parameter for the Key:
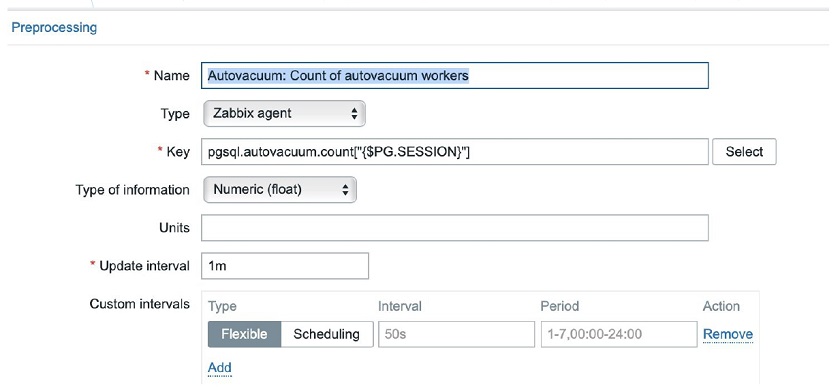
Now the agent will automatically pick up the connection parameters for this session name from the configuration file and start running.
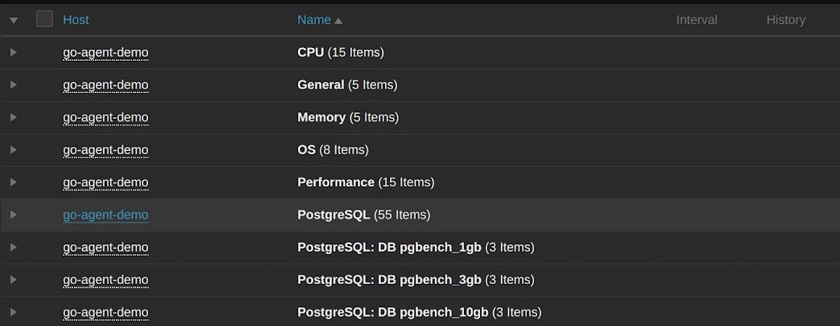
Metrics monitored by the plugin
In the upcoming release, the plugin will be able to gather more than 98 metrics covering almost all the important parameters in the database, including:
- number of connections,
- database size,
- info about archive files,
- number of ‘bloating’ tables,
- replication status,
- background writer processes activity, etc.
Some of these metrics are not very informative without the operating system parameters. However, Zabbix Agent 2 can already gather all these metrics using the operational system plugin. In zabbix.connect, we have all the needed templates to get a full picture of the database health.
How to get a simple metric?
1. Create a handler (file) to get a new metric, for instance, the uptime metric: — zabbix/src/go/plugins/postgres/handler_uptime.go.
NOTE. The handler definitions for the current and the upcoming version are available in the article on the PostgreSQL monitoring plugin.
2. Import package to work with Postgres and specify the unique key for the new metric:
package postgres
const (
keyPostgresUptime = "pgsql.uptime"
)
3. Find the handler with the following query:
func uptimeHandler(ctx context.Context, conn PostgresClient, _ string, _
map[string]string, _ ...string) (interface{}, error) {
var uptime float64
query := `SELECT date_part('epoch', now() - pg_postmaster_start_time());
4. Define the variable, which will hold the result.
NOTE. The matching between the Golang variables and the Postgres variables can be found on the pgx documentation page.
5. Define the query for the new metric:
row, err := conn.QueryRow(ctx, query)
if err != nil {
...
}
err = row.Scan(&uptime)
if err != nil {
...
}
return uptime, nil
Here, we:
- perform the query,
- check if there are any errors,
- scan the results for the Golang variable,
- scan for errors again, and
- finally, return the results.
6. Register the key of your new metric in metrics.go:
var metrics = metric.MetricSet{
....,
keyPostgresUptime: metric.New("Returns uptime.",
[]*metric.Param{paramURI, paramUsername,
paramPassword,paramDatabase}, false),
}
In the metrics variable, all the metrics in the plugin are defined. Here, we need to add the description of the new metric.
Now, we need to recompile the agent and start it running as we’ll have all the new metrics on board.
Custom metrics
In the upcoming version, the agent will be able to execute queries in separate sql files located on your local machine and return the result to the Zabbix Server alongside the default metrics. To create the sql file with the query:
- in zabbix_agent2.conf, specify the path to the directory with the sql files named Plugins.Postgres.CustomQueriesPath.
- in the template, provide the name for the sql file as the 5th parameter for the new key — pgsql.query.custom and specify the additional parameters for this query if needed.
Custom metric example
1. Let’s consider a simple table containing three rows.
- # CREATE table example (phrase text, year int );
- # SELECT * FROM example;

2. I have created two files retrieving data from this table:
- $touch custom2.sql.
— $echo “SELECT * FROM example;” > custom2.sql. - $touch custom1.sql.
— $echo “SELECT phrase FROM example WHERE year=$1;” > custom1.sql.
In the first file, no parameters are required, while the ‘WHERE’ statements is specified in the second file, so we’ll need one additional parameter.
3. I have added the path to the sql files in zabbix_agent2.conf:
Plugins.Postgres.CustomQueriesPath=/path/to/file
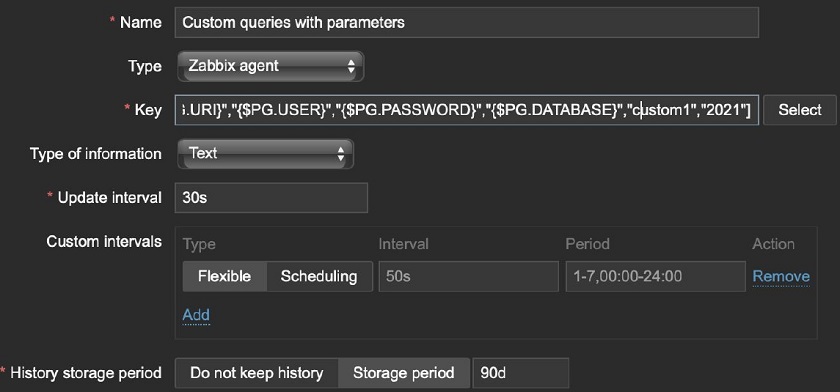
4. In the templates, I need to create the key — pgsql.query.custom. Here, the first four parameters are connection parameters, and the name of the file containing the query is defined as the parameter (in this case, custom2).

Then, it is necessary to do the same for the second file. However, the second query requires some additional parameters. These parameters are specified as parameter 6. Here, for the custom1 file, the ‘2021’ parameter will be used for the query.
After these two keys are created, Zabbix Agent will automatically find them, execute them, and soon the results will appear in the Latest data.

The result for each query appears in text format
As the first one starts in 2020 and the second one — in 2021, the parameter has been used for the second key.
Conclusion
The new version of the plugin with custom metrics will hopefully become available with the next Zabbix Server release.
Useful links
- Zabbix Git — Postgres monitoring plugin source code (with all keys and queries for the current version in the readme file):
https://git.zabbix.com/projects/ZBX/repos/zabbix/browse/src/go/plugins/postgres. - Official template of the PostgreSQL plugin:
https://www.zabbix.com/ru/integrations/postgresql#tab:official2. - Article on PostgreSQL monitoring plugin with tips and code example for the current plugin version: https://postgrespro.com/blog/pgsql/5967895.
Questions & Answers
Question. What is the point of specifying the database name in that key? Are any metrics stored there? Should we create a separate database for Zabbix?
Answer. You can use the Postgres default database, but it is recommended to create a separate database as it is more secure to get monitoring metrics from a separate database.
Question. Does the Zabbix user both in the OS and in the database need any special permissions to get this going?
Answer. Two permissions should be defined. These permissions are specified in the instruction for the PostrgeSQL monitoring plugin for Zabbix.
Question. Will Zabbix work independently of the pg_stat_statements module?
Answer. It gathers some data from the pg_stat_statements module. Without this module installed, we will not be able to get some crucial metrics from it, though the module itself will be running.
Question. Can the plugin work in the passive mode or in the active mode only?
Answer. The plugin is working similar to the Zabbix Agent — it pushes the data.
Question. Does this Postgres plugin work automatically against the Zabbix backend if we use Postgres as Zabbix backend?
Answer. If you use Agent 2 with this plugin, then it will work out of the box though you’ll have to apply templates and create items, etc. Otherwise, you’ll have to update it.
Question. What is the advantage of using the plugin over Zabbix user parameters, which are custom scripts that the agent can execute?
Answer. If you use user parameters, connections to Postgres are established through psql calls. This can create additional server load. The plugin establishes a permanent connection entailing fewer overheads.